

Abstract
Abstract
This study was designed to study the impact of menopause on voice quality. Cross-sectional Observational study with a total of 100 subjects. All subjects underwent biochemical analysis which included thyroid function tests, estrogen levels, progesterone levels and underwent voice analysis using the VAUGHMI voice analyser software. 50 postmenopausal females as cases and 50 premenopausal females as controls were taken for the study. The females were of the age group 35–55 yrs in order to remove age as confounding factor. The primary outcome measure was Total score, calculated based on harshness, hoarseness and breathiness. The postmenopausal females had a poorer voice quality than the premenopausal females (Total score 1.62 vs 2.48, p < 0.001). There was a significant difference between the fundamental frequency and pitch and perturbation in frequency of the postmenopausal females as compared to premenopausal females. The difference in the perturbation in the intensity of the voice was not significant. No linear correlation could be established between the voice quality and oestrogen or progesterone levels but the intergroup variation of the two parameters was significant. The premenopausal females have better voice quality than postmenopausal females. The relationship between hormonal level and voice quality couldn’t be established. Further studies are required to assess the relation of hormone levels & voice quality with the possibility of exploring voice cosmesis.
Level of Evidence
Level 3.
Keywords: Gender and voice, Menopause and voice, Hormone, Larynx
Introduction
Human voice is a tele-introducer of one’s personality. Since time immemorial it has intrigued the very basic psyche of the thinkers and philosophers. The difference in the nature and quality of voice between two genders and between the same individual at different stages of life has been a matter of even more curiosity.The hormones play a vital role in this. It has been observed that the larynx is also affected by hormonal changes as is clearly seen in the difference between male and female voices, or when teenage voice changing during puberty. It is believed that the number of hormonal receptors in the pre-pubertal phase is higher than in any other age [1]. Voice is known to change from birth to old age most significantly between birth and puberty, and in old age due to vocal fold changes, some of which are: shortening of the membranous vocal fold (VF) in males, thickening of the VF mucosa and cover in females, and development of oedema in the superficial lamina propria layer in both sexes [2]. Gender related differences were due to the hormone receptors present in the VF. The presence of androgen, oestrogen and progesterone receptors in epithelial cells, glandular cells and fibroblasts of VF suggested that structural changes seen in the VF could be due to hormonal influences [3]. A connection between hormone levels, and extracellular matrix distribution in VF depending on age and gender could be made [4]. Hence, it was planned to study voice quality in post menopausal females and to establish whether there is a direct causal relationship of hormone levels with voice quality or not.
Material and Methods
This study case control study was carried out in 100 subjects in the institute (name blinded for review) after taking approval from institutional ethics committee. The cases were 50 post- menopausal females who have one year elapse time since cessation of menstruation in the age group of 35–55 years. The controls were 50 pre menopausal subjects selected in same age group with regular menstrual cycles in ovulatory phase during the time of biochemical and voice analysis. The subjects selected were the relatives accompanying the patients to the hospital, after taking their due consent.
Any subjects with any laryngeal pathology, any history of voice abuse e.g. Teachers, Singers, Hawkers etc., history of smoking, women on hormone replacement therapy, women on oral contraceptive pills, subjects using steroids systemically or topically, pregnant women, subjects with hypothyroidism or hyperthyroidism, previous history of irradiation or with any evidence of pathology in upper aero digestive tract were excluded.
After obtaining a written informed consent from the subjects, the following pattern of examination was followed.
Detailed history to rule out any systemic or local illness
General physical and systemic examination
Indirect laryngoscopy to rule out local pathology
Voice analysis
Biochemical analysis
For accurate measurements of the acoustic measures across the range of vocal frequencies and intensities, a high definition microphone was used. The recording system was calibrated and the microphone-to mouth distance was kept constant at 30 cm. The microphone was boom-mounted. The amplified electrical signal was then recorded directly to hard disk and VAUGHMI voice analyser software was used for voice analysis.
- The parameters analysed were:
- Fundamental frequency (Hz)
- Maximum phonation time
- Pitch (Hz)
- Jitter (RAP) in %
- Shimmer (%)
- H/N Ratio
- S/Z Ratio
- The Quality of voice was assessed on the following parameters
- Harshness
- Hoarseness
- Breathiness
The peripheral venous blood (3 ml) samples were collected from premenopausal and postmenopausal females. The blood samples from premenopausal females were collected during on the 12–14th day of the menstrual cycle. All the samples collected were the morning fasting sample. Serum was separated by centrifugation within 6 h and stored at – 80 °C till they were analysed. The stored serum was then analysed by “Fully automated immunoassay analyser” COBAS e 411 based on the principle of electrochemiluminiscence (ECL). The analysis was done for estradiol, progesterone II, FT3, FT4, and TSH.
The results were analyzed on the basis of the Total Scores obtained according to the objective voice analysis comparing the 2 groups for correlation between voice quality and effect of hormones depending on the menopausal status.
Calculation of total score is shown in Table 1. The SPSS version 17 was used for statistical analysis of results.
Table 1.
Calculation of total score
| Quality of voice | Normal | Mild | Moderate | Severe |
|---|---|---|---|---|
| Hoarseness | 0 | 1 | 2 | 3 |
| Harshness | 0 | 1 | 2 | 3 |
| Breathiness | 0 | 1 | 2 | 3 |
Observation and Results
Age Distribution
The maximum number of subjects are belonging to the age group 46–55 yrs in toto. Maximum number of subjects in the control group belonging to the age group 36–55 yrs while that in the test group are belonging to the age group 46–55 yrs. The minimum age was 35 yrs in the control group and in test group it was 44 yrs. The overall mean age group was 46.32 yrs. Shown in Table 2 and Fig. 1.
Table 2.
Age distribution
| Age group | Total | |||||
|---|---|---|---|---|---|---|
| ≤ 35 | 36–45 | 46–55 | ||||
| Group | Test | Count | 0 | 2 | 48 | 50 |
| % within GROUP | .0% | 4.0% | 96.0% | 100.0% | ||
| Control | Count | 6 | 35 | 9 | 50 | |
| % within GROUP | 12.0% | 70.0% | 18.0% | 100.0% | ||
| Total | Count | 6 | 37 | 57 | 100 | |
| % within Group | 6.0% | 37.0% | 57.0% | 100.0% |
Fig. 1.
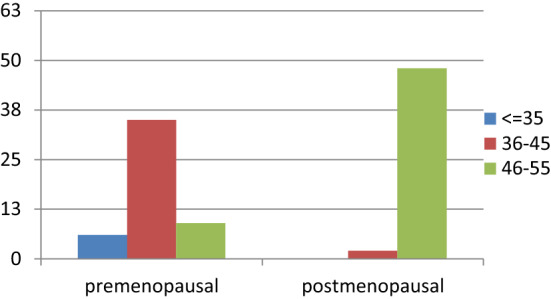
Age distribution chart
Biochemical Parameters
The mean level of oestrogen among the cases was 28.366 pg/ml and that among the controls was 292.75 pg/ml. The difference was found to be highly significant with a p value of < 0.001 and similarly it was observed that the mean progesterone levels in the test group was 0.988 ng/ml while that in control group was 11.49 ng/ml with a significant p value of < 0.001. Shown in Table 3
Table 3.
Biochemical parameters
| Estrogen | Mean (pg/ml) | Max (pg/ml) | Min (pg/ml) |
|---|---|---|---|
| Premenopausal | 292.75 | 335.87 | 28.65 |
| Postmenopausal | 28.366 | 43.95 | 16.74 |
| Progesterone | Mean (ng/ml) | Max (ng/ml) | Min (ng/ml) |
|---|---|---|---|
| Premenopausal | 11.49 | 17.240 | 6.35 |
| Postmenopausal | 0.988 | 1.940 | 0.423 |
Voice Parameters
In our study, there was a statistically significant difference between premenopausal and postmenopausal women in almost all voice parameters like Fundamental frequency, Jitter, HNR and SNR. The quality of voice was assessed by hoarseness, harshness and breathiness, out of which the difference in breathiness was only statistically significant in premenopausal and postmenopausal women. The total score, a sum of these three parameters and inversely related to voice quality was significantly lower in premenopausal women thereby indicating a poorer voice quality in postmenopausal women. Shown Table 4
Table 4.
Voice parameters
| Mean | Max | Min | p-Value | |
|---|---|---|---|---|
| Fundamental frequency | ||||
| Premenopausal | 213.33 | 304.36 | 190.78 | 0.047 |
| Postmenopausal | 178.45 | 194.11 | 100.62 | |
| Jitter | ||||
| Premenopausal | 0.3082 | 2.47 | 0.14 | 0.047 |
| Postmenopausal | 0.3424 | 1.87 | 0.13 | |
| Shimmer | ||||
| Premenopausal | 2.47 | 8.4 | 1.5 | 0.175 |
| Postmenopausal | 2.648 | 8.8 | 0.5 | |
| HNR | ||||
| Premenopausal | 21.5474 | 27.76 | 9.73 | 0.020 |
| Postmenopausal | 21.028 | 27.02 | 13.21 | |
| SNR | ||||
| Premenopausal | 21.028 | 27.02 | 13.21 | 0.017 |
| Postmenopausal | 20.322 | 26.45 | 9.38 | |
| Hoarseness | ||||
| Premenopausal | 0.52 | 3 | 0 | 0.16 |
| Postmenopausal | 0.80 | 3 | 0 | |
| Harshness | ||||
| Premenopausal | 0.64 | 3 | 0 | 0.118 |
| Postmenopausal | 0.78 | 3 | 0 | |
| Breathiness | ||||
| Premenopausal | 0.46 | 3 | 0 | < 0.001 |
| Postmenopausal | 0.90 | 3 | 0 | |
| Total Score | ||||
| Premenopausal | 1.62 | 9 | 0 | < 0.001 |
| Postmenopausal | 2.48 | 9 | 0 |
Bold indicates p < 0.05 significant
Discussion
The female voice evolves from childhood to menopause under the varied influences of oestrogen, progesterone and testosterone. The most drastic changes in the female voice occur during menopause, when the estrogen and progesterone levels fall. In the period immediately after the start of menopause, the levels of FSH and LH is very high, continuing to cause ovarian androgen production. Usually, these ovarian steroids are converted to oestrogen, especially in women with more peripheral fat stores. Women have excessive peripheral fat prior to menopause, allowing more conversion of androgens to oestrogens, preserving the effects of oestrogen on the body.[5].
Along with hormonal changes after menopause, effects of ageing also become evident after menopause. Laryngeal muscles decrease in size, cartilages harden and eventually may ossify, vocal folds become thicker, and collagenous fibres decrease in quantity leading to an overall stiffening of the vocal apparatus. The changes of ageing may be difficult to distinguish from potentially treatable hormonal changes caused by menopause [5].
A study published in 2017 was designed to investigate changes in sexually dimorphic vocal characteristics and quality of women’s voices indifferent phases of the cycle and to compare these with users of monophasic hormonal contraception. Voice samples of 44 naturally cycling women were obtained in the menstrual, late follicular and luteal phases, and in 20 hormonal contraceptive users across equivalent stages of the monthly cycle. Results showed that voices of naturally cycling women had higher minimum pitch in the late follicular phase compare with other phases. In addition, voice intensity was at its lowest in the luteal phase. Comparison between the two groups of women revealed that the naturally cycling group had higher minimum pitch in the fertile phase and higher harmonic to noise ratio in the menstrual phase [6].
A study by Raj et al., published in 2010 concluded that the voice quality is best in the ovulatory phase of the menstrual cycle. The study was conducted upon 55 subjects (35 premenopausal and 20 post menopausal). The voice of premenopausal females was studied in different phases of the menstrual cycle and it was found that the voice quality was best during the ovulatory phase of the cycle [7].
In the literature, the most reported acoustic change after menopause is lowering of the fundamental frequency (F0) in continuous speech and in an isolated vowel [8]. Jitter is a parameter which shows the aperiodicity in the vocal fold vibrations. The normative data for jitter in our study is less than 1%. A value higher than this suggests that something is interfering in the normal vocal fold vibration and the mucosal wave. The study by Raj et al [7] showed an increase in jitter to 3.51% in postmenopausal females because of an increase in F0.The variation or perturbation in intensity of the waveform is known as shimmer.
The normative data of shimmer in our study was 3.0% and a value more than this suggested a deviation of intensity from the normal sound being produced.
When harmonic to noise ratio was calculated the difference was statistically significant with a p value of 0.02 signifying a higher noises component in the postmenopausal females attributable to increased number of breaks which occurred when the subject was asked to phonate. Similarly in the study conducted by D’Haseleer et al [9] the noise to harmonic ratio was measured and it was found to be 0.11 in premenopausal females and 0.12 in postmenopausal females signifying more harmonic than noise in premenopausal than postmenopausal females.
On analysing the voice of premenopausal and postmenopausal females it was found that the SNR in the premenopausal group was 21.028 while that in the premenopausal group was 20.322 clearly indicating the the noise component in the voice of the postmenopausal females was higher than that in the postmenopausal females. The difference was also statistically significant with a p value of 0.017.1
The MPT of postmenopausal females showed a definite and statistically significant difference (p < 0.001) over that of premenopausal females in our study. The premenopausal females had a mean MPT value of 20.68 while the postmenopausal females had a value of 17.76. But it must be borne in mind that any abnormal finding has to be confirmed by laryngoscopic assessment as it is a relatively less reliable parameter.
S/Z ratio is another objective parameter for the assessment of the glottal competence [10, 11]. It is a better indicator than MPT in voice or laryngeal assessment but it has also got a wide range of normal values making it a relatively less sensitive and reliable test than other tests available.
Our analysis showed that S/Z ratio in postmenopausal females was 1.286 and that in premenopausal females was 1.142 and the result is in accordance with the study of Raj et al [7] which showed a statistically significant difference between the two groups.
Another study by D’haeseleer (2012) on effect of menopause and hormone therapy on voice and nasal resonance showed that (without hormonal influences) middle aged premenopausal women show a smaller frequency and intensity range and a lower fundamental frequency of the voice compared to young women. To investigate the impact of menopause on voice and nasal resonance, a cross sectional non randomised study design was used. Vocal characteristics and nasal resonance in premenopausal and post menopausal women without hormone therapy were compared. Post menopausal women without hormone therapy showed a significantly lower speaking fundamental frequency and were able to phonate lower as compared to post menopausal women with hormone therapy [12].
Not many studies have been conducted to objectively score the overall quality of voice in postmenopausal females and there is an evident paucity of literature in this regard. Current study observed the three scored parameters separately and in totality.
The sum of these three parameters gives us the overall objective score of the quality of voice, the best score being zero (i.e. 0 hoarseness, 0 harshness and 0 breathiness), while the worst being 9 (i.e. grade 3 hoarseness, harshness and breathiness).
Since our human mind does not assess voice quality by separately assessing its harshness and breathiness, it becomes imperative to summate the scores of the three hoarseness parameters for every individual to get a total score. This total score is the parameter which can give us an approximate idea as to how the unpredictable human mind will assess the given sound. Shown in Table 5
Table 5.
Grade wise distribution of TS in cases and controls
| Total Score | Total | ||||||||||||
|---|---|---|---|---|---|---|---|---|---|---|---|---|---|
| 0 | 1 | 2 | 3 | 4 | 5 | 6 | 7 | 8 | 9 | ||||
| Group | Test | Count | 4 | 10 | 10 | 20 | 2 | 1 | 2 | 0 | 0 | 1 | 50 |
| % | 8% | 20% | 20% | 40% | 4% | 2% | 4% | 0% | 0% | 2% | 100% | ||
| Control | Count | 22 | 3 | 17 | 1 | 4 | 0 | 0 | 1 | 0 | 2 | 50 | |
| % | 44% | 6% | 34% | 2% | 8% | 0% | 0% | 2% | 0% | 4% | 100% | ||
| Total | Count | 26 | 13 | 27 | 21 | 6 | 1 | 2 | 1 | 0 | 3 | 100 | |
| % | 26% | 13% | 27% | 21% | 6% | 1% | 2% | 1% | 0% | 3% | 100% | ||
Total score signifies the quality of voice. Higher the total score, poorer the quality of voice. 27% of the total no of subjects had a grade 2 TS. 44% of the subjects in the control group had grade 0 TS while 40% of the cases had grade 3 TS, highest in their respective groups. Only 2% of subjects in the control group had grade 3 TS while only 8% of cases had grade 0 TS. Both the groups had 9 and 0 as their maximum and minimum value of total score. The mean of the total score for the controls was 1.62 while for the cases it was 2.48 and the result is statistically highly significant with a p value of < 0.001.
A recent study published in 2018 supports our findings and even takes them a step forward. This study aimed to investigate the effect of hormonal therapy on voice in a group of menopausal women, taking into consideration body mass index as a confounding factor and its potential role as a substitute for hormone replacement therapy. A total of 53 women, 34 not on hormone replacement therapy and 19 on hormone replacement therapy were recruited. Acoustic analysis was performed and Voice Handicap Index-10 was also completed. There was no statistical difference in the Voice Handicap Index-10 in both the groups. However, menopausal women not on HRT had significantly lower habitual pitch than those on HRT. On the other hand, jitter was significantly higher in those on HRT [13].
Another study conducted in 2016, studied the effect of testosterone, delivered by subcutaneous implants on the female voice. Ten women who had opted for testosterone therapy were recruited for voice analysis. Voices were recorded prior to treatment and at 3 months, 6 months and 12 months while on testosterone therapy. There was no significant difference in the average fundamental frequency (sentence, paragraph, conversation) between the pre treatment group and post treatment group at 3 and 12 months. There was an increase in sentence speech fundamental frequency at 6 months. Two of three patients with lower than expected fundamental frequency at baseline improved on testosterone therapy [14].
Another study was conducted in 2013 to investigate the speaking fundamental frequency in pre menopausal and post menopausal women with and without hormone therapy and with low and high body mass index. A significantly lower speaking fundamental frequency of the voice was found in post menopausal women without hormone therapy and with low BMI. The study suggested that menopause lowers the voice with approximately 14 Hz and that hormone therapy and adipose tissue might counteract the menopausal drop in speaking fundamental frequency [15].
Conclusion
Our study gives us a clear understanding of the fact that the overall voice quality of the postmenopausal females was poorer as compared to the premenopausal females with a significant difference in the total Score. There was no clear cut linear correlation between the voice quality and oestrogen or progesterone levels.
Although a few studies have been conducted recently to study the effects of various hormones on female voice, this field of research is still in a nascent phase. Further studies are needed to know if hormone replacement therapy in postmenopausal females can help to improve the voice quality. There is the need to conduct similar study in a prospective manner taking the same set of subjects as pre and post menopausal. These findings will help in the better understanding of voice and further the role of voice cosmesis.
Funding
The study was conducted at Maulana Azad Medical College, Delhi University, New Delhi as part of Post graduate academic programme.
Declarations
Conflict of interest
The author(s) declare that they have no competing interests.
Ethical Approval
Ethical clearance taken from institutional ethics committee, Delhi University.
Footnotes
Publisher's Note
Springer Nature remains neutral with regard to jurisdictional claims in published maps and institutional affiliations.
References
- 1.Rios OA, Duprat Ade C, Santos AR. Immunohistochemical searching for estrogen and progesterone receptors in women vocal fold epithelia. Braz J Otorhinolaryngol. 2008;74:487–493. doi: 10.1016/S1808-8694(15)30593-0. [DOI] [PMC free article] [PubMed] [Google Scholar]
- 2.Hirano M, Kurita S, Sakaguchi S. Ageing of the vibratory tissue of human vocal folds. Acta Otolaryngol. 1989;107:428–433. doi: 10.3109/00016488909127535. [DOI] [PubMed] [Google Scholar]
- 3.Newman SR, Butler J, Hammond EH, Gray SD. Preliminary report on hormone receptors in the human vocal fold. J Voice. 2004;14:72–81. doi: 10.1016/S0892-1997(00)80096-X. [DOI] [PubMed] [Google Scholar]
- 4.Bentley JP, Brenner RM, Linstedt AD, et al. Increased hyaluronate and collagen biosynthesis and fibroblast estrogen receptors in macaque sex skin. J Invest Dermatol. 1986;87(5):668–673. doi: 10.1111/1523-1747.ep12456427. [DOI] [PubMed] [Google Scholar]
- 5.Kadakia S, Carlson D, Sataloff RT. The effect of hormones on the voice. J sing. 2013;69:571–574. [Google Scholar]
- 6.Pavela Banai I. Voice in different phases of menstrual cycle among naturally cycling women and users of hormonal contraceptives. PLoS ONE. 2017;12(8):e0183462. doi: 10.1371/journal.pone.0183462. [DOI] [PMC free article] [PubMed] [Google Scholar]
- 7.Raj A, Gupta B, Chowdhury A, et al. A study in various phases of menstrual cycle and in postmenopausal women. J Voice. 2010;24:363–368. doi: 10.1016/j.jvoice.2008.10.005. [DOI] [PubMed] [Google Scholar]
- 8.Meurer EA, Wender MCO, Von Eye CH, Capp E. Female suprasegmental speech parameters in reproductive age and postmenopause. Maturitas. 2004;48(1):71–77. doi: 10.1016/j.maturitas.2003.12.005. [DOI] [PubMed] [Google Scholar]
- 9.D’haeseleer E, Depypere H, Claeys S, et al. The impact of the menopause on vocal quality. Menopause. 2011;18:267–272. doi: 10.1097/gme.0b013e3181f3ee36. [DOI] [PubMed] [Google Scholar]
- 10.Boone DR, McFarlane SC (1998) The voice and voice therapy. 6Th ed. Needham Heights, Massachusetts: Allyn and Bacon
- 11.Addington DW. The relationship of selected vocal characteristics to personality perception. Speech Monogr. 1968;35:429–434. [Google Scholar]
- 12.D’haeseleer E, Van Lierde K, Claeys S, Depypere H. The impact of menopause and hormone therapy on voice and nasal resonance. Facts Views Vis Obgyn. 2012;4(1):38–41. [PMC free article] [PubMed] [Google Scholar]
- 13.Hamdan AL, Tabet G, Fakhri G, Sarieddine D, Btaiche R, Seoud M. Effect of hormone replacement therapy on voice. J Voice. 2018;32(1):116–121. doi: 10.1016/j.jvoice.2017.02.019. [DOI] [PubMed] [Google Scholar]
- 14.Glaser R, York A, Dmitrakakis C. Effect of testosterone therapy on female voice. Climacteric. 2016;19(2):198–203. doi: 10.3109/13697137.2015.1136925. [DOI] [PMC free article] [PubMed] [Google Scholar]
- 15.D’haeseleer E, Depypere H, Van Lierde K. Comparison of speaking fundamental frequency between premenopausal and post menopausal women with and without hormone therapy. Folia Phoniatr Logop 2 [DOI] [PubMed]