

Summary
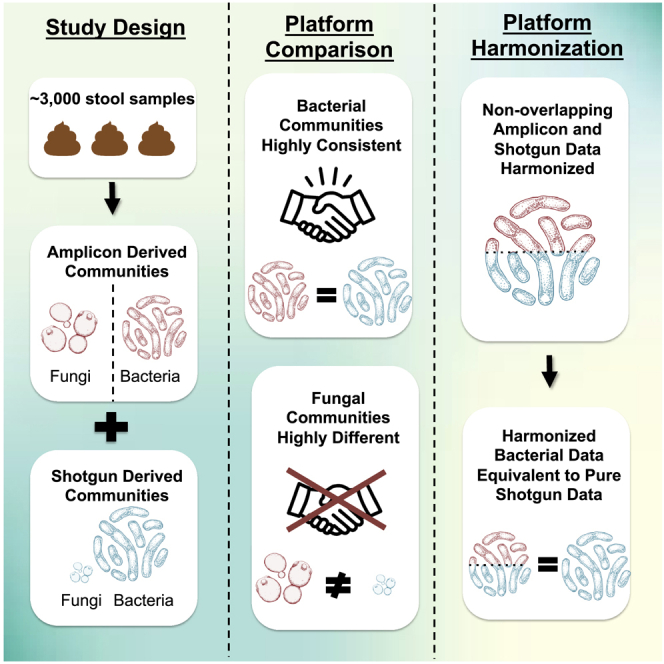
In a large cohort of 1,772 participants from the Hispanic Community Health Study/Study of Latinos with overlapping 16SV4 rRNA gene (bacterial amplicon), ITS1 (fungal amplicon), and shotgun sequencing data, we demonstrate that 16SV4 amplicon sequencing and shotgun metagenomics offer the same level of taxonomic accuracy for bacteria at the genus level even at shallow sequencing depths. In contrast, for fungal taxa, we did not observe meaningful agreements between shotgun and ITS1 amplicon results. Finally, we show that amplicon and shotgun data can be harmonized and pooled to yield larger microbiome datasets with excellent agreement (<1% effect size variance across three independent outcomes) using pooled amplicon/shotgun data compared to pure shotgun metagenomic analysis. Thus, there are multiple approaches to study the microbiome in epidemiological studies, and we provide a demonstration of a powerful pooling approach that will allow researchers to leverage the massive amount of amplicon sequencing data generated over the last two decades.
Keywords: amplicon, shotgun, metagenomic, harmonization, meta-analysis, epidemiology, HCHS/SOL, fungi, 16S rrna, ITS1
Graphical abstract
Highlights
-
•
Bacterial profiles between amplicon and shotgun platforms agree at genus level
-
•
Fungal profiles strongly differ between amplicon and shotgun platforms
-
•
Bacterial data can be harmonized across amplicon and shotgun platforms
Motivation
The use of amplicon to profile microbial communities has generated tens of thousands of datasets correlating bacterial perturbations to health and disease, but as research inches toward more complex analyses using shotgun metagenomics, it is not clear how comparable these new datasets are with the amplicon-based findings. To answer this, we utilize a large cohort with available 16S rRNA, ITS1, and shotgun metagenomics data and demonstrate that not only are the data generated comparable at genus level, but they can in fact be pooled into hybrid sets capable of generating results that are indistinguishable from those generated from using exclusively shotgun sequencing, opening the door to large meta- and pooled analysis using the tremendous wealth of data available through 16S rRNA sequencing.
Thousands of microbial datasets have been generated using amplicon sequencing, but the extent of consistency between these and emerging shotgun metagenomics datasets is unclear. Usyk et al. show that the two platforms are consistent for bacteria, but not fungi, and present how these data can be pooled for harmonized analysis.
Introduction
Utilization of the 16S rRNA gene as a target for bacterial taxonomic profiling, combined with next-generation sequencing (NGS), caused a paradigm shift in the field of microbial epidemiology.1 It did so by facilitating a truly scalable, high-throughput, and culture-free approach for characterizing the human microbiome.2 This shift resulted in a multitude of studies being published on the topic of human health and the microbiome, and nearly a billion dollars’ worth of National Institute of Health (NIH) funding going directly toward such studies in the last decade.3 The impact of this effort resulted in the microbiome entering mainstream medical and population-level science, with investigators discovering possible links of the microbiome with common conditions such as obesity,4 diabetes,5 brain function, and neurological diseases,6 as well as links with cancer development, progression, and treatment.7
Despite the ease and profound impact of 16S rRNA gene amplicon (16S) sequencing, as the field advances, more nuanced information regarding the human microbiome should facilitate new and sophisticated analyses. Amplicon sequencing builds upon the conserved phylogenetic relationships of bacterial/archaeal 16S ribosomal genes for taxonomic assignment at the genus level, although in some cases, resolution to species can be obtained.8 This is based on several approaches recently developed to allow for single-nucleotide level resolution within these regions.9,10 In addition, functional properties of the microbiome based on 16S sequencing have been developed using algorithms such as PICRUSt11,12 that impute functional groups based on overall properties of linked bacteria.
Shotgun metagenomic characterization of a microbial community is an alternative approach based on constructing a random sample of the total DNA in a specimen and performing deep sequencing. This allows for potentially detecting all DNA genomes that are present in a sample based on depth of sequencing. However, limitations of shotgun metagenomics are cost and laboratory and bioinformatic technical requirements. Whereas a typical 16S amplicon sequencing study can provide reproducible results with as few as a couple thousand reads (sequenced fragments of DNA) per sample, shotgun sequencing has traditionally necessitated millions to tens of millions of high-quality sequence reads.13,14,15 In addition to technical aspects of DNA shearing, library construction, and bioinformatics pipelines, there is a considerable per-sample sequencing cost that limits the adaptation of this method. The recently proposed approach of “shallow” shotgun metagenomics may overcome the sequencing cost barrier, by allowing direct measurement of the functional potential of the metagenome, as well as species-level characterization of microbes, with sequencing depths as low as 500,000 reads per sample.16 Nevertheless, given the large number of epidemiological studies that have employed 16S amplicon sequencing and/or shotgun metagenomics, it is critical to appraise the strengths, differences, and complementary nature of these methods to allow comparison between studies and utilization of the most appropriate techniques.
Here, we utilize the large multi-center Hispanic Community Health Study/Study of Latinos (HCHS/SOL) cohort, with overlapping 16S V4 region (16SV4), ITS1 gene amplicon (ITS1) and shotgun metagenomic sequence data on >1,500 participants, to comprehensively evaluate the utility of these methods in cohort studies. The SOL cohort is composed of approximately 13% US-born individuals, and the remainder having immigrated to the US between adolescence (<18 years) and adulthood. We analyze the consistency of taxonomic resolution of bacteria and fungi between shotgun sequencing and amplicon-based approaches. Lastly, we show, using a release candidate Greengenes2 database, that 16S and shotgun datasets can be pooled within a common taxonomy and phylogeny for meta-analyses and/or to conduct larger epidemiologic studies. This report provides a framework for the use of amplicon and/or shotgun metagenomic sequencing approaches for incorporation of microbiome data into epidemiological studies.
Results
Cohort and data overview
The overall plan for the processing and analysis of stool samples from the Gut Origins of Latino Diabetes (GOLD) cohort study is presented in Figure 1 (see STAR Methods for in-depth description). Amplicon (16SV4 and ITS1) and shotgun metagenomic sequencing data were available for 1,772 baseline fecal samples (study population described previously17). 16SV4 rRNA gene analysis using the vsearch18 pipeline resulted in a median (SD) of 24,980 (11,022) classified reads per sample (mean [SD] of 94.4% [2.9%] of all reads classified as bacterial); whereas, ITS1 DADA2 pipeline yielded a median depth of 1,103 (42,680) reads per sample (mean [SD] of 93.1% [14.6%] of all reads classified as fungal). Shotgun metagenomic recovery varied significantly by the database used (i.e., RefSeq Rep20019,20,21 or the Web of Life [WolR1]22 databases), but not by the bioinformatic pipelines employed for the analyses (i.e., SHOGUN16 and Woltka23 pipelines for taxonomic classification) (Figure 2A). SHOGUN and Woltka pipelines were utilized because they are optimized for use with shallow sequencing depths (∼500,000 shotgun reads per sample).16 The Woltka-WolR1 pipeline-database combination recovered the most reads, with a median (SD) of 698,402 (489,738) reads per sample, while the SHOGUN-Rep200 combination recovered the least reads, with a median (SD) of 615,284 (483,037) reads per sample (p < 0.0001 for all cross-database comparisons; p ≥ 0.98 for cross-pipeline read recovery comparisons, Figure 2A). The overall classification rate for shotgun reads was comparable across all pipeline-database combinations with a mean (SD) percentage for classified (non-human) reads being 90.3% (15.4%).
Figure 1.

Schematic of the GOLD amplicon/shotgun analytic plan
Overview of the analyses employed in this study; also see STAR Methods section. A total of 3,297 fecal samples (from unique individuals) were available for microbiome analyses. Of those, 1,772 were sequenced as part of the original GOLD set using 16S rRNA and ITS1 amplicon sequencing. The original 1,772 samples and an additional set of 1,525 samples were analyzed using shotgun metagenomics in 2020. This batch was used for the pooled metagenomic analysis.
Figure 2.

Characteristics of shotgun metagenomics and amplicon sequencing analyses
(A) Figure shows the non-host metagenomic read recovery for each of the four pipeline-database combinations used to classify the shotgun metagenomics reads. Table below (A) indicates the mean, median, and SD of the read recovery with the indicated pipeline-database combinations. The overall classification rate for shotgun reads was comparable across all pipeline-database combinations with a mean (SD) percentage for classified (non-human) reads being 90.3% (15.4%).
(B) Charts show the general taxonomic groups that are identified within each of the pipeline-database combinations, with the height of the bars corresponding to the total read recovery across all samples (log-scaled). The percentages on the bars in (B) represent the percent of all reads corresponding to each group (e.g., 99.94% of all sequencing data is bacterial in the Shogun-Rep200 analysis).
(C) Chart presents the resolution of 16SV4 rRNA OTUs at each bacterial/archaeal taxonomic rank. The light blue bars in (C) indicate the proportion of the OTUs that are resolved at each taxonomic level, whereas the dark blue bars indicate the proportion of reads classified.
Although the WolR1 database resulted in a greater recovery of reads, it contains a narrower spectrum of microbial life, including only genomes from bacterial and archaeal domains, whereas the Rep200 database also includes eukaryote and viral genomes (Figure 2B). In all pipeline-database combinations, the bacterial component comprised >99.9% of the metagenomic sequencing reads.
Bacterial taxonomic correlation between 16SV4 and shotgun metagenomic sequencing
Amplicon 16SV4 rRNA gene sequencing was analyzed at the genus level, as the information content is robust to this taxonomic level and is less accurate when attempting to assign species-level taxonomy.24 Within the 16SV4 data, 9% of all identified operational taxonomic units (OTUs) could also be resolved to the species level (Figure 2C), and these accounted for 34% of the total sequencing depth (Figure 2C).
Although there were no significant differences in terms of read recovery when using the same database with different shotgun pipelines (Figure 2A), there were variations in terms of identified bacterial genera that emerge from each pipeline and database (Figure 3A). Of all identified genera across the shotgun pipeline-database combinations, only 44% (898/2,057) were shared. Nevertheless, these 898 shared genera accounted for ∼95.0% and 99.9% of all sequencing reads when using the Rep200 database or the WolR1 database, respectively. Overall, these analyses indicate that the taxa identified that were not in common among the shotgun metagenomic methods represent a relatively minor proportion of the overall biomass. The shotgun metagenomic pipelines thus largely identify the same microbial genera, but the Woltka-Rep200 combination recovered the most diverse set of bacterial genera (i.e., 1,797 total genera identified).
Figure 3.

Taxonomic concordance of shotgun metagenomic sequencing and 16SV4 rRNA gene amplicon sequencing
(A) Figure shows comparison of the four pipeline-database combinations for the shotgun metagenomic data in terms of the overlapping genera with color scale indicating the number of total genera that are shared (light blue being low overlap and green being high overlap). Of all identified genera across the shotgun pipeline-database combinations, only 44% (898/2,057) were shared, but these 898 genera accounted for ∼95.0% and 99.9% of all sequencing reads (Rep200 database and WolR1 databases, respectively).
(B) Venn diagram shows the comparison of the two Rep200 database pipelines with the 16V4 rRNA data. The 254 genera that overlapped between amplicon and shotgun sets accounted for 99.3% of the amplicon sequencing reads and 91.2% and 89.2% of the sequencing reads using the SHOGUN and Woltka pipelines, respectively.
(C) Venn diagram shows the comparison between WolR1 database pipelines and 16SV4 rRNA data. The 252 overlapping genera accounted for 99.3% of all amplicon reads and 83.9% and 82.1% of the SHOGUN-WolR1 and Woltka-WolR1 sequencing reads, respectively.
(D) Graph displays the Pearson correlation between the four shotgun metagenomic pipeline-database combinations at different read depths and 16SV4 rRNA analyses based on taxa that are present at a median sequence depth of ≥0.01% total reads.
(E) Graphs show the pairwise correlation of the log (Prevotella/Bacteroides) as observed between 16SV4 rRNA sequencing on the x axis and each of the four shotgun pipeline-database combinations on the y axis.
Comparisons with the amplicon dataset revealed that 14% (254/1,866) of the genera are shared across the 16SV4 amplicon sequencing and the Rep200 database with either pipeline (Figure 3B). When we consider the abundance of these 254 genera within the amplicon dataset, we found that 99.3% of the amplicon sequencing reads are accounted for by these genera. Similarly, these 254 genera accounted for 91.2% and 89.2% of the shotgun sequencing reads using the SHOGUN and Woltka pipelines with the Rep200 database, respectively. Results were similar when comparing the 252/1,478 shared genera between the analyses using the 16SV4 data and the WolR1 pipeline-database analyses (Figure 3C), and these genera accounted for 99.3% of the amplicon sequencing reads, and 83.9% and 82.1% of the SHOGUN-WolR1 and Woltka-WolR1 sequencing reads, respectively. Thus, the vast majority of the biomass was captured by all methods.
We next sought to quantify the extent of the correlation between 16SV4 amplicon and shotgun sequencing analyses. In order to avoid skewing the analysis due to fluctuations inherent in rare taxa, we considered only genera that were present at a median relative abundance of 0.01% or more in all datasets resulting in 27 genera. Although these constitute a relatively small proportion of all identified OTUs (∼10%), they account for >96% of all sequencing reads of the amplicon data and >75% of all reads from each of the shotgun metagenomic analyses. To evaluate shotgun read depth in the analyses, each genus correlation was quantified at different shotgun subsampling thresholds ranging from 10,000 to 750,000 reads. Figure 3D shows the correlation of genera between the amplicon data and each shotgun pipeline-database combination at the indicated subsampling thresholds. Increasing shotgun sequencing depth had a positive effect on correlation with amplicon data. Sequencing to a depth of over 500,000 reads minimized differences in shotgun analytic approaches compared with the 16SV4 analyses (Figure 3D).
To give physiological context to the different analytical approaches, we focused on the ratio of Prevotella to Bacteroides based on 16S amplicon sequencing data, which we and others have reported to be correlated with immigration timing to the US.17,25,26 Correlation of the log(Prevotella/Bacteroides) ratios between 16SV4 and the shotgun data revealed strong concordance (was r > 0.93) across all shotgun approaches (Figure 3E).
Gene panel vs. whole genome approaches
Recently a group of shotgun metagenomic pipelines were compared and identified that MetaPhlAn 413 and mOTUs27 pipeline provided best-in-class performance for taxonomic resolution of shotgun metagenomic data.28 These pipelines include their own specific databases. Although these pipelines were not optimized for shallow shotgun sequencing, we wanted to evaluate the extent to which these commonly used approaches correspond to 16S amplicon sequencing in a real-world setting. Figure S1A shows that both MetaPhlAn 4 and mOTUs utilized a relatively small fraction of the total sequencing depth; an average (SD) of 3.39% (3.87%) of reads were retained for analysis by MetaPhlAn 4, and 0.059% (0.11%) of total shotgun reads were retained by the mOTUs pipeline. The overall correlation between the genera detected by MetaPhlAn 4 was 0.61 vs. 0.27 using the mOTUs pipeline (Figure S1B). Considering the ratio of Prevotella and Bacteroides, which represent the two dominant taxa in our cohort, we observed a strong correlation in MetaPhlAn 4 (correlation = 0.92) but a weak correlation in the mOTUs pipeline (correlation = 0.41) (Figures S1C and S1D, respectively). It therefore appears that these approaches may be able to recapitulate amplicon sequence observations in epidemiological studies (particularly for MetaPhlAn 4), but they require deep sequencing for accurate characterization of low-abundance taxa. This is expected as both pipelines utilize gene panels to estimate the abundance of bacteria in contrast to the whole genome alignment approach used by both Woltka and SHOGUN pipelines.
Limitations of fungal assessment with shotgun metagenomic analyses
In addition to bacteria, the human metagenome contains other organisms including fungi. For fungal analysis of shotgun sequencing data, we utilized the Rep200 database (as the WolR1 database does not contain fungal genome sequences) and performed the analysis at the species level.29,30
The ITS1 amplicon analyses indicated that the samples were dominated by three species: Saccharomyces cerevisiae, Aspergillus proliferans, and Candida albicans (Figure 4). Comparing fungal species detected by shotgun sequencing indicated that Woltka was unable to identify any of the species present in the ITS1 data, and SHOGUN identified only 6.4% (34/530) of all ITS1-identified species. The identification of Eukaryota constituted <0.1% of the shotgun sequencing data corresponding to a mean (SD) of 117 (1,210) reads/sample (coverage range [IQR] was 0–38,292 reads/sample). Subsampling to 100 fungal reads eliminated most of the samples and left only 261/1,772 samples for analysis (Figure 2B). At this depth, the correlation of fungal species abundance for the 34 overlapping species between the ITS1 and SHOGUN was 0.29 (Figure S2A), which indicates a poor correlation. Given the high variance in the data, we performed an additional sensitivity analysis where we did not subsample the data and found a similar lack of concordance (correlation = 0.16, Figure S2B).
Figure 4.

Fungal recovery using ITS1 amplicon sequencing and shotgun metagenomics
(A) Boxplot shows the top 20 fungal species (based on total read recovery across all samples) determined using ITS1 amplicon sequencing and the DADA2 pipeline with the UNITE database.
(B) Venn diagram showing the concordance of the fungal species detected using the ITS1 data and the Rep200 pipelines (only this database detects fungus in the Qiita platform).
(C) Boxplot showing the read recovery for all samples across fungal species (x axis) as detected in the metagenomic sequences using FindFungi (log scale on the y axis).
(D) Boxplots for the relative abundance of the identified fungal species using Metaphlan2 (showing data from 15/1,772 samples had fungal reads identified, log scale on the y axis).
Since shotgun metagenomic approaches have been optimized for bacterial assessment,16,31 we also analyzed the metagenomic data using the FindFungi pipeline,32 a pipeline designed to recover fungal species from metagenomic sequencing data. Using this approach, we were able to recover substantially more sequencing reads with an average (SD) of 1,887 (3,123) per sample. However, the identified species did not match our amplicon species distribution (Figure 4C vs. Figure 4A). FindFungi identified most of the reads as belonging to Melampsora pinitorqua Mpini7 (Figure 4C), a probable contaminant that is commonly found in public genome assemblies.33 We further investigated this species by assembling the reads belonging to this genome and performing a BLAST search of the largest contigs. Surprisingly, the results identified most of the reads as bacterial, specifically those of the genus Bacteroides. Taken together, the FindFungi output is likely a result of inaccurate classification.
As a final attempt to retrieve fungal reads from the shotgun sequencing data, we utilized MetaPhlAn 4,13 a non-alignment based shotgun profiling tool relying on clade-specific marker genes. The overall detection was moderately concordant with the ITS1 results (Figure 4A), with Aspergillus and Candida being detected within the top taxa (Figure 4D). However, MetaPhlAn 4 only identified fungi in 3.83% (68/1,772) of samples in contrast to ITS1 amplicon sequencing that identified fungi in 89.6% (1,587/1,772) of samples. Thus, the shotgun metagenomic sequencing and analyses used in the current study did not achieve adequate characterization of the fungal component in the gut microbiome.
Harmonizing amplicon and shotgun data
To determine the extent to which amplicon and shotgun data can be merged to achieve larger sample sizes, we evaluated an additional 1,525 samples from the HCHS/SOL cohort that had only shotgun metagenomic data. First, we classified all of the amplicon and shotgun data using a pre-release version of the Greengenes2 database and the Woltka pipeline. The Greengenes2 database uses the Web of Life database for whole genome phylogeny, with a topology refined using full-length, high-quality 16S rRNA sequences from the Living Tree Project34 and extracted full-length 16S rRNA from bacterial operons,35 followed by placement of all public and private 16SV4 Deblur-derived amplicon sequence variants ASVs from samples deposited in Qiita as of March 2022.36 Taxonomy is based on the GTDB37 and Living Tree Project.34 Figure 5A shows the principal coordinate analysis (PCoA) plot generated using weighted UniFrac38 distances based on the harmonized genome/ASV tree labels from Greengenes2 among the 1,772 samples with both 16S and shotgun data. The analysis indicates that the difference in sequencing approaches accounts for a small fraction of overall microbial variance (platform R2 = 0.0511, p value < 0.001), while the between-subject differences account for >60% of the overall variance (subject R2 = 0.620, p value < 0.001). This indicates that each participant’s unique microbiome profile is captured regardless of whether by amplicon or shotgun metagenomic approaches. Presence-absence analysis using unweighted UniFrac distances, however, showed that platform choice accounted for as much variance as the between-subject differences (R2 = 0.512, p value < 0.001 vs. R2 = 0.510, p value < 0.001, respectively, Figure 5B). The significant influence of platform in the unweighted analysis is consistent with the greater proportion of novel and rare taxa present in shotgun sequencing and may also be explained in part by the mutually exclusive feature spaces between Web of Life identifiers and amplicon sequence variants.
Figure 5.

Harmonizing amplicon and shotgun metagenomic data
(A) The principal coordinate analysis (PCoA) Emperor plot of the harmonized ASV/genome Greengenes 2 weighted UniFrac distances with both the amplicon and shotgun data analyzed using the Greengenes 2 database (n = 1,772 subjects; 3,544 data points) is shown.
(B) An Emperor plot using unweighted UniFrac, which only assesses for presence-absence of taxa, is shown. For both Emperor plots, the PERMANOVA results for the platform and subject are shown in the lower right-hand corner.
(C) A logistic regression forest plot is shown that considers three participant characteristics within the GOLD cohort: sex (men vs. women), obesity (BMI 18.5–25 vs. >30), and relocation (US-born vs. recent immigrants, i.e. those that immigrated after 55 years of age). Each of the three main outcomes is modeled using the ratio of the two top bacterial predictors based on ANCOM W-stat (see Figure S2). Each of the models is adjusted for age, collection center, Hispanic background, and healthy eating index (AHEI2010). Each point and associated bar represent the exponentiated beta coefficient (i.e., OR) and the associated 95% and 90% confidence intervals (thinner and thicker lines, respectively). Color of bars indicates the dataset used to model the outcomes: green represents the original 16S sequencing set; blue indicates the full shotgun set (samples overlapping with 16S and those unique to shotgun analysis); and yellow represents a combination between the original 16S amplicon set and the newly sequenced shotgun set (i.e., shotgun samples that do not overlap with16S). Numbers to the right of the forest plot show the numerical values of the exponentiated beta coefficients, confidence intervals, and associated p values.
We then used the harmonized data to evaluate pooling amplicon and shotgun data. We performed this by utilizing three outcomes available within the GOLD cohort: sex (men vs. women), obesity (BMI 18.5–25 vs. >30) and age of relocation (US-born vs. recent immigrants, i.e., those that immigrated after 55 years of age). For each of the outcomes, we utilized the ratio of the top bacterial biomarkers identified with ANCOM.39 For gender, we identified a total of 117 differentially abundant genera (Figure S3A) with Prevotella being the top elevated genus in men and Akkermensia being the top elevated genus in women; for the obesity analysis, we identified 107 differential genera with Catenibacterium being elevated in obese individuals (BMI >30) and Ruminiclostridium being elevated in individuals within normal BMI ranges (BMI 18.5–25) (Figure S3B); and for the age of relocation analysis, there were 118 differential genera with Acidaminococcus being elevated in US-born individuals and Haemophilus being elevated in individuals that immigrated to the US after 55 years of age or greater (Figure S3C).
We then identified the effect modeled using the amplicon only dataset (total n = 1,772 individuals), the full shotgun set (total n = 3,297 individuals), and a “hybrid set” that contained the original amplicon only set with the additional 1,525 individuals unique to shotgun sequencing (total n = 3,297 individuals). Figure 5C shows a forest plot with the three-modeled outcomes using the described datasets. Remarkably each of the effect sizes detected using any of the datasets (including the reduced amplicon only set) were within 1% of each other. For example, when modeling the effect of the log(Akkermansia/Prevotella) in the case of the sex outcome, the amplicon only analysis revealed an odds ratio (OR) = 0.95 (95% confidence interval [CI]: 0.92–0.98), with the full shotgun set showing an OR = 0.94 (0.93–0.96), and the hybrid set had an OR = 0.95 (0.93–0.96). Similarly, analysis of the obesity outcome with log(Ruminiclostridium/Catenibacterium) showed ORs = 0.94 (0.90–0.99), 0.95 (0.93–0.97), and 0.95 (0.93–0.97) using the amplicon only, shotgun only, and hybrid datasets, respectively. For the age of immigration outcome, the amplicon only, shotgun only, and hybrid datasets had ORs using the log(Haemophilus/Acidaminococcus) of 1.06 (1.01–1.12), 1.08 (1.05–1.12), and 1.07 (1.04–1.10), respectively. The amplicon dataset showed larger confidence intervals, which are likely due to the smaller sample size of 1,772 individuals compared with the 3,297 used for both the full shotgun and hybrid analyses. Thus, pooling amplicon and shotgun samples recapitulates the associations that would be obtained using purely shotgun metagenomics data at the genus level.
Discussion
To comprehensively evaluate the utility of different strategies for microbiome analyses in epidemiological studies, we utilized stool microbiome data from the large HCHS/SOL cohort with overlapping 16SV4 rRNA, ITS1, and shotgun metagenomic sequencing. We evaluated 16SV4 amplicon sequencing with shotgun metagenomic sequencing processed with four different pipeline-database approaches and found that overlapping bacterial genera accounted for 99% of all 16SV4 reads and ∼90% of all of the shotgun reads. Furthermore, for the shared set of bacterial genera, we observed Pearson correlations >0.86 between 16SV4 and shotgun data, using as few as 100,000 reads across all of the shotgun pipeline-database approaches. Use of the WolR1 database for the shotgun analyses provided the best concordance with the 16SV4 data at sequencing depths <500,000 reads, whereas either WolR1 or Rep200 database use was equivalent to the 16SV4 analyses when sequencing depth was >500,000 reads. Exploring the Prevotella/Bacteroides ratio previously associated with immigration status17 revealed that all the shotgun pipeline-database combinations showed correlations >0.94 with the 16SV4 data. Finally, using a release candidate of the Greengenes2 database (http://ftp.microbio.me/greengenes_release/2022.7-rc1/), which harmonizes a 16S and genome-based taxonomy and phylogeny, we show that 16S and shotgun data can be pooled to yield valid epidemiologic results comparable to a full shotgun dataset using three independent outcomes. In the pooled analyses, the measured effects differed by <1% in all examples, with improved precision compared with the amplicon-only analyses. These results have important implications for scaling up epidemiologic studies of the microbiome utilizing available 16S and shotgun data from multiple studies and datasets.
While the bacterial and archaeal data demonstrated strong concordance between shotgun and amplicon approaches, there was little concordance for fungal data. Unlike the 16SV4 rRNA gene, the ITS1 fragment has been proposed to be used to resolve fungi to species level within the human mycobiome.30 It should be noted however that the current results may not translate to non-human studies, as the ITS1 amplicon has been shown to be inadequate for species-level resolution of environmental samples.29 In terms of the current study, when considering the identified fungal species, there were pronounced differences between shotgun pipelines (database choice was limited to the Rep200, as the WolR1 database did not include fungi). Specifically, only the SHOGUN pipeline was able to identify any overlapping species with the ITS1 data, albeit with poor correlation. The poor performance of the Woltka pipeline for identifying fungi may be related to its designated goal of resolving differences between bacteria and archaea.31 However even when we attempted to recover fungi using a fungal-specific pipeline for metagenomic datasets (FindFungi32), we did not recover any of the species present in our cohort by the ITS1 amplicon analyses. The only analysis that recovered comparable profiles found within ITS1 data was MetaPhlAn 4, but due to its requirement for deep sequencing,13 we only recovered fungal reads for 68/1,772 samples (3.84%). Shotgun metagenomics is thus inadequate for fungal assessment using stool samples except perhaps at very high read depths. The reason for this is likely 2-fold. First, the stool metagenome is dominated by bacteria, which make fungi a small fraction of all DNA available for sequencing. Secondly, fungi are eukaryotic organisms with genomes that are orders of magnitude larger than bacteria and often contain non-coding redundant components that do not facilitate taxonomic classification. We therefore conclude that shotgun metagenomics sequencing is not optimal for characterizing the fungal community, whereasITS1 amplicon sequencing30 provides a more sensitive platform for these taxa.
This report also demonstrated that amplicon and shotgun datasets can be pooled together to perform larger scale analyses of the microbiome for epidemiological studies. This approach builds on previous reports including those by Stewart et al.40 in the TEDDY study that highlighted the overall similarity in trends between amplicon and shotgun data. In our analysis, we formally defined the extent of this similarity at the genus level and provided an analytical framework with three independent outcomes (i.e., sex, obesity, and age of relocation to the US) in which amplicon and shotgun data were pooled together and compared with purely shotgun datasets. This analysis is of consequence because it opens the door for cross-platform analyses that can take full advantage of the large amount of amplicon data produced over the last 20 years in the context of future meta- and pooled analyses. As our results demonstrate, this would allow for precision in the observed effects afforded by increased sample sizes.
In summary, we used a large cohort to demonstrate that 99% of all bacterial taxa detected using 16SV4 rRNA gene sequencing can be recovered using shotgun metagenomics, with comparable genus-level relative abundance and with as few as 100,000 shotgun reads independent of the pipeline and database. This does not extend to fungal taxa, where targeted ITS1 primers are ideal due to the low biomass and relatively complex genomes of these organisms. By providing species-level resolution,16 shotgun sequencing provides complementary data to 16S rRNA amplicon sequencing for stool samples in large-cohort studies. Moving forward, harmonized databases for both 16S and shotgun sequence classification (e.g., Greengenes2) can facilitate pooling available microbiome data into larger epidemiologic studies to answer pressing questions about microbiome-disease relationships in a robust and efficient manner.
Limitations of the study
This study has limitations. Only stool samples were evaluated in the current report. Additional work is needed to determine the effectiveness of different depths of shotgun sequencing for samples derived from other anatomical sites. This is particularly important since stool is effectively the only human sample type that is nearly completely composed of bacterial DNA.41 Samples derived from other sites such as the cervicovaginal region contain <10% bacterial DNA as determined from shotgun sequencing.42 The reliability of shallow shotgun metagenomics therefore needs to also be evaluated in cohorts with samples from other anatomical sites, to determine whether this approach can serve as a general-purpose tool like 16SV4 rRNA gene amplicon sequencing. Additionally, bacterial analysis provided in the present study is strongly concordant up to genus level, which is a limitation of using the 16S gene.24 Furthermore, our analysis utilized a limited set of pipelines and databases that were available within Qiita. Given the strength of observed associations, a more comprehensive study that optimizes amplicon/shotgun data harmonization is warranted.
STAR★Methods
Key resources table
| REAGENT or RESOURCE | SOURCE | IDENTIFIER |
|---|---|---|
| Biological samples | ||
| Human stool samples | HCHS/SOL (GOLD) Cohort | https://sites.cscc.unc.edu/cscc/projects/HCHS-SOL |
| Deposited data | ||
| Raw metagenomic data | This paper | Qiita Study ID: 11,666 |
| Raw metagenomic data | This paper | European Nucleotide Archive database (project accession: ERP117287) |
| 16SV4 rRNA and ITS1 amplicon sequencing data | Kaplan et al.,17 | Qiita Study ID: 11,666 |
| 16SV4 rRNA and ITS1 amplicon sequencing data | Kaplan et al.,17 | European Nucleotide Archive database (project accession: ERP117287) |
| Greengenes2 | Greengenes2/Daniel McDonald | http://ftp.microbio.me/greengenes_release/2022.7-rc1/ |
| Software and algorithms | ||
| Qiita | UCSD | https://qiita.ucsd.edu/ |
| Bowtie2 | John Hopkins University | https://bowtie-bio.sourceforge.net/bowtie2/index.shtml |
| SHOGUN | Knights Lab | https://github.com/knights-lab/SHOGUN |
| Woltka | Knight Lab | https://github.com/qiyunzhu/woltka |
| FindFungi | https://github.com/GiantSpaceRobot/FindFungi | |
| MetaPhlAn 4.0 | Huttenhower Lab | https://huttenhower.sph.harvard.edu/metaphlan/ |
| DADA2 | https://benjjneb.github.io/dada2/ | |
Resource availability
Lead contact
-
•
Further information and requests for resources should be directed to and will be fulfilled by the lead contact, Robert D. Burk (robert.burk@einsteinmed.edu).
Materials availability
-
•
This study did not generate new unique reagents.
Experimental model and subject details
The Hispanic Community Health Study/Study of Latinos (HCHS/SOL) is a prospective, population-based cohort study of 16,415 Hispanic/Latino adults (ages 18–74 years at the time of recruitment during 2008–2011) who were selected using a multi-stage probability sampling design from randomly sampled census block areas within four U.S. communities (Chicago, IL; Miami, FL; Bronx, NY; San Diego, CA).43,44 The first (2008–2011) and second (2014–2017) HCHS/SOL clinic visits entailed a comprehensive battery of interviews and a clinical assessment with fasting blood draw, conducted in-person by trained, certified, and bilingual staff. The current analysis is nested in the HCHS/SOL Gut Origins of Latino Diabetes (GOLD) ancillary study,17 which was conducted to examine the role of gut microbiome composition on diabetes and other outcomes, enrolling ∼3,000 participants from the HCHS/SOL concurrent with the second in-person HCHS/SOL visit cycle. For this analysis, we utilized participants with overlapping 16SV4 rRNA and ITS1 sequencing data previously reported17 as well as newly reported shotgun sequencing data from an additional 1,525 subjects. The study was conducted with the approval of the Institutional Review Boards (IRBs) of Albert Einstein College of Medicine, University of Illinois-Chicago College of Medicine, Miller School of Medicine at the University of Miami, San Diego State University, and University of North Carolina at Chapel Hill. Written informed consent was provided by all study participants.
Method details
Stool sample collection and microbiome sequencing
Stool samples were collected by participants at home using stool collection kits provided at or around the second HCHS/SOL clinic visit, as described previously.17 16SV4 rRNA and ITS1 amplicon sequencing methods have been previously described for this study.17 Shotgun sequencing was conducted in the Knight laboratory at the University of California San Diego (UCSD).16 Briefly, DNA was extracted from fecal samples following the Earth Microbiome Project protocol.45 Input DNA was quantified using a PicoGreen fluorescence assay (ThermoFisher, Inc), and normalized to 1 ng using an Echo 550 acoustic liquid-handling robot (Labcyte, Inc). Enzyme mixes for fragmentation, end repair and A-tailing, ligation, and PCR were added using a Mosquito HV micropipetting robot (TTP Labtech). Fragmentation was performed at 37 °C for 20 min, followed by end-repair and A-tailing at 65 °C for 30 min. Sequencing adapters and barcode indices were added in two steps, following the iTru adapter protocol.46 Universal “stub” adapter molecules and ligase mix were first added to the end-repaired DNA using the Mosquito HV robot and ligation performed at 20 °C for 1 h. Unligated adapters and adapter dimers were removed using AMPure XP magnetic beads and a BlueCat purification robot (BlueCat Bio). Next, individual i7 and i5 were added to the adapter-ligated samples using the Echo 550 robot. Then, eluted bead-washed ligated samples were added to PCR master mix and PCR-amplified for 15 cycles. The amplified and indexed libraries were purified again using magnetic beads and the BlueCat robot, re-suspended in water, and transferred to a 384-well plate using the Mosquito HTS liquid-handling robot for library quantitation, sequencing, and storage. Samples were normalized based on a PicoGreen fluorescence assay for sequencing on an Illumina NovaSeq.
Quantification and statistical analysis
Microbial taxonomic profiling
For all data types (shotgun, 16SV4, and ITS1), FASTQ sequence reads were demultiplexed, sequence adapters were trimmed, and (in the case of shotgun data) reads mapping to the human genome identified using Bowtie247 were removed. For shotgun sequencing, the quality controlled paired-end sequences were then processed using the four available combinations available in Qiita36 using the SHOGUN36 and Woltka31 pipelines and the Rep20019 and WolR1 databases. Qiita is a web-based open-source microbial study management platform that allows data to be remotely processed using a high capacity cluster and allows all analytical steps and associated datasets to be made publically available. Reads mapping to a single reference genome are labeled with NCBI taxonomy at species level, while reads mapping to multiple genomes are labeled with the lowest common ancestor (LCA).16 Species tables were subset to bacterial species only (making up >99.5% of reads). For fungal analysis of shotgun data, reads were additionally processed using FindFungi32 and MetaPhlAn 413 using default settings. In the FindFungi analysis we additionally used only those fungal hits where reads also had agreeing similar BLAST hit, and where reads hit to at least 10% of pseudochromosomes for that taxon (pseudochromosomes represent arbitrary bins of a genome), and with bin hits filtered to exclude those representing less than 0.0001% of total reads per-sample. For amplicon sequencing of the 16SV4 rRNA gene, vsearch18 with default settings was run within Qiita36 and taxonomy was assigned using the Greengenes database version 13_8.48,49 For amplicon sequencing of the ITS1 gene, sequence reads were resolved to amplicon sequence variants analyzed using DADA29 and taxonomy was assigned using the UNITE database version 8.3.50 For Greengenes2, the Woltka and 16SV4 ASV feature tables were merged, and features were filtered to the set represented by the release candidate. The release candidate of the Greengenes2 database is available at: http://ftp.microbio.me/greengenes_release/2022.7-rc1/. The tips of the Greengenes2 phylogeny contain both Web of Life identifiers and ASVs. The taxonomy of the Greengenes2 database is derived using tax2tree49 using the common phylogeny.
Statistical analysis
Sequence read recovery was compared between the four shotgun pipeline-database combinations (SHOGUN-Rep200, SHOGUN-WolR1, Woltka-Rep200, Woltka-WolR1) using the Kruskal-Wallis test. Pairwise differences in classified read depth were assessed using the non-parametric Wilcox rank-sum test, with adjustment for multiple testing using the qvalue package version 2.16.0. Pearson correlations were used to correlate relative abundance after subsampling for taxa detected across amplicon sequencing and the four shotgun pipeline-database combinations. Differential abundance analysis by sex (men vs. women), obesity (BMI 18.5–25 vs. >30), and age of relocation (US-born vs. recent immigrants, >55 years), was determined using ANCOM251 with adjustment for participant age, reported Hispanic/Latino background, field center, and sex (not including the analysis for sex). For pooling analyses, three datasets were used: an amplicon only dataset (1,772 samples), a shotgun dataset (3,297 samples that contained 1,772 samples that overlapped with amplicon data and 1,525 that had shotgun data only) and a pooled dataset (1,772 samples using amplicon data and 1,525 samples that used shotgun data and did not overlap with amplicon samples). In each of the datasets the top ratio for each of the demographic analysis was used for modeling. Data analysis and visualization was achieved using R version 3.6.1.52
Acknowledgments
The authors gratefully acknowledge the participants of the SOL cohort that chose to provide stool samples that allowed this study to be performed.
The Hispanic Community Health Study/Study of Latinos (HCHS/SOL) is a collaborative study supported by contracts from the National Heart, Lung, and Blood Institute (NHLBI) to the University of North Carolina (HHSN268201300001I/N01-HC-65233), University of Miami (HHSN268201300004I/N01-HC-65234), Albert Einstein College of Medicine (HHSN268201300002I/N01-HC-65235), University of Illinois at Chicago –HHSN268201300003I/N01-HC-65236 Northwestern University), and San Diego State University (HHSN268201300005I/N01-HC-65237). The following institutes/centers/offices have contributed to the HCHS/SOL through a transfer of funds to the NHLBI: National Institute on Minority Health and Health Disparities, National Institute on Deafness and Other Communication Disorders, National Institute of Dental and Craniofacial Research, National Institute of Diabetes and Digestive and Kidney Diseases, National Institute of Neurological Disorders and Stroke, NIH Institution-Office of Dietary Supplements. Additional funding for the “Gut Origins of Latino Diabetes” (GOLD) ancillary study to HCHS/SOL was provided by 1R01MD011389-01 from the National Institute on Minority Health and Health Disparities. In addition, RO1DK126698, P30CA013330, P30AI124414, and U01HL146204 also provided support. None of the funding agencies had a role in the design, conduct, interpretation, or reporting of this study.
Author contributions
Conceptualization, M.U. and R.D.B; methodology, M.U., S.K., D.M., Y.V.-B., J.P.S., R.Knight., and R.D.B; software, D.M. and R.Knight; formal analysis, M.U.; resources, C.C.S., M.D.G., G.A.T., M.L.D., B.T., Q.Q., and R.Kaplan.; writing – original draft, M.U. and R.D.B; writing – review & editing, M.U., B.A.P., and R.D.B; supervision, R.D.B.
Declaration of interests
The authors declare no competing interests.
Published: January 23, 2023
Footnotes
Supplemental information can be found online at https://doi.org/10.1016/j.crmeth.2022.100391.
Supplemental information
Data and code availability
-
•
All original data, including the raw sequencing fastqs, the processed biom file and associated analyses code is available for download via Qiita under the project study ID 11666. Raw sequence data is additionally available at the European Nucleotide Archive database (project accession: ERP117287). The release candidate of the Greengenes2 database is available at its associated server (http://ftp.microbio.me/greengenes_release/2022.7-rc1/).
-
•
This paper does not report original code.
-
•
Any additional information required to reanalyze the data reported in this paper is available from the lead contact upon request.
References
- 1.Council N.R. National Academies Press; 2007. The New Science of Metagenomics: Revealing the Secrets of Our Microbial Planet. [PubMed] [Google Scholar]
- 2.Minich J.J., Humphrey G., Benitez R.A.S., Sanders J., Swafford A., Allen E.E., Knight R. High-throughput miniaturized 16S rRNA amplicon library preparation reduces costs while preserving microbiome integrity. mSystems. 2018;3:e00166-18. doi: 10.1128/mSystems.00166-18. [DOI] [PMC free article] [PubMed] [Google Scholar]
- 3.NIH Human Microbiome Portfolio Analysis Team. Marquitz A., Daschner P., Xi D., Flores R., Brown L., Ryan R., Maruvada P., Regan K., Dwayne Lunsford R., Reddy M., Caler L. A review of 10 years of human microbiome research activities at the US National Institutes of Health, Fiscal Years 2007-2016. Microbiome. 2019;7:31. doi: 10.1186/s40168-019-0620-y. [DOI] [PMC free article] [PubMed] [Google Scholar]
- 4.Maruvada P., Leone V., Kaplan L.M., Chang E.B. The human microbiome and obesity: moving beyond associations. Cell Host Microbe. 2017;22:589–599. doi: 10.1016/j.chom.2017.10.005. [DOI] [PubMed] [Google Scholar]
- 5.Vallianou N.G., Stratigou T., Tsagarakis S. Microbiome and diabetes: where are we now? Diabetes Res. Clin. Pract. 2018;146:111–118. doi: 10.1016/j.diabres.2018.10.008. [DOI] [PubMed] [Google Scholar]
- 6.Sittipo P., Choi J., Lee S., Lee Y.K. The function of gut microbiota in immune-related neurological disorders: a review. J. Neuroinflammation. 2022;19:154. doi: 10.1186/s12974-022-02510-1. [DOI] [PMC free article] [PubMed] [Google Scholar]
- 7.Helmink B.A., Khan M.A.W., Hermann A., Gopalakrishnan V., Wargo J.A. The microbiome, cancer, and cancer therapy. Nat. Med. 2019;25:377–388. doi: 10.1038/s41591-019-0377-7. [DOI] [PubMed] [Google Scholar]
- 8.Johnson J.S., Spakowicz D.J., Hong B.-Y., Petersen L.M., Demkowicz P., Chen L., Leopold S.R., Hanson B.M., Agresta H.O., Gerstein M., et al. Evaluation of 16S rRNA gene sequencing for species and strain-level microbiome analysis. Nat. Commun. 2019;10:5029. doi: 10.1038/s41467-019-13036-1. [DOI] [PMC free article] [PubMed] [Google Scholar]
- 9.Callahan B.J., McMurdie P.J., Rosen M.J., Han A.W., Johnson A.J.A., Holmes S.P. DADA2: high-resolution sample inference from Illumina amplicon data. Nat. Methods. 2016;13:581–583. doi: 10.1038/nmeth.3869. [DOI] [PMC free article] [PubMed] [Google Scholar]
- 10.Amir A., McDonald D., Navas-Molina J.A., Kopylova E., Morton J.T., Zech Xu Z., Kightley E.P., Thompson L.R., Hyde E.R., Gonzalez A., Knight R. Deblur rapidly resolves single-nucleotide community sequence patterns. mSystems. 2017;2:e00191-16. doi: 10.1128/mSystems.00191-16. [DOI] [PMC free article] [PubMed] [Google Scholar]
- 11.Langille M.G.I., Zaneveld J., Caporaso J.G., McDonald D., Knights D., Reyes J.A., Clemente J.C., Burkepile D.E., Vega Thurber R.L., Knight R., et al. Predictive functional profiling of microbial communities using 16S rRNA marker gene sequences. Nat. Biotechnol. 2013;31:814–821. doi: 10.1038/nbt.2676. [DOI] [PMC free article] [PubMed] [Google Scholar]
- 12.Douglas G.M., Maffei V.J., Zaneveld J.R., Yurgel S.N., Brown J.R., Taylor C.M., Huttenhower C., Langille M.G.I. PICRUSt2 for prediction of metagenome functions. Nat. Biotechnol. 2020;38:685–688. doi: 10.1038/s41587-020-0548-6. [DOI] [PMC free article] [PubMed] [Google Scholar]
- 13.Truong D.T., Franzosa E.A., Tickle T.L., Scholz M., Weingart G., Pasolli E., Tett A., Huttenhower C., Segata N. MetaPhlAn2 for enhanced metagenomic taxonomic profiling. Nat. Methods. 2015;12:902–903. doi: 10.1038/nmeth.3589. [DOI] [PubMed] [Google Scholar]
- 14.Wood D.E., Salzberg S.L. Kraken: ultrafast metagenomic sequence classification using exact alignments. Genome Biol. 2014;15:R46. doi: 10.1186/gb-2014-15-3-r46. [DOI] [PMC free article] [PubMed] [Google Scholar]
- 15.Menzel P., Ng K.L., Krogh A. Fast and sensitive taxonomic classification for metagenomics with Kaiju. Nat. Commun. 2016;7:11257. doi: 10.1038/ncomms11257. [DOI] [PMC free article] [PubMed] [Google Scholar]
- 16.Hillmann B., Al-Ghalith G.A., Shields-Cutler R.R., Zhu Q., Gohl D.M., Beckman K.B., Knight R., Knights D. Evaluating the information content of shallow shotgun metagenomics. mSystems. 2018;3:e00069-18. doi: 10.1128/mSystems.00069-18. [DOI] [PMC free article] [PubMed] [Google Scholar]
- 17.Kaplan R.C., Wang Z., Usyk M., Sotres-Alvarez D., Daviglus M.L., Schneiderman N., Talavera G.A., Gellman M.D., Thyagarajan B., Moon J.-Y., et al. Gut microbiome composition in the Hispanic Community Health Study/Study of Latinos is shaped by geographic relocation, environmental factors, and obesity. Genome Biol. 2019;20:219. doi: 10.1186/s13059-019-1831-z. [DOI] [PMC free article] [PubMed] [Google Scholar]
- 18.Rognes T., Flouri T., Nichols B., Quince C., Mahé F. VSEARCH: a versatile open source tool for metagenomics. PeerJ. 2016;4:e2584. doi: 10.7717/peerj.2584. [DOI] [PMC free article] [PubMed] [Google Scholar]
- 19.O'Leary N.A., Wright M.W., Brister J.R., Ciufo S., Haddad D., McVeigh R., Rajput B., Robbertse B., Smith-White B., Ako-Adjei D., et al. Reference sequence (RefSeq) database at NCBI: current status, taxonomic expansion, and functional annotation. Nucleic Acids Res. 2016;44:D733–D745. doi: 10.1093/nar/gkv1189. [DOI] [PMC free article] [PubMed] [Google Scholar]
- 20.Tatusova T., DiCuccio M., Badretdin A., Chetvernin V., Nawrocki E.P., Zaslavsky L., Lomsadze A., Pruitt K.D., Borodovsky M., Ostell J. NCBI prokaryotic genome annotation pipeline. Nucleic Acids Res. 2016;44:6614–6624. doi: 10.1093/nar/gkw569. [DOI] [PMC free article] [PubMed] [Google Scholar]
- 21.Brister J.R., Ako-Adjei D., Bao Y., Blinkova O. NCBI viral genomes resource. Nucleic Acids Res. 2015;43:D571–D577. doi: 10.1093/nar/gku1207. [DOI] [PMC free article] [PubMed] [Google Scholar]
- 22.Zhu Q., Mai U., Pfeiffer W., Janssen S., Asnicar F., Sanders J.G., Belda-Ferre P., Al-Ghalith G.A., Kopylova E., McDonald D., et al. Phylogenomics of 10, 575 genomes reveals evolutionary proximity between domains Bacteria and Archaea. Nat. Commun. 2019;10:5477. doi: 10.1038/s41467-019-13443-4. [DOI] [PMC free article] [PubMed] [Google Scholar]
- 23.Zhu Q., Huang S., Gonzalez A., McGrath I., McDonald D., Haiminen N., Armstrong G., Vázquez-Baeza Y., Yu J., Kuczynski J., et al. Phylogeny-Aware analysis of metagenome community ecology based on matched reference genomes while bypassing taxonomy. mSystems. 2022;7:e0016722. doi: 10.1128/msystems.00167-22. [DOI] [PMC free article] [PubMed] [Google Scholar]
- 24.Schloss P.D., Handelsman J. Introducing DOTUR, a computer program for defining operational taxonomic units and estimating species richness. Appl. Environ. Microbiol. 2005;71:1501–1506. doi: 10.1128/AEM.71.3.1501-1506.2005. [DOI] [PMC free article] [PubMed] [Google Scholar]
- 25.Vangay P., Johnson A.J., Ward T.L., Al-Ghalith G.A., Shields-Cutler R.R., Hillmann B.M., Lucas S.K., Beura L.K., Thompson E.A., Till L.M., et al. US immigration westernizes the human gut microbiome. Cell. 2018;175:962–972.e10. doi: 10.1016/j.cell.2018.10.029. [DOI] [PMC free article] [PubMed] [Google Scholar]
- 26.Peters B.A., Yi S.S., Beasley J.M., Cobbs E.N., Choi H.S., Beggs D.B., Hayes R.B., Ahn J. US nativity and dietary acculturation impact the gut microbiome in a diverse US population. ISME J. 2020;14:1639–1650. doi: 10.1038/s41396-020-0630-6. [DOI] [PMC free article] [PubMed] [Google Scholar]
- 27.Milanese A., Mende D.R., Paoli L., Salazar G., Ruscheweyh H.-J., Cuenca M., Hingamp P., Alves R., Costea P.I., Coelho L.P., et al. Microbial abundance, activity and population genomic profiling with mOTUs2. Nat. Commun. 2019;10:1014. doi: 10.1038/s41467-019-08844-4. [DOI] [PMC free article] [PubMed] [Google Scholar]
- 28.Meyer F., Fritz A., Deng Z.-L., Koslicki D., Lesker T.R., Gurevich A., Robertson G., Alser M., Antipov D., Beghini F., et al. Critical assessment of metagenome interpretation: the second round of challenges. Nat. Methods. 2022;19:429–440. doi: 10.1038/s41592-022-01431-4. [DOI] [PMC free article] [PubMed] [Google Scholar]
- 29.Mbareche H., Veillette M., Bilodeau G., Duchaine C. Comparison of the performance of ITS1 and ITS2 as barcodes in amplicon-based sequencing of bioaerosols. PeerJ. 2020;8:e8523. doi: 10.7717/peerj.8523. [DOI] [PMC free article] [PubMed] [Google Scholar]
- 30.Usyk M., Zolnik C.P., Patel H., Levi M.H., Burk R.D. Novel ITS1 fungal primers for characterization of the mycobiome. mSphere. 2017;2:e00488-17. doi: 10.1128/mSphere.00488-17. [DOI] [PMC free article] [PubMed] [Google Scholar]
- 31.Zhu Q., Huang S., Gonzalez A., McGrath I., McDonald D., Haiminen N., Armstrong G., Vázquez-Baeza Y., Yu J., Kuczynski J. OGUs enable effective, phylogeny-aware analysis of even shallow metagenome community structures. bioRxiv. 2021 doi: 10.1101/2021.04.04.438427. Preprint at. [DOI] [PMC free article] [PubMed] [Google Scholar]
- 32.Donovan P.D., Gonzalez G., Higgins D.G., Butler G., Ito K. Identification of fungi in shotgun metagenomics datasets. PLoS One. 2018;13:e0192898. doi: 10.1371/journal.pone.0192898. [DOI] [PMC free article] [PubMed] [Google Scholar]
- 33.Kryukov K., Imanishi T. Human contamination in public genome assemblies. PLoS One. 2016;11:e0162424. doi: 10.1371/journal.pone.0162424. [DOI] [PMC free article] [PubMed] [Google Scholar]
- 34.Yarza P., Richter M., Peplies J., Euzeby J., Amann R., Schleifer K.-H., Ludwig W., Glöckner F.O., Rosselló-Móra R. The All-Species Living Tree project: a 16S rRNA-based phylogenetic tree of all sequenced type strains. Syst. Appl. Microbiol. 2008;31:241–250. doi: 10.1016/j.syapm.2008.07.001. [DOI] [PubMed] [Google Scholar]
- 35.Karst S.M., Ziels R.M., Kirkegaard R.H., Sørensen E.A., McDonald D., Zhu Q., Knight R., Albertsen M. High-accuracy long-read amplicon sequences using unique molecular identifiers with Nanopore or PacBio sequencing. Nat. Methods. 2021;18:165–169. doi: 10.1038/s41592-020-01041-y. [DOI] [PubMed] [Google Scholar]
- 36.Gonzalez A., Navas-Molina J.A., Kosciolek T., McDonald D., Vázquez-Baeza Y., Ackermann G., DeReus J., Janssen S., Swafford A.D., Orchanian S.B., et al. Qiita: rapid, web-enabled microbiome meta-analysis. Nat. Methods. 2018;15:796–798. doi: 10.1038/s41592-018-0141-9. [DOI] [PMC free article] [PubMed] [Google Scholar]
- 37.Parks D.H., Chuvochina M., Rinke C., Mussig A.J., Chaumeil P.-A., Hugenholtz P. GTDB: an ongoing census of bacterial and archaeal diversity through a phylogenetically consistent, rank normalized and complete genome-based taxonomy. Nucleic Acids Res. 2022;50:D785–D794. doi: 10.1093/nar/gkab776. [DOI] [PMC free article] [PubMed] [Google Scholar]
- 38.McDonald D., Vázquez-Baeza Y., Koslicki D., McClelland J., Reeve N., Xu Z., Gonzalez A., Knight R. Striped UniFrac: enabling microbiome analysis at unprecedented scale. Nat. Methods. 2018;15:847–848. doi: 10.1038/s41592-018-0187-8. [DOI] [PMC free article] [PubMed] [Google Scholar]
- 39.Lin H., Peddada S.D. Analysis of compositions of microbiomes with bias correction. Nat. Commun. 2020;11:3514. doi: 10.1038/s41467-020-17041-7. [DOI] [PMC free article] [PubMed] [Google Scholar]
- 40.Stewart C.J., Ajami N.J., O’Brien J.L., Hutchinson D.S., Smith D.P., Wong M.C., Ross M.C., Lloyd R.E., Doddapaneni H., Metcalf G.A., et al. Temporal development of the gut microbiome in early childhood from the TEDDY study. Nature. 2018;562:583–588. doi: 10.1038/s41586-018-0617-x. [DOI] [PMC free article] [PubMed] [Google Scholar]
- 41.Marotz C.A., Sanders J.G., Zuniga C., Zaramela L.S., Knight R., Zengler K. Improving saliva shotgun metagenomics by chemical host DNA depletion. Microbiome. 2018;6:42. doi: 10.1186/s40168-018-0426-3. [DOI] [PMC free article] [PubMed] [Google Scholar]
- 42.Cho I., Blaser M.J. The human microbiome: at the interface of health and disease. Nat. Rev. Genet. 2012;13:260–270. doi: 10.1038/nrg3182. [DOI] [PMC free article] [PubMed] [Google Scholar]
- 43.Lavange L.M., Kalsbeek W.D., Sorlie P.D., Avilés-Santa L.M., Kaplan R.C., Barnhart J., Liu K., Giachello A., Lee D.J., Ryan J., et al. Sample design and cohort selection in the hispanic community health study/study of Latinos. Ann. Epidemiol. 2010;20:642–649. doi: 10.1016/j.annepidem.2010.05.006. [DOI] [PMC free article] [PubMed] [Google Scholar]
- 44.Sorlie P.D., Avilés-Santa L.M., Wassertheil-Smoller S., Kaplan R.C., Daviglus M.L., Giachello A.L., Schneiderman N., Raij L., Talavera G., Allison M., et al. Design and implementation of the hispanic community health study/study of Latinos. Ann. Epidemiol. 2010;20:629–641. doi: 10.1016/j.annepidem.2010.03.015. [DOI] [PMC free article] [PubMed] [Google Scholar]
- 45.Thompson L.R., Sanders J.G., McDonald D., Amir A., Ladau J., Locey K.J., Prill R.J., Tripathi A., Gibbons S.M., Ackermann G., et al. A communal catalogue reveals Earth’s multiscale microbial diversity. Nature. 2017;551:457–463. doi: 10.1038/nature24621. [DOI] [PMC free article] [PubMed] [Google Scholar]
- 46.Glenn T.C., Nilsen R.A., Kieran T.J., Sanders J.G., Bayona-Vásquez N.J., Finger J.W., Pierson T.W., Bentley K.E., Hoffberg S.L., Louha S., et al. Adapterama I: universal stubs and primers for 384 unique dual-indexed or 147, 456 combinatorially-indexed Illumina libraries (iTru & iNext) PeerJ. 2019;7:e7755. doi: 10.7717/peerj.7755. [DOI] [PMC free article] [PubMed] [Google Scholar]
- 47.Langmead B., Salzberg S.L. Fast gapped-read alignment with Bowtie 2. Nat. Methods. 2012;9:357–359. doi: 10.1038/nmeth.1923. [DOI] [PMC free article] [PubMed] [Google Scholar]
- 48.DeSantis T.Z., Hugenholtz P., Larsen N., Rojas M., Brodie E.L., Keller K., Huber T., Dalevi D., Hu P., Andersen G.L. Greengenes, a chimera-checked 16S rRNA gene database and workbench compatible with ARB. Appl. Environ. Microbiol. 2006;72:5069–5072. doi: 10.1128/AEM.03006-05. [DOI] [PMC free article] [PubMed] [Google Scholar]
- 49.McDonald D., Price M.N., Goodrich J., Nawrocki E.P., DeSantis T.Z., Probst A., Andersen G.L., Knight R., Hugenholtz P. An improved Greengenes taxonomy with explicit ranks for ecological and evolutionary analyses of bacteria and archaea. ISME J. 2012;6:610–618. doi: 10.1038/ismej.2011.139. [DOI] [PMC free article] [PubMed] [Google Scholar]
- 50.Abarenkov K., Henrik Nilsson R., Larsson K.H., Alexander I.J., Eberhardt U., Erland S., Høiland K., Kjøller R., Larsson E., Pennanen T., et al. The UNITE database for molecular identification of fungi–recent updates and future perspectives. New Phytol. 2010;186:281–285. doi: 10.1111/j.1469-8137.2009.03160.x. [DOI] [PubMed] [Google Scholar]
- 51.Mandal S., Van Treuren W., White R.A., Eggesbø M., Knight R., Peddada S.D. Analysis of composition of microbiomes: a novel method for studying microbial composition. Microb. Ecol. Health Dis. 2015;26:27663. doi: 10.3402/mehd.v26.27663. [DOI] [PMC free article] [PubMed] [Google Scholar]
- 52.R Core Team . 2013. R: A Language and Environment for Statistical Computing. [Google Scholar]
Associated Data
This section collects any data citations, data availability statements, or supplementary materials included in this article.
Supplementary Materials
Data Availability Statement
-
•
All original data, including the raw sequencing fastqs, the processed biom file and associated analyses code is available for download via Qiita under the project study ID 11666. Raw sequence data is additionally available at the European Nucleotide Archive database (project accession: ERP117287). The release candidate of the Greengenes2 database is available at its associated server (http://ftp.microbio.me/greengenes_release/2022.7-rc1/).
-
•
This paper does not report original code.
-
•
Any additional information required to reanalyze the data reported in this paper is available from the lead contact upon request.