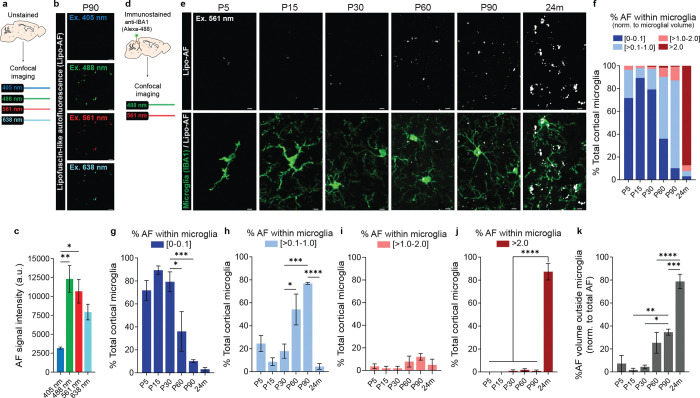
Figure 1. Cortical microglia accumulate lipofuscin-like autofluorescence (lipo-AF) throughout life.
a Method for assessing lipo-AF across laser lines in unstained tissue. b Representative images of lipo-AF signal in unstained tissue in the young adult P90 cortex. Scale bar = 5 μm. c Quantification of lipo-AF signal intensity across laser lines. Data presented as mean ± SEM, n = 3 mice. One-way ANOVA with Tukey multiple comparisons test (F = 9.711, df = 11); *p<0.05 **p<0.01. d Method for assessing lipo-AF within microglia. e Representative images of anti-IBA1 immunolabelled microglia (green) and lipo-AF (white) in the developing (P5, P15), young adult (P30, P60, P90), and aged (24 months) somatosensory cortex and neighboring visual and auditory cortices. The AF was excited by the 561 nm laser line. Scale bars = 5 μm. f Quantification of the percentage of cortical microglial with [0–0.1]% (dark blue), [>0.1–1.0]% (light blue), [>1.0–2.0]% (pink), or >2.0% (dark red) of their total volume occupied by lipo-AF. f Data represented as a mean, n = 4 mice P5–P90, n = 3 mice 24m. g-j The same data as f, but each bin is graphed separately. Data are presented as a mean ± SEM. One-way ANOVA with Tukey multiple comparisons test (g, F = 15.49, df = 22; h, F = 15.53, df = 22; i, F = 1.584, df = 22; j, F = 129.9, df = 22); *p<0.05 ***p<0.001 ****p<0.0001. k Quantification of the percentage of lipo-AF volume that is outside of microglia. Data represented as mean ± SEM, n = 4 mice P5–P90, n = 3 mice 24m. One-way ANOVA with Tukey multiple comparisons test (F = 24.51, df = 22); *p<0.05 **p<0.01 ***p<0.001 ****p<0.0001.

