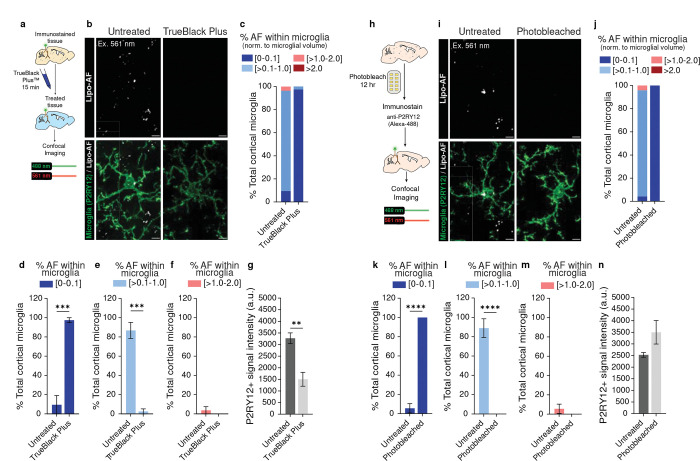
Figure 3. Methods to eliminate lipo-AF signal from mouse brain tissue.
a Methods for the post-immunostaining quenching protocol using the commercially available TrueBlack Plus™ (TBP) reagent. b Representative images of anti-P2RY12 immunolabelled microglia (green) and lipo-AF (white) in untreated or TBP-treated samples from P90 mouse cortex. Scale bars = 5 μm. c Quantification of the percentage of cortical microglial with [0–0.1]% (dark blue), [>0.1–1.0]% (light blue), [>1.0–2.0]% (pink), or >2.0% (dark red) of their total volume occupied by AF. Data are represented as the mean. d-f Same data as c, but each bin is graphed separately. Data are represented as a mean ± SEM, n = 3 mice. Two-tailed unpaired t-test (d, t = 8.912, df = 4; e, t = 9.679 , df = 4; f, t = 0.9982, df = 4); ***p<0.001. g Quantification of the intensity of the anti-P2RY12+ signal in untreated (dark gray bar) or TBP-treated (light gray bar) samples. Data are represented as a mean ± SEM, n = 3 mice. Two-tailed unpaired t-test (t = 4.698, df = 4); **p<0.01. h Schematic describing the pre-immunostaining photobleaching protocol. I Representative images of anti-P2RY12 immunolabelled microglia (green) and lipo-AF (white) in untreated or photobleached samples from P90 mouse cortex. Scale bars = 5 μm. j Quantification of the percentage of cortical microglial with [0–0.1]% (dark blue), [>0.1–1.0]% (light blue), [>1.0–2.0]% (pink), or >2.0% (dark red) of their total volume occupied by AF. Data are represented as a mean, n = 3 mice. k-m Same data as j, but each bin is graphed separately. Data represented as a mean ± SEM. Two-tailed unpaired t-test (k, t = 19.63, df = 6; l, t = 9.235, df = 6; m, t = 1.156, df = 6); ****p<0.0001. n Quantification of the intensity of the anti-P2RY12+ signal in untreated (dark gray bar) or photobleached (light gray bar) samples. Data presented as mean ± SEM, n = 4 mice. Two-tailed unpaired t-test (t = 1.886, df = 6).

