Abstract
Understanding the mechanism of energy homeostasis is expected to lead to effective treatment to obesity and metabolic diseases1,2. However, energy homeostasis is a complicated process largely controlled by neuronal circuits in the hypothalamus and brainstem3–5, whereas reward and motivation of food intake are mainly controlled by the limbic regions6 and cerebral cortex7,8. Although the limbic and hypothalamus connection like Nucleus Accumbens shell (NAcSh) to the lateral hypothalamus (LH) circuit has been reported to regulate feeding9,10, the neuron subtypes involved, and how do the humoral/neuronal signals coordinate to direct feeding behavior remain unknown. Here we show that the projection from dopamine receptor D1(Drd1)- and Serpinb2-expressing subtype to leptin receptor (LepR) expressing neurons in LH modulates food seeking and consumption. We demonstrate that the Serpinb2+ neuronal activity is dynamically modulated during feeding. Conversely, chemo/optogenetics-mediated modulation of Serpinb2+ neurons bidirectionally regulate food seeking and consumption. Importantly, circuitry stimulation revealed the NAcShSerpinb2→LHLepR projection controls refeeding and overcomes leptin-mediated feeding suppression. Ablation of NAcShSerpinb2 neurons could decrease body weight. Together, our study reveals a molecularly distinct accumbal-to-lateral hypothalamic neural circuit that controls internal state-dependent food consumption, which provides a promising therapeutic target for anorexia and obesity.
Keywords: Food intake, Nucleus accumbens, Serpinb2-expressing D1 neuron, motivation, Lateral hypothalamus, Leptin
The hypothalamus, with highly heterogenous neuronal composition11, plays a critical role in controlling feeding behavior12,13, where feeding related hormones, such as ghrelin and leptin, coordinately produce sensations of appetite and satiety leading to behavioral response14,15. Traditionally, people regard the arcuate nucleus (Arc) as a major location where LepR performs anorexic function by acting on leptin receptors (LepR) to suppress food intake and bodyweight gain16. In addition to the Arc, lateral hypothalamus (LH)17 also highly expresses LepR to play a similar role. However, the specific neuronal subtype targeting LHLepR neurons beyond hypothalamus to regulate feeding remain to be elucidate. In recent years, several studies have analyzed the role of mediodorsal NAcSh in feeding10,18,19 and revealed that activation of dopamine receptor 1 expressing medium spiny neurons (D1-MSNs)20,21 projections to LH9,10 stops ongoing food consumption. However, other studies showed that D1-MSNs activity was enhanced during appetitive phase22 as well as during consumption23. Although temporally distinct phases of feeding behavior, such as food seeking, food evaluation and consumption, could potentially account for such discrepancy, the neuronal heterogeneity of NAc24 could underlie the seemingly conflict feeding behavior as the different studies might have manipulated different neuron subtypes with opposing functions. With the application of single cell RNA-seq and spatial transcriptome techniques to decipher the neuron heterogeneity of different brain regions25–29, we could focus on different neuron subtypes located in the NAcSh implicated in feeding behavior9,10,19,22,30,31 to identify the neuron subtype(s) responsible for regulating feeding behavior.
Serpinb2+ neurons are activated in refeeding process
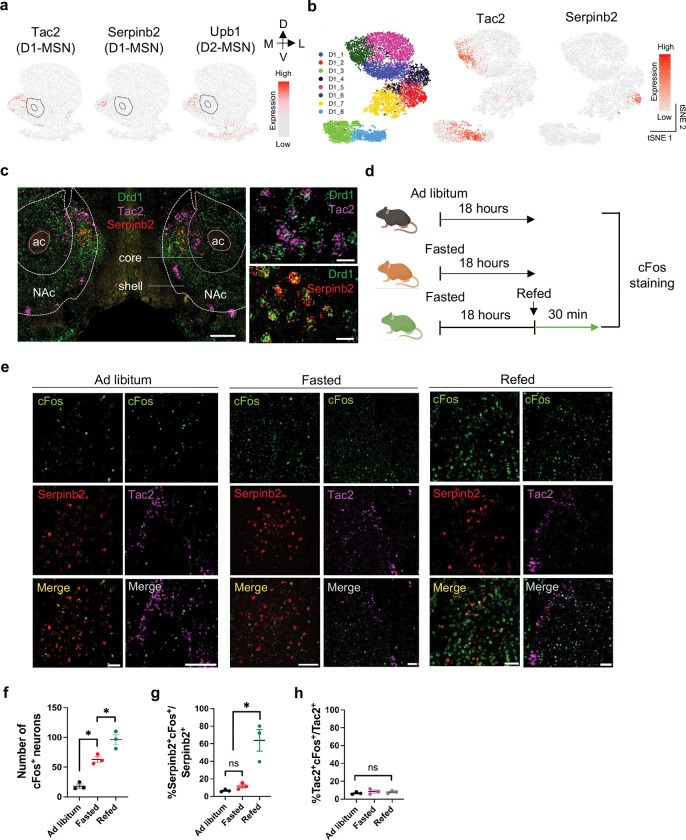
Using iSpatial32, an algorithm that integrates single cell transcriptome and spatial transcriptomic information24, we analyzed NAc MSN subtypes with medial dorsal NAcSh distribution. We found that the Tac2, serpinb2 and Upb1 MSN subtypes exhibit distinct distribution patterns in medial dorsal NAcSh (Fig. 1a). Since D1-MSNs, but not D2-MSNs, provide the dominant source of accumbal inhibition to LH with rapid control over feeding via LH GABA neurons19,22, we focused our effort on the Tac2 and Serpinb2 D1-MSN subtypes. tSNE plots of scRNA-seq result indicated that the Tac2+ neurons are mainly enriched in the D1-MSN subclusters 6 and 8, while Serpinb2+ neurons are enriched in D1-MSN subcluster 224 (Fig. 1b). RNA-FISH further confirmed that both Tac2 and Serpinb2 subtypes belong to D1-MSN (co-express Drd1) and are mainly localized to medial dorsal NAcSh (Fig. 1c). Consequently, Tac2+ and Serpinb2+ MSN subtypes are good candidates with potential in mediating feeding behavior.
Fig. 1: NAcSh Serpinb2+ neurons and NAc Drd1+-MSNs are activated in refeeding process.
a, Inferred spatial expression patterns from MERFISH database of Tac2, Serpinb2 and Ubp1 whose expression is highly enriched in medial dorsal NAc shell. Expression level is color-coded. Doted line circle anterior commissure olfactory limb (aco) and NAc core. The dorsal-ventral (DV) and medial-lateral (ML) axes are indicated.
b, Left, tSNE plot showing the 8 NAc D1-MSN subtypes. Middle and right panels indicate the expression of Tac2 and Serpinb2 in the NAc D1-MSNs, respectively. Expression level is color-coded.
c, RNA in situ hybridization showing Tac2 and Seprinb2 expression in the medial part of the NAc shell. Scale bar: 500 μm (left), 20 μm (right).
d, Schematic representation of the experimental design for the ad libitum, fast and refed groups.
e, Coexpression of Serpinb2 mRNA with cFos mRNA in NAc of ad libitum, fasted and refed states. Representative images showing the colocalization of cFos (green), Serpinb2 (red) and Tac2 (magenta) expressing neurons. Scale bar: 50 μm.
f, The average number of cFos+ neurons in the dorsal medial NAcSh at ad libitum, fasted and refed states. (n = 5 sections from three mice of each group, one-way ANOVA, with Tukey’s multiple comparisons).
g, The percentages of activated Serpinb2-expressing neurons in the total Serpinb2 neurons under different feeding states (n = 5 sections from three mice of each group, one-way ANOVA, with Tukey’s multiple comparisons).
h, The percentages of activated Tac2-expressing neurons in the total Tac2 neurons under different feeding states (n = 5 sections from three mice of each group, one-way ANOVA, with Tukey’s multiple comparisons). All error bars represent mean ± SEM. ns, not significant, *P < 0.05.
To determine whether Tac2+ and Serpinb2+ MSN subtypes can mediate feeding behavior, we first asked whether the activities of these neurons respond to feeding behavior by monitoring the cFos expression under three conditions: ad libitum access to food, after 18 hours of fast, and refeeding (Fig. 1d). By counting cFos+ neurons that co-express Serpinb2 or Tac2 in the medial dorsal NAcSh under Ad libitum, fast and refed conditions (Fig. 1e), we determined whether the Serpinb2 and Tac2 neurons respond to the different feeding status. We found fasting and refeeding both increased neuronal activities compared to Ad libitum as indicated by the increased cFos+ neuron numbers (Fig. 1f). Importantly, most of the Serpinb2+ neurons (~70%) were activated by refeeding, but not fasting (Fig. 1g). In contrast, the Tac2+ neurons do not respond to refeeding or fasting (Fig. 1h). Collectively, these data indicate that the majority of Serpinb2+ neurons respond to refeeding process.
The Serpinb2+ neurons respond to eating behavior
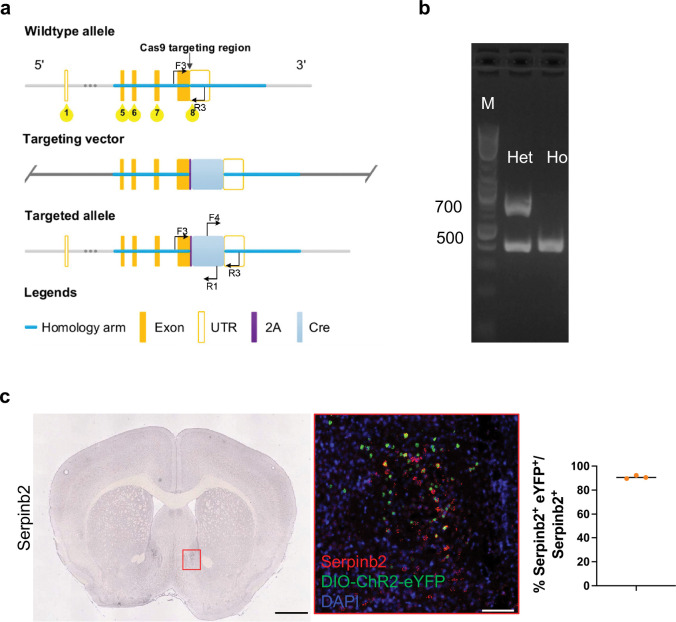
To facilitate studying the role of Serpinb2+ neurons in the feeding process, we generated a Serpinb2-Cre mouse line (Extended Data Fig. 1a,b). We validated this mouse model by injecting a Cre-dependent AAV vector expressing light-gated cation channel channelrhodopsin (ChR2) and observed about 90% colocalization of Serpinb2::ChR2-eYFP signal with endogenous Serpinb2 mRNA signal (Extended Data Fig. 1c), which is consistent with endogenous Serpinb2 expression in the NAcSh as shown by Allen Brain Atlas. Thus, our Serpinb2-Cre mouse line can be used for studying Serpinb2+ neurons.
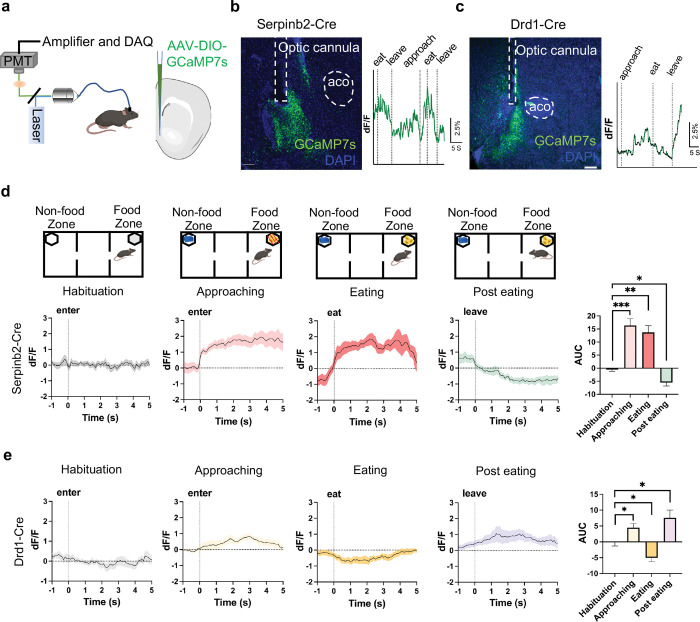
To test whether Serpinb2+ neurons are involved in regulating feeding, we used fiber photometry to monitor Serpinb2+ neuronal activity during food seeking and consumption. To this end, we inserted an optic cannula into the NAcSh to record the total Serpinb2+ neuronal activity (reflected by calcium reporter fluorescence intensity) by stereotaxic injection of a Cre-dependent AAV expressing the seventh-generation calcium reporter GCaMP7s into the NAcSh region of the Serpinb2-Cre mice. In parallel, we also implanted cannula to the Drd1-Cre mice for comparative study (Fig. 2a). Three weeks after the viral injection, we performed fluorescence recording during the feeding process. To monitor the activity dynamics of the Serpinb2+ neurons, we designed 3-chamber food seeking and food consumption assay (Fig. 2d) and aligned calcium traces of mice with behavioral events that include habituation, food zone approaching, eating, and leaving (Fig. 2b, c). First, we recorded the Ca2+ signals during the different feeding phases after the mice were fasted overnight. In habituation phase, mice were allowed to freely travel among the 3 chambers and we detected negligible response when mice approach the two empty food cups (Fig. 2d, first graph). In food approaching phase, when mice enter the food zone to interact with caged food pellets, the activity of the Serpinb2+ neurons increased immediately when mice entered the food zone and lasted for seconds (Fig. 2d, second graph), indicating that Serpinb2+ neurons respond to appetitive food seeking. In the eating phase, we observed a significant increase of Ca2+ signals when mice start eating the food (Fig. 2d, 3rd graph), and subsequently, declined to lower than baseline level after eating finished. Usually, mice turned away and left the food zone (Fig. 2d, 4th graphs).
Fig. 2: The activity of Serpinb2+ neurons respond to feeding states.
a, Left, illustration of light pathways of fiber photometry. Right, schematic illustration of the GCaMP7s injection and optic cannula implantation.
b, c, Validation of GCaMP7s expression and implantation of optic cannula in Serpinb2-Cre mice (b) or Drd1-Cre mice (c) (left). Representative trace of real-time monitoring of Serpinb2+ neurons (b) or Drd1+ neurons (c) (right) during feeding process. Scale bar: 200 μm.
d, Ca2+ signals at different phases of feeding process of fasted mice (top). Average Ca2+ signal at different feeding phases of the Serpinb2-Cre mice. Elevated Ca2+ signals were observed after entering food zone in approaching and eating phases. Declined Ca2+ signals were observed post eating. Quantification of AUC in the four phases is shown in bar graph (right, n=7).
e, The same as in panel D except Drd1-Cre mice were used. ***P ≤ 0.001, **P ≤ 0.01, *P ≤ 0.05; ns, P > 0.05, one-way ANOVA test. Data are represented as mean ± SEM.
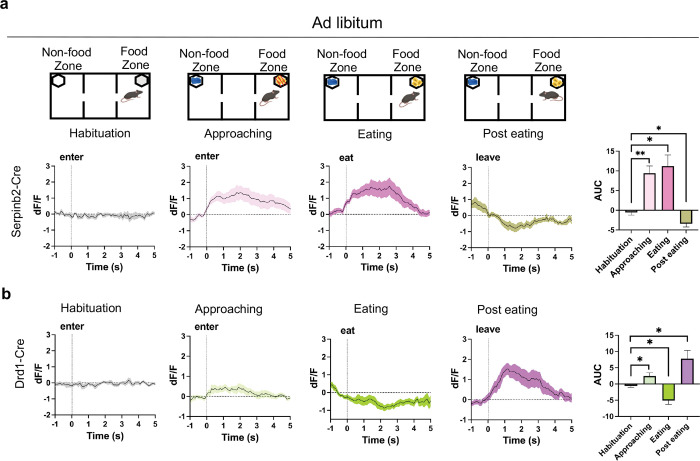
To quantify the total Serpinb2+ neuronal activity at different phases, we calculated the area under curve index (AUC) of the calcium signal curve for each trial. We find that the AUC is significantly higher in the food zone approaching and eating phases and lower in the post eating phases compared with that of habituation (Fig. 2d, right panel). In parallel experiments with the Drd1-Cre mice, we observed Ca2+ signal tended to increase when approach to food zone (Fig. 2e, second graph) and reduce during consumption (Fig. 2e, 3rd graph). After eating, Drd1+ neuronal activity increased concomitantly (Fig. 2e, 4th graphs). Similar results were also observed in ad libitum status (Extended Data Fig. 2). These results indicate that Serpinb2+ neurons function differently from other Drd1+ neurons especially in appetitive and consumption phases.
Serpinb2+ neurons bidirectionally regulate food intake in hungry state
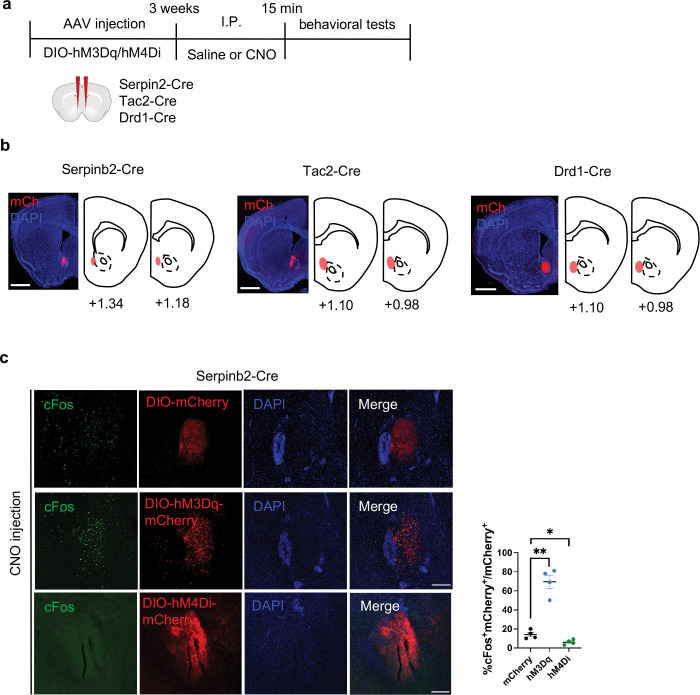
To determine whether Serpinb2+ neuronal activity plays a causal role in regulating feeding behavior, we asked whether the feeding behavior can be changed by manipulating Serpinb2+ neurons’ activity. To this end, we applied chemogenetic techniques33 to the Serpinb2-Cre mice by injecting the activating AAV encoding a modified human M3 muscarinic receptor (hM3Dq) or the inhibitory vector AAV-DIO-hM4Di-mCherry into the NAcSh region. As controls, we also performed parallel experiments using Tac2-Cre and Drd1-Cre mice (Extended Data Fig. 3a). We first confirmed the accuracy of the injection site (Extended Data Fig. 3b), then the efficiency of the activation and inhibition with cFos expression (Extended Data Fig. 3c).
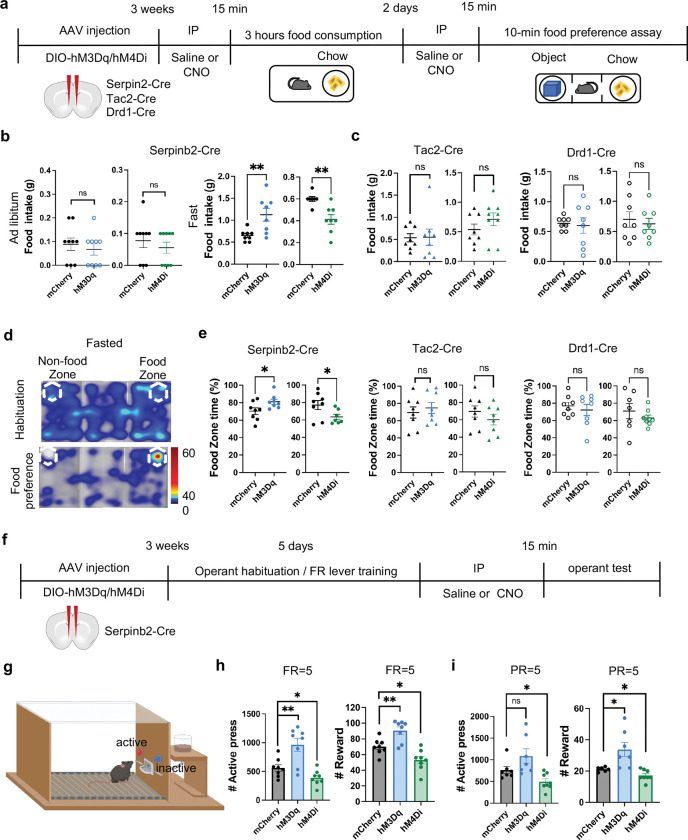
We then tested whether activation or inhibition of the Serpinb2+ neurons affect feeding and reward-related behaviors (Fig. 3a). Interestingly, under Ad libitum conditions, manipulation of the Serpinb2+ neuronal activity does not affect food intake (Fig. 3b, left panel), indicating that the eating behavior under Ad libitum maybe controlled by other neurons. Next, we performed the same test using fasted mice to analyze total food consumption during refeeding (Fig. 3a–c). We found that activation of the Serpinb2+ neurons increased food consumption, while inhibition of the Serpinb2+ neurons decreased food consumption (Fig. 3b, right panel). However, similar manipulation on Tac2-Cre or Drd1-Cre mice did not affect food consumption (Fig. 3c). In addition to the total food consumption, we also analyzed food preference indicated by the time spent in the food zone (Fig. 3c). As expected, fasted mice would significantly increase their time spent in the food zone for the control mouse group (Fig. 3d). Importantly, activation (hM3Dq) or inhibition (hM4Di) the Serpinb2+ neurons respectively increased or decreased the time the mice spent in the food zone compared to that of the control mice (Fig. 3e). In contrast, similar manipulation of the Tac2-Cre or Drd1-Cre mice showed no such effect compared to that in the control mice (Fig. 3e). These results indicate that manipulation the Serpinb2+ neuronal activity can regulate food seeking and intaking behavior in hungry state.
Fig. 3: Serpinb2+ neurons bidirectionally regulate food seek and intake in hungry state.
a, Experimental scheme of the food consumption and food preference assays.
b, Total food consumption during the 3-hour test. Chemogenetic activation (hM3Dq) or chemogenetic inhibition (hM4Di) of Serpinb2+ neurons at ad libitum (left) or fasting state (right). **, p<0.01; ns, p>0.05, unpaired t-test.
c, The same as in panel B except the Tac2-Cre (left) or Drd1-Cre (right) mice were used. ns, p>0.05, unpaired t-test.
d, Color map encoding spatial location of a fasted mouse using the free access feeding paradigm. e, Percentage of time that mice spent in food zone. Chemogenetic activation (hM3Dq) or chemogenetic inhibition (hM4Di) of Serpinb2+ neurons (left), Tac2+ neurons (middle), and Drd1+ neurons (right). *, p<0.05; ns, p>0.05, unpaired t-test.
f, Experimental timeline of the food operant chamber assay.
g, Diagrammatic illustration of the food operant chamber paradigm. Mice were trained to press the lever to get food; pressing the active lever is followed by the delivery of food pellet, while pressing the inactive lever yields no outcome. The behavioral training includes habituation phase and fixed ratio (FR) training phase. Mice received CNO injection (2 mg/kg for the hM3Dq group and 5 mg/kg for the hM4Di group) 15 mins before they were placed into the operant chamber to start the FR and progressive ratio (PR) tests.
h, Results of FR=5 test. The total number of active lever pressing (left) and total number of reward (right) after chemogenetic manipulations. **, p<0.01; *, p<0.05; ns, p>0.05; one-way ANOVA test.
i, Results of PR=5 test. The total number of active lever pressing (left) and total number of reward (right) after chemogenetic manipulations. *, p<0.05; ns, p>0.05; one-way ANOVA test.
Data are represented as mean ± SEM.
To further determine whether the neuronal activity of the Serpinb2+ neurons has a causal role in regulating food motivation, we next carried out food operant chamber test (Fig. 3f, g). To maintain a similar food motivation status, all mice were food restricted to reduce body weight to around 90% of their original value. After trained to operantly respond to sweetened chow pellets on fixed ratio (FR) 1, 3, 5 schedule, the animals were then tested for lever pressing upon CNO-induced chemogenetic manipulation. For the FR5 test, Serpinb2+ neuron activation significantly increased the active lever pressing and pellet reward (Fig. 3h), while Serpinb2+ neuron inhibition elicited the opposite effect (Fig. 3h). For the progressive ratio (PR) 5 test, Serpinb2+ neuron activation showed a tendency of increased number of active lever pressing and significantly increased pellet reward (Fig. 3i), while Serpinb2+ neuron inhibition decreased both the total active lever pressing and the reward (Fig. 3i). Taken together, these results demonstrate that the Serpinb2+ neurons are involved in bidirectional control of goal-direct food seeking behavior.
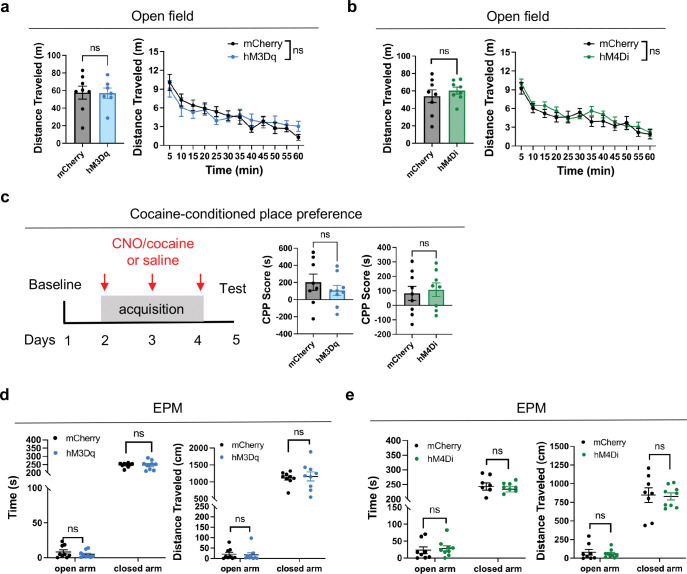
NAc shell is also known to regulate anxiety34 and drug reward35,36. Thus, we asked whether Serpinb2+ neurons also regulate these behaviors under the same chemogenetic manipulation. We found that manipulation of Serpinb2+ neuronal activity does not affect locomotion in open field test (Extended Data Fig. 4a,b), or drug reward in cocaine conditioned place preference (CPP) test (Extended Data Fig. 4c), or anxiety in elevated plus maze (EPM) test (Extended Data Fig. 4d,e). Taken together, these results support that Serpinb2+ neurons are specifically involved in food refeeding process, but not involved in locomotion, anxiety or drug seeking behaviors.
Serpinb2+ neurons mediate food consumption via LH projection
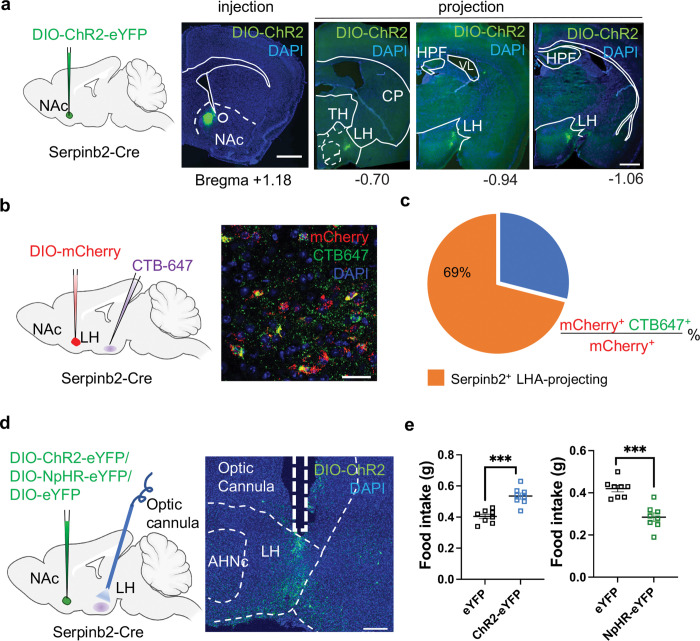
Thus far, characterization of the Serpinb2+ neurons was at the somatic level in NAcSh. Next, we attempt to understand how the Serpinb2+ neurons regulate food taking behavior at the circuit level. Previous studies have indicated that NAcSh D1-MSNs could project to multiple brain regions, including ventral tegmental area (VTA)37, ventral pallidum (VP)38, and bed nucleus stria terminalis (BNST)39. To determine the projection site of Serpinb2+ neurons, we performed anterograde tracing by injecting Cre-dependent AAVs expressing ChR2(H134R) into the NAcSh of the Serpinb2-Cre mice (Fig. 4a). Analysis of the brain slices after 3 weeks of virus injection revealed that the Serpinb2+ neurons only project to lateral hypothalamus (LH) (Fig. 4a). To further validate this projection, we injected the widely used retrograde tracer Cholera toxin subunit B (CTB) 40 into the LH region (Fig. 4b), and observed colocalization of CTB with mCherry in the NAcSh after immunostaining of NAcSh from the Serpinb2-Cre mice (Fig. 4b, c), supporting the NAcSh to the LH projection.
Fig. 4: Serpinb2+ neurons mediate food intake via LH projection.
a, Diagram of antegrade tracing of the NAc Serpinb2+ neurons with ChR2-EYFP (left), the expression of DIO-ChR2-EYFP in the NAcSh (2nd panel), and Serpinb2+ neuron projection to LH (the right 3 panels). Scale bar: 100 μm.
b, Diagram (left) and image (right) of retrograde tracing of LH neurons with CTB 647, with the Serpinb2+ neurons labeled by DIO-mCherry. Scale bar: 50 μm.
c, Percentage of Serpinb2+ LH projecting neurons over the total mCherry labeled Serpinb2+ neurons.
d, Diagram illustrate the indicated AAV injection into NAc and optic cannulas implantation in LH area (left), and histology validating virus expression and cannula implantation site (right). Scale bar: 200 μm.
e, Optogenetic activation (left) or inhibition (right) of Serpinb2+ NAc→LH neurons respectively increased or decreased food intake.
Data in (e) is presented as mean ± SEM. TH, thalamus, CP, caudoputamen, AHNc: anterior hypothalamic nucleus, central part, HPF, hippocampal formation, VL, lateral ventricle. ***P ≤ 0.001; *P ≤ 0.05; ns, P > 0.05, unpaired t-test.
To demonstrate that the NAcSh to the LH projection of the Serpinb2+ neurons is functionally relevant to food intaking, we asked whether optogenetic manipulation of the Serpinb2+ neuron terminals in LH can change the feeding behavior of the Serpinb2-Cre mice. To this end, DIO-ChR2-eYFP or DIO-NpHR-eYFP AAV viruses were injected to the NAcSh of the Serpinb2 -Cre mice with optic cannula implanted into their LH region (Fig. 4d). After fasting the mice for overnight, we activated the Serpinb2+ neuron terminals in the LH with blue light on-off stimulation (20 Hz, 2-ms pulses). We found that mice with the Serpinb2+ neuron terminal stimulation significantly increased their food intake in 20 mins compared to the control mice that express eYFP (Fig. 4e, left panel). Conversely, Serpinb2+ neuron terminal inhibition in the LH with yellow on-off stimulation (20 Hz, 2-ms pulses) decreased total food intake when compared with the control (Fig. 4e, right panel). Collectively, viral tracing and circuit manipulation demonstrate that the NAcSh to LH projecting Serpinb2+ neurons have an important function in regulating food intaking behaviors.
Serpinb2+ neurons form a circuit with LH LepR+ GABA+ neurons
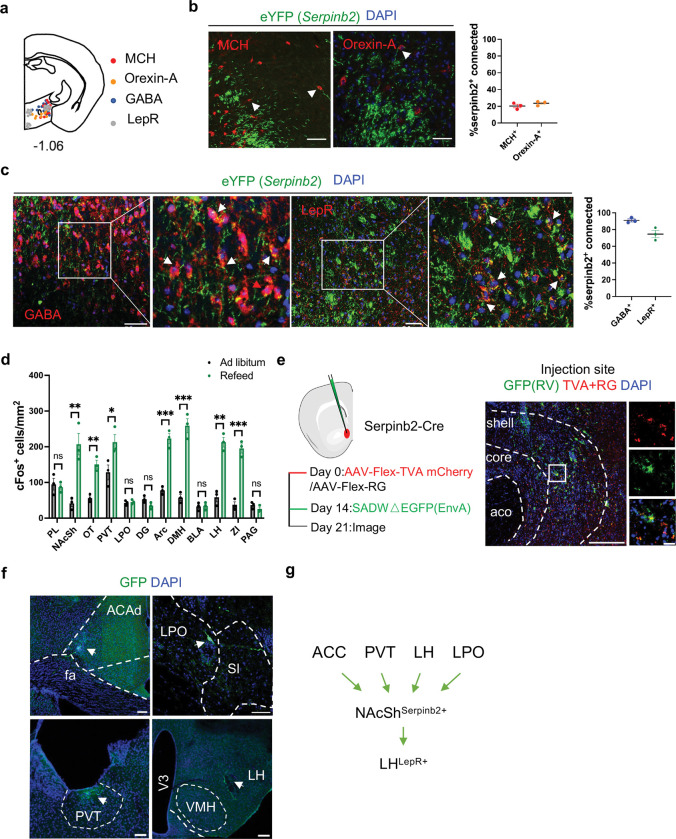
Having demonstrated the functional importance of the NAcSh to LH projection, we next attempted to determine the neuron types in LH that receive signals from the Serpinb2+ neurons. The LH is a highly heterogeneous brain region controlling food intake, energy expenditure, and many other physiological functions41. Since neural peptides orexin/hypocretin and melanin-concentrating hormone (MCH) are associated with feeding42,43, and are mainly express in LH, we first asked whether they are the down-stream targets of the NAcSh Serpinb2+ neurons. To this end, we injected the AAV-DIO-ChR2 anterograde viruses to the NAcSh of the Serpinb2 -Cre mice and performed immunostaining of candidate neural peptides or transmitters on slices covering the LH (Fig. 5a). We found very few MCH- or orexin-expressing neurons in LH overlapped with Serpinb2+ terminals (Fig. 5b, indicated by arrow heads). Given that GABAergic neuron is the major subtype in the LH and has been reported to be involved in feeding and leptin-regulated energy homogenesis 11,44,45, we next checked whether leptin receptor (LepR) positive GABAergic neurons17 receive projections from NAcSh Serpinb2+ neurons by similar immunostaining. We found over 70% Serpinb2+ neuron terminals overlap with LepR+ GABA+ neurons (Fig. 5c). This data indicates that the NAcSh Serpinb2+ neurons mainly project to LepR+ GABA+ neurons in LH.
Fig. 5: Serpinb2+ neurons project to LH LepR+ GABA+ neurons and receive input related to energy homeostasis.
a, Diagram indicating the MCH+, Orexin-A+, GABA+ and LepR+ neurons in LH.
b, Images (left two panels) showing colocalization of Serpinb2+ neuron terminals (green) with MCH+, Orexin-A+ neurons in LH, and their quantifications (right panel). Scale bar, 50 μm. Percentage = eYFP+MCH+/eYFP+DAPI+ or eYFP+Orexin-A+/eYFP+DAPI+
c, Images showing the colocalization of Serpinb2+ neuron terminals (green) with GABA+ (red) or LepR+ neurons (red) as indicated, as well as their quantifications (right panel). Scale bar, 50 μm. Percentage = eYFP+GABA+/eYFP+DAPI+ or eYFP+LepR+/eYFP+DAPI+
d, Quantification of cFos+ cells of different brain regions in ad libitum and refeed status. (n = 3 sections from three mice of each group, unpaired t-test)
e, Schematic presentation of modified rabies tracing (left) and representative image confirming the expression of the indicated proteins at the injection site (right); scale bar, 100 μm (left); 20μm (right).
f, Representative images showing the brain areas with positive signals indicating these regions have neurons projecting to Serpinb2+ neurons. Scale bar: 100 μm, arrow heads indicate neurons.
g, Diagram illustrating brain regions upstream and downstream of Serpinb2+ neurons.
ACAd: Anterior cingulate area, dorsal part; fa, corpus callosum, anterior forceps; LPO: lateral preoptic area; SI: substantia innominata; PVT: paraventricular nucleus of the thalamus; VMH: ventromedial hypothalamic nucleus; LH: lateral hypothalamus; V3: third ventricle.
To identify the brain regions that response to refeeding, we performed whole brain cFos mapping on the refeeding mice. By postmortem immunostaining, we found cFos expression was increased in multiple brain regions compared with that of ad libitum, like NAc, Olfactory tubercle (OT), paraventricular nucleus of the thalamus (PVT), Arc, Dorsomedial nucleus of the hypothalamus (DMH), LH and Zona incerta (ZI) (Fig. 5d, Extended Data Fig. 5). We next attempted to identify inputs for the NAcSh Serpinb2+ neurons by performing a modified rabies tracing experiment. To this end, the Cre-inducible avian sarcoma leucosis virus glycoprotein EnvA receptor (TVA) and rabies virus envelope glycoprotein (RG) were injected unilaterally to the NAcSh of Serpinb2-Cre mice (Fig. 5e) to allow monosynaptic retrograde transportation and rabies virus infection in the starter neurons, respectively37,46,47. Two weeks later, the modified rabies virus SADDG-EGFP (EnvA) was injected unilaterally into the NAcSh and slices of the whole brain were imaged one week later. Confocal imaging results indicated that EGFP-labeled neurons can be found in anterior cingulate area (ACA), PVT, LH, and lateral preoptic area (LPO) (Fig. 5f, Extended Data Fig. 6), indicating that neurons in these regions send monosynaptic projection to NAcSh to form a network regulating food consumption (Fig. 5g).
Combining the major efferent regions with cFos mapping (Fig. 5d, f), PVT may serve as a major input for Serpinb2+ neurons in NAcSh to regulate food seeking and taking. Collectively, our study uncovered a neuronal network where the NAcSh Serpinb2+ neurons may receive signals from PVT neurons to inhibit the LepR+GABA+ neurons in LH, to regulate food seeking and eating behaviors.
Modulating Serpinb2+ neuronal activity can overcome leptin effect and alter bodyweight
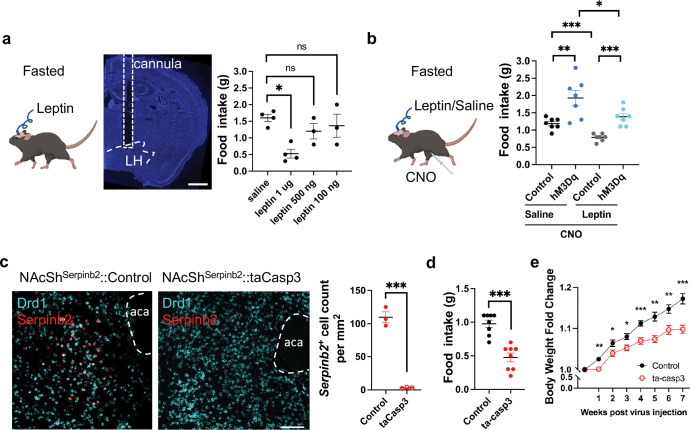
As an adipose-derived hormone, leptin plays a central role in regulating energy homeostasis48–50. Leptin performs most of its functions, including suppression of food intaking, by activating the LepR on central nerve system (CNS) neurons51,52. Since the NAcSh Serpinb2+ neurons are projected to LepR+ GABAergic neurons in LH (Fig. 5c), we anticipate that both leptin and the NAcSh Serpinb2+ neurons have shared neuron targets and consequently they should have functional interaction. To analyze their functional interaction in food intaking, we implanted catheter in the LH for leptin delivery (catheter administration) on the Serpinb2-Cre mice that were also injected with hM3Dq-mCherry-expressing AAV into the NAcSh so that the NAcSh Serpinb2+ neurons can be activated by CNO by i.p. injection. First, we established that 1 μg of bilateral intra-LH leptin cannula delivery53 significantly decreased food intake in 3 hours compared to the control with saline treatment (Fig. 6a). Then we used 1 μg of leptin for all the following tests. As we have shown previously (Fig. 3b), CNO-induced Serpinb2+ neuron activation increased food intake (Fig. 6b). Importantly, although leptin delivery reduced the food intake, the leptin effect can be at least partly overcome by CNO-induced Serpinb2+ neuron activation (Fig. 6b). This data indicates that Serpinb2+ neurons’ innervation to LH can at least partly overcome leptin’s inhibitory effect on food intake.
Fig. 6: Modulating Serpinb2+ neuron activity can overcome leptin effect and alter bodyweight.
a, Diagram showing bilateral cannula implantation in LH for leptin delivery (left). CNO delivery was achieved via i.p. injection. Results of total food consumption in 3 hours by fasted mice with different doses of leptin administration. Scale bar: 500 μm.
b, Same as panel A except food consumption is quantified under different conditions with or without Serpinb2+ neuron activation in the presence or absence of 1 μg of leptin delivery. ***P ≤ 0.001, **P ≤ 0.01, *P ≤ 0.05; ns, P > 0.05, unpaired t-test.
c, FISH and quantification verify Serpinb2+ neuron ablation after AAV-DIO-taCasp3 injection. Scale bar: 100 μm. ***P ≤ 0.001, unpaired t-test.
d, Serpinb2+ neuron ablation decreased 3 hours total food consumption by mice. ***P ≤ 0.001, unpaired t-test.
e, Serpinb2+ neuron ablation has a long-time effect on bodyweight loss. ***P ≤ 0.001, **P ≤ 0.01, *P ≤ 0.05; ns, P > 0.05, unpaired t-test.
Data are presented as means ± SEM.
To access whether loss function of the Serpinb2+ neurons can exert a long-term effect on energy homeostasis, we selectively ablated NAcSh Serpinb2+neurons in Serpinb2-Cre mice by injecting a flex-taCasp3-TEVp AAV expressing caspase-3 which eliminates the neurons by inducing cell death (Fig. 6c). NAcSh Serpinb2+ neurons ablation decreased food intake (Fig. 6d) as well as reduced body weight gain by 10% in 7 weeks (Fig. 6e). Together, these results demonstrate that transient change in Serpinb2+ neuronal activity could alter food seeking and consumption behaviors. Modulating Serpinb2+ neuronal activity could partly overcome leptin effect to maintain energy homeostasis, and ablation of Serpinb2+ neurons can lead to bodyweight loss.
Discussion
Feeding is an essential goal-directed behavior that is heavily influenced by homeostatic state and motivation. The accumbal-to-lateral hypothalamic pathway has been implicated in regulating feeding behavior, but the specific neuron subtypes and precise neuronal circuit in LH are not clear. In this study, we filled in this knowledge gap by delineating a circuit which integrates neuronal and humoral signal to regulate food consumption in an innate energy state-dependent manner. Specifically, we identified a D1-MSN subtype located in the NAcSh and expresses Serpinb2 to regulate the feeding behavior through a neuronal circuit involving NAcShSerpinb2→LHLepR that is beyond the hypothalamus. We demonstrate that the Serpinb2+ neurons bidirectionally modulate food motivation and consumption specifically in hungry state. Importantly, Serpinb2+ neurons target the LepR expressing GABAergic neurons in LH and their activation can at least partly overcome the suppressive effect of leptin on food intaking, and whose ablation can chronically cause bodyweight loss.
The Serpinb2+ neurons are functionally distinct from the pan D1-MSNs in NAcSh
Previous studies have observed reduced D1 firing during food consumption, and consistently, suppressing D1-MSNs activity prolonged food intake19. Using Serpinb2-Cre and Drd1-Cre mice, we compared the Serpinb2+ MSNs neurons and the D1-MSNs in regulating feeding behaviors (Fig. 2, 3), and found their manipulation have different outcomes. First, Serpinb2+ neurons are activated by both food approaching and food consumption, while D1+ neurons show bi-phasic response, activated during food approaching but suppressed during food consumption. Second, Serpinb2+ neurons bidirectionally regulate food seeking and intake, particularly during refeeding, while D1+ neuron manipulation does not significantly alter feeding behavior. On the other hand, a previous study showed that D1+ neuron inhibition promoted liquid fat food intake19. This difference might be due to the different feeding assays used in the two studies, while we used free-access chow food intake, the previous study used a head-fixed mice licking liquid fat food as the assay19. Third, Serpinb2+ neuron ablation significantly reduced food intake (Fig. 6), which is consistent with our finding that SerpinB2+ neuron activation positively regulates food intake (Fig. 3). However, a previous study indicated that lesions or inactivation of the NAc neurons do not significantly alter the food consumption54. We do not consider these results to be in conflict as NAc is composed of many D1- and D2-MSN neuron subtypes, of which many are not involved in regulating food intake, while others can positively or negatively regulate food intake. Consequently, manipulating Serpinb2+ neurons and the entire NAc neurons can have totally different outcomes. This further indicates that finer granularity and cell type-specific approaches are needed to dissect the function of different neuron subtypes in NAc. For example, although the D2+ neuronal activity as a whole is not altered during food consumption19,22, the D2 receptors are indeed downregulated in obese rodent as well as human55,56, whether certain D2-MSN subtypes are involved in regulating food intake remains to be determined.
Serpinb2+ and Tac2+ MSNs respectively modulate food and drug reward
The NAcSh has long been implicated in regulating reward-related behaviors that are associated with food, social, and drug. Previous studies were mainly based on dichotomous MSNs subtypes that express dopamine receptor 1 or dopamine receptor 2 (D1- or D2-MSNs)57. Increasing evidence suggest that the NAcSh is highly heterogeneous in terms of the molecular features and anatomical connections of the neurons located in this region. This raises an interesting question that whether these reward-related behaviors are regulated by distinct or overlap neuron subtypes and/or projections. By combining iSpatial analysis, cFos mapping, neuronal activity manipulation of different subtypes, and behavioral tests, we found that the Serpinb2+ D1-MSNs of NAcSh specifically regulate food reward, but not drug reward or other emotional and cognitive functions (Fig. 1, 3, Extended Data Fig. 4). On the other hand, we have previously showed that the Tac2+ D1-MSNs of NAcSh specifically regulate cocaine reward58. These studies indicate that different reward behaviors are at least partly regulated by distinct MSNs subtypes. An important task for future studies will be to identify the relevant neuron subtypes regulating the various reward-related behaviors, and eventually to link the cellular heterogeneity to functional diversity of each brain regions. This way, the cellular and circuit mechanisms underlying the various behaviors can be elucidated.
The PVT- NAcSh Serpinb2+ -LH LepR+ circuit controls feeding in hungry state
Previous studies have shown that either LH GABA or Vglut2 neuronal subpopulation can receive NAc innervation19,59. However, the LH GABA and Vglut2 neurons are extremely heterogeneous, and can be further divided into 15 distinct populations, respectively60. Thus, the specific cell types that receive NAc innervation were unknown. Previous studies also showed that NAcSh D1- MSN to LH inhibitory transmission stops eating, and endocannabinoids mediated suppression of this projection promotes excessive eating of highly palatable chow61, but the D1 subtype involved in this projection was not known. Using viral tracing, we discovered that the NAcSh Serpinb2+ D1-MSNs project to LepR+ neurons in LH underlying the Serpinb2+ neuron function in food intake (Fig. 6c). Distributed in numerous regions involved in the regulation of energy balance, the LepR+ neurons lie in the mediobasal hypothalamic (MBH) “satiety centers” and in LH that is regarded as the “feeding center”50,62. Leptin treatment induced cFos expression and 100 nM of leptin depolarized 34% of LepR-expressing neurons in LH17. Unilateral intra-LH leptin decreased food intake and bodyweight17. In our study, we found activation of the Serpinb2+ neurons increased the inhibition of the LepR+ neurons excitability, resulting in increased food consumption; while inhibition of Serpinb2+ neurons decreased the inhibition of LepR+ neurons excitability, leading to decreased food consumption even after fasting (Fig. 3b, 4e). Our results are consistent with previous reports demonstrating that LH LepR neuron activation decreased chow intake63. Importantly, manipulating Serpinb2+ neuronal activity could override leptin’s effect in LH to modulate food consumption (Fig. 6b). It is not clear whether the lack of effect of the Serpinb2+ neurons on feeding behavior in ad libitum is due to the lack of food taking motivation or the relatively high leptin level masked the Serpinb2+ neuron effect. Alternatively, it is possible that the endocannabinoid and leptin signaling may interact in LH, where activation of NAcSh Serpinb2+ neurons suppresses LepR neurons in the LH, which may increase the synthesis and release of endocannabinoids64 and thus promote feeding. Our study thus reveals a parallel and compensatory circuit from NAcSh to LHLepR, which is beyond the hypothalamus circuit that directly modulates food intake, to maintain energy homeostasis.
For the efferent site, Serpinb2+ neurons majorly receive input from PVT based on the GFP+ cell numbers (Fig. 5f), which is believed to be an integration hub processing information and sending “command” to the downstream targets65–67. Previous studies revealed that the Slc2a2+ neurons in PVT are activated by hypoglycemia and their activation by optogenetics increases motivated sucrose seeking behavior68. On the other hand, the Gck+ neurons in PVT have the opposite glucose sensing property as their optogenetic activation decreased sucrose seeking behavior69. Taken together, we believe that in hungry state, PVT receives the “hungry signal” and send it to Serpinb2+ neurons. The activated Serpinb2+ neurons then instruct the LH LepR+ neurons to promote eating. This PVT- NAcSh Serpinb2+ -LH LepR+ circuit controls feeding in hungry stage and strengthens the sentinel role of NAcSh19,70.
Serpinb2+ neurons connect energy homeostasis and motivation
Feeding is an essential goal-directed behavior that is influenced by cellular homeostasis state and appetitive motivation. Interestingly, we found that Serpinb2+ neurons promote feeding in hunger state, rather than in normal feeding state, suggesting that Serpinb2+ neuron function is regulated in an internal metabolic state-dependent manner. Consistently, ablation of Serpinb2+ neurons significantly reduced food intake and leading to bodyweight loss (Fig. 6e,f). The Serpinb2+ neurons are activated by both appetitive food approaching and food consumption. To measure appetitive food motivation, we conducted operant food intake assay, where mice need to press levers to earn food pellets. We found that Serpinb2+ neuronal activity bi-directionally regulates active lever presses and the earned reward (Fig. 3h,i). These studies suggested that Serpinb2+ neurons regulate both energy homeostasis and appetitive motivation which is consistent with the demonstrated function of NAc in integrating descending signals pertaining to homeostatic needs and goal-related behaviors3,71. Collectively, these data indicate that lose function of the NAcSh Serpinb2+ neurons can disrupt energy homeostasis and appetitive motivation, which provides a potential therapeutic target for obese treatment. Conversely, activation of the NAcSh Serpinb2+ neurons can be a potential strategy for anorexia treatment.
In conclusion, we identified a molecularly defined neuron population with crucial functions in regulating food intake via neuron-hormone axis. From a therapeutic point of view, our findings are highly relevant because activating or ablating a small population of molecularly defined neurons could respectively rescue food intake at low energy status or lead to long-term bodyweight loss. Given its function, we believe the small population of NAcSh Serpinb2+ neurons is an ideal entry point for understanding the complex brain-metabolism regulatory network underlying eating and bodyweight control.
Methods
Mice
All experiments were conducted in accordance with the National Institute of Health Guide for Care and Use of Laboratory Animals and approved by the Institutional Animal Care and Use Committee (IACUC) of Boston Children’s Hospital and Harvard Medical School. The Serpinb2-Cre mice were generated as described below. For behavioral assays, 12 –16 weeks old male mice were used. The mice were housed in groups (3–5 mice/cage) in a 12-hr light/dark cycle, with food and water ad libitum unless otherwise specified. The Tac2-Cre knock-in mouse line was a gift from Q. Ma at Dana-Farber Cancer Institute and Harvard Medical School. The D1-cre mouse line was obtained from Jackson Laboratory (JAX: 037156).
Fluorescence in situ hybridization (FISH) and immunofluorescence (IF) staining
Mice were transcardially perfused with PBS followed by 4% paraformaldehyde. Brains were then placed in a 30% sucrose solution for 2 days. The brains were frozen in Optimal Cutting Temperature (OCT) embedding media and 16 μm (for FISH) or 40 μm (for IF) coronal sections were cut with vibratome (Leica, no. CM3050 S). For FISH experiments, the slices were mounted on SuperFrost Plus slides, and air dried. The multi-color FISH experiments were performed following the instructions of RNAscope Fluorescent Multiplex Assay (ACD Bioscience). For IF, cryostat sections were collected and incubated overnight with blocking solution (1×PBS containing 5% goat serum, 5% BSA, and 0.1% Triton X-100), and then incubated with the following primary antibodies, diluted with blocking solution, for 1 day at 4 °C. Samples were then washed three times with washing buffer (1×PBS containing 0.1% Tween-20) and incubated with the Alexa Fluor conjugated secondary antibodies for 2 h at room temperature. The sections were mounted and imaged using a Zeiss LSM800 confocal microscope or an Olympus VS120 Slide Scanning System. Antibodies used for staining were as follows: rabbit anti-cFos (1:2000, Synaptic systems, #226003), chicken anti-GFP (1:2000, Aves Labs, no. GFP-1010), chicken anti-mCherry (1:2000, Novus Biologicals, no. NBP2-25158), Orexin-A (KK09) antibody, (1:500, Santa Cruz Biotechnology, Cat# sc-80263 ), anti-MCH, Ab1-pmch antibody (1:2000, Phoenix Pharmaceuticals, Cat# H-070-47 ), Anti-GABA antibody (1:1000, Sigma, Cat# A2052) , Leptin Receptor antibody (Abcam, Cat# ab104403), Goat anti-chicken Alexa Fluor 488(Thermo Fisher Scientific, Cat# A11039), Donkey anti-rabbit Alexa Fluor 488(Thermo Fisher Scientific, Cat# A21206), Donkey anti-rabbit Alexa Fluor 568(Thermo Fisher Scientific, Cat# A10042).
AAV vectors
The following AAV vectors (with a titer of >1012) were purchased from UNC Vector Core: AAV5-EF1a-DIO-hChR2(H134R)-EYFP, AAV5-EF1a-DIO-EYFP, AAV-DJ-EF1a-DIO-GCaMP6m. The following AAV vectors were purchased from Addgene: AAV5-hSyn-DIO-hM3D(Gq)-mCherry (#44361), AAV5-hSyn-DIO-hM4D(Gi)-mCherry (#44362), AAV5-hSyn-DIO-mCherry (#50459), pAAV-flex-taCasp3-TEVp (#45580), pAAV-Ef1α-DIO eNpHR 3.0-EYFP (#26966), EnvA G-deleted Rabies-EGFP (Salk Institute).
Stereotaxic brain surgeries
The AAV vectors were injected through a pulled-glass pipette and the nanoliter injector (Nanoject III, Drummond Scientific - 3–000-207). The injection was performed using a small-animal stereotaxic instrument (David Kopf Instruments, model 940) under general anesthesia by isoflurane (0.8 liter/min, isoflurane concentration 1.5%) in oxygen. A feedback heater was used to keep mice warm during surgeries. Mice were allowed to recover in a warm blanket before they were transferred to housing cages for 2–4 weeks before behavioral evaluation was performed. For chemogenetics experiments, 0.1~0.15 μl of AAV vector was bilaterally delivered into target regions. For optogenetics experiments, following viral injection, the fiber optic cannula (200 μm in diameter, Inper Inc.) were implanted 0.1 mm above viral injection site and were secured with dental cement (Parkell, #S380). For the drug delivery cannula implantation, the cannula (Guide cannula: C.C 2.0mm, C=4.5mm; Injector: G1=0.5mm; Dummy cannula: G2=0, RWD Life Science) were directly implanted 0.5 mm above the LH and were secured with dental cement (Parkell, #S380). The coordinates of viral injection sites are based on previous literature as follow: NAc (anterior-posterior [AP] +1.2, medial-lateral [ML] ± 0.6, dorsal-ventral [DV] −4.5 mm) and LH (AP −1.3, ML ± 1.2, DV −5.0 mm).
Neuronal Tracing
For CTB tracing, mice were injected with 100–200 μl CTB-647 (AF-CTB, all from Life Technologies) unilaterally into the LH (AP −1.2, ML +1.2, DV −4.75 mm). For rabies tracing, Serpinb2-cre mice were first unilaterally injected in the NAcSh with the starter AAV. After 14 d, the same mice were injected with the rabies virus. Then, 11 days after CTB injections and 7 days after rabies injections, brains tissue was collected and processed for confocal imaging. To aid visualization, images were adjusted for brightness and contrast using ImageJ, but alterations always were applied to the entire image.
Behavioral assays
Open-field tests (OFT).
A clear box (square 27.3 cm × 27.3 cm square base with 20.3 cm high walls) used for the open field test, and the center zone was 50% of the total area. Prior to testing, mice were habituated to the test room for at least 20 minutes. Mice were placed in the center of the box at the start of the assay. Movement was recorded using a measurement (Med Associates, St. Albans, VT, ENV-510) 1 hour in 5 mins bins. In addition to regular parameters related to locomotor activity (such as total travel distance, velocity, ambulatory time, resting time), time spent, and distance travelled in the center area of the testing arena were also recorded and analyzed.
Elevated plus maze (EPM).
EPM was used to measure anxiety effect. Before EPM test, mice were brought to the testing room for environmental habituation for at least 30 min. The EPM apparatus is consisted of an elevated platform (80 cm above the floor), with four arms (each arm is 30 cm in length and 5 cm in width), two opposing closed arms with 14 cm walls and two opposing open arms. Mice were attached into the fiber-optic patch cord and were individually placed in the center of the EPM apparatus, towards one of the open arms. The mice trajectories were tracked for 5 minutes, and the time spent in the open arms was analyzed using Ethovision XT11 (Noldus).
Cocaine conditioned place preference (cocaine-CPP).
Mice were allowed to freely explore both sides of a custom-made (Med Associates) CPP training apparatus (25 × 19 × 17 cm for L × D × H) for 30 min. Trajectories were tracked by infra-red photobeam detectors, and the travel distance and the duration were recorded to assess their baseline place preference. Mice that showed strong bias (< 25% preference) were excluded from the experiments. Then, for chemogenetic activation or inhibition during CPP formation, these mice were injected with saline (i.p.) and confined to their preferred side of the chamber for 30 min before returned to their home cage. At least four hours later, the same mice received CNO at least 15 min before an i.p. injection of 15 mg/Kg cocaine and were confined to their non-preferred side of the chamber for 30 minutes. They were then returned to their home cage. The same training with saline and CNO injection were performed for three consecutive days. Twenty-four hours after the final training session, mice were re-exposed to the CPP chamber and allowed to explore both sides of the chamber for 30 min.
Post-fasted food intake.
Mice were individually placed in the home cage and fasted overnight (18 hours). Mice received N-clozapine (CNO, 2mg/mL for hM3Dq group and 5mg/mL for hM4Di group) via i.p. injection and then regular chow pallets (3 g per pellet) were put in the hopper. Three hours later, the remaining food pallets were collected and measured to calculate total amount of food consumed (g). For the leptin treatment test, 15 mins after CNO injection, 1 μg of leptin (R&D, Cat# 498-OB) was delivered through cannula by pump for 5 mins and waited for another 5 mins before adding pellets. For the Ta-Casp3 treatment group, the test was carried out 3 weeks after virus injection.
Food place preference.
Animals were placed in a custom three-chamber, 45 × 60 × 35 cm arena to assess the amount of food consumed and time spent in a designated food zone area. The arena contained two 64-cm2 food cups in two outer corners of separate chambers. One cup contained standard grain-based chow (Harlan, Indianapolis, IN), while the other cup remained empty. Mice were allowed to explore the arena freely, and spatial locations were tracked using EthoVision XT 10 (Noldus, Leesburg, VA) and CCD cameras (SuperCircuits, Austin, TX).
Operant behavior.
Animals were first given access to 20 mg sweetened chow pellets in their home cage before testing. Animals were then trained to enter the chamber to retrieve a pellet. Each pellet was delivered 10 s after the prior pellet retrieval. After at least 2 days training and until >30 pellets earned in a single session, animals were trained for the fixed ration 1 (FR1) task, in which each active lever pressing was rewarded with a pellet. A new trial does not begin until animals entered the magazine to retrieve the pellet. Retrieval was followed by a 5 s intertrial interval, after which the levers were reactivated, indicated by a cue light. Training continued until >40 pellets were earned in a single 60 mins session.
Progressive ratio.
After FR1, FR3, FR5 training sessions, all mice were tested with CNO treatment. For progressive ratio (PR) task, a schedule of reinforcement, each subsequent reward required exponentially more lever pressing based on the formula (5 × e0.2n) − 5, rounded to the nearest integer, where n = number of rewards earned72. 60 mins per session.
Optogenetic modulations of post-fasted food intake
Mice received 20 min laser stimulation (4 × 5 min, On-Off-On-Off), and then the remaining food pallets were collected and food intake was measured. For photostimulating ChR2, a 473-nm laser (OEM Lasers/OptoEngine) was used to generate laser pulses (10–15 mW at the tip of the fiber, 5 ms, 20 Hz) throughout the behavioral session, except when noted otherwise, controlled by a waveform generator (Keysight). For NpHR photostimulation, a 532-nm laser (OEM Lasers/OptoEngine) generated constant light of 8–10 mW power at each fiber tip.
Fiber photometry during feeding
The Serpinb2+ neuronal dynamics during feeding was measured using fiber photometry. Following injection of an AAV1-hSyn-FLEX-GCaMP7s vector into NAcSh of Serpinb2-Cre mice, an optical cannula (Ø200 μm core, 0.37 numerical aperture) was implanted 100 μm above the viral injection site. Mice were allowed to recover for 3 weeks and then subjected to behavioral test. GCaMP fluorochrome was excited, and emission fluorescence was acquired with the RZ10X fiber photometry system, which has built-in LED drivers, LEDs, and photosensors (Tucker-Davis Technologies). The LEDs include 405 nm (as isosbestic control) and 465 nm (for GCaMP excitation). Emitted light was received through the Mini Cube (Doric Lenses) and split into two bands, 420 to 450 nm (autofluorescence) and 500 to 550 nm (GCaMP7 signal). Mice with optical cannula were attached to recording optic cables, and the LED power at the tip of the optical cables was adjusted to the lowest possible (~20 μW) to minimize bleaching. Mice were placed in the 3- chamber for food preference and food consumption test. Mice behaviors were recorded using EthoVision XT 10 (Noldus, Leesburg, VA) and CCD cameras (Super Circuits, Austin, TX).
For the 3-chamber food seeking and food consumption, mice were fasted overnight, and were then habituated for 10-min in the chamber that contain 2 empty food cups, after that, we put a non-eatable object and food pellets in the two food cups, during this phase, food pellets are caged so that mice can sense the food but are unable to eat them. After 10-min recording, we then removed the barrier of food and mice have free-access to the food, mice eating events were then recorded. Behavioral events, such as baseline of free moving, entering food zone, food consumption and post eating were scored manually and synchronized with fluorescence signal based on recorded videos. The voltage signal data stream was acquired with Synapse software (Tucker-Davis Technologies) and were exported, filtered, and analyzed with custom-written Matlab code. To calculate ΔF/F, a polynomial linear fitting was applied to isosbestic signal to align it to the GCaMP7 signal, producing a fitted isosbestic signal that was used to normalize the GCaMP7 as follows: ΔF/F = (GCaMP7signal − fitted isosbestic)/fitted isosbestic signal.
Lead Contact
Further information and requests for reagents should be directed to and will be fulfilled by the Lead Contact, Yi Zhang (yzhang@genetics.med.harvard.edu).
Extended Data
Extended Data Fig. 1: Generation and validation of Serpinb2-Cre line.
a, Diagrams showing the targeting strategy.
b, Genotyping by PCR. Homozygotes: 413 bp. Heterozygotes: 413 bp/772 bp.
c, Left, in situ hybridization (ISH) data of Serpinb2 from Allen Brain Atlas. Scale bar: 1000 μm. Middle, colocalization of Serpinb2 RNA (red), AAV-DIO-ChR2-eYFP (green) and DAPI (blue). Scale bar: 50 μm. Right, quantification of Serpinb2+ and eYFP+ neurons among all Serpinb2+ neurons.
Extended Data Fig. 2: Serpinb2+ neuron activity during different phases of feeding in ad libitum mice.
a, Ca2+ signals at different phases of feeding process of ad libitum mice (top). Average Ca2+ signal at different feeding phases of the Serpinb2-Cre mice. Elevated Ca2+ signals were observed after entering food zone in the approaching and eating phases. Declined Ca2+ signals were observed post eating. Quantification of AUC in the four phases is shown in bar graph (right, n=7 mice).
b, The same as in panel D except Drd1-Cre mice were used.
**P ≤ 0.01, *P ≤ 0.05; ns, P > 0.05, one-way ANOVA test. Data are represented as mean ± SEM.
Extended Data Fig. 3: Validation of chemogenetic manipulation.
a, Experimental scheme of chemogenetic manipulation.
b, Validation of virus expression in Serpinb2-Cre, Tac2-Cre and Drd1-Cre mice. Scale bar: 500 μm.
c, cFos induction after intraperitoneal injection of ligand CNO in mCherry-expressing, hM3Dq-mCherry-expressing and hM4Di-mCherry-expressing mice. The ratio of cFos+/mCherry+ cells in all mCherry+ cells was calculated and shown on the right panel. Scale bar: 100 μm. *, p<0.05; **, p<0.01, one-way ANOVA test. Data are represented as mean ± SEM.
Extended Data Fig. 4: Serpinb2+ neuronal activity does not affect anxiety or drug seeking behavior.
a, b, Open field test for the effect of Sepinb2+ neuronal activation (hM3Dq) (a) or inhibition (hM4Di) (b) on the total distance traveled in the 1-hour post-treatment period after chemogenetic manipulation of Sepinb2+ neurons (left) or the distance traveled in 5-min time bin (right).
ns, p>0.05, left, unpaired t-test; right, two-way ANOVA.
c, Left, illustration of the two-chamber cocaine-CPP paradigm. Right, cocaine-CPP with chemogenetic activation (hM3Dq) or inhibition (hM4Di) of Sepinb2+ neurons. CPP scores were calculated by subtracting the time spent in the preconditioning phase from the time spent in the postconditioning phase. ns, p>0.05, unpaired t-test.
d, e, Elevated plus maze test for the effect of Sepinb2+ neuronal activation (hM3Dq) (d) or inhibition (hM4Di) (e) on the time spent (left) or distance traveled (right) in open arm and closed arm of the 5-min post-treatment period after chemogenetic manipulation of Sepinb2+ neurons. ns, p>0.05, unpaired t-test.
Data are represented as mean ± SEM.
Extended Data Fig. 5: cFos staining of different brain regions from mice under Ad libitum and refeed states.
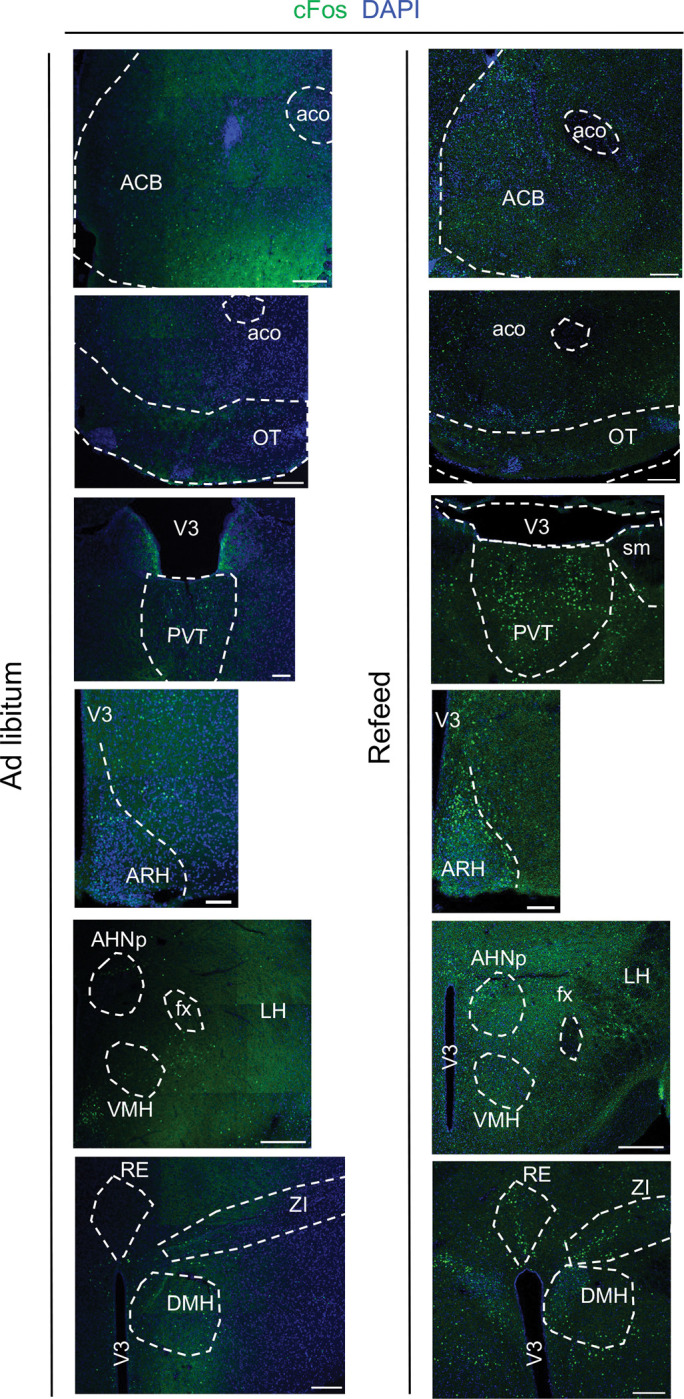
Shown are cFos FISH in different brain regions listed below:
ACB: Nucleus accumbens; aco: anterior commissure, olfactory limb; OT: Olfactory tubercle; V3: third ventricle; ARH: Arcuate hypothalamic nucleus; AHNp: Anterior hypothalamic nucleus, posterior part; VMH: ventromedial hypothalamic nucleus; fx: columns of the fornix; LH: lateral hypothalamus; PVT: paraventricular nucleus of the thalamus; sm: stria medullaris; BLA: Basolateral amygdala; LA: Lateral amygdala; RE: Nucleus of reuniens; DMH: Dorsomedial nucleus of the hypothalamus; ZI: Zona incerta. Scale bar: 100 μm.
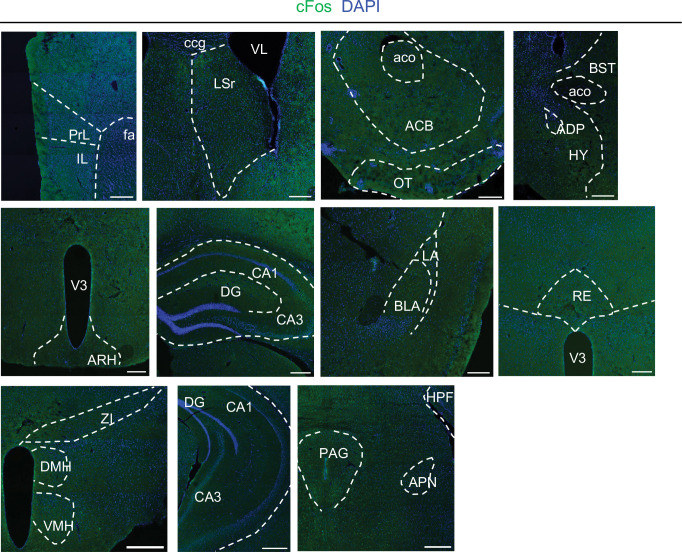
Extended Data Fig. 6: Brain regions that do not innervate Serpinb2+ neurons.
Shown are immunostaining of the various brain regions listed below:
PL: Prelimbic area; IL: Infralimibic area; fa: corpus callosum, anterior forceps; ccg: genu of corpus callosum; LSr: Lateral septal nucleus, rostral part; VL: lateral ventricle; ACB: Nucleus accumbens; aco: anterior commissure, olfactory limb; OT: Olfactory tubercle; ADP: Anterodorsal preoptic nucleus; BST: Bed nuclei of the stria terminalis; V3: third ventricle; ARH: Arcuate hypothalamic nucleus; AHNp: Anterior hypothalamic nucleus, posterior part; VMH: ventromedial hypothalamic nucleus; fx: columns of the fornix; LH: lateral hypothalamus; PVT: paraventricular nucleus of the thalamus; sm: stria medullaris; BLA: Basolateral amygdala; LA: Lateral amygdala; RE: Nucleus of reuniens; DMH: Dorsomedial nucleus of the hypothalamus; ZI: Zona incerta; DG: Dentate gyrus; CA1: field CA1; CA3: field CA3; PAG: Periaqueductal gray;APN: Anterior pretectal nucleus; HPF: Hippocampal formation. Scale bar: 100 μm
Acknowledgements
The authors thank Dr. Chao Zhang for his help in generating Fig. 1a; Dr. Jeffrey M. Friedman for discussion on some experiments; Dr. Aritra Bhattachejee for critical reading of the manuscript. We thank the Mouse Behavior Core of Harvard Medical School and its director Dr. Barbara Caldarone for her help. This project was partly supported by 1R01DA042283, 1R01DA050589, and HHMI. Y.Z. is an investigator of the Howard Hughes Medical Institute. This article is subject to HHMI’s Open Access to Publications policy. HHMI lab heads have previously granted a nonexclusive CC BY 4.0 license to the public and a sublicensable license to HHMI in their research articles. Pursuant to those licenses, the author-accepted manuscript of this article can be made freely available under a CC BY 4.0 license immediately upon publication.
Footnotes
Ethics declarations
Competing interests
The authors declare no competing interests.
Data and Code Availability
The custom code that supports the findings from this study are available from the Lead Contact upon request.
Reference
- 1.Giel K. E. et al. Binge eating disorder. Nat Rev Dis Primers 8, 16, doi: 10.1038/s41572-022-00344-y (2022). [DOI] [PMC free article] [PubMed] [Google Scholar]
- 2.Kaye W. H., Fudge J. L. & Paulus M. New insights into symptoms and neurocircuit function of anorexia nervosa. Nature Reviews Neuroscience 10, 573–584, doi: 10.1038/nrn2682 (2009). [DOI] [PubMed] [Google Scholar]
- 3.Rossi M. A. & Stuber G. D. Overlapping Brain Circuits for Homeostatic and Hedonic Feeding. Cell Metab 27, 42–56, doi: 10.1016/j.cmet.2017.09.021 (2018). [DOI] [PMC free article] [PubMed] [Google Scholar]
- 4.Zhan C. et al. Acute and long-term suppression of feeding behavior by POMC neurons in the brainstem and hypothalamus, respectively. The Journal of neuroscience : the official journal of the Society for Neuroscience 33, 3624–3632, doi: 10.1523/JNEUROSCI.2742-12.2013 (2013). [DOI] [PMC free article] [PubMed] [Google Scholar]
- 5.Li Y. et al. Serotonin neurons in the dorsal raphe nucleus encode reward signals. Nat Commun 7, 10503, doi: 10.1038/ncomms10503 (2016). [DOI] [PMC free article] [PubMed] [Google Scholar]
- 6.Dietrich M. O. et al. AgRP neurons regulate development of dopamine neuronal plasticity and nonfood-associated behaviors. Nature neuroscience 15, 1108–1110, doi: 10.1038/nn.3147 (2012). [DOI] [PMC free article] [PubMed] [Google Scholar]
- 7.Kolb B. & Nonneman A. J. Prefrontal cortex and the regulation of food intake in the rat. J Comp Physiol Psychol 88, 806–815, doi: 10.1037/h0076397 (1975). [DOI] [PubMed] [Google Scholar]
- 8.Davidson T. L. et al. Contributions of the hippocampus and medial prefrontal cortex to energy and body weight regulation. Hippocampus 19, 235–252, doi: 10.1002/hipo.20499 (2009). [DOI] [PMC free article] [PubMed] [Google Scholar]
- 9.Pecina S. & Berridge K. C. Hedonic hot spot in nucleus accumbens shell: where do mu-opioids cause increased hedonic impact of sweetness? The Journal of neuroscience : the official journal of the Society for Neuroscience 25, 11777–11786, doi: 10.1523/JNEUROSCI.2329-05.2005 (2005). [DOI] [PMC free article] [PubMed] [Google Scholar]
- 10.Thoeni S., Loureiro M., O’Connor E. C. & Luscher C. Depression of Accumbal to Lateral Hypothalamic Synapses Gates Overeating. Neuron 107, 158–172 e154, doi: 10.1016/j.neuron.2020.03.029 (2020). [DOI] [PMC free article] [PubMed] [Google Scholar]
- 11.Chen R., Wu X., Jiang L. & Zhang Y. Single-Cell RNA-Seq Reveals Hypothalamic Cell Diversity. Cell reports 18, 3227–3241, doi: 10.1016/j.celrep.2017.03.004 (2017). [DOI] [PMC free article] [PubMed] [Google Scholar]
- 12.Li Y. et al. Hypothalamic Circuits for Predation and Evasion. Neuron 97, 911–924 e915, doi: 10.1016/j.neuron.2018.01.005 (2018). [DOI] [PubMed] [Google Scholar]
- 13.Waterson M. J. & Horvath T. L. Neuronal Regulation of Energy Homeostasis: Beyond the Hypothalamus and Feeding. Cell Metab 22, 962–970, doi: 10.1016/j.cmet.2015.09.026 (2015). [DOI] [PubMed] [Google Scholar]
- 14.Wren A. M. et al. Ghrelin enhances appetite and increases food intake in humans. J Clin Endocrinol Metab 86, 5992, doi: 10.1210/jcem.86.12.8111 (2001). [DOI] [PubMed] [Google Scholar]
- 15.Myers M. G., Cowley M. A. & Munzberg H. Mechanisms of leptin action and leptin resistance. Annual review of physiology 70, 537–556, doi: 10.1146/annurev.physiol.70.113006.100707 (2008). [DOI] [PubMed] [Google Scholar]
- 16.Cowley M. A. et al. Leptin activates anorexigenic POMC neurons through a neural network in the arcuate nucleus. Nature 411, 480–484, doi: 10.1038/35078085 (2001). [DOI] [PubMed] [Google Scholar]
- 17.Leinninger G. M. et al. Leptin acts via leptin receptor-expressing lateral hypothalamic neurons to modulate the mesolimbic dopamine system and suppress feeding. Cell Metab 10, 89–98, doi: 10.1016/j.cmet.2009.06.011 (2009). [DOI] [PMC free article] [PubMed] [Google Scholar]
- 18.Loureiro M. et al. Social transmission of food safety depends on synaptic plasticity in the prefrontal cortex. Science 364, 991–995, doi: 10.1126/science.aaw5842 (2019). [DOI] [PubMed] [Google Scholar]
- 19.O’Connor E. C. et al. Accumbal D1R Neurons Projecting to Lateral Hypothalamus Authorize Feeding. Neuron 88, 553–564, doi: 10.1016/j.neuron.2015.09.038 (2015). [DOI] [PubMed] [Google Scholar]
- 20.Kreitzer A. C. & Malenka R. C. Striatal plasticity and basal ganglia circuit function. Neuron 60, 543–554, doi: 10.1016/j.neuron.2008.11.005 (2008). [DOI] [PMC free article] [PubMed] [Google Scholar]
- 21.Gerfen C. R. & Surmeier D. J. Modulation of striatal projection systems by dopamine. Annual review of neuroscience 34, 441–466, doi: 10.1146/annurev-neuro-061010-113641 (2011). [DOI] [PMC free article] [PubMed] [Google Scholar]
- 22.Matikainen-Ankney B. A. et al. Enhanced food motivation in obese mice is controlled by D1R expressing spiny projection neurons in the nucleus accumbens. bioRxiv, 2022.2001.2012.476057, doi: 10.1101/2022.01.12.476057 (2022). [DOI] [Google Scholar]
- 23.Tan B. et al. Dynamic processing of hunger and thirst by common mesolimbic neural ensembles. Proceedings of the National Academy of Sciences of the United States of America 119, e2211688119, doi: 10.1073/pnas.2211688119 (2022). [DOI] [PMC free article] [PubMed] [Google Scholar]
- 24.Chen R. et al. Decoding molecular and cellular heterogeneity of mouse nucleus accumbens. Nature neuroscience 24, 1757–1771, doi: 10.1038/s41593-021-00938-x (2021). [DOI] [PMC free article] [PubMed] [Google Scholar]
- 25.Sylwestrak E. L. et al. Cell-type-specific population dynamics of diverse reward computations. Cell 185, 3568–3587 e3527, doi: 10.1016/j.cell.2022.08.019 (2022). [DOI] [PMC free article] [PubMed] [Google Scholar]
- 26.Osterhout J. A. et al. A preoptic neuronal population controls fever and appetite during sickness. Nature 606, 937–944, doi: 10.1038/s41586-022-04793-z (2022). [DOI] [PMC free article] [PubMed] [Google Scholar]
- 27.Bhattacherjee A. et al. Cell type-specific transcriptional programs in mouse prefrontal cortex during adolescence and addiction. Nat Commun 10, 4169, doi: 10.1038/s41467-019-12054-3 (2019). [DOI] [PMC free article] [PubMed] [Google Scholar]
- 28.Ilanges A. et al. Brainstem ADCYAP1(+) neurons control multiple aspects of sickness behaviour. Nature 609, 761–771, doi: 10.1038/s41586-022-05161-7 (2022). [DOI] [PMC free article] [PubMed] [Google Scholar]
- 29.Moffitt J. R. et al. Molecular, spatial, and functional single-cell profiling of the hypothalamic preoptic region. Science 362, doi: 10.1126/science.aau5324 (2018). [DOI] [PMC free article] [PubMed] [Google Scholar]
- 30.Bond C. W. et al. Medial Nucleus Accumbens Projections to the Ventral Tegmental Area Control Food Consumption. The Journal of neuroscience : the official journal of the Society for Neuroscience 40, 4727–4738, doi: 10.1523/JNEUROSCI.3054-18.2020 (2020). [DOI] [PMC free article] [PubMed] [Google Scholar]
- 31.Durst M., Konczol K., Balazsa T., Eyre M. D. & Toth Z. E. Reward-representing D1-type neurons in the medial shell of the accumbens nucleus regulate palatable food intake. Int J Obes (Lond) 43, 917–927, doi: 10.1038/s41366-018-0133-y (2019). [DOI] [PMC free article] [PubMed] [Google Scholar]
- 32.Zhang C., Chen R. & Zhang Y. Accurate inference of genome-wide spatial expression with iSpatial. Sci Adv 8, eabq0990, doi: 10.1126/sciadv.abq0990 (2022). [DOI] [PMC free article] [PubMed] [Google Scholar]
- 33.Alexander G. M. et al. Remote control of neuronal activity in transgenic mice expressing evolved G protein-coupled receptors. Neuron 63, 27–39, doi: 10.1016/j.neuron.2009.06.014 (2009). [DOI] [PMC free article] [PubMed] [Google Scholar]
- 34.Kirouac G. J. The Paraventricular Nucleus of the Thalamus as an Integrating and Relay Node in the Brain Anxiety Network. Front Behav Neurosci 15, 627633, doi: 10.3389/fnbeh.2021.627633 (2021). [DOI] [PMC free article] [PubMed] [Google Scholar]
- 35.West E. A. & Carelli R. M. Nucleus Accumbens Core and Shell Differentially Encode Reward-Associated Cues after Reinforcer Devaluation. The Journal of neuroscience : the official journal of the Society for Neuroscience 36, 1128–1139, doi: 10.1523/JNEUROSCI.2976-15.2016 (2016). [DOI] [PMC free article] [PubMed] [Google Scholar]
- 36.Di Chiara G. et al. Dopamine and drug addiction: the nucleus accumbens shell connection. Neuropharmacology 47 Suppl 1, 227–241, doi: 10.1016/j.neuropharm.2004.06.032 (2004). [DOI] [PubMed] [Google Scholar]
- 37.Watabe-Uchida M., Zhu L., Ogawa S. K., Vamanrao A. & Uchida N. Whole-brain mapping of direct inputs to midbrain dopamine neurons. Neuron 74, 858–873, doi: 10.1016/j.neuron.2012.03.017 (2012). [DOI] [PubMed] [Google Scholar]
- 38.Pardo-Garcia T. R. et al. Ventral Pallidum Is the Primary Target for Accumbens D1 Projections Driving Cocaine Seeking. The Journal of neuroscience : the official journal of the Society for Neuroscience 39, 2041–2051, doi: 10.1523/JNEUROSCI.2822-18.2018 (2019). [DOI] [PMC free article] [PubMed] [Google Scholar]
- 39.Brog J. S., Salyapongse A., Deutch A. Y. & Zahm D. S. The patterns of afferent innervation of the core and shell in the “accumbens” part of the rat ventral striatum: immunohistochemical detection of retrogradely transported fluoro-gold. J Comp Neurol 338, 255–278, doi: 10.1002/cne.903380209 (1993). [DOI] [PubMed] [Google Scholar]
- 40.Conte W. L., Kamishina H. & Reep R. L. The efficacy of the fluorescent conjugates of cholera toxin subunit B for multiple retrograde tract tracing in the central nervous system. Brain Struct Funct 213, 367–373, doi: 10.1007/s00429-009-0212-x (2009). [DOI] [PubMed] [Google Scholar]
- 41.Berthoud H. R. & Munzberg H. The lateral hypothalamus as integrator of metabolic and environmental needs: from electrical self-stimulation to opto-genetics. Physiol Behav 104, 29–39, doi: 10.1016/j.physbeh.2011.04.051 (2011). [DOI] [PMC free article] [PubMed] [Google Scholar]
- 42.Sweet D. C., Levine A. S., Billington C. J. & Kotz C. M. Feeding response to central orexins. Brain research 821, 535–538, doi: 10.1016/s0006-8993(99)01136-1 (1999). [DOI] [PubMed] [Google Scholar]
- 43.Qu D. et al. A role for melanin-concentrating hormone in the central regulation of feeding behaviour. Nature 380, 243–247, doi: 10.1038/380243a0 (1996). [DOI] [PubMed] [Google Scholar]
- 44.Kopp W. et al. Low leptin levels predict amenorrhea in underweight and eating disordered females. Mol Psychiatry 2, 335–340, doi: 10.1038/sj.mp.4000287 (1997). [DOI] [PubMed] [Google Scholar]
- 45.Li Z., Kelly L., Heiman M., Greengard P. & Friedman J. M. Hypothalamic Amylin Acts in Concert with Leptin to Regulate Food Intake. Cell Metab 23, 945, doi: 10.1016/j.cmet.2016.04.014 (2016). [DOI] [PubMed] [Google Scholar]
- 46.Jennings J. H., Rizzi G., Stamatakis A. M., Ung R. L. & Stuber G. D. The inhibitory circuit architecture of the lateral hypothalamus orchestrates feeding. Science 341, 1517–1521, doi: 10.1126/science.1241812 (2013). [DOI] [PMC free article] [PubMed] [Google Scholar]
- 47.Wickersham I. R., Finke S., Conzelmann K. K. & Callaway E. M. Retrograde neuronal tracing with a deletion-mutant rabies virus. Nat Methods 4, 47–49, doi: 10.1038/nmeth999 (2007). [DOI] [PMC free article] [PubMed] [Google Scholar]
- 48.Friedman J. M. The function of leptin in nutrition, weight, and physiology. Nutr Rev 60, S1–14; discussion S68–84, 85–17, doi: 10.1301/002966402320634878 (2002). [DOI] [PubMed] [Google Scholar]
- 49.Morton G. J., Cummings D. E., Baskin D. G., Barsh G. S. & Schwartz M. W. Central nervous system control of food intake and body weight. Nature 443, 289–295, doi: 10.1038/nature05026 (2006). [DOI] [PubMed] [Google Scholar]
- 50.Myers M. G. Jr., Munzberg H., Leinninger G. M. & Leshan R. L. The geometry of leptin action in the brain: more complicated than a simple ARC. Cell Metab 9, 117–123, doi: 10.1016/j.cmet.2008.12.001 (2009). [DOI] [PMC free article] [PubMed] [Google Scholar]
- 51.Cohen P. et al. Selective deletion of leptin receptor in neurons leads to obesity. J Clin Invest 108, 1113–1121, doi: 10.1172/JCI13914 (2001). [DOI] [PMC free article] [PubMed] [Google Scholar]
- 52.de Luca C. et al. Complete rescue of obesity, diabetes, and infertility in db/db mice by neuron-specific LEPR-B transgenes. J Clin Invest 115, 3484–3493, doi: 10.1172/JCI24059 (2005). [DOI] [PMC free article] [PubMed] [Google Scholar]
- 53.Kim K. S. et al. Enhanced hypothalamic leptin signaling in mice lacking dopamine D2 receptors. The Journal of biological chemistry 285, 8905–8917, doi: 10.1074/jbc.M109.079590 (2010). [DOI] [PMC free article] [PubMed] [Google Scholar]
- 54.Floresco S. B. The nucleus accumbens: an interface between cognition, emotion, and action. Annu Rev Psychol 66, 25–52, doi: 10.1146/annurev-psych-010213-115159 (2015). [DOI] [PubMed] [Google Scholar]
- 55.Johnson P. M. & Kenny P. J. Dopamine D2 receptors in addiction-like reward dysfunction and compulsive eating in obese rats. Nature neuroscience 13, 635–641, doi: 10.1038/nn.2519 (2010). [DOI] [PMC free article] [PubMed] [Google Scholar]
- 56.Wang G. J. et al. Brain dopamine and obesity. Lancet 357, 354–357, doi: 10.1016/s0140-6736(00)03643-6 (2001). [DOI] [PubMed] [Google Scholar]
- 57.Gerfen C. R. Segregation of D1 and D2 dopamine receptors in the striatal direct and indirect pathways: An historical perspective. Front Synaptic Neurosci 14, 1002960, doi: 10.3389/fnsyn.2022.1002960 (2022). [DOI] [PMC free article] [PubMed] [Google Scholar]
- 58.Zhao Z. d. et al. A molecularly defined D1 medium spiny neuron subtype negatively regulates cocaine addiction. Science Advances 8, eabn3552 (2022). [DOI] [PMC free article] [PubMed] [Google Scholar]
- 59.Zhou K. et al. Reward and aversion processing by input-defined parallel nucleus accumbens circuits in mice. Nat Commun 13, 6244, doi: 10.1038/s41467-022-33843-3 (2022). [DOI] [PMC free article] [PubMed] [Google Scholar]
- 60.Mickelsen L. E. et al. Single-cell transcriptomic analysis of the lateral hypothalamic area reveals molecularly distinct populations of inhibitory and excitatory neurons. Nature neuroscience 22, 642–656, doi: 10.1038/s41593-019-0349-8 (2019). [DOI] [PMC free article] [PubMed] [Google Scholar]
- 61.Thoeni S., Loureiro M., O’Connor E. C. & Lüscher C. Depression of Accumbal to Lateral Hypothalamic Synapses Gates Overeating. Neuron, doi: 10.1016/j.neuron.2020.03.029 (2020). [DOI] [PMC free article] [PubMed] [Google Scholar]
- 62.Elmquist J. K., Bjorbaek C., Ahima R. S., Flier J. S. & Saper C. B. Distributions of leptin receptor mRNA isoforms in the rat brain. J Comp Neurol 395, 535–547 (1998). [PubMed] [Google Scholar]
- 63.de Vrind V. A. J., Rozeboom A., Wolterink-Donselaar I. G., Luijendijk-Berg M. C. M. & Adan R. A. H. Effects of GABA and Leptin Receptor-Expressing Neurons in the Lateral Hypothalamus on Feeding, Locomotion, and Thermogenesis. Obesity (Silver Spring) 27, 1123–1132, doi: 10.1002/oby.22495 (2019). [DOI] [PMC free article] [PubMed] [Google Scholar]
- 64.Jo Y.-H., Chen Y.-J. J., Chua S. C., Talmage D. A. & Role L. W. Integration of endocannabinoid and leptin signaling in an appetite-related neural circuit. Neuron 48, 1055–1066 (2005). [DOI] [PMC free article] [PubMed] [Google Scholar]
- 65.Kirouac G. J. Placing the paraventricular nucleus of the thalamus within the brain circuits that control behavior. Neurosci Biobehav Rev 56, 315–329, doi: 10.1016/j.neubiorev.2015.08.005 (2015). [DOI] [PubMed] [Google Scholar]
- 66.Millan E. Z., Ong Z. & McNally G. P. in Progress in Brain Research Vol. 235 (eds Tanya Calvey & William M. U Daniels) 113–137 (Elsevier, 2017). [DOI] [PubMed] [Google Scholar]
- 67.Otis J. M. et al. Paraventricular Thalamus Projection Neurons Integrate Cortical and Hypothalamic Signals for Cue-Reward Processing. Neuron 103, 423–431 e424, doi: 10.1016/j.neuron.2019.05.018 (2019). [DOI] [PMC free article] [PubMed] [Google Scholar]
- 68.Labouebe G., Boutrel B., Tarussio D. & Thorens B. Glucose-responsive neurons of the paraventricular thalamus control sucrose-seeking behavior. Nature neuroscience 19, 999–1002, doi: 10.1038/nn.4331 (2016). [DOI] [PMC free article] [PubMed] [Google Scholar]
- 69.Kessler S. et al. Glucokinase neurons of the paraventricular nucleus of the thalamus sense glucose and decrease food consumption. iScience 24, 103122, doi: 10.1016/j.isci.2021.103122 (2021). [DOI] [PMC free article] [PubMed] [Google Scholar]
- 70.Krause M., German P. W., Taha S. A. & Fields H. L. A pause in nucleus accumbens neuron firing is required to initiate and maintain feeding. The Journal of neuroscience : the official journal of the Society for Neuroscience 30, 4746–4756, doi: 10.1523/JNEUROSCI.0197-10.2010 (2010). [DOI] [PMC free article] [PubMed] [Google Scholar]
- 71.Kelley A. E. Ventral striatal control of appetitive motivation: role in ingestive behavior and reward-related learning. Neurosci Biobehav Rev 27, 765–776, doi: 10.1016/j.neubiorev.2003.11.015 (2004). [DOI] [PubMed] [Google Scholar]
- 72.Richardson N. R. & Roberts D. C. Progressive ratio schedules in drug self-administration studies in rats: a method to evaluate reinforcing efficacy. Journal of neuroscience methods 66, 1–11, doi: 10.1016/0165-0270(95)00153-0 (1996). [DOI] [PubMed] [Google Scholar]


