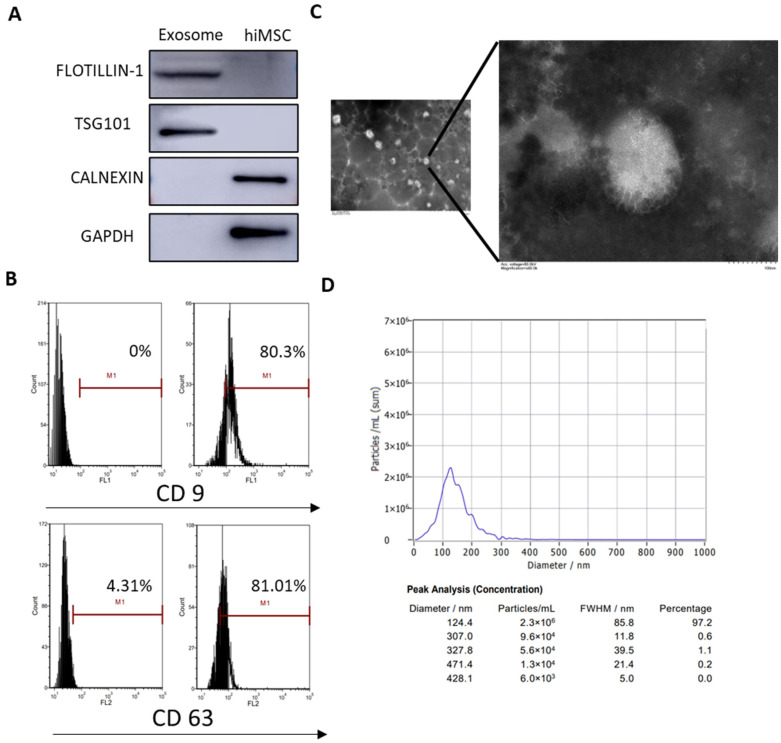
Figure 2.
Characterization of hiMSC exosomes. (A) Western blotting was applied to analyze the expression of FLOTILLIN-1, TSG101, CALNEXIN and GAPDH in hiMSC exosomes. (B) FC was employed to detect the expression of exosomal surface markers such as CD9 and CD63. (C) TEM was performed to observe the morphology of hiMSC exosomes. (D) NTA was used to measure the size distribution and concentration of hiMSC exosomes. The scale bars represent 1 μm and 100 nm.

