Abstract
In the present study CeO2, MnO2 and CeMnOx mixed oxide (with molar ratio Ce/Mn = 1) were prepared by sol-gel method using citric acid as a chelating agent and calcined at 500 °C. The silver catalysts (1 wt.% Ag) over the obtained supports were synthesized by the incipient wetness impregnation method with [Ag(NH3)2]NO3 aqueous solution. The selective catalytic reduction of NO by C3H6 was investigated in a fixed-bed quartz reactor using a reaction mixture composed of 1000 ppm NO, 3600 ppm C3H6, 10 vol.% O2, 2.9 vol.% H2 and He as a balance gas, at WHSV of 25,000 mL g−1 h−1.The physical-chemical properties of the as-prepared catalysts were studied by several characterization techniques, such as X-ray fluorescence analysis, nitrogen adsorption/desorption, X-ray analysis, Raman spectroscopy, transmission electron microscopy with analysis of the surface composition by X-ray energy dispersive spectroscopy and X-ray photo-electron spectroscopy. Silver oxidation state and its distribution on the catalysts surface as well as the support microstructure are the main factors determining the low temperature activity in NO selective catalytic reduction. The most active Ag/CeMnOx catalyst (NO conversion at 300 °C is 44% and N2 selectivity is ~90%) is characterized by the presence of the fluorite-type phase with high dispersion and distortion. The characteristic “patchwork” domain microstructure of the mixed oxide along with the presence of dispersed Ag+/Agnδ+ species improve the low-temperature catalyst of NO reduction by C3H6 performance compared to Ag/CeO2 and Ag/MnOx systems.
Keywords: Ag+, CeMnOx, C3H6-SCR of NO, oxide microstructure, HRTEM, Raman, XPS
1. Introduction
Currently, internal combustion engines (ICEs), including diesel engines, are the most widely used due to their high efficiency and reliability [1]. However, the main disadvantage of the ICEs is the emission of exhaust gases that pose a serious threat to both the environment (increasing ozone concentration in the atmosphere and producing acid rains) and the human health as they are rich in particulates and nitrogen oxides (NO, NO2 and N2O) [2].
In recent years, several methods have been applied to reduce NOx emissions. For this purpose, selective catalytic reduction (SCR) with hydrocarbons or alcohols (HC- or HCO-SCR, respectively) has proved to be interesting for their high efficiency and low cost [3,4,5]. The main advantage of such reaction is the use of gas mixtures with similar composition as the exhaust fumes; in this way, the HC and NOx can be simultaneously abated without feeding additional reducing agents [6]. Furthermore, this process can be a useful alternative to commercial processes utilizing NH3 or urea as reducing agents [7], which are the dominant technologies for NOx removing from mobile (vehicles and marine engines) and stationary sources [8]. Nevertheless, the toxicity of concentrated ammonia, the fact that urea must be temporarily stored on board, thus requiring additional infrastructures for supply and use (additional urea tank to be filled periodically), the costs of ammonia plants and ammonia slip, which can produce additional pollution [5,9], constitute the main obstacles that prevent the large use of such systems.
Numerous catalysts such as zeolites, noble metals and metal oxides have been studied for NOx HC-SCR. The limited use of zeolite-based catalysts is due to hydrothermal deactivation and high-temperature activity limiting their real applications [10]. From the pioneer study by Miyadera [11], based on the performance efficiency of Ag/Al2O3, which showed high NO conversion in HC-SCR with various light hydrocarbons, the silver-based catalysts are extensively studied as promising candidates for practical use DeNOx systems, because they exhibit a high efficiency comparable to that of commercial catalysts applied in NH3-SCR, especially at temperatures above 300 °C; moreover, they have a moderate resistance to water and SO2 [12,13,14]. An advantage linked to the preferable use of Ag compared to Pt group metals is a lower oxidation activity of HC/HCO that limits the oxidation of hydrocarbons or oxygenates in simultaneous total combustion during the NOx SCR. Previous studies showed that the catalytic properties of silver-alumina catalysts were related to the Ag loading on the support [15,16]. For low loadings, the Ag exists mainly in the form of Ag+ or Agδ+, while the catalysts with higher Ag content usually contain more Ag0 nanoparticles. Another important aspect is the influence of Ag loading on the catalytic activity. In fact, isolated silver cations (Ag+) and oxidized silver clusters (Agnδ+) are proposed to be the active species in the NO-SCR reaction, while metallic silver clusters (Ag0) are responsible for the nonselective oxidation of hydrocarbons [16]. However, the practical application of Ag-based catalysts is limited by the low activity at temperatures in the range of 150–300 °C.
Among various supports used for NOx SCR, CeO2 and manganese oxides have attracted wide attention as they feature excellent low-temperature activity [17,18,19]. The high efficiency of CeO2-based catalysts is due to the excellent Lewis surface acidity, redox properties and high oxygen storage capacity [20,21]. The Mn-based oxides are promising for application at low temperatures due to high NO conversion and good N2 selectivity in the NO SCR by NH3 [22,23]. Moreover, the Mn-WO3/TiO2 catalysts represent a valid alternative in the NH3-SCR of NO to the typical V2O5-WO3/TiO2 commercial systems [24]. According to the available literature data, the Ag catalysts supported on Ce and Ce-based mixed oxides (Ce-Mn, Ce-Zr, Ce-Ti, etc.) are appealing as catalytic materials for NH3 NOx SCR in exhausts emitted by diesel engines of vehicles and ships in compliance with the EURO VI and IMO 2020 regulations [14,18,25,26]. However, such catalytic systems remain poorly understood for CH-SCR. Recently, Ag/CeZr catalysts have been shown to be very promising for NOx HC-SCR [27], which increases interest in considering other Ce-based mixed oxides for NOx HC-SCR.
This work is focused on the synthesis and detailed characterization of powder catalysts based on silver as an active phase supported on Ce, Mn and Ce-Mn reducible oxides and study of their activity in selective catalytic NOx reduction with propylene. To synthesize the oxide supports, the citrate sol-gel method was chosen, while an impregnation of the prepared supports with [Ag(NH3)2]NO3 followed by calcination in air was used to prepare the Ag catalysts. The citrate sol-gel method allowed preparing the ultrafine oxide materials and ensured good homogeneity through mixing of the initial components at the molecular level in solution [28,29]. This synthesis method allows obtaining the supports with the required elemental and phase composition, optimal specific surface area and pore size distribution, structural and textural characteristics [30,31]. In turn, the use of [Ag(NH3)2]NO3 as a silver precursor to prepare the Ag catalysts was expected to ensure a strong interaction between the Ag precursor and support resulting in stabilization of silver cations (Ag+) and/or oxidized silver clusters (Agnδ+) as active species on the catalyst surface [13,32]. The obtained catalysts were characterized by such methods as X-ray fluorescence (XRF) analysis, N2 adsorption/desorption, Raman spectroscopy, transmission electron microscopy with analysis of the surface composition by X-ray energy dispersive spectroscopy (TEM/EDX) and X-ray photo-electron spectroscopy (XPS) and were studied in the NO SCR with C3H6 cofeeding H2 in the reaction mixture. For comparison, the catalytic activity in terms of NO conversion and selectivity towards N2 was also investigated for the supports only.
2. Materials and Methods
2.1. Preparation of the Supports
The individual CeO2, MnOx and binary CeO2–MnOx (with a molar ratio of Ce/Mn = 1) oxide supports were synthesized by sol–gel citrate method. Analytical grade Ce(NO3)3·6H2O and Mn(NO3)2·6H2O salts (Unihim, St. Petersburg, Russia) were used as Ce and Mn precursors, respectively, and citric acid C6H8O7·H2O (Khimprom, Kemerovo, Russia) was employed as a chelating agent. All reagents were used directly without any further purification. The colloidal solutions to synthesize the supports were prepared in a 500 mL ceramic tank using a heated magnetic stirrer. For this, the required volume of solutions of the corresponding metal precursors was rapidly added to a citric acid solution at a vigorous stirring with the molar ratio C6H8O7·H2O/(Me) = 1.2 (pH of solution was ~1–2) followed by heating up to 70 °C at a constant stirring. The above colloidal solutions were hold at 70 °C at a constant stirring for 2 h followed by the gel formation. To age the gel and additionally evaporate water, the resulting gel was placed in a drying oven overnight at 80 °C. The resulting gel was additionally dried at 120 °C (a heating rate was 10 deg/min) for 5 h and then calcined at 500 °C for 3 h with a linear heating rate up to a maximum set temperature of 5 °C/min. The synthesized samples were labelled as follows: CeO2, MnOx and CeMnOx.
2.2. Preparation of Supported Ag Catalysts
Based on the obtained supports, a series of Ag catalysts with a fixed silver content (1 wt.%) was prepared by incipient wetness impregnation using an aqueous solution of ammonium silver complex [Ag(NH3)2]NO3 as an Ag precursor. The wetness of the support was determined by adding drop by drop a known volume of water solution. The volume and concentration of the impregnating solution for each support were fixed taking into account its wetness and weight to ensure 1 wt.% of Ag in the final catalyst. The samples impregnated were dried at 70 °C and then calcined at 500 °C for 2 h. The obtained catalysts were designated as follows: Ag/CeO2, Ag/MnOx and Ag/CeMnOx.
2.3. Aging of Supported Ag Catalysts
Samples were aged thermally. Sample powders were heated in air to 650 °C at a heating rate of 10°/min, calcined at 650 °C for 12 h, and then cooled to room temperature.
2.4. Characterization
The prepared samples were studied by several characterization methods, including X-ray fluorescence analysis (XRF), nitrogen adsorption/desorption at −196 °C, X-ray analysis (XRD), Raman spectroscopy, transmission electron microscopy (TEM) with analysis of the surface composition by X-ray energy dispersive spectroscopy (EDX) and X-ray photoelectron spectroscopy (XPS).
2.4.1. X-ray Fluorescence Analysis
The chemical composition of the samples was analyzed using the XRF-1800 sequential X-ray fluorescence spectrometer (Shimadzu, Tokyo, Japan).
2.4.2. Low-Temperature Nitrogen Adsorption/Desorption
The specific surface area, total pore volume and average pore diameter were determined from the low-temperature nitrogen adsorption/desorption (at −196 °C) using the TriStar II 3020 specific analyzer (Micromeritics, Norcross, GA, USA). Prior to experiments, all samples were degassed at 200 °C in a vacuum (10–2 Torr) for 2 h using the laboratory degassing station VacPrep Degasser (Micromeritics). The specific surface area was determined by the Brunauer-Emmett-Teller (BET) method; the pore volume and pore size distributions were determined by the Barrett-Joyner-Halenda (BJH) method using the desorption branch of the adsorption-desorption isotherm.
2.4.3. XRD
The XRD patterns for the samples were recorded by the X-ray diffractometer XRD-7000 (Shimadzu) with monochromatic CuKα radiation (1.54 Å) in the angle range of 10–70° 2θ and a scanning rate of 0.02 °/s. The data were obtained using the Bragg-Brentano geometry. Crystalline Si (a = 5.4309 Å, λ = 1.540562 Å) was used as an external standard to calibrate the diffractometer. The phase composition was analyzed using the PDF-2 database (Release 2012 RDB). To refine the lattice parameters and determine the crystalline size, the POWDER CELL 2.4 full profile analysis program was used.
2.4.4. Raman Spectroscopy
Raman spectra were obtained on the InVia spectrometer (Renishaw, UK) equipped with the DM 2500M microscope (Leica, Germany) with a 50× objective. For excitation, the lasers with wavelengths of 532 and 785 nm and a power of 100 mW were used; the spectral resolution was 2 and 1 cm−1, respectively. To prevent changes in the samples, only 5% of the full laser power and a 50% beam defocusing were applied.
2.4.5. TEM and EDX
Transmission electron microscopy (TEM) data were obtained using the double aberration-corrected (Thermo Fisher Scientific Themis Z, Netherlands) electron microscope operated at 200 kV. Images in Scanning-TEM (STEM) mode were taken using the high-angle annular dark field (HAADF) detector. The local composition of the samples was studied using the Thermo Fisher Scientific Super-X EDX spectrometer. The samples for the TEM study were dispersed ultrasonically and deposited on copper grids covered with a holey carbon film.
2.4.6. XPS
The samples were analyzed by X-ray photoelectron spectroscopy (XPS) using the photoelectron spectrometer ES 300 (Kratos Analytical, UK). Mg Kα (hν = 1256.6 eV) and Al Kα (hν = 1486.6 eV) X-ray sources were employed to acquire photoelectron spectra. To perform XPS analysis, the samples were fixed on a sample holder using a scotch-tape. The core-level spectra, namely, Ag3d, O1s, C1s, Ce3d, Mn2p, Mn3s, and Auger spectra for silver Ag MNN were acquired to estimate the quantitative composition of the samples surface as well as to analyze the oxidation state of the elements. The C1s line of the residual amorphous carbon species with a binding energy Eb(C1s) = 285.1 eV was used as an internal standard to calibrate the spectra. Such a calibration procedure gave the Eb value of the U’’’ component of the Ce3d spectrum as Eb(U’’’) = 916.7 eV being consistent with the literature data for ceria-based catalysts. The spectra were analyzed after Shirley background subtraction. The Ce3d, Mn2p, and Mn3s spectra were fitted with a combination of Gaussian and Lorentzian functions. The XPS-Calc program [33,34] was used for spectra processing. Atomic ratios were calculated using the area of the corresponding peaks with the consideration of the atomic sensitivity factor for each element [35].
2.5. Activity Tests in C3H6-SCR of NO
All the C3H6-SCR tests were performed in a fixed-bed continuous-flow U quartz reactor with an inner diameter of 12 mm. The feed gas consisting of 1000 ppm NO + 3600 ppm C3H6 + 2.9 vol.% H2 + 10 vol.% O2 in He was flowed over the catalyst (120 mg) at a rate of 50 mL·min−1 equivalent to a weight hourly space velocity (WHSV) of 25,000 mL g−1 h−1. To study the effect of hydrogen presence, catalytic tests without it, where also carried out. To this purpose the feed gas consisting of 1000 ppm NO + 3600 ppm C3H6 + 10 vol.% O2 in He was used. The conversion values were measured as a function of temperature from 100 °C to 500 °C with a heating rate of 5 °C/min, holding 40 min at each temperature that was increased by steps of 50 °C. The inlet and outlet gas compositions were analyzed by mass quadrupole spectrometer (ThermostarTM, Balzers, Liechstenstein) and by ABB detectors, infrared (Limas 11) for NO, N2O, NO2, paramagnetic (Magnos 206) for O2, and UV (Uras 14) for CO and CO2 detection.
The NO conversion, selectivity to N2 and N2 yield were calculated according to procedures described in Refs. [9,12]:
3. Results and Discussion
3.1. Chemical Composition and Textural Characteristics of the Samples
Table 1 shows the XFR data for the prepared Ag catalysts. The composition of the supports is consistent with those of the catalysts and is not presented in the table. According to the data obtained, there is a good consistency between the real and nominal chemical compositions.
Table 1.
Bulk and surface sample composition according to X-ray fluorescence spectroscopy (XRF) and X-ray photoelectron spectroscopy (XPS) data.
| Sample | Content, wt.% | Atomic Ratio, XRF/XPS | |||||
|---|---|---|---|---|---|---|---|
| Ag | Ce | Mn | Ce/Mn | Ag/Ce | Ag/Mn | Ag/(Ce+Mn) | |
| Ag/CeO2 | 1.0 | 80.6 | - | - | 0.016/0.019 | - | - |
| Ag/CeMnOx | 1.2 | 58.4 | 20.4 | 1.1/1.2 | 0.027/0.027 | 0.030/0.033 | 0.014/0.015 |
| Ag/MnOx | 1.3 | - | 72.7 | - | - | 0.009/0.022 | - |
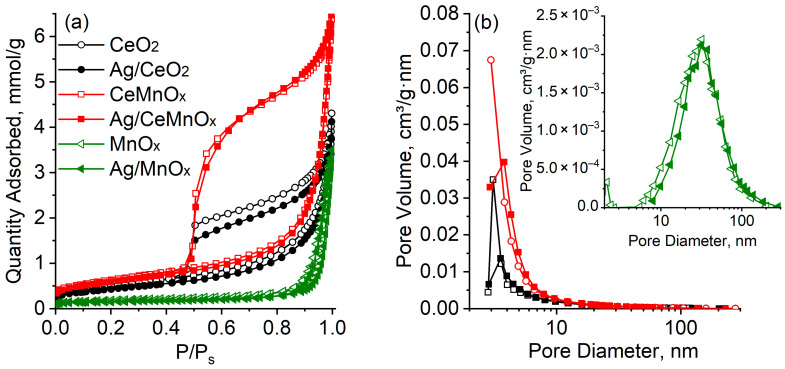
Figure 1 shows nitrogen adsorption-desorption isotherms and pore size distributions for CeO2, MnOx and CeMnOx supports and the corresponding Ag catalysts. Table 2 lists the values of specific surface area and total pore volume. For all samples, the adsorption–desorption isotherms belong to type IV according to the IUPAC classification [36]. The observed hysteresis loops of type H2 indicate the presence of mesopores with a complex structure in the samples. For the CeO2 and CeMnOx samples, wide hysteresis loops are observed in the relative pressure range of 0.45–1.0 corresponding to a rather narrow pore size distribution in the range of 2–10 nm. For the MnOx sample, a narrow hysteresis loop is observed in the relative pressure range of 0.82–1.0, which corresponds to a wide pore size distribution in the range of 4–200 nm with a maximum at ~30 nm. The CeO2 and CeMnOx supports are characterized by the relatively high specific surface area (40 and 51 m2/g, respectively) and total pore volume (0.140 and 0.222 cm3/g, respectively), while the MnOx sample shows relatively low specific surface area (14 m2/g) and total pore volume (0.115 cm3/g).
Figure 1.
Adsorption-desorption isotherms (a) and pore size distribution (b) for oxide supports and Ag/oxide catalysts.
Table 2.
Specific surface area (SSA) and total pore volume (V), phase composition, and characteristics of the crystalline phases revealed (space group (S.G.), symmetry, lattice parameters (a, c), and mean crystallite size (DXRD)) for oxide supports and Ag/oxide catalysts.
| Sample | SSA, m2/g | V, cm3/g | Phase Composition | Structural Parameters | DXRD, nm | ||||
|---|---|---|---|---|---|---|---|---|---|
| Phase | wt.% | S.G. | Symmetry | a, Å | c, Å | ||||
| CeO2 | 40 | 0.14 | fluorite | 100 | Fm-3m | cubic | 5.405 | - | 13 |
| Ag/CeO2 | 34 | 0.13 | fluorite | 100 | Fm-3m | cubic | 5.405 | - | 15 |
| MnOx | 14 | 0.12 | Mn2O3 | 25 | Ia-3 | cubic | 9.402 | - | 61 |
| Mn3O4 | 75 | I41/amd | tetragonal | 5.758 | 9.457 | 33 | |||
| Ag/MnOx | 12 | 0.12 | Mn2O3 | 76 | Ia-3 | cubic | 9.403 | - | 52 |
| Mn3O4 | 24 | I41/amd | tetragonal | 5.755 | 9.466 | n.a. | |||
| CeMnOx | 51 | 0.22 | fluorite | 100 | Fm-3m | cubic | 5.406 | - | 7 |
| Ag/CeMnOx | 47 | 0.22 | fluorite | 100 | Fm-3m | cubic | 5.413 | - | 7 |
The Ag introduction does not significantly affect the isotherms and pore size distributions in the corresponding samples (Figure 1). The observed decrease in the specific surface area with a slight change in the total pore volume is apparently due to the support sintering according to the mechanism of surface diffusion during the calcination step. In general, the changes observed in the textural characteristics of the Ag/oxide catalysts indicate a uniform distribution of Ag introduced into the porous space of the supports.
3.2. Phase Composition and Structural Characteristics of Samples
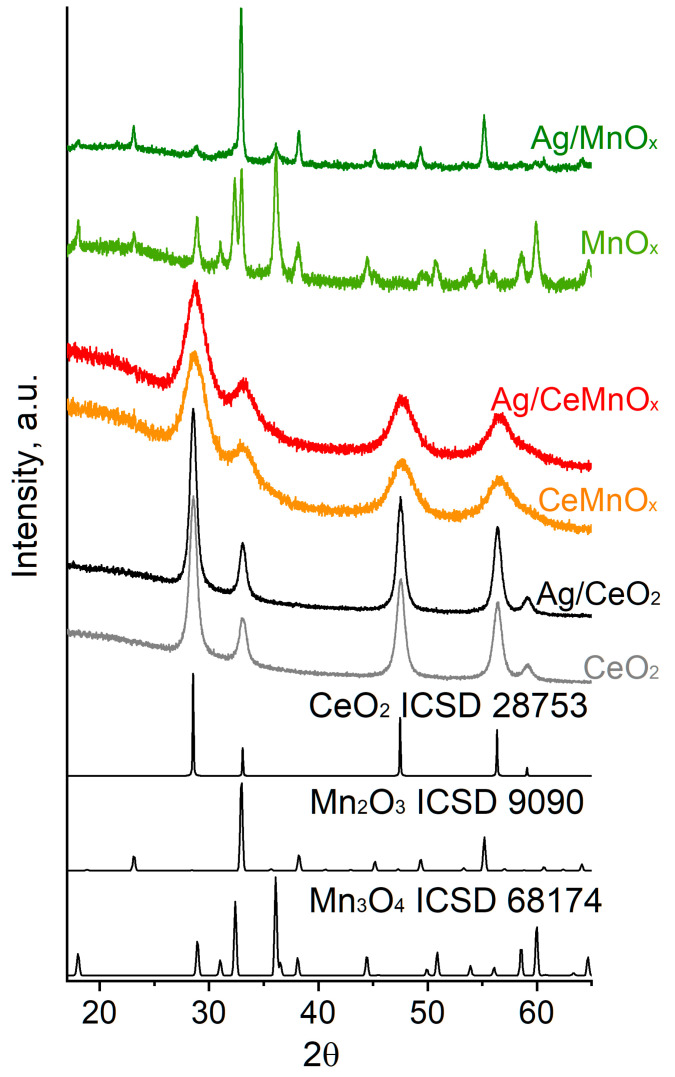
The phase composition and structural features of the CeO2, MnOx and CeMnOx supports, and the corresponding Ag catalysts were studied by XRD, Raman spectroscopy with laser excitation wavelengths of 532 and 785 nm, and TEM. Figure 2 shows the XRD patterns for the samples studied. Table 2 presents the phase composition of the samples and the characteristics of the crystalline phases revealed during the XRD data analysis. Figure 3 shows the Raman spectra for the samples at two different laser excitation wavelengths; the use of various laser excitations provides wide information due to the resonance effect of Raman scattering [37,38]. Figure 4, Figure 5 and Figure 6 display the high-resolution TEM (HRTEM) images and high resolution EDX mapping for Ag supported catalysts.
Figure 2.
XRD patterns for oxide supports and Ag catalysts on the basis thereof.
Figure 3.
Raman spectra obtained under (a) 532 nm and (b) 785 nm lasers for oxide supports and Ag catalysts on the basis thereof.
Figure 4.
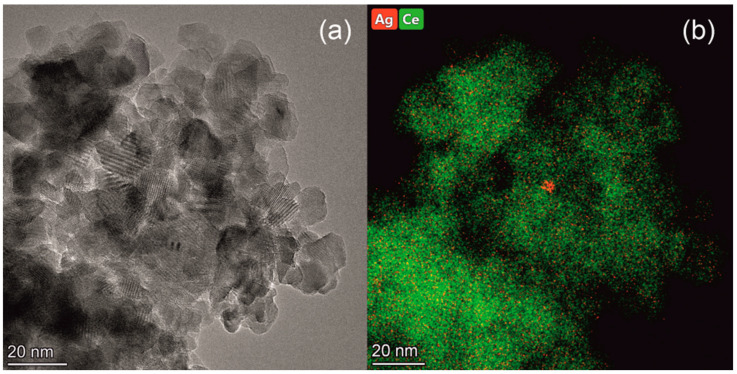
HRTEM image (a) and high resolution EDX mapping (b) for the Ag/CeO2 sample.
Figure 5.
TEM (a), high resolution EDX mapping (b), and HRTEM of indicated regions I (c) and II (d) for the Ag/MnOx sample.
Figure 6.
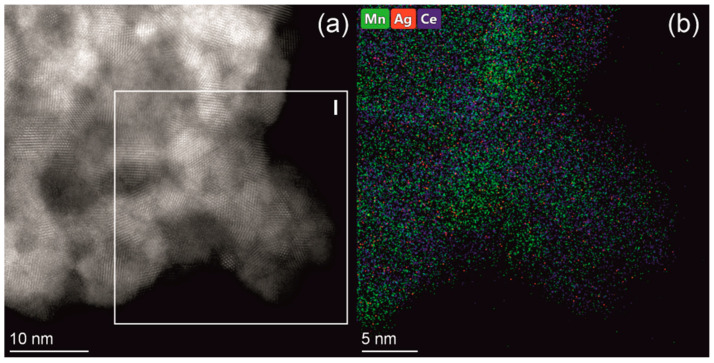
HRTEM image (a) and high resolution EDX mapping (b) taken from the indicated region I for the Ag/CeMnOx sample.
3.2.1. CeO2 and Ag/CeO2 Samples
According to the XRD data, the CeO2 sample has a cubic fluorite-type phase with the lattice parameter a of 5.405 Å and the average XRD crystallite size of 13 nm. The formation of fluorite-type ceria is confirmed by Raman spectroscopy, with the structural defects being additionally indicated. Specifically, Raman spectrum for the CeO2 support obtained under 532 nm laser contains the bands at 260, 404, 464, 560, 590 and 828 cm−1 (Figure 3a), while the one obtained under 785 nm laser is characterized by the bands at 276, 314, 410, 464, 556, 595, and 724 cm−1 (Figure 3b). The intense band at 464 cm–1 is attributed to the F2g band associated with the Ce–O stretching vibration in the [CeO8] cubic subcell of ceria, and the weak bands located at 256–260, 404–410, and 590–595 cm–1 are referred to overtones [39]. The band at ~560 cm–1 is associated with the Ce3+ located in the immediate vicinity of the oxygen defect [39], the band at ~314 cm–1 is attributed to the displacement of oxygen atoms from the ideal positions of the fluorite lattice [38], and the band at 828 cm–1 is attributed to the surface peroxide O22− species [39,40]. The presence of these bands indicates a defective structure of cerium oxide obtained by the citrate method.
For Ag/CeO2 sample, no additional Ag-based phases were revealed by XRD, which is caused by the low Ag content as well as high dispersion of such phases. The lattice parameter a of the fluorite-type phase remains unchanged (5.405 Å), and the average crystallite size is 15 nm. These results are additionally confirmed by the HRTEM data (Figure 4) indicating the ceria crystallites of ~5 to 20 nm in size for the Ag/CeO2 catalyst. According to the high resolution EDX analysis, silver is evenly distributed over the sample, however, in some places silver is concentrated as oxide species, which is reduced under the electron beam. The Raman spectroscopy does not reveal a significant effect of the Ag deposition on the ceria structure in the Ag/CeO2 sample. Thus, a specific absorption below 200 cm−1 due to the Ag–O–Ce bond vibrations additionally appears in the spectra for the sample (Figure 3), while other bands remain intact.
3.2.2. MnOx and Ag/MnOx Samples
According to the XRD results, the MnOx sample is characterized by the presence of two crystalline phases, namely, the tetragonal Mn3O4 and the cubic Mn2O3 in amounts of ~75 wt.% and ~25 wt.%, respectively (Figure 2, Table 2). The oxide phase crystallites formed in the MnOx sample are noticeably larger than in the case of the CeO2 sample. The Mn2O3 phase is rather well crystallized and characterized by the average XRD crystallite size of 61 nm. The Mn3O4 phase is less ordered and more dispersed, with the average crystallite size being 33 nm. The Raman spectroscopy data confirm the formation of Mn3O4 and Mn2O3 oxides and additionally reveal the presence of some MnO oxide in the MnOx sample. Thus, the Raman spectrum for the MnOx support obtained under 532 nm laser (Figure 3a) is characterized by an intense band at 647 cm−1 and weak bands at 263, 308, 360 and ~480 cm−1 characteristic of Mn3O4 with the spinel structure [41,42,43,44]. The intense band at 647 cm–1 is attributed to the A1g mode of the Mn–O stretching vibration for Mn2+ ions in tetrahedral coordination, and the weak bands at 263, 308, and 360 cm–1 are attributed to the Eg, A1g, B2g, and Eg modes, respectively [42]. The spectrum also contains week bands in the ranges of 150–240 cm–1 and 500–600 cm–1, which are caused by other manganese oxide phases, i.e., Mn2O3 and Mn5O8. These phases are more reliably distinguished in the spectrum obtained under 785 nm laser (Figure 3b) due to the resonance effect of Raman scattering resulting in the presence of well-defined bands at 170, 262, 393, 477, 535 and 580 cm–1 attributed to Mn5O8 modes [45], and the bands at 191, 311 and 621sh cm–1 attributed to Mn2O3 [43,46,47], with those at 286, 367, and 648 cm−1 being assigned to Mn3O4 with a spinel structure [42,44]. The amount of the Mn5O8 phase seems to be negligible and is determined by Raman spectroscopy due to the high extinction coefficient.
Signs n.a. means not available due to the correct determination of a full width at half maximum is impossible.
The Ag introduction is accompanied by the increase in the relative Mn2O3 content up to 76 wt.% and the decrease in that of Mn3O4 up to 24 wt.% in the Ag/MnOx sample according to the XRD results. Besides, the Ag introduction results in the appearance of well-defined bands at 196, 308 and 625sh cm−1 attributed to Mn2O3 and at 170, 263, 533 and 576 cm–1 attributed to MnO in the spectrum for the Ag/MnOx sample obtained under 532 nm laser (Figure 3a). In the spectrum obtained under 785 nm laser (Figure 3b), the relative intensities of the bands of Mn2O3 and MnO increase, with the additional bands assigned to Mn2O3 being distinguished at 191, 393, and 697 cm−1, which is consistent with the increase in the Mn2O3 content in the sample according to the XRD data. The average XRD crystallite size for the main Mn2O3 phase is 52 nm, which is consistent with the presence of Mn2O3 particles revealed by TEM in the Ag/MnOx sample (Figure 5), with their size varying from 20 to 100 nm. Besides, according to high resolution EDX mapping, the silver distribution in the sample is less uniform than for the CeO2 sample. The mapping shows areas depleted (0.15–0.59 wt.%) and enriched (3–36 wt.%) with silver.
Some areas enriched with silver correspond to Ag particles (Figure 5, region II), however, most other areas enriched with silver correspond to oxidized silver species (Figure S1) in accordance with the XPS data (see Section 3.3 for details).
3.2.3. CeMnOx and Ag/CeMnOx Samples
The XRD data for the CeMnOx sample indicate the presence of only cubic phase with the fluorite structure, while individual phases of manganese oxides (MnO2, Mn2O3, Mn3O4, or MnO) are not found. According to the XRD data, the average crystallite size of the fluorite-type phase is 7 nm in the CeMnOx sample, which is almost two times smaller than in the CeO2 sample. At the same time, the parameter a of the fluorite phase of 5.406 Å indicates the presence of CeO2 phase rather than the Ce1-xMnxO2 solid solution with the fluorite structure, which should be characterized by a noticeable compression of the crystal lattice due to the substitution of Ce4+/Ce3+ ions by smaller Mn4+/Mn3+ ions [48,49]. This finding was confirmed by the Raman spectroscopy and TEM data. The Raman spectra for CeMnOx sample contain two intense broad bands with maxima at 454 and 644 cm−1 in the case of 532 nm laser and at 459 and 647 cm−1 in the case of 785 nm laser. In both cases, absorption below 400 cm−1 is additionally observed as well as the additional shoulder peaks at 495, 410, 537, 553, 590, and 620–625 cm−1 can be distinguished. The indicated bands are caused by the individual CeO2 and Mn3O4/Mn2O3 oxides. Such finding is consistent with the formation of undoped CeO2 according to the XRD data analysis. A strong broadening of the bands suggests a high dispersion and/or distortion of the oxide phases presented in the CeMnOx sample in consistency with the HRTEM results indicating the formation a “patchwork” domain microstructure with rather small crystallite with sizes from 1.5 to 3 nm enriched by either Mn or Ce (Figure 6). The Mn/Ce atomic ratio is ~3/1 in some domains and ~1/2 in other domains. The interplanar spaces of ~0.33 and ~0.28 nm are primarily observed for both domain types that are typical for CeO2 fluorite-type (JCPDS 34–0394) and cubic α-Mn2O3 bixbyite structures (JCPDS 41–1442), with the latter being the oxygen-deficient fluorite-related structure.
The Ag introduction does not affect the crystallite size of fluorite phase and does not lead to the appearance of additional crystalline phases in the Ag/CeMnOx sample. At the same time, the Ag introduction leads to a slight increase in the parameter a of the fluorite-type structure up to 5.413 Å in the Ag/CeMn sample (Table 2). This finding can be attributed to the formation of Ce3+ ions characterized by larger ionic radius (i.r.) (i.r. = 1.28 Å for CN = 8) than for Ce4+ ions (i.r. = 0.97 Å for CN = 8 [32]). The latter can result from the “bulk oxygen pump out” effect caused by the reverse spillover of oxygen from CeO2 to Ag [50,51]. The Raman spectroscopy data reveal that the Ag introduction results in some changes in the range of 500–700 cm−1, which confirms the Ce3+ formation in ceria (appearance of the band at ~553 cm−1 assigned to the defect-induced D1 mode) as well as indicates the change in the relative content of Mn3O4/Mn2O3 manganese oxides in the Ag/CeMnOx sample. According to the high resolution EDX mapping, silver is rather evenly distributed throughout the sample, with the XPS data indicating the primarily formation of Ag+ ions dispersed on the surface or subsurface of the oxide support matrix (see Section 3.3 for details). In some parts, isolated silver nanoparticles are observed (Figure S2).
Therefore, the use of the citrate method to prepare the CeMnOx support provides the formation of fluorite-type oxide nanocomposite with the “patchwork” nanodomain microstructure. This is caused by a good homogeneity achieved through mixing of the initial components at the molecular level in the gel formed, with the limited solubility of cerium and manganese oxides resulting in the system disintegration under thermal treatment in air to form nanodomains enriched with either Mn or Ce.
3.3. Surface Composition of the SUPPORTEd Ag Catalysts
The surface composition of the Ag catalysts was additionally studied by XPS. Table 3 shows atomic ratios of the elements on the sample surfaces. According to the XPS data, the Ce/Mn as well as Ag/Ce, Ag/Mn, and Ag/(Ce+Mn) atomic ratios on the surface of the Ag/CeMnOx sample correspond to the nominal ones according to XRF data. This indicates the uniform distribution of Ce, Mn and Ag in the sample, which is consistent with the oxide support microstructure formed by the 1.5–3 nm nanodomains enriched with either Mn or Ce and even Ag distribution over the sample revealed by HRTEM and EDX. For the Ag/CeO2 sample, the Ag/Ce surface atomic ratio is also rather close to the nominal one, but the Ag/Mn surface atomic ratio for the Ag/MnOx sample is significantly lower than the nominal value. The observed deviation of the surface Ag content is associated with the formation of rather large silver oxide particles (10–50 nm) in the samples (Figure S2).
Table 3.
The binding energy Eb(Ag3d5/2), kinetic energy of the AgM4N4.5N4.5 peak, and modified Auger parameter; AgMNN and Ag3d peak area ratio for all samples.
| Sample | Ag3d5/2, eV | AgM4N4.5N4.5, eV | α’, eV | AgMNN/Ag3d |
|---|---|---|---|---|
| Ag/Ce | 368.0 | 355.5 | 723.5 | 0.76 |
| Ag/Mn | 368.1 | 356.7 | 724.8 | 0.64 |
| Ag/CeMn | 367.6 | 356.1 | 723.7 | 0.57 |
3.3.1. Oxidation States of Cerium and Manganese
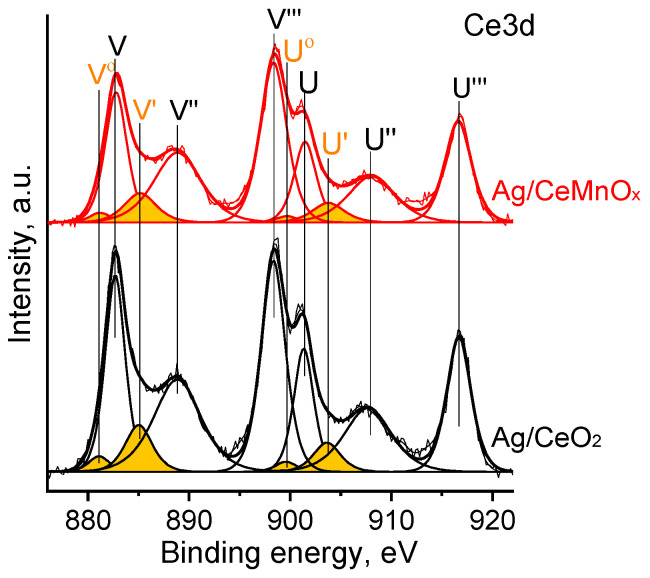
Figure 7 shows the Ce3d spectra for Ag/CeO2 and Ag/CeMnOx samples. Based on the literature data [52], the Ce 3d spectra were fitted with several peaks corresponding to Ce4+ (V, V″,V‴ and U, U″, U‴ peaks) and Ce3+ (V0,V′ and U0,U′ peaks) species. The relative fraction of Ce3+ species calculated as a ratio of the V0,V′ and U0,U′ peak areas to the one of the overall Ce3d peak was ~10% for both samples.
Figure 7.
Ce3d spectra for Ag/CeO2, Ag/CeMnOx. The V0,V′ and U0,U′ peaks corresponding to Ce3+ species are marked in orange color.
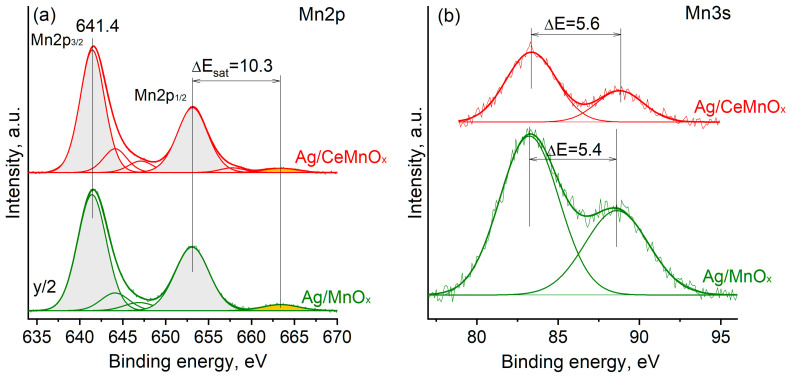
To correctly interpret the manganese charging state, the Mn2p and Mn3s spectra were analyzed (Figure 8). The Mn2p3/2 peak maximum is characterized by Eb(Mn2p3/2) = 641.4 eV. Such Eb is often observed for Mn2O3 and Mn3O4 oxides [53,54]. Analysis of the splitting between the Mn2p1/2 peak maximum and shake-up satellite gives ΔEsat = 10.3 eV. Such ΔEsat value also indicates the formation of Mn2O3 and Mn3O4 oxides [55]. Analysis of the multiplet splitting of the Mn3s spectra was also used to identify the Mn oxidation state. For Ag/Mn and Ag/CeMnOx samples, the ΔE is ~5.4–5.6 eV (Figure 8b). According to the literature data, such Mn3s multiplet splitting is typical for Mn2O3 and Mn3O4 oxides [53,54,55]. Thus, analysis of the Mn2p and Mn3s core-level spectra indicates the preferential formation of Mn3+ species in the composition of Mn2O3 and/or Mn3O4 oxides.
Figure 8.
Mn2p (a) and Mn3s (b) spectra for Ag/MnOx and Ag/CeMnOx. To facilitate the comparison, the intensity of the Mn2p spectrum for the Ag/Mn sample was reduced 2 times.
3.3.2. Oxidation State of Silver
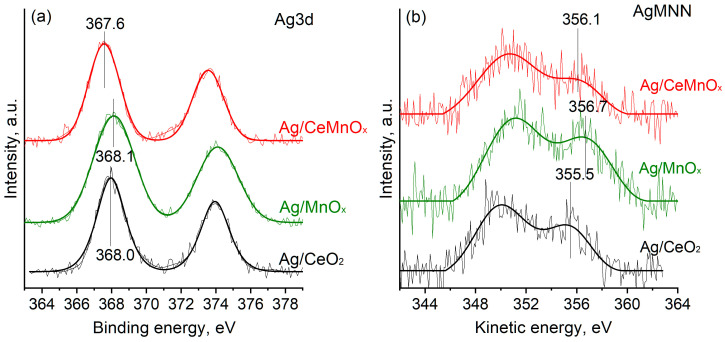
To analyze the Ag oxidation state in the samples, the core-level Ag3d spectra and Auger spectra AgMNN were collected (Figure 9). The Ag3d spectra for all samples can be fitted with one Ag3d spin-orbit doublet peak with a binding energy of the Ag3d5/2 peak Eb(Ag3d5/2) being in the range of 367.6–368.1 eV. The Eb(Ag3d5/2) = 367.6 eV is usually considered characteristic of the oxidized silver species, while the Eb(Ag3d5/2) values of ~368.0 and 368.1 eV are related to the metallic silver species [56,57]. However, it is known that the exact Eb(Ag3d5/2) value is rather sensitive to the size of the silver particles, their interaction with the support and possible charging effects. To get reliable data on the oxidation state of silver in the samples, the modified Auger parameter (α’) calculated as a sum of the binding energy of Ag3d5/2 peak and the kinetic energy of M4N4,5N4,5 Auger peak were considered. Figure 7b shows the corresponding Auger spectra. Analysis of the α’ values (Table 3) indicates that in the Ag/MnOx sample, silver exists in the oxidized state similar to the one in Ag2O species [56,57]. Ag/CeO2 and Ag/CeMnOx samples are characterized by the lower α’ value. Such α’ value was detected for the Ag+ ions in the composition of inorganic salts [33,57]. Thus, the formation of Ag+ ions dispersed on the surface or in the subsurface region of the oxide support matrix can be proposed. The ratio of the AgMNN and Ag3d peak areas is rather similar for all samples. Slightly higher AgMNN/Ag3d value for the Ag/CeO2 sample might indicate higher degree of surface localization of the silver species.
Figure 9.
Ag3d (a) and AgMNN (b) spectra for Ag/CeO2, Ag/MnOx, and Ag/CeMnOx.
3.4. Catalytic Performance
The obtained catalysts and the related support oxides were investigated in the NO SCR with C3H6 in the temperature range from 100 to 500 °C using H2 2.9 vol.% as a reductant in the reaction mixture. All the figures herein reported are related to catalytic tests carried out in presence of hydrogen in the reaction mixture, unless differently specified.
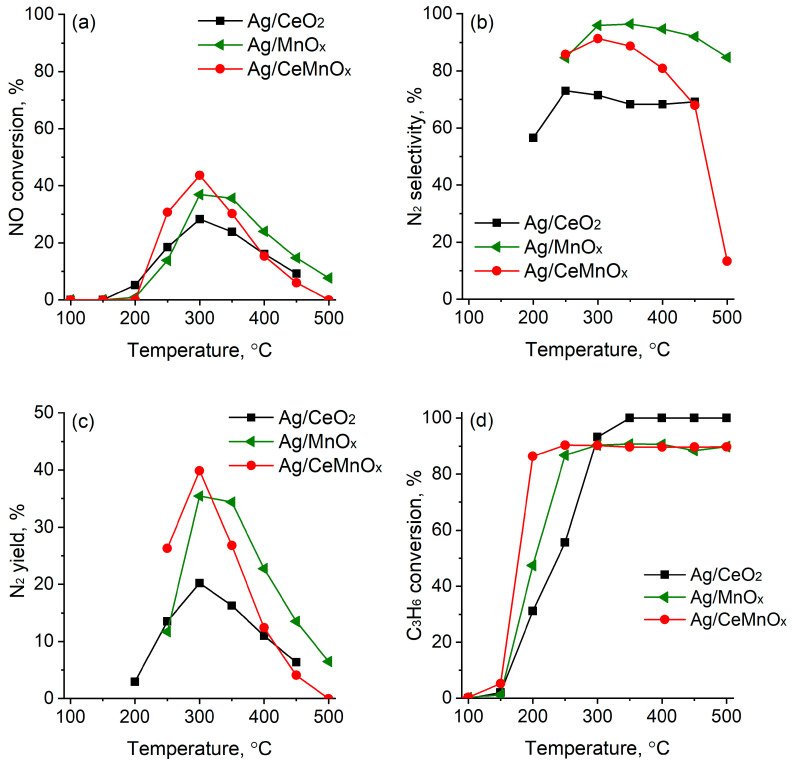
Figure 10 shows the results of HC-SCR with propene over the Ag supported catalysts. The NO conversion over these catalysts declined in as follows: Ag/CeMnOx (44%) > Ag/MnOx (37%) > Ag/CeO2 (28%).
Figure 10.
NOx conversion (a), selectivity to N2 (b), N2 yield (c), and C3H6 conversion (d) over Ag/MnOx, Ag/CeO2 and Ag/CeMnOx catalysts.
In the C3H6-SCR process, the Ag/CeMnOx catalyst shows a sharp increase in NOx conversion from 250 °C, reaching maximum NOx conversion of 44% at 300 °C, and it is much active as compared to the Ag/MnOx and Ag/CeO2 catalysts (Figure 10a). Subsequently, the NOx conversion gradually decreases at 350 °C. This indicates that the combination of Ce and Mn oxides plays an important role in improving the HC-SCR activity at low temperatures. Figure 10b,c show the selectivity to N2 and N2 yield in C3H6-SCR: the Ag/MnOx catalyst exhibits the highest selectivity to N2 in the whole temperature range (250–500 °C) reaching values around 97–98% between 300–500 °C, while the N2 yield that was close to 35%, at 300–350 °C, decreases with increasing temperature (>350 °C) indicating that undesired products such as N2O are formed faster at higher temperatures. Ag/CeMnOx shows similar trend to Ag/MnOx as for the N2 selectivity at 250–300 °C, achieving values close to 90%. However, it suffered a fast decline of N2 yield at T ≥ 350 °C. Ag/CeO2 is the worst catalyst in terms of NO conversion and selectivity to N2.
In the temperature range of 175–500 °C, a high contribution due to the C3H6 oxidation is observed for all the catalysts, with more than 80% of conversion being achieved at 175 °C for the Ag/CeMnOx. By comparing the NO and C3H6 conversion curves, it emerged that the propene oxidation by the oxygen present in the reaction mixture occurs alongside the C3H6-SCR of NO and above 350 °C (when the NO conversion declines) becomes the main reaction.
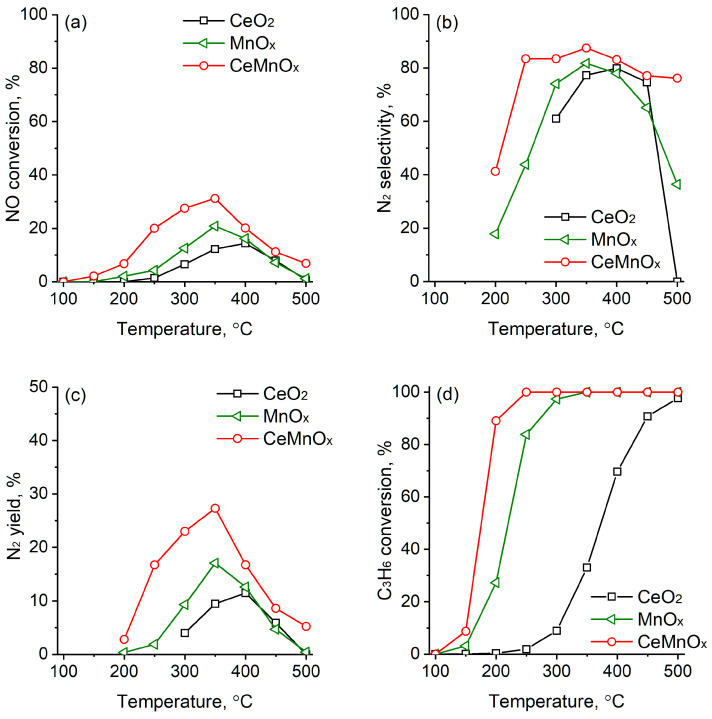
For comparison reasons, the C3H6-SCR of NO was also investigated for the CeO2, MnOx and CeMnOx supports (Figure 11).
Figure 11.
NOx conversion (a), selectivity to N2 (b), N2 yield (c), and C3H6 conversion (d) over MnOx, CeO2 and CeMnOx oxide supports.
According to the results, CeMnOx was the most active among the investigated oxides, although the NO conversion is relatively low in the absence of Ag particles, as can be seen in Figure 11a. The values registered for CeO2 and MnOx are even lower than those for CeMnOx. A similar trend was observed as far as N2 selectivity and yield. Therefore, the results imply that Ag loading significantly improves the NO SCR.
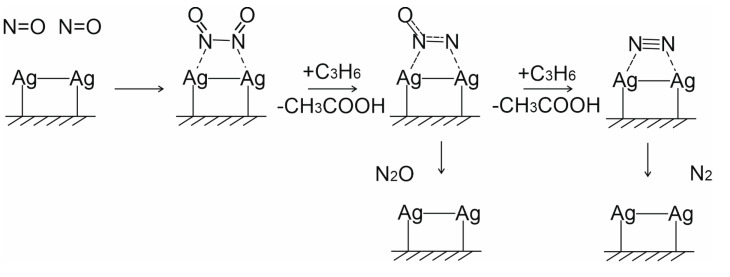
Figure 10d and Figure 11d show the C3H6 conversion curves in C3H6-SCR at different temperatures for the samples studied. For the CeMnOx and MnOx samples, the C3H6 conversion steadily increases between 150 and 200 °C reaching 100% at 250–300 °C (Figure 11d). For CeO2 a sharp increase occurs at 300–400 °C and a total C3H6 conversion is achieved only at 500 °C. Conversely, as above mentioned, the silver catalysts exhibit higher activity than the corresponding supports reaching ~100% conversion at 250–350 °C (Figure 10d). It is worth noting that in all cases, for Ag catalysts and the supports, CO2 was the main product detected by the C3H6 oxidation with negligible amounts of CO (less than 1–2%), according to the carbon mass balance. However, we cannot exclude that secondary products, such as acetic acid (see below Scheme 1), can be formed on the catalyst surface and they are fast oxidized to CO2.
Scheme 1.
Proposed scheme of NO reduction on Ag2+ clusters.
An important aspect to consider is the presence of H2 in the NO-C3H6 reaction mixture [27]. In fact, it is well known that the addition of H2 determines a promoting effect on the C3H6-SCR (“hydrogen effect”) [58]. Such effect results in an increased percentages of strongly adsorbed and decomposed nitrates on the catalyst surface and in the conversion of these adsorbed species into –NCO and –CN, which are supported to be the key surface intermediates for the HC-SCR reaction [59,60].
In this respect, the reaction mixture containing 2.9% of hydrogen was used as a standard. To study the effect of hydrogen addition, the catalytic properties of Ag/CeMnOx and Ag/MnOx samples, as the most perspective, were studied using H2-free reaction mixture. Figure 12 shows the results obtained. The activity and selectivity of the Ag/MnOx catalyst were notably lower without hydrogen in all temperatures studied (see Figure 10 for comparison). Whereas, the Ag/CeMnOx catalyst shows similar catalytic performances in the absence of hydrogen as compared with those in the presence of hydrogen.
Figure 12.
NOx conversion (a), selectivity to N2 (b), and N2 yield (c) over Ag/MnOx and Ag/CeMnOx catalysts without H2 addition in the reaction mixture. Open symbols and dash line are data registered in presence of H2 over the Ag/CeMnOx catalyst, reported for comparison.
To study the catalyst stability, the samples were thermally aged. Figure 13 shows the results on SCR study using standard reaction mixture obtained for aged samples. According to the data obtained, the thermal aging results in deactivation of the Ag/CeO2 sample and notable decrease in catalytic efficiency of the Ag/MnOx sample, while the performances of the Ag/CeMnOx catalyst was practically unchanged, which was assigned to a rather high stability of its phase composition and textural characteristics as compared with those of Ag/CeO2 and Ag/MnOx samples (for details see Supplementary Materials, Tables S1 and S2).
Figure 13.
NOx conversion (a), selectivity to N2 (b), and N2 yield (c) over aged Ag/MnOx, Ag/CeO2 and Ag/CeMnOx catalysts. Open symbols and dash line are data for the Ag/CeMnOx catalyst (not aged), reported for comparison.
Thereby, the results obtained indicate that the 1%Ag/CeMnOx showed the highest catalytic efficiency in both catalytic properties and stability among studied catalyst, with its activity and selectivity being comparable or superior as compared with those previously reported for 1%Ag/CeZrOx catalyst (Table 4) [27]. Thus, the 1%Ag/CeMnOx showed comparable NO conversion of 46% and significantly higher N2 selectivity of 86% as compared with 50% NO conversion and 30% N2 selectivity 1%Ag/CeZrOx under H2-free conditions those resulting in superior overall efficiency (40% N2 yield vs 15% N2 yield). The hydrogen addition in the reaction mixture results in notable improvement of both activity and selectivity of the 1%Ag/CeZrOx catalyst, with the NO conversion increasing up to 80%, N2 selectivity increasing up to 60%, and N2 yield increasing up to 48%. The effect of hydrogen addition on the 1%Ag/CeMnOx catalyst performance was less noticeable, with the NO conversion decreasing up to 44%, N2 selectivity increasing up to 91%, and N2 yield remaining 40%. Despite the slightly inferior overall efficiency of the 1%Ag/CeMnOx catalyst in these conditions, it showed high stability after aging, which makes it promising for further CH-SCR catalyst development.
Table 4.
Comparison of catalytic efficiency (of the 1%Ag/CeMnOx catalysts with similar catalysts available literature data.
| Catalyst | Reaction Conditions | NO Reduction Efficiency | Ref. | ||||||
|---|---|---|---|---|---|---|---|---|---|
| NO, ppm | O2, vol.% | C3H6, vol.% | H2, vol.% | WHSV, mL g−1 h−1 | X(NO), % | S(N2), % | Y(N2), % | ||
| 1%Ag/CeMnOx | 1000 | 10 | 3600 | 2.9 | 25,000 | 44 | 91 | 40 | This work |
| 1%Ag/CeMnOx | 1000 | 10 | 3600 | - | 25,000 | 46 | 86 | 40 | This work |
| 1%Ag/CeMnOx (aged) | 1000 | 10 | 3600 | - | 25,000 | 44 | 90 | 40 | This work |
| 1%Ag/CeZrOx | 700 | 3 | 700 | 0.5 | 45,000 | 80 | 60 | 48 | [28] |
| 1%Ag/CeZrOx | 700 | 3 | 700 | - | 45,000 | 50 | 30 | 15 | [28] |
WHSV is the weight hourly space velocity; X(NO) is NO conversion, S(N2) is N2 selectivity and Y(N2) is yield.
As previously discussed and reported in literature [58], different Ag species such as isolated silver cations (Ag+), oxidized silver clusters (Agnδ+), and metallic silver clusters (Agn0) can been observed in the Ag catalysts and HC-SCR catalysts; the oxidized silver species (Ag+ and/or Agnδ+) play an important role, in fact they are proposed to be the active species in the NO-SCR reaction with propene, whereas the Agn0 metallic clusters are responsible for the nonselective oxidation of hydrocarbons. Thus, NO adsorption with dimer formation was shown to be favourable on the supported silver Ag2+ clusters followed by its reduction with HC or alcohol to form N2 and N2O [61]. The NO reduction activity was clarified to be controlled by partial oxidation of C3H8 mainly to surface acetates [59]. Scheme 1 presents the proposed scheme of NO reduction on Agnδ+, specifically Ag2+, clusters based on the literature data.
Based on the so far reported literature, the catalytic performance of supported Ag catalysts is controlled by many factors, including morphological, structural and electronic ones. In the present work, the citrate sol-gel method has produced a mixed oxide CeMnOx (with molar ratio Ce/Mn = 1) with “patchwork” nanodomain microstructure, where silver is uniformly distributed as Ag+ and/or Agnδ+ species that are supposed provide NO adsorption to form N2O2 dimers that are subsequently reduced with propylene to form N2 at low temperatures. At high temperatures (>300 °C), the competitive total propylene oxidation seems to lead to the decrease in the catalyst activity in the NO reduction.
4. Conclusions
The Ag/CeO2, Ag/MnOx, and Ag/CeMnOx catalyst with 1 wt.% Ag were successfully prepared using a combination of citrate sol-gel method for support synthesis and incipient wetness impregnation with [Ag(NH3)2]NO3 aqueous solution to deposit the active component. The used approaches provided the formation in the CeMnOx of a characteristic “patchwork” domain microstructure that along with the presence of well dispersed Ag+/Agnδ+ species strongly interacting with the support, produced a catalyst with higher NO-SCR performance and perfect stability compared to Ag/CeO2 and Ag/MnOx systems, achieving 44% NO conversion at 300 °C under a WSHV of 25,000 mL g−1 h−1 and selectivity to N2 close to 90%. At temperatures above 300 °C, a high contribution from the C3H6 oxidation was observed for all catalysts. Since it is well agreed that for an efficient NO SCR catalyst it is required to increase the NO conversion values and to expand the temperature range of operation, it can be concluded that this achievement may be associated with the investigation of different Ag loadings and as well with the decrease of CeO2 molar fraction in a CeMnOx mixed oxide, while maintaining its microstructure.
Acknowledgments
The TEM studies were carried out using facilities of the shared research center “National center of investigation of catalysts” at Boreskov Institute of Catalysis. The authors acknowledge V.A. Svetlichnyi (Tomsk State University) for Raman spectroscopy study and M.A. Salaev (Tomsk State University) for language review.
Supplementary Materials
The following supporting information can be downloaded at: https://www.mdpi.com/article/10.3390/nano13050873/s1, Figure S1: HAADF STEM (a) and high resolution EDX mapping of indicated region (b) for the Ag/MnOx sample; Figure S2: HRTEM image (a) and high resolution EDX mapping (b) for the Ag/CeMnOx sample. Table S1: Specific surface area (SSA) and total pore volume (V) of supports and catalysts determined by low-temperature nitrogen adsorption/desorption data; Table S2: Phase composition of aged samples and characteristics of their crystalline phases according to XRD data.
Author Contributions
Conceptualization, O.V.V. and L.F.L.; investigation, E.L.G., T.S.K., M.V.G., L.C., D.Y.S., G.P., L.S.K., O.A.S.; formal analysis, E.L.G., T.S.K., M.V.G., D.Y.S., L.C., G.P., L.S.K., O.A.S.; writing—original draft preparation, E.L.G., T.S.K.; project administration, O.V.V. and L.F.L. All authors have read and agreed to the published version of the manuscript.
Data Availability Statement
No applicable.
Conflicts of Interest
The authors declare no conflict of interest.
Funding Statement
This work was financially supported by the Ministry for Science and Education of the Russian Federation (Project No. 075-15-2021-1388) and by the Italian Ministry of Foreign Affairs and International Cooperation (“Progettazione di Catalizzatori Attivi a base di Ag-Pt depositati su Ce e Mn modificati con Y per il Post-Trattamento dei Gas di Scarico emessi dai Motori Diesel” Prot. MAE01538512021-10-26).
Footnotes
Disclaimer/Publisher’s Note: The statements, opinions and data contained in all publications are solely those of the individual author(s) and contributor(s) and not of MDPI and/or the editor(s). MDPI and/or the editor(s) disclaim responsibility for any injury to people or property resulting from any ideas, methods, instructions or products referred to in the content.
References
- 1.Boretti A. Advantages and Disadvantages of Diesel Single and Dual-Fuel Engines. Front. Mech. Eng. 2019;5:64. doi: 10.3389/fmech.2019.00064. [DOI] [Google Scholar]
- 2.Reşitoʇlu I.A., Altinişik K., Keskin A. The pollutant emissions from diesel-engine vehicles and exhaust aftertreatment systems. Clean Technol. Environ. Policy. 2015;17:15–27. doi: 10.1007/s10098-014-0793-9. [DOI] [Google Scholar]
- 3.Salaev M.A., Kulchakovskaya E.V., Liotta L.F., Vodyankina O.V. Bimetallic Ag-based catalysts for low-temperature SCR: Quo vadis? Appl. Catal. A. 2022;644:118815. doi: 10.1016/j.apcata.2022.118815. [DOI] [Google Scholar]
- 4.Rodríguez-Fernández J., Tsolakis A., Ahmadinejad M., Sitshebo S. Investigation of the deactivation of a NOx-reducing hydrocarbon-selective catalytic reduction (HC-SCR) catalyst by thermogravimetric analysis: Effect of the fuel and prototype catalyst. Energy Fuels. 2010;24:992–1000. doi: 10.1021/ef900996f. [DOI] [Google Scholar]
- 5.Mrad R., Aissat A., Cousin R., Courcot D., Siffert S. Catalysts for NOx selective catalytic reduction by hydrocarbons (HC-SCR) Appl. Catal. A. 2015;504:542–548. doi: 10.1016/j.apcata.2014.10.021. [DOI] [Google Scholar]
- 6.Gómez-García M.A., Pitchon V., Kiennemann A. Pollution by nitrogen oxides: An approach to NOx abatement by using sorbing catalytic materials. Environ. Int. 2005;31:445–467. doi: 10.1016/j.envint.2004.09.006. [DOI] [PubMed] [Google Scholar]
- 7.Worch D., Suprun W., Gläser R. Supported transition metal-oxide catalysts for HC-SCR DeNOx with propene. Catal. Today. 2011;176:309–313. doi: 10.1016/j.cattod.2010.12.008. [DOI] [Google Scholar]
- 8.Napolitano P., Liotta L.F., Guido C., Tornatore C., Pantaleo G., La Parola V., Beatrice C. Insights of Selective Catalytic Reduction Technology for Nitrogen Oxides Control in Marine Engine Applications. Catalysts. 2022;12:1191. doi: 10.3390/catal12101191. [DOI] [Google Scholar]
- 9.Liu W., Long Y., Zhou Y., Liu S., Tong X., Yin Y., Li X., Hu K., Hu J. Excellent low temperature NH3-SCR and NH3-SCO performance over Ag-Mn/Ce-Ti catalyst: Evaluation and characterization. Mol. Catal. 2022;528:112510. doi: 10.1016/j.mcat.2022.112510. [DOI] [Google Scholar]
- 10.Xu J., Qin Y., Wang H., Guo F., Xie J. Recent advances in copper-based zeolite catalysts with low-temperature activity for the selective catalytic reduction of NOx with hydrocarbons. New J. Chem. 2020;44:817–831. doi: 10.1039/C9NJ04735B. [DOI] [Google Scholar]
- 11.Miyadera T. Alumina-supported silver catalysts for the selective reduction of nitric oxide with propene and oxygen-containing organic compounds. Appl. Catal. B. 1993;2:199–205. doi: 10.1016/0926-3373(93)80048-I. [DOI] [Google Scholar]
- 12.Zhang X.W., Su Y.a.-X., Cheng J.H., Lin R., Wen N.N., Deng W.Y., Zhou H. Effect of Ag on deNOx performance of SCR-C3H6 over Fe/Al-PILC catalysts. J. Fuel Chem. Technol. 2019;47:1368–1378. doi: 10.1016/S1872-5813(19)30055-6. [DOI] [Google Scholar]
- 13.Grabchenko M.V., Mamontov G.V., Zaikovskii V.I., Parola VLa Liotta L.F., Vodyankina O.V. The role of metal–support interaction in Ag/CeO2 catalysts for CO and soot oxidation. Appl. Catal. B. 2019;260:118148. doi: 10.1016/j.apcatb.2019.118148. [DOI] [Google Scholar]
- 14.Cao F., Xiang J., Su S., Wang P., Hu S., Sun L. Ag modified Mn-Ce/γ-Al2O3 catalyst for selective catalytic reduction of NO with NH3 at low-temperature. Fuel Process. Technol. 2015;135:66–72. doi: 10.1016/j.fuproc.2014.10.021. [DOI] [Google Scholar]
- 15.Meunier F.C., Breen J.P., Zuzaniuk V., Olsson M., Ross J.R.H. Mechanistic aspects of the selective reduction of NO by propene over alumina and silver-alumina catalysts. J. Catal. 1999;187:493–505. doi: 10.1006/jcat.1999.2622. [DOI] [Google Scholar]
- 16.Kannisto H., Ingelsten H.H., Skoglundh M. Ag-Al2O3 catalysts for lean NOx reduction –Influence of preparation method and reductant. J. Mol. Catal. A Chem. 2009;302:86–96. doi: 10.1016/j.molcata.2008.12.003. [DOI] [Google Scholar]
- 17.Andreoli S., Deorsola F.A., Pirone R. MnOx-CeO2 catalysts synthesized by solution combustion synthesis for the low-temperature NH3-SCR. Catal. Today. 2015;253:199–206. doi: 10.1016/j.cattod.2015.03.036. [DOI] [Google Scholar]
- 18.Sun H., Park S.J. Recent advances in MnOx/CeO2-based ternary composites for selective catalytic reduction of NOx by NH3: A review. Catalysts. 2021;11:1519. doi: 10.3390/catal11121519. [DOI] [Google Scholar]
- 19.Ma Y., Mu B., Yuan D., Zhang H., Xu H. Design of MnO2/CeO2-MnO2 hierarchical binary oxides for elemental mercury removal from coal-fired flue gas. J. Hazard. Mater. 2017;333:186–193. doi: 10.1016/j.jhazmat.2017.03.032. [DOI] [PubMed] [Google Scholar]
- 20.Campbell C.T., Peden C.H.F. Oxygen vacancies and catalysis on ceria surfaces. Science. 2005;309:713–714. doi: 10.1126/science.1113955. [DOI] [PubMed] [Google Scholar]
- 21.Kašpar J., Fornasiero P., Graziani M. Use of CeO2-based oxides in the three-way catalysis. Catal. Today. 1999;50:285–298. doi: 10.1016/S0920-5861(98)00510-0. [DOI] [Google Scholar]
- 22.Peña D.A., Uphade B.S., Smirniotis P.G. TiO2-supported metal oxide catalysts for low-temperature selective catalytic reduction of NO with NH3: I. Evaluation and characterization of first row transition metals. J. Catal. 2004;221:421–431. doi: 10.1016/j.jcat.2003.09.003. [DOI] [Google Scholar]
- 23.Kapteijn F., Singoredjo L., Andreini A., Moulijn J.A. Activity and selectivity of pure manganese oxides in the selective catalytic reduction of nitric oxide with ammonia. Appl. Catal. B. 1994;3:173–189. doi: 10.1016/0926-3373(93)E0034-9. [DOI] [Google Scholar]
- 24.Consentino L., Pantaleo G., La Parola V., Migliore C., La Greca E., Liotta L.F. NH3-NO SCR catalysts for engine exhaust gases abatement: Replacement of toxic V2O5 with MnOx to improve the environmental sustainability. Top. Catal. 2022 doi: 10.1007/s11244-022-01758-4. [DOI] [Google Scholar]
- 25.Tang X., Zhang Y., Lei Y., Liu Y., Yi H., Gao F. Promotional catalytic activity and reaction mechanism of Ag-modified Ce0.6Zr0.4O2 catalyst for catalytic oxidation of ammonia. J. Environ. Sci. 2023;124:491–504. doi: 10.1016/j.jes.2021.11.027. [DOI] [PubMed] [Google Scholar]
- 26.Ni P., Wang X., Li H. A review on regulations, current status, effects and reduction strategies of emissions for marine diesel engines. Fuel. 2020;279:118477. doi: 10.1016/j.fuel.2020.118477. [DOI] [Google Scholar]
- 27.Duan J., Zhao L., Gao S., Li X. New aspects on a low-medium temperature mechanism of H2-assisted C3H6-SCR over xAg-CeZr catalyst. Fuel. 2021;305:121574. doi: 10.1016/j.fuel.2021.121574. [DOI] [Google Scholar]
- 28.Zhou W., Shao Z., Jin W. Synthesis of nanocrystalline conducting composite oxides based on a non-ion selective combined complexing process for functional applications. J. Alloys Compd. 2006;426:368–374. doi: 10.1016/j.jallcom.2006.02.029. [DOI] [Google Scholar]
- 29.Zhao M., Cai W., Li J. Preparation and reaction mechanism of novel CexCoyCuz oxide composite catalysts towards oxidation of o-xylene. J. Rare Earths. 2022;40:1573–1583. doi: 10.1016/j.jre.2021.08.020. [DOI] [Google Scholar]
- 30.Grabchenko M.V., Dorofeeva N.V., Lapin I.N., La Parola V., Liotta L.F., Vodyankina O.V. Study of Nickel Catalysts Supported on MnOx–CeO2 Mixed Oxides in Dry Reforming of Methane. Kinet. Catal. 2021;62:765–777. doi: 10.1134/S0023158421060069. [DOI] [Google Scholar]
- 31.Atabak Asadi A., Behrouzifar A., Mohammadi T., Pak A. Effects of Nano Powder Synthesis Methods, Shaping and Sintering Conditions on Microstructure and Oxygen Permeation of La0.6Sr0.4Co0.2Fe0.8O3-d (LSCF) Perovskite-type Membranes. High Temp. Mater. Proc. 2012;31:47–59. doi: 10.1515/htmp.2011.128. [DOI] [Google Scholar]
- 32.Bugrova T.A., Kharlamova T.S., Svetlichnyi V.A., Savel’eva A.S., Salaev M.A., Mamontov G.V. Insights into formation of Pt species in Pt/CeO2 catalysts: Effect of treatment conditions and metal-support interaction. Catal. Today. 2021;375:36–47. doi: 10.1016/j.cattod.2020.04.039. [DOI] [Google Scholar]
- 33.Kibis L.S., Svintsitskiy D.A., Kardash T.Y., Slavinskaya E.M., Gotovtseva E.Y., Svetlichnyi V.A., Boronin A.I. Interface interactions and CO oxidation activity of Ag/CeO2 catalysts: A new approach using model catalytic systems. Appl. Catal. A. 2019;570:51–61. doi: 10.1016/j.apcata.2018.11.005. [DOI] [Google Scholar]
- 34.Kibis L., Simanenko A., Stadnichenko A., Zaikovskii V., Boronin A. Probing of Pd4+ Species in a PdOx–CeO2 System by X-Ray Photoelectron Spectroscopy. J. Phys. Chem. C. 2021;125:20845–20854. doi: 10.1021/acs.jpcc.1c04646. [DOI] [Google Scholar]
- 35.Moulder J., Stickle W., Sobol P., Bombe K.D. Handbook of X-ray Photoelectron Spectroscopy. Perkin-Elmer Corp.; Eden Prairie, MN, USA: 1992. 261p [Google Scholar]
- 36.Thommes M., Kaneko K., Neimark A.V., Olivier J.P., Rodriguez-Reinoso F., Rouquerol J., Sing K.S.W. Physisorption of gases, with special reference to the evaluation of surface area and pore size distribution (IUPAC Technical Report) Pure Appl. Chem. 2015;87:1051–1069. doi: 10.1515/pac-2014-1117. [DOI] [Google Scholar]
- 37.Taniguchi T., Watanabe T., Sugiyama N., Subramani A.K., Wagata H., Matsushita N., Yoshimura M. Identifying defects in ceria-based nanocrystals by UV resonance Raman spectroscopy. J. Phys. Chem. C. 2009;113:19789–19793. doi: 10.1021/jp9049457. [DOI] [Google Scholar]
- 38.Derevyannikova E.A., Kardash T.Y., Stadnichenko A.I., Stonkus O.A., Slavinskaya E.M., Svetlichnyi V.A., Boronin A.I. Structural Insight into Strong Pt–CeO2 Interaction: From Single Pt Atoms to PtOx Clusters. J. Phys. Chem. C. 2019;123:1320–1334. doi: 10.1021/acs.jpcc.8b11009. [DOI] [Google Scholar]
- 39.Schilling C., Hofmann A., Hess C., Ganduglia-Pirovano M.V. Raman Spectra of Polycrystalline CeO2: A Density Functional Theory Study. J. Phys. Chem. C. 2017;121:20834–20849. doi: 10.1021/acs.jpcc.7b06643. [DOI] [Google Scholar]
- 40.Schilling C., Ganduglia-Pirovano M.V., Hess C. Experimental and Theoretical Study on the Nature of Adsorbed Oxygen Species on Shaped Ceria Nanoparticles. J. Phys. Chem. Lett. 2018;9:6593–6598. doi: 10.1021/acs.jpclett.8b02728. [DOI] [PubMed] [Google Scholar]
- 41.Yang X., Wang X., Zhang G., Zheng J., Wang T., Liu X., Shu C., Jiang L., Wang C. Enhanced electrocatalytic performance for methanol oxidation of Pt nanoparticles on Mn3O4-modified multi-walled carbon nanotubes. Int. J. Hydrogen Energy. 2012;37:11167–11175. doi: 10.1016/j.ijhydene.2012.04.153. [DOI] [Google Scholar]
- 42.Larbi T., Doll K., Manoubi T. Density functional theory study of ferromagnetically and ferrimagnetically ordered spinel oxide Mn3O4. A quantum mechanical simulation of their IR and Raman spectra. J. Alloys Compd. 2016;688:692–698. doi: 10.1016/j.jallcom.2016.07.041. [DOI] [Google Scholar]
- 43.Gao T., Fjellvåg H., Norby P. A comparison study on Raman scattering properties of α- and β-MnO2. Anal. Chim. Acta. 2019;648:235–239. doi: 10.1016/j.aca.2009.06.059. [DOI] [PubMed] [Google Scholar]
- 44.Julien C.M., Massot M., Poinsignon C. Lattice vibrations of manganese oxides. Part I. Periodic structures. Spectrochim. Acta A. 2004;60:689–700. doi: 10.1016/S1386-1425(03)00279-8. [DOI] [PubMed] [Google Scholar]
- 45.Gao T., Norby P., Krumeich F., Okamoto H., Nesper R., Fjellvåg H. Synthesis and properties of layered-structured Mn5O8 nanorods. J. Phys. Chem. C. 2009;114:922–928. doi: 10.1021/jp9097606. [DOI] [Google Scholar]
- 46.Aghbolaghy M., Soltan J., Chen N. Role of Surface Carboxylates in the Gas Phase Ozone-Assisted Catalytic Oxidation of Toluene. Catal. Lett. 2017;147:2421–2433. doi: 10.1007/s10562-017-2143-0. [DOI] [Google Scholar]
- 47.Shim S.-H., LaBounty D., Duffy T.S. Raman spectra of bixbyite, Mn2O3, up to 40 GPa. Phys. Chem. Miner. 2011;38:685–691. doi: 10.1007/s00269-011-0441-4. [DOI] [Google Scholar]
- 48.Huang H., Liu J., Sun P., Ye S., Liu B. Effects of Mn-doped ceria oxygen-storage material on oxidation activity of diesel soot. RSC Adv. 2017;7:7406. doi: 10.1039/C6RA27007G. [DOI] [Google Scholar]
- 49.Murugan B., Ramaswamy A.V. Nature of Manganese Species in Ce1-xMnxO2-ä Solid Solutions Synthesized by the Solution Combustion Route. Chem. Mater. 2005;17:3983–3993. doi: 10.1021/cm050401j. [DOI] [Google Scholar]
- 50.Wang H., Luo S., Zhang M., Liu W., Wu X., Liu S. Roles of oxygen vacancy and O in oxidation reactions over CeO2 and Ag/CeO2 nanorod model catalysts. J. Catal. 2018;368:365–378. doi: 10.1016/j.jcat.2018.10.018. [DOI] [Google Scholar]
- 51.Chang S., Li M., Hua Q., Zhang L., Ma Y., Ye B., Huang W. Shape-dependent interplay between oxygen vacancies and Ag–CeO2 interaction in Ag/CeO2 catalysts and their influence on the catalytic activity. J. Catal. 2012;293:195–204. doi: 10.1016/j.jcat.2012.06.025. [DOI] [Google Scholar]
- 52.Romeo M., Bak K., El Fallah J., Le Normand F., Hilaire L. XPS Study of the reduction of cerium dioxide. Surf. Interface Anal. 1993;20:508–512. doi: 10.1002/sia.740200604. [DOI] [Google Scholar]
- 53.Chigane M., Ishikawa M. Manganese Oxide Thin Film Preparation by Potentiostatic Electrolyses and Electrochromism. J. Electrochem. Soc. 2000;147:2246. doi: 10.1149/1.1393515. [DOI] [Google Scholar]
- 54.Lei K., Han X., Hu Y., Liu X., Cong L., Cheng F., Chen J. Chemical etching of manganese oxides for electrocatalytic oxygen reduction reaction. Chem. Commun. 2015;51:11599–11602. doi: 10.1039/C5CC03155A. [DOI] [PubMed] [Google Scholar]
- 55.Fujiwara M., Matsushita T., Ikeda S. Evaluation of Mn3s X-ray photoelectron spectroscopy for characterization of manganese complexes. J. Electron Spectros. Relat. Phenom. 1995;74:201–206. doi: 10.1016/0368-2048(94)02375-1. [DOI] [Google Scholar]
- 56.Waterhouse G.I.N., Bowmaker G.A., Metson J.B. Oxidation of a polycrystalline silver foil by reaction with ozone. Appl. Surf. Sci. 2001;183:191–204. doi: 10.1016/S0169-4332(01)00561-X. [DOI] [Google Scholar]
- 57.Tjeng L.H., Meinders M.B.J., van Elp J., Ghijsen J., Sawatzky G.A., Johnson R.L. Electronic structure of Ag2O. Phys. Rev. B. 1990;41:3190–3199. doi: 10.1103/PhysRevB.41.3190. [DOI] [PubMed] [Google Scholar]
- 58.Wang J., You R., Qian K., Pan Y., Yang J., Huang W. Effect of the modification of alumina supports with chloride on the structure and catalytic performance of Ag/Al2O3 catalysts for the selective catalytic reduction of NOx with propene and H2/propene. Chin. J. Catal. 2021;42:2242–2253. doi: 10.1016/S1872-2067(21)63904-9. [DOI] [Google Scholar]
- 59.Breen J.P., Burch R. A review of the effect of the addition of hydrogen in the selective catalytic reduction of NOx with hydrocarbons on silver catalysts. Top. Catal. 2006;39:53–58. doi: 10.1007/s11244-006-0037-2. [DOI] [Google Scholar]
- 60.Sazama P., Čapek L., Drobná H., Sobalík Z., Dědeček J., Arve K., Wichterlová B. Enhancement of decane-SCR-NOx over Ag/alumina by hydrogen. Reaction kinetics and in situ FTIR and UV-vis study. J. Catal. 2005;232:302–317. doi: 10.1016/j.jcat.2005.03.013. [DOI] [Google Scholar]
- 61.Matulis V.E., Ragoyja E.G., Ivashkevich O.A., Lyakhov D.A., Michels D. DFT Study of NO Reduction Process on Ag/γ-Al2O3 Catalyst: Some Aspects of Mechanism and Catalyst Structure. J. Phys. Chem. C. 2020;125:419–426. doi: 10.1021/acs.jpcc.0c08417. [DOI] [Google Scholar]
Associated Data
This section collects any data citations, data availability statements, or supplementary materials included in this article.
Supplementary Materials
Data Availability Statement
No applicable.


