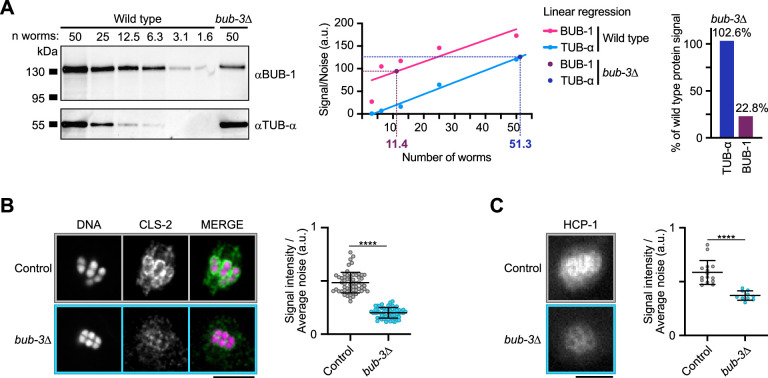
(A) Left: Western blot of full-protein extracts. BUB-1 (top) and α-tubulin (TUB-α, bottom) in wild type and bub-3(ok3437) mutants (bub-3∆). The number of worms extracted is indicated (n worms). Center: Quantification and linear regression of corrected intensities of BUB-1 and TUB-α in wild type and bub-3∆ extracts. Right: Percentage of BUB-1 and TUB-α signals in bub-3∆ relative to wild type. (B) Immunolocalization of CLS-2 (left) and quantification of CLS-2 signal at kinetochores (right) in bub-3(ok3437) mutants (bub3∆, n=58) compared to wild type controls (n=58). Note the ring localization of CLS-2, which is clearly visible on the left- and right-most chromosomes of the wild-type spindle. (C) Stills of metaphase I oocytes from live imaging of endogenously tagged GFP::HCP-1 (left), and quantification of GFP signal/average noise in the whole spindle, measured at the frame preceding spindle rotation at the cortex (right), in bub-3(ok3437) mutants (bub3∆, n=10) compared to controls (n=15). Error bars, Mean and standard deviation. Unpaired t-test, alpha = 0.05, p<0.0001. Scale bars, 5 µm.
Figure 1—figure supplement 1—source data 1. Panel A source data 1.Folder containing raw images and uncropped annotated images of Western blot of BUB-1 and tubulin in full-protein extracts of wild type and bub-3(ok3437) (bub-3∆) mutant worms.
Figure 1—figure supplement 1—source data 2. Panel A source data 2.Signal measurements on western blots, performed in Fiji. Simple linear regression was performed using GraphPad Prism.
Figure 1—figure supplement 1—source data 3. Panel B source data.Quantification of CLS-2 signal at kinetochores in bub-3(ok3437) mutants (bub-3∆) compared to wild type N2 controls. Signals were measured in Fiji from immunolocalized proteins. Details of statistical analyses are provided.
Figure 1—figure supplement 1—source data 4. Panel C source data.Quantification of HCP-1 signal at kinetochores in bub-3(ok3437) mutants (bub-3∆) compared to controls. Signals were measured in Fiji from live imaging of GFP::HCP-1. Details of statistical analyses are provided.


