

Abstract
Space cooling is the fastest-growing energy end-use in buildings worldwide, and Ecuador is no exception. Nevertheless, the last update of the Minimum Energy Performance Standards (MEPS) for air conditioners was in 2013 (EER 3.2W/W); since then, no new standards have been proposed in Ecuador. This study is the first assessment of stricter MEPS and estimation of benefits for the consumers and society of the residential sector in Guayaquil, Ecuador. The life cycle cost, payback time, net present value, electricity savings, and CO2 mitigation are the outputs from the Policy Analysis Modeling System (PAMS) methodology followed. The analysis considers future economic scenarios until 2035. Also, a new engineering approach based on linear optimization defines ACs designs in compliance with the proposed MEPS at the lowest cost. Therefore we can avoid setting less ambitious energy-efficiency targets when efficiency options are limited in the market (this is the Ecuadorian case). The analyzed MEPS are those proposed by UNEP and by the renewal program of inefficient equipment of the Ecuadorian Government. Our estimates show that AC demand can reach 17.3% of the total residential electricity demand in the business-as-usual scenario and 21.4% in the high economic growth scenario until 2035.
Furthermore, the results show a significant gap between the proposed MEPS which can be progressively bridged. The best standard from the consumer perspective is EER 4.3W/W, while from the societal perspective, it is EER 5.5W/W. Stricter MEPS can reduce AC electricity demand and energy-related emissions between 5.7% and 31%, depending on the selected scenario. Therefore, stricter MEPS for AC represents a cost-effective option to reduce energy needs and emissions from air conditioners and a concrete action to support the national energy efficiency policies and nationally determined contributions for the residential sector.
Keywords: Energy demand, Residential air conditioning, Minimum energy performance standards, Energy efficiency regulation
Highlights
-
•
MEPS for AC in LATAM needs to increase by 67% to follow a sustainable development path.
-
•
Stricter MEPS can reduce energy needs and energy-related emissions by up to 31%.
-
•
Even in a low economic-growth scenario, stricter MEPS are a cost-effective option.
-
•
UNEP Model Regulations represent a challenge in low economic-growth scenarios.
-
•
Equipment costs, low electricity prices, and low income limit the increase in ACs MEPS.
1. Introduction
Space cooling is the fastest-growing energy end-use in buildings worldwide, its energy demand was 2020 TWh, and energy-related emissions were 1135 million tonnes (Mt) of CO2, representing 6% and 12% of total energy demand and energy-related emissions, respectively, in 2016. It is expected to triple by 2050 without further efforts to increase the energy efficiency of air conditioning systems and reduce the cooling needs of buildings through better designs and materials [1]. This rapid increase raises concerns about meeting energy security goals, climate change ambitions, and several other Sustainable Development Goals (SDGs) related to health, affordable energy, and sustainable cities especially in developing countries where a lack of energy efficiency policies or their strengthening does not promote the adoption of higher energy efficiency products [2].
In terms of energy efficiency, the global stock of air conditioning units (AC) currently has an average Seasonal Energy Efficiency Ratio (SEER1) of 4.0 W/W and is expected to increase by less than 1% per year until 2050; however, this rate needs to rise 4.6 times to half the projected energy demand, supporting a sustainable pathway for space cooling. Fortunately, such efficiency levels are achievable and below the maximum commercially available today. On the other hand, purchasing preferences are among the main issues in increasing energy efficiency since consumers tend to prefer cheaper but less efficient units (immediate savings) versus more expensive units with higher efficiency levels (net savings within the equipment lifetime) [3]. This represents a challenge even for manufacturing countries; as, in markets like Japan, South Korea, and the United States, typically sold units have efficiencies barely 10–30% higher than less efficient equipment, even though there are equipment two to three times more efficient in the same markets [1]. Thus, AC purchasing trends regarding energy efficiency are not improving as fast as technological development.
Policy tools like Minimum Energy Performance Standards (MEPS) are among the most cost-effective programs to increase energy efficiency, removing less efficient units by establishing increasingly higher energy requirements for their sale [4,5]. However, MEPS needs to be progressively increased to harness technological development's benefits [6]. Several academic papers have analyzed the impacts of setting stricter AC standards in the literature. For example, Shi [7] shows how to set up MEPS from scratch in technically disadvantaged countries using The Policy Analysis Modeling System (PAMS) model [8]. Karali et al. [9] analyzed new MEPS for room AC in China, and their results show that the benefits increase with shorter regulatory reviews and decrease with higher timeframes. Schleich et al. [10] show that strengthening policies such as MEPS and energy labeling in the European Union expand markets for high-efficiency cooling appliances, leading to a market transformation.
Regulatory assessments are important to reduce the uncertainty in the decision-making process and establish higher standards consistently. Nevertheless, In Latin America, few regulatory assessments are available; among the most recent are Martínez-Montejo et al. [6] which perform an evaluation of the past and future impacts of the MEPS for household appliances, including ACs in Mexico, developing a replacement technology model to estimate energy savings and mitigation of CO2 emissions for different appliances’ lifetimes; and Augustus de Melo et al. [11], they use a bottom-up approach to estimate the energy consumption of ACs in Brazil, as well as the impact of increasing the MEPS for ACs, their results show that even in conditions of high equipment costs and discount rates, new MEPS have significant benefits for the consumers and the society.
In Ecuador, more than 50% of the population lives in warm and humid climates. Therefore, the energy demand for space cooling significantly impacts the national electricity supply and continues to increase as AC ownership grows. The current MEPS (EER 3.2 W/W) was established in 2013 as part of the national energy policy to reduce residential energy demand and obtain economic savings from new infrastructure avoided for electricity generation. Since then, there have been no plans to increase the MEPS, despite their importance in reducing energy demand for space cooling. This study is the first assessment of stricter MEPS in the Ecuadorian context, considering economic and energy savings and energy-related emission reductions; its purpose is to show these benefits for the consumers and society, using a consistent methodology (PAMS-MEPS).
Before this regulatory assessment, it is necessary to know the MEPS and their equipment costs in the market; there are two approaches to obtaining this proposed standard cases. The first one (engineering approach) evaluates technology options that might improve the energy efficiency of typical AC units, considering technical feasibility and costs. The second (market approach) performs a product screening and compares costs and energy use. However, the market approach generally produces less ambitious energy-efficiency targets when efficiency options are limited in the analyzed market; this is the case for the Ecuadorian context, and for this reason, this approach was discarded. We use linear optimization with the engineering approach to obtain improved AC designs in compliance with the proposed MEPS at the lowest cost. The use of this tool is new in the literature. We expect that the obtained results broaden the debate about increasing standards in the regulation and their importance for reducing energy demand for space cooling in Ecuador; and help to fill the research gap in Latin America related to regulatory policy analysis about energy efficiency standards for AC units.
We organize the remainder of the paper as follows. In Section 2, we present the regional and local context, showing the LATAM region gap regarding the available efficiencies in main manufacturing regions and the UNEP guidelines for adopting stricter MEPS in developing countries [12]. Also, the benefits of increasing MEPS in Ecuador are mentioned in this section. Section 3 describes the methodology and data used and defines the stricter MEPS to be analyzed. Section 4 shows and discusses the results within the considered economic scenarios in a 2022–2035 horizon. Finally, Section 5 shows the conclusions of this study, the insights for policymaking, and future research.
2. Regional and local context
Economic growth and appliance affordability drive energy demand in LATAM, as low income constraints equipment ownership. There is a marked inequality in energy services and equipment, dampening electricity demand [13]. Nevertheless, their electricity needs are growing fast as the population, income, and living standards increase; estimates show that it will double by 2040, becoming one of the main energy end-uses [[14], [15], [16]]. This growth can potentially increase energy prices and emissions with negative implications for consumers, economies, and energy transition towards clean sources in the region [17]. Currently, the AC ownership rate in the Central and South America region is 21.7%, far below the developed economies’ rates; e.g., in the United States and Japan, rates exceed 90% [1,18]. However, AC stock in LATAM could increase rapidly by more than sixfold between 2016 and 2050, pushing up space cooling demand from almost 100 TWh to roughly 650 TWh, becoming the third largest driver of electricity demand growth and accounting for 16% of this one [16,19]. With this rising demand, more widespread adoption of MEPS for AC units will be essential. The LATAM region could benefit from exploring harmonization and cooperation in setting up new MEPS programs and strengthening existing ones [20,21].
2.1. The regional gap for minimum energy performance standards
In South America, most countries have adopted mandatory or voluntary standards or have proposed them to increase the energy efficiency of ACs [22]. Here, MEPS cover 61% of the residential AC demand [18]; however, there are significant differences between this region and the main manufacturing regions. Table 1 shows these differences. LATAM countries mostly use Energy Efficiency Ratio (EER2) as a performance metric based on the ISO 5151 standard, which measures efficiency at full load. Main manufacturing regions use Seasonal Energy Efficiency Ratio (SEER) in each regional norm3. In the last 20 years, the increase in variable-speed-drive (VSD, also known as inverter-driven) units has led to the adoption of region-specific seasonal energy-efficiency metrics to estimate AC performance under regional climatic conditions, and SEER is increasingly used as an alternative to the EER [1].
Table 1.
Comparison of MEPS for wall-mounted split AC units with 3.5 KW (12,000 BTU/h) cooling capacity in LATAM countries and major world markets.
| Countries | Metric | Standards | MEPS (W/W) | Standard year | Source |
|---|---|---|---|---|---|
| Ecuador | EER | ISO 5151 | 3.20 | 2013 | [24] |
| Brazil | EER | ISO 5151 | 3.02 | 2018 | [25] |
| Colombia | EER | ISO 5151 | 3.00 | 2022 | [26] |
| Peru | SEER | UNE-EN 15218 | 3.01 | 2018 | [27] |
| Chile | EER | ISO 5151 | 3.20 | 2019 | [28] |
| China | SEER | GB 21455-2019 | 3.70 | 2020 | [9] |
| Japan | APF | JISC 9312 | 6.00 | 2016 | [12] |
| South Korea | CSPF | KS-C 9306 | 3.50 | 2018 | [29] |
| European Union (EU) | SEER | EN 14825 | 4.60 | 2014 | [29] |
| United States (US.) | SEER | AHRI 210/240 | 3.81 | 2008 | [30] |
SEER = seasonal energy efficiency ratio. EER = energy efficiency ratio. CSPF = cooling seasonal performance factor. APF = Annual performance factor.
As the test procedures and energy performance metrics differ among countries, interregional conversions should be used to compare MEPS across markets. Park et al. [23] explore these conversions using several AC models of main manufacturing regions. Fig. 1 shows an interregional comparison using ISO CSPF and conversions performed by Park et al. [23]. The bars present available efficiencies ranges in the local markets of Japan, China, Korea, the European Union, and the United States. The lower value in the bars represents the MEPS for air conditioners up to 3.5 kW of cooling capacity. In contrast, the upper limit also represents the highest efficiency available in these markets for the same cooling capacity. The average MEPS (continuous line) for LATAM countries shown in Table 1 is approximately 30% below the average MEPS in the main manufacturing regions.
Fig. 1.

Commercial efficiencies in major AC manufacturing countries and average MEPS in LATAM.
The UNEP Model Regulations are voluntary guidelines for governments in developing countries considering a regulatory framework that requires new room air conditioners to be clean and efficient, following a sustainable pathway [12]. Fig. 1 also shows the current gap between LATAM MEPS and the UNEP Model Regulations (dashed line). The comparison indicates that LATAM MEPS should be increased by 67% to meet UNEP guidelines. Therefore LATAM economies need greater efforts to increase MEPS and push local markets to follow sustainable development; however, achieving this energy efficiency level is possible since it is available in all major manufacturing regions.
2.2. Local context and regulatory framework
In Ecuador, there are diverse climates, including temperate and warm regions, making air conditioners heterogeneous. However, space cooling needs in tropical climates, especially in the Coast region, where approximately 50% of the population lives, have important implications at the national level. Space cooling reaches 14.3% of electricity demand and 12% of peak demand in the Coast region [31]. Here, months with higher temperature and space cooling demand (rainy season usually from January to May) coincide with a decrease in the hydropower generation in Ecuador, associated with a rainfall decrease in main hydrographic basins [32]. This raises fossil fuel use for running thermoelectric plants, increasing the cost of electricity generation and CO2 emissions.
Guayaquil (2°11′00″S 79°53′00″W) is the most populated city in the Coast region and represents 15% of the country's population [33]. At the city level, the relationship between electricity consumption (residential and commercial) and climate shows a strong positive linear correlation due to space cooling, driving an increase of 15.5% (1.8 GWh) when the thermal sensation increases from an annual average (27 °C) to maximum (32 °C) [34]. While at the building level, this energy end-use can reach more than 50% of a dwelling's electricity consumption [35,36]. Thus, greater energy efficiency for air conditioners significantly reduces the strain related to space cooling on the national electricity supply and improves energy sustainability at the city and consumer levels.
The Ecuadorian Service of Normalization (INEN) is in charge of the MEPS program for ACs, which has been in force since 2013. From that date, the mandatory MEPS –EER = 3.2 W/W for mini-split units up to 7.03 KW (24,000 BTU/h) remains unchanged [24]. Although ACs regulation update takes place every five years, and the next version will take effect in 2022, there is no mention of increasing MEPS or assessing their impacts on key stakeholders in the decision-making process [37]. This can lock up technology development of the local market for another five years, 14 in total since it was in force. However, in recent years Ecuador has adopted new energy policies, which may trigger initiatives to strengthen MEPS for ACs. These policies are framed within the first Energy Efficiency Law [38], the National Determined Contributions (NDCs) [39], and the ratification of the Kigali amendment to the Montreal Protocol [40].
The Energy Efficiency Law creates a legal framework for the joint work of political stakeholders, the academy, and the private sector through the National Energy Efficiency Committee (CNEE). Among the responsibilities of the CNEE are developing national energy-efficiency policies, incorporating new strategies within the National Energy Efficiency Plan (PLANEE), and periodic evaluation of their results. In addition, the CNEE is responsible for the permanent drawing up and updating of a list of energy-intensive equipment, which will be regulated in terms of their energy performance by the INEN. In the current PLANEE 2016–2035 [41], there are implicit action lines related to space cooling, such as programs for the identification of energy end-uses, strengthening regulations, and replacement programs for inefficient equipment called RENOVA plans. The first stage of the RENOVA for refrigerators was recently completed; the second stage contemplates a pilot project for ACs, replacing them with high-efficiency equipment (EER ≥5.5W/W) [42].
The Paris Climate Agreement requires all parties to review and update NDCs every five years – the guiding principles are progression and the highest possible ambition. The standards with a long-term improvement plan can play a role in raising or enhancing the existing targets under Paris Climate Agreement [43]. Ecuadorian NDCs do not explicitly contain efficient cooling measures such as MEPS; however, their inclusion would strengthen the implementation plan and commitment to reducing emissions related to this sector. Strengthening MEPS for air conditioners represents a specific action as to how a country plans to achieve its climate mitigation ambitions.
On the other hand, the Kigali Amendment to the Montreal Protocol phase-down Fluorinated gases (F-gases), including Hydrofluorocarbons (HFCs), which have a high Global Warming Potential (GWP) and are widely used in the cooling industry as refrigerants [44]. The F-gas phase-down can go in hand with MEPS programs [45]; the main advantage of this approach, “efficient and clean cooling,” are the reduction of technological transition costs and a further reduction of GHG emissions –as cooling has direct emissions from the refrigerant leakage and indirect emissions from the electricity needed to run appliances. In this sense, it is highly recommended that efficient and clean cooling be included in the NDCs; the higher the level of commitment, the greater the chances for obtaining international financing, especially for complementary programs such as labeling, compliance and testing, replacement, and market mechanisms (incentives, rebates or on-bill financing schemes).
3. Methodology and data
Policy Analysis Modeling System (PAMS) methodology was developed by Lawrence Berkeley Laboratory [8]t combines a bottom-up approach based on ACs engineering data, market data, and econometric models based on cooling degree days (CDDs) and household income, allowing policy analysts to assess new MEPS and quantify their impacts on the consumer or total residential sector level. This tool has been used in similar studies in Latin America [25,46,47]. The consumer level corresponds to one typical household, while the residential sector level or society's viewpoint corresponds to the total households in Guayaquil. Consumer impacts are Life Cycle Cost (LCC) and Payback time, while for society, Net Present Value (NPV), Cumulative Electricity Savings, and Cumulative GHG mitigation are considered [48]. Ecuador does not have local manufacturers; however, there are enough commercial options available in foreign markets to meet the analyzed MEPS. Other stakeholders, such as equipment producers and traders, are outside the scope of this work. To simplify the analysis, the analysis year and the adoption year (of the new MEPS) are equal to 2022. Also, all AC units sold after the adoption year must meet the new MEPS.
LCC and NPV use the analysis year and discount factors to bring future costs and savings to present value. LCC considers the cost for one AC unit from its purchase and operation throughout its lifetime. The NPV deals with the increase in purchase costs of new ACs and savings in electricity costs for the entire residential sector in Guayaquil. Rebound effects associated with behavioral changes are not considered in the PAMS methodology.
Fig. 2 shows the main steps of the procedure to assess costs and impacts from the consumer's perspective (i.e., individual household), input data presented in a blue frame, the intermediate calculations in brown, and the outputs in green. UEC is the unit energy consumption on an annual basis. From the consumer's perspective, both the Life-Cycle Cost (LCC) and the payback period are valuable metrics for estimating the financial impact of a MEPS policy (i.e., for each household using the appliance). The assessment is critical in the decision-making process of setting higher MEPS. In addition, maintenance costs are negligible concerning the operating cost over the equipment's lifetime.
Fig. 2.

Flow chart of Policy Analysis Modeling System for assessing Consumer's Perspective.
On the other hand, the society's perspective takes into account the whole set of households, indicating the impact of MEPS from an economic (e.g., costs and net present value), strategic (e.g., energy savings), and environmental (CO2 emissions mitigation) point of view. Fig. 3 shows the main steps to assess these impacts: input data presented in a blue frame, the intermediate calculations in brown, and the outputs in green. For further details about PAMS-MEPS calculation procedures, see Refs. [49,50].
Fig. 3.

Flow chart of Policy Analysis Modeling System for Society's Perspective.
3.1. Data sources
Several data sources have been compiled to assess the impacts of stricter MEPS for residential air conditioning in Guayaquil. Data on AC ownership and usage habits were from national surveys: Income and Expenses of Urban and Rural Households and Employment and Households’ Environmental Information [[51], [52], [53]]. Information about population growth is from the Projections and Demographic Studies of the Ecuadorian Statistics and Census Institute (INEC) [33,54,55]. Data for household size is from the UN Department of Economic and Social Affairs [56]. Economic growth rates are obtained from several sources to build economic growth scenarios; these sources are the World Bank [57], the International Monetary Fund [57,58], and the Central Bank of Ecuador [59]. Data from Annual Statistics for the Electricity Sector and Electricity Master Plan served to develop electricity projections for the residential sector of Guayaquil [[60], [61], [62]]Finally, information related to customs duties and taxes on AC equipment is from the Customs Service of Ecuador (SENAE) and the World Trade Organization (WTO) [64,65]. All these data sets are listed in Table 2.
Table 2.
Data sources for new MEPS assessment.
| Description | Use | Source |
|---|---|---|
| Income and expenses of urban and rural households | AC ownership and usage | [51,52] |
| Employment and households' environmental information | AC ownership and usage | [53] |
| Projections and Demographic Studies | Households projection | [33,54,55] |
| Household size (number of people per household) | Households projection | UN Department of Economic and Social Affairs [56] |
| Historical national GDP data was obtained | Economic growth projections | World Bank [63] |
| Economic growth projection | Economic growth projections | International Monetary Fund [57,58], and Central Bank of Ecuador [59] |
| Annual Statistics for the Electricity Sector and Electricity Master Plan | Electricity projection for the residential sector of Guayaquil | Ministry of Energy and Non-Renewable Natural Resources [[60], [61], [62]]. |
| Information related to customs duties and taxes on AC equipment | Retail ACs cost | Customs Service of Ecuador (SENAE) and World Trade Organization (WTO) [64,65]. |
3.2. Economic scenarios
Assumptions about economic scenarios are important for the assessment since AC ownership depends on household income [[66], [67], [68]]. Incomes are estimated as Gross National Income (GNI) per capita and adjusted by the Purchasing Power Parity (PPP) –based on international dollars of 2000 [50,69,70]. We use projections of the Central Bank of Ecuador [59] and the International Monetary Fund [57] to obtain two economic growth scenarios for the 2022–2035 horizon.
The first one, called Bussiness-as-Usual (BAU), considers slow economic recovery compared to other countries in the LATAM region [71]. The GDP growth is 2.3% on average; it reflects the impacts of low oil prices between 2015 and 2021 on the Ecuadorian economy –which is highly dependent on price fluctuations [72,73]. The second one, the High Growth scenario (HG), reflects high electricity consumption and rapid AC diffusion due to higher household income growth. The annual GDP growth between 2023 and 2035 considered here is 4.0%, the same as the one used in the Ecuadorian Electricity Master Plan [74]. Fig. 4 shows historical data of GNI and projections until 2035 for both scenarios.
Fig. 4.

Historical data of GNI per capita and projections from 2022 to 2035 for BAU and High Growth scenarios.
3.3. Air conditioning baseline modeling
Typical equipment (base case) which complies with the current regulation [24] operates in the baseline for AC electricity demand. We use a parametric model to estimate the baseline, as shown in Equation (1), where the estimated demand (E) is a function of three effects: Activity (), Structure (), and Energy Intensity () [75].
| (1) |
The Activity factor represents the number of households with electricity access. In Guayaquil, electric utility coverage almost reaches 100% of households in the urban sector. Therefore, A factor is estimated based on the number of urban inhabitants by household size.
The Structure factor represents the AC diffusion, i.e., the share of households with air conditioning [76]. AC in developing countries often is unaffordable for many households, and income level determines whether or not a household owns an AC. Modeling this behavior requires using econometric models in the literature [77,78], which are based on logistic regressions as in Equation (2). The A factor between 1 and 0 addresses climate influence on consumer behavior –warmer regions have greater AC ownership. For Guayaquil, this factor is 1; and are determined from survey data about appliance ownership (ENIGHUR 2003 and 2011).
| (2) |
Table 3 shows the diffusion parameters obtained for Guayaquil. The results were compared to those obtained by McNeil et al. [78], which include AC diffusion data from several developing countries (including Paraguay and Brazil in Latin America). This data represent countries’ average values. The differences between the obtained parameters in both studies are because cities with a predominantly warm climate, like Guayaquil, have greater AC ownership than national averages.
Table 3.
Comparison between diffusion models.
| Source | R2(a) | ||
|---|---|---|---|
| AC diffusion model in [78] | −6.9E-05 | 4.84 | 0.69 |
| AC diffusion model for Guayaquil 2003 | −1.67E-03 | 3.39 | 0.61 |
| AC diffusion model for Guayaquil 2011 | −2.08E-03 | 3.10 | 0.59 |
(a)Goodness-of-fit (R2).
Finally, the intensity factor (I) represents the space cooling energy consumption (kWh/year) in a typical household, namely Unit Energy Consumption (UEC) [70,76]. Several aspects influence this energy consumption, including AC ownership, maintenance, energy efficiency, consumer behavior [79,80], building design [36], and variables like climate and urban heat islands [35]. However, for a bottom-up approach, a simpler methodology can be followed [81]. We estimate the UEC using a typical unit (defined as the base case) and a weighted average of AC usage and equipment ownership obtained from surveys in Guayaquil [55].
3.4. Base case
The base case assumes an AC unit with a cooling capacity of 3.5 kW (12,000 BTU/h) based on regional data [47,82]. Fig. 5 shows the usage hours obtained from surveys [55]. Fig. 6 shows the distribution of AC retail prices in the local marketplace based on prices from online stores in 2019. SM Table 1 and SM Table 2 in the supplementary material show taxes and markups, respectively, for a typical AC unit in the local marketplace. Table 4 shows a summary of the parameters assumed for the base case.
Fig. 5.
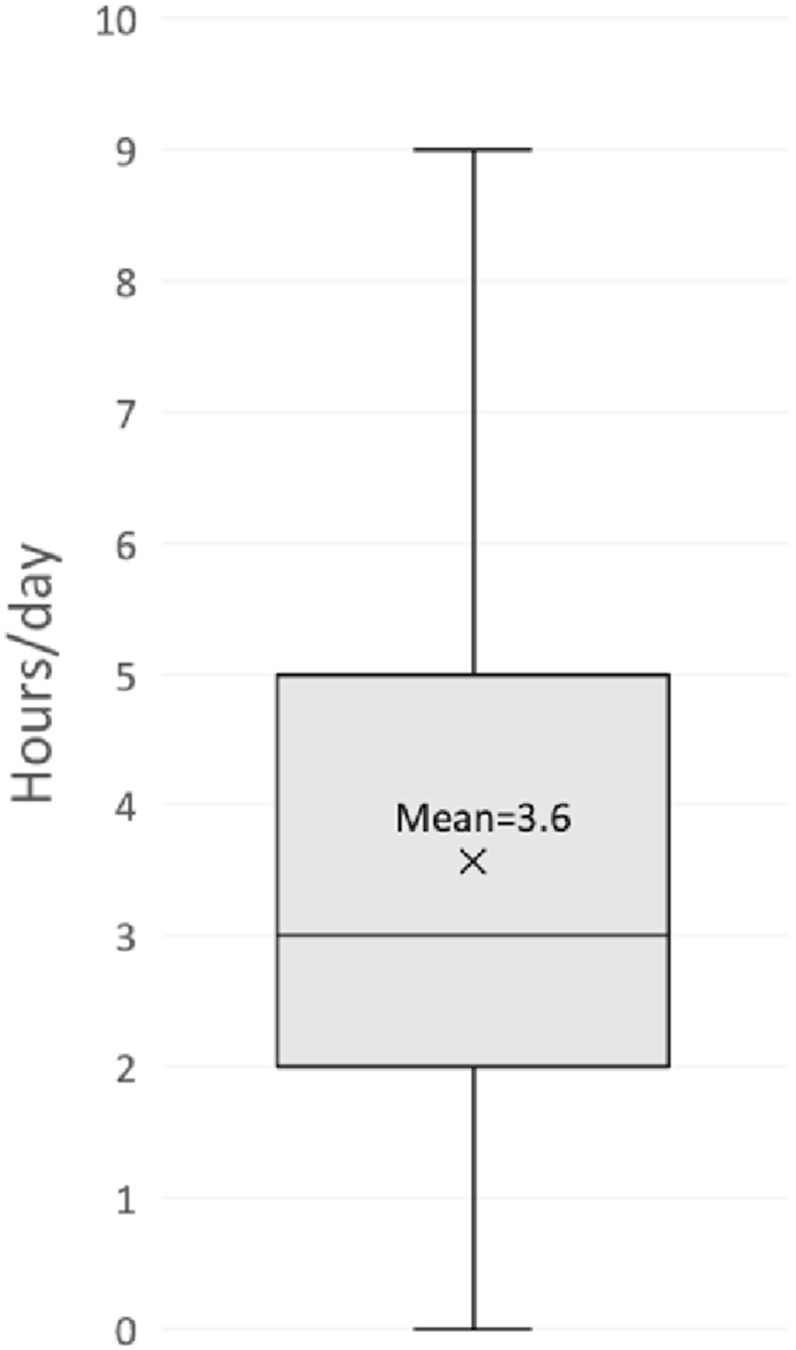
Estimated hours per day of AC use in Guayaquil households.
Fig. 6.

Price variation for a 3.5 kW split AC in Guayaquil.
Table 4.
Base case parameters.
3.5. Proposed standard cases
Local or regional market options regarding energy efficiency levels are necessary to identify achievable MEPS and reduce cost uncertainties. There are statistical and engineering approaches to performing this analysis [48]. The first one depends on market studies to define the new MEPS. However, the energy efficiency increase is limited to market availability. Therefore, the second approach defines MEPS based on efficiency improvement from commercially available technologies. Then an economic analysis is carried out to obtain manufacturer costs and markups. Finally, each AC unit's retail price is estimated in compliance with the proposed MEPS. Usually, when there is not a wide variety of market options, analysts use the engineering approach [48]. This is the case for the Ecuadorian market.
To obtain the equipment options in compliance with the proposed MEPS, we use a set of commercial technological improvements for compressors, heat exchangers, and expansion valves and data about their impacts on EER and the cost of a base design. Then, we solve a linear programming problem to find the optimal combination of components that meet the proposed MEPS and minimize the manufacturing cost. Manufacturers can use this approach in different commercial regions to reduce compliance costs. On the other hand, policy analysts can use this approach to obtain equipment costs based on commercial and technological improvements to meet the proposed MEPS.
Table 5 presents the standard cases which represent the obtained solutions. MEPS for designs 6 and 7 comply with the EER defined in Model Regulations [12] and RENOVA plan [42]. The rest of MEPS was proposed by UN Environment Programme [47]. The definition of the optimization problem is in the supplementary material through Equation SM 1 to Equation SM 4.
Table 5.
Estimated parameters for each assessed standard case.
| MEPS assessed | Standard case | Purchase price (USD) | EER (W/W) | Price ratio | EER ratio |
|---|---|---|---|---|---|
| 3.4 | Design #1 | 404 | 3.47 | 1.04 | 1.08 |
| 3.6 | Design #2 | 455 | 3.68 | 1.17 | 1.15 |
| 3.8 | Design #3 | 510 | 3.95 | 1.31 | 1.23 |
| 4.3 | Design #4 | 558 | 4.38 | 1.43 | 1.37 |
| 4.7 | Design #5 | 684 | 4.72 | 1.75 | 1.47 |
| 5.1 | Design #6 | 821 | 5.21 | 2.11 | 1.63 |
| 5.5 | Design #7 | 910 | 5.59 | 2.33 | 1.75 |
3.6. Summary of inputs
The base case uses the BAU and High Growth economic scenarios to project the baseline until 2035. On the other hand, the impacts of standard cases are deviations from these baselines. Table 6 summarizes the key data inputs used in the MEPS assessment.
Table 6.
Key data inputs for the PAMS-MEPS model.
| Inputs | Description | Value | Source |
|---|---|---|---|
| L | AC lifetime | 12 years | [83] |
| Mean electricity price in the residential sector of Guayaquil (without subsidies) | 10.09a U.S. ¢/kWh | [34,84,85] | |
| TD | Transmission and distribution losses factor regarding the total electricity generated | 0.14 | [32,34] |
| CF | CO2 emission factor for national electricity generation in 2018 | 0.134 kg CO2eq/kWh | [32,34,62,86] |
| CDR | The consumer discount rate (CDR) is based on the prevailing interest rates | 10%b per year | [87] |
| NDR | The national discount rate takes into account a social perspective | 6%c per year | [88] |
| PDR | Baseline Price Decrease Rate: Historical trends indicate that actual prices of significant appliances fall over time due to improved manufacturing processes or economies of scale in growing or consolidating markets [50,89]. | 4.5% | SM Fig. 1 |
Based on electric utility billing of Guayaquil in 2017.
Based on effective passive interest rates in 2019 from BCE.
Based on discount rates for energy efficiency projects from CAF.
4. Results and discussion
In the last 20 years, Ecuador has experienced significant economic growth due to high oil prices, significantly influencing the national economy. The economic growth has been accompanied by an increase in purchasing power resulting in the affordability of AC equipment, increasing its diffusion. Fig. 7 shows this impact, which led to a rise in the AC diffusion between 2003 and 2011; i.e., for the same income level, the share of households with air conditioning in 2011 was higher than in 2003. Average values for Guayaquil were 7% and 13% in 2003 and 2011, respectively, far below developed countries (for example, in the United States and Japan, the AC ownership rates exceed 90%) [1,18]. In developed countries, the high purchasing power of households allows them access to AC equipment, while in developing countries, AC, until a few years ago, was considered a luxury item [90,91].
Fig. 7.

Air conditioning diffusion for Guayaquil.
Unfortunately, there are no recent data about AC ownership in Ecuador, which allows for updating the diffusion model. In recent years, AC imports have doubled, the SM Fig. 1 shows information with these figures. As a result, the AC diffusion has probably increased, causing underestimating effects. However, higher ownership and, therefore, energy demand reaffirms the need to update the current standard, leading to even higher benefits than those presented in the results. The estimation of AC electricity demand and energy related-emissions are in Section 4.1. The Future Outlook for AC electricity demand is covered in Section 4.2. Finally, the results from the regulatory assessment are presented throughout Sections 4.3 and 4.4.
4.1. Estimations for air conditioning electricity demand and CO2 emissions
As previously mentioned, the AC electrical demand can be modeled by combining several factors (activity, structure, and intensity). Fig. 8 shows that the AC energy demand almost quadrupled between 2000 and 2020. The main drivers for this increase are population growth and AC ownership (activity and structure factors). As can be seen, the growth rates of AC energy demand follow household income trends (Fig. 4). In Ecuador, there has been a period of economic recession since 2014. In this period, the growth rate for AC electricity demand has decreased; however, the electricity demand for AC continues to increase due to population growth surpassing income reduction. The Intensity factor was not considered in the analysis since there is not enough information to build a model that considers AC usage as a function of household income and climate. In this sense, it is necessary to have frequent and updated surveys for equipment ownership and energy consumption habits [11,25,29].
Fig. 8.

Estimated annual AC electricity demand in the residential sector, in Guayaquil, from 2000 to 2019 and projections until 2030 for pre-pandemic and post-pandemic scenarios.
Even with the impact of the COVID-19 pandemic, the estimates for AC energy demand indicate consistent growth; this points out the importance of the activity factor in the AC demand. Other model limitations are the behavioral changes for AC usage due to lockdown [92].
Comparing AC demand with the total electricity demand for the residential sector in Guayaquil is essential to put AC into perspective. Our estimates show that this demand reached 16% in 2020. Table 7 presents this comparison for selected years. Of course, these figures could be even higher if greater AC ownership is considered. However, our estimates show that a significant percentage of residential electricity demand is used for air conditioning. Something similar occurs in the rest of LATAM, where space cooling is one of the residential sector's main drivers of electricity demand [16,19].
Table 7.
Share of AC demand in residential electricity demand for Guayaquil.
| Year | Residential Electricity Demand4 |
Share of AC Electricity Demand |
||
|---|---|---|---|---|
| BAU | High Growth | BAU | High Growth | |
| 2020 | 1732 | 1732 | 16.0% | 16.0% |
| 2025 | 2183 | 2199 | 15.6% | 16.1% |
| 2030 | 2508 | 2565 | 16.1% | 18.0% |
| 2035 | 2741 | 2849 | 17.3% | 21.4% |
Fig. 9 shows the AC emissions in millions of metric tons of CO2e (Mt) related to electricity consumption and their share in total emissions for the residential sector of Guayaquil in 2015 [93,94]. Direct emissions (0.67 Mt CO2e) correspond to LPG use (mainly for cooking), while indirect emissions are related to electricity use (0.42 Mt CO2e). As can be seen, air conditioning is significant for indirect emissions and total emissions. These results could support future actions undertaken by the Government to improve buildings’ sustainability through improving energy efficiency for space cooling. A concrete action for this purpose is increasing MEPS for AC units, with the possibility of inclusion in the NDCs [43].
Fig. 9.

Share of CO2 emissions due to electricity use from AC units concerning residential emissions of Guayaquil in 2014.
There are several limitations to the analysis of AC energy-related emissions. The first one is the use of AC during peak hours (19:00–20:00) [41], where the electricity supply is covered by thermoelectric generation, thus increasing AC emissions. This time frame coincides with more significant AC usage since people return from their jobs and need to cool their homes. The second limitation is climate-related; the months with the highest AC demand coincide with the months with the lowest hydroelectric generation availability (as explained in section 2.2 due to lack of rain). Therefore, there is greater use of thermoelectric generation. The results presented in Fig. 9 do not consider these impacts; instead, an average emissions factor (static factor) was used for the National Interconnected System (SNI), thus simplifying the analysis.
Despite all these limitations, the obtained results for AC electricity demand and energy-related emissions serve as a starting point to broaden the debate about the AC impact on the electricity supply sustainability and allow us to understand the importance of strengthening the energy efficiency regulations and policies, before considering the expansion of electricity supply infrastructure (renewable electricity generation not always coincide with demand peaks).
4.2. Future outlook
Figs. 8 and 9, and Table 7 also show the results for the future outlook of AC energy demand and its energy-related emissions, considering different economic growth scenarios. There is no difference between both scenarios until 2026 due to the economic recession and COVID-19 impact (see Fig. 4). Economic recession also explains a lower growth rate for AC energy demand and energy-related emissions. In this context, the activity factor is the main driver for AC energy demand. In the BAU scenario, the pandemic impact damps AC energy demand until 2032, when the growth rate increases again; this is not the case for the High Growth scenario.
In the BAU scenario, the AC energy demand in 2035 will increase by 50% from 2020, while for the High Growth scenarios, it will increase by 124%. Although the BAU scenario represents slow economic growth, AC energy demand increases significantly, reaching 17.3% of the total electricity demand in 2035 for the residential sector of Guayaquil. On the other hand, the AC energy demand in the High Growth scenario reaches 21.4% (Table 7). These significant differences are associated with AC ownership increasing considerably with household income (as shown in Fig. 7).
The AC energy-related emissions exhibit a similar trend to energy demand; its share in total residential emissions reaches 5.3% by 2035 in the BAU scenario, while for the High Growth scenario, it reaches 7.9%. The AC energy-related emissions share in residential indirect emissions reaches 13.4% by 2035 in the BAU scenario, while for the High Growth scenario, it reaches 20.1%.
These figures show that the impacts of AC demand are increasing rapidly. Therefore energy efficiency actions such as increasing MEPS for AC units must be adopted early to support a sustainable pathway for warm and humid cities in Ecuador. On the other hand, space cooling has an interesting potential for energy savings and emission mitigation. It is worth noting that as household income increases, AC energy demand increases considerably; this is because there is a repressed demand in the residential sector. These considerations are essential in the design of public energy efficiency policies.
4.3. Impacts on consumers
Table 8 presents the purchase costs, the life cycle cost, and the payback time for the analyzed MEPS options, and Fig. 10 shows the LCC reductions versus increases in energy efficiency. In the case of the current standard (EER 3.2 W/W), the purchase cost represents the average of the retail prices of the local market. The life cycle cost considers the purchase and operating costs during the equipment's lifetime (12 years), brought to present value (the base year is 2022). For the current standard, there is no return time. The results presented in Table 8 and Fig. 10 show how, as energy efficiency increases, the life cycle cost decreases, being the maximum benefit when the standard is EER 4.3 W/W. Above this option, the LCC begins to increase since the purchase cost surpasses the influence of the operating cost. In other words, the benefits obtained do not follow a linear behavior based on the increase in energy efficiency. The same behavior has been reported in several works [25,46].
Table 8.
Life-cycle costs and payback time.
| MEPS(a) (W/W) | Purchase Price (USD) | LCC (USD) | Payback (Years) |
|---|---|---|---|
| 3.2 | 390 | 2279 | – |
| 3.4 | 404 | 1848 | 0.76 |
| 3.6 | 455 | 1816 | 2.16 |
| 3.8 | 510 | 1780 | 2.75 |
| 4.3 | 558 | 1703 | 2.71 |
| 4.7 | 684 | 1747 | 3.98 |
| 5.2 | 821 | 1784 | 4.86 |
| 5.5 | 910 | 1806 | 5.29 |
(a)Performance metric is EER.
Fig. 10.

Energy Efficiency increase and Life Cycle Cost reduction for assessed MEPS.
On the other hand, the shortest payback time (less than one year) is obtained with the EER 3.4 W/W. For the other options, the payback time is over two years. Higher payback times are associated with increased purchasing costs for more efficient AC units. In the case of the EER 4.3 W/W, the payback time is 2.71 years, which is acceptable considering that it is less than half the AC equipment's lifetime.
The results presented in Table 8 and Fig. 10 were obtained under the same operational considerations. If behavioral changes are considered, these results may vary. For example, a lower electricity bill can encourage more significant usage of AC, shifting the best LCC to a higher MEPS. This rebound effect is not considered for estimating benefits in the PAMS methodology.
For the current market conditions in Guayaquil, the best option from a consumer perspective would be MEPS 4.3 W/W. However, high-income households with higher energy consumption, electricity cost, and AC usage may prefer more efficient options; hence, MEPS must be complemented with suitable labeling programs that promote a broader availability of efficient options above the minimum energy performance. In the supplementary material, S.M. Fig. 2 shows insights into the market willingness to buy energy-efficient appliances in LATAM countries [95]. For the Ecuadorian market, household willingness is 65%, which indicates a moderate tendency to buy more efficient equipment as long as there are clear net savings. The EER 4.3 W/W option represents more than 25% in life cycle cost savings compared to equipment with the current MEPS. Even though clear economic savings are observed with EER 4.3 W/W, incentive programs to promote higher adoption levels of more efficient equipment are still needed; since consumers tend to focus on immediate savings more than future savings, which can discourage them from buying more efficient units [96,97].
As mentioned in Section 2.1, UNEP proposes Model Regulations for developing countries. These regulations propose a MEPS based on climate. In the case of Guayaquil, with hot and humid climate, the proposed MEPS by UNEP corresponds to EER 5.2 W/W; with this standard, a reduction of roughly 22% in the LCC is obtained; however, the payback time is approximately five years. In the case of the RENOVA plan, the proposed standard is EER 5.5 W/W; this has a reduction of roughly 21% with a return time of 5.29 years. Under the conditions considered, both MEPS proposals can be seen as ambitious from the consumer's point of view since there are cheaper MEPS options with greater consumer benefits and shorter return times. Therefore MEPS options above EER 4.3 W/W require an even more extensive incentive program to reduce upfront costs and facilitate their adoption. A review of these incentive programs can be consulted [97].
4.4. Impacts on society
Table 9 shows the society perspective results in BAU and High Growth scenarios. All proposed MEPS led to positive Net Present Values (NPV), which means that all options are viable and produce positive net savings. However, the RENOVA option has the highest NPV and CO2 emissions mitigation. In the high-growth scenario, the benefits of increasing MEPS are even more significant due to higher energy use for space cooling.
Table 9.
Society's perspective of stricter MEPS in BAU and High Growth scenarios.
| MEPS (W/W) | Cumulative Electricity Savings (GWh) |
Increment in Equipment Cost (millions USD) |
Net Present Value (millions USD) |
Cumulative CO2e Emissions Mitigation (Mt) |
||||
|---|---|---|---|---|---|---|---|---|
| BAU | High Growth | BAU | High Growth | BAU | High Growth | BAU | High Growth | |
| 3.4 | 190 | 217 | 1.0 | 1.3 | 15.4 | 18.1 | 0.17 | 0.20 |
| 3.6 | 318 | 365 | 4.9 | 6.0 | 22.7 | 26.5 | 0.29 | 0.33 |
| 3.8 | 460 | 527 | 9.1 | 11.1 | 30.8 | 35.8 | 0.41 | 0.47 |
| 4.3 | 653 | 748 | 12.7 | 15.6 | 43.9 | 51.1 | 0.59 | 0.67 |
| 4.7 | 782 | 896 | 22.3 | 27.3 | 45.4 | 52.5 | 0.70 | 0.81 |
| 5.2 | 936 | 1073 | 32.7 | 40.0 | 48.5 | 55.5 | 0.84 | 0.97 |
| 5.5 | 1039 | 1190 | 39.4 | 48.3 | 50.6 | 57.7 | 0.94 | 1.07 |
Unlike the benefits obtained for consumers, those related to society are calculated from a standard year, introducing an important temporary component to the analysis. The savings are small in the first year after MEPS implementation since the standard affects only the units purchased that year. Over time, the stock is increasingly impacted by the adopted standard, obtaining more significant benefits. Due to this reason, the best option for the consumer does not coincide with the best option from the point of view of society.
Table 10 compares the best MEPS options for consumers and society regarding AC electricity savings. EER 4.3 W/W is the best option for consumers, while EER 5.2 W/W (UNEP Model Regulation) and 5.5 W/W (RENOVA Plan) are the best options for society. In percentage terms, there are slight differences between the BAU and High Growth scenarios. At the beginning of the new MEPS adoption, savings are less than 10%; however, they will increase significantly by 2030. Therefore, early adoption of the new MEPS produces more significant impacts in reducing energy consumption and emissions if we consider the entire residential sector of Guayaquil. For annual emissions mitigation, the results show the same percentage reduction as electricity savings presented in Table 10 due to the emissions factor assumed as a static factor (see Table 6).
Table 10.
Annual electricity savings for the residential sector in Guayaquil.
| Year | Electricity demand GWh (MEPS 3.2 W/W) |
Annual electricity savings |
||||||
|---|---|---|---|---|---|---|---|---|
| MEPS 4.3 W/W |
MEPS 5.2 W/W |
MEPS 5.5 W/W |
||||||
| BAU | High Growth | BAU | High Growth | BAU | High Growth | BAU | High Growth | |
| 2025 | 340 | 353 | 5.7% | 5.9% | 8.8% | 8.5% | 9.8% | 9.4% |
| 2030 | 404 | 462 | 14.3% | 13.8% | 20.8% | 19.8% | 23.0% | 21.9% |
| 2035 | 473 | 610 | 19.4% | 19.4% | 27.7% | 27.9% | 30.8% | 30.9% |
A comparison of the consumer and societal perspectives results shows a gap in adopting more stringent MEPS. As mentioned before, incentive programs such as the replacement of inefficient equipment or taxes reduction of more efficient products are necessary to overcome it. They can improve the affordability of more efficient equipment by reducing costs [97]. Furthermore, MEPS programs must be accompanied by a suitable labeling program to enhance consumer awareness about the energy efficiency of their purchases [48,98] and increase energy efficiency options in the market.
On the other hand, it is desirable to increase the MEPS progressively since a sudden increase can cause disruptions in the local marketplace; it must be considered that space cooling access improves the well-being of building occupants, especially in Guayaquil, where thermal comfort at certain times can be achieved only through mechanical air conditioning systems. According to our analysis, the best option to start this increase is EER 4.3 W/W. After that, periodic reviews of the standard can be proposed, matching the updates with other policies at the national level; for example, high GWP refrigerants replacement and inclusion of efficient space cooling in the NDCs [43].
Ecuador recently approved its first Energy Efficiency Law. It enunciated new public policies and guidelines to achieve optimization in the use and consumption of energy for sectors related to energy supply and demand. Among these policies are the promotion and diffusion of best practices, incentives, and existing technologies, to promote energy efficiency and the rational use of electricity in the population [99]; and the development and application of MEPS for electrical and mechanical equipment, buildings, and vehicles [100]. The results obtained indicate that it is possible to support these policies from efficient space cooling, specifically through stricter MEPS for AC units in the residential sector.
5. Conclusions
A bottom-up approach based on engineering data, market data, and econometric models was used to estimate the benefits of setting stricter MEPS for the consumers and society of the residential sector in Guayaquil, Ecuador. This methodology is known in the literature as Policy Analysis Modeling System (PAMS). The assessed benefits are economic savings, electricity reduction, and CO2 emissions mitigation. In addition, this methodology was complemented by linear optimization; with this new approach, we obtain equipment options in compliance with the proposed standards at the lowest cost. The analyzed MEPS options are those proposed by UNEP for LATAM countries and by the renewal program of inefficient equipment of the Ecuadorian Government (RENOVA plan).
The increase in energy demand for typical AC units is significant for the residential sector of Guayaquil, AC energy demand represents around 16% of the total electricity consumption in this sector. Our estimates show that this percentage can reach 17.3% in the BAU scenario and 21.4% in the High Growth scenario between 2020 and 2035. Regarding energy-related emissions, AC units reach 3.5% of total emissions from residential. In the BAU and High Growth scenarios, emissions reach 5.3% and 7.9%, respectively. Therefore, sustainable development paths must include energy efficiency programs for air conditioning, such as Minimum Energy Performance Standards. Stricter MEPS for AC represents a cost-effective option to reduce energy needs and emissions from air conditioners and a concrete action to support the national energy efficiency policies and nationally determined contributions (NDCs).
From the consumer perspective, the best option is MEPS 4.3 W/W, which has the lowest LCC. With this stricter standard, the average consumer can save more than 25% in costs over the equipment's lifetime. In addition, the payback time for AC units with this standard is 2.71 years, which is acceptable considering that it is below half the lifetime of an AC unit (6 years). From a societal standpoint, the two best options are those proposed by the UNEP Model Regulations (EER 5.2 W/W) and by the RENOVA program of Ecuador (EER 5.5 W/W). Both cases present the highest Net Present Values (NPV), Cumulative Electricity Savings, and Cumulative CO2 Emissions Mitigation.
This study is the first effort to assess stricter MEPS in the Ecuadorian context. According to our analysis, there is a gap between what is best for the consumer and for society, which can be progressively bridged. Initially, the MEPS can be increased to EER 4.3 W/W; after that, periodic revisions and updates of the standard can be proposed. Thus, taking advantage of technological development to achieve national objectives such as energy security and sustainability for the residential sector. In addition, the use of linear optimization to obtain improved AC designs in compliance with the proposed MEPS at the lowest cost is new in the literature. This approach can be used to avoid setting less ambitious energy-efficiency targets when efficiency options are limited in the analyzed market, which is the case for Ecuador.
Promoting the early adoption of more energy-efficient equipment significantly reduces electricity demand and CO2 emissions. Therefore, we highlight the need to complement the adopted MEPS with incentive programs and a suitable energy labeling strategy to overcome the upfront cost of new AC equipment (in compliance with the proposed standards). The analysis of these programs can complement our results for establishing broader energy efficiency policies.
We expect that the obtained results broaden the debate about increasing standards in the regulation and their importance for reducing energy demand for space cooling in Ecuador; and help to fill the research gap in Latin America related to regulatory policy analysis about MEPS for appliances. Future work should consider a broader geographical analysis, benefits for electrical infrastructure, and rebound effects to have a complete picture of the adoption of stricter MEPS at the national level. However, the conclusions obtained represent interesting arguments to strengthen regulations on air conditioning equipment, support energy efficiency policies in the residential sector, and include efficient cooling in NDCs.
Author contribution statement
Frank Porras: Conceived and designed the experiments; performed the experiments; analyzed and interpreted the data; contributed reagents, materials, analysis tools or data; wrote the paper.
Arnaldo Walter, Guillermo Soriano, Angel Diego Ramirez: Conceived and designed the experiments; analyzed and interpreted the data; contributed reagents, materials, analysis tools or data.
Funding statement
Frank Porras was supported by Secretaría de Educación Superior, Ciencia, Tecnología e Innovación (SENESCYT-SDFC-DSEFC-2018-0028-O).
Data availability statement
Data included in article/supp. material/referenced in article.
Declaration of interest’s statement
The authors declare no competing interests.
Acknowledgments
Profound appreciation is extended to the Ecuadorian Secretariat of Higher Education, Science, Technology, and Innovation (SENESCYT) for providing monetary support to Frank Porras for his Graduate studies at UNICAMP, and to Gilberto De Martino Jannuzzi, Professor of the Energy Planning Program at UNICAMP, for his comments during the development of this work.
SEER is a measure of the energy efficiency of cooling equipment adjusted for the overall performance of the equipment for the weather over a typical cooling season. Their measure units represent the ratio of the output of cooling energy (measured in British thermal units in the United States and kilowatt-hours [kWh] elsewhere) to input energy (electricity in kWh); They can also be interpreted in terms of capacity, for example, Watt of output per Watt of input (W/W).
EER is the ratio of the total cooling capacity (CC) to the effective power input to the device at any given set of rating conditions (W/W) [23].
Climate-specific weighting is used to calculate seasonal AC energy efficiency, which provides a more representative measure of performance than the traditional EER does [23].
Supplementary data to this article can be found online at https://doi.org/10.1016/j.heliyon.2023.e13893.
The electricity demand of Guayaquil for 2020 was obtained from the local electric company; for the other years electricity demand was forecasted as a function of population and income using a linear regression following the same approach used by the Electricity Master Plan of Ecuador [61].
Appendix A. Supplementary data
The following is the Supplementary data to this article:
References
- 1.IEA . Paris; 2018. The Future of Cooling Opportunities for Energy-Efficient Air Conditioning.https://webstore.iea.org/the-future-of-cooling [Google Scholar]
- 2.SEforALL. Prospects Chilling. Vienna; Austria: 2022. Tracking Sustainable Cooling for All 2022.https://www.seforall.org/chilling-prospects-2022 [Google Scholar]
- 3.Matsumoto S., Omata Y. Consumer valuations of energy efficiency investments: the case of Vietnam's Air Conditioner market. J. Clean. Prod. 2017;142:4001–4010. doi: 10.1016/j.jclepro.2016.10.055. [DOI] [Google Scholar]
- 4.Clasp . Lighting, And Equipment.; 2014. Energy Policy Toolkit for Energy Efficiency in Appliances. [Google Scholar]
- 5.Wu J., Xu Z., Jiang F. Analysis and development trends of Chinese energy efficiency standards for room air conditioners. Energy Pol. 2019;125:368–383. doi: 10.1016/j.enpol.2018.10.038. [DOI] [Google Scholar]
- 6.Martínez-Montejo S.A., Sheinbaum-Pardo C. Energy for Sustainable Development; 2016. The Impact of Energy Efficiency Standards on Residential Electricity Consumption in Mexico; pp. 50–61. 32. [DOI] [Google Scholar]
- 7.Shi X. Application of best practice for setting minimum energy efficiency standards in technically disadvantaged countries: case study of Air Conditioners in Brunei Darussalam. Appl. Energy. 2015;157:1–12. doi: 10.1016/j.apenergy.2015.07.071. [DOI] [Google Scholar]
- 8.LBNL, PAMS | International Energy Studies Group 2007. https://ies.lbl.gov/project/policy-analysis-modeling-system accessed.
- 9.Karali N., Shah N., Park W.Y., Khanna N., Ding C., Lin J., Zhou N. Improving the energy efficiency of room air conditioners in China: costs and benefits. Appl. Energy. 2020;258 doi: 10.1016/j.apenergy.2019.114023. [DOI] [Google Scholar]
- 10.Schleich J., Durand A., Brugger H. How effective are EU minimum energy performance standards and energy labels for cold appliances? Energy Pol. 2021;149 doi: 10.1016/j.enpol.2020.112069. [DOI] [Google Scholar]
- 11.Augustus de Melo C., Cunha K.B., Santiago Suárez G.P. MEPS for air conditioners in Brazil: regulatory developments and future perspectives. Renew. Sustain. Energy Rev. 2022;163 doi: 10.1016/j.rser.2022.112504. [DOI] [Google Scholar]
- 12.UNEP . Paris; 2019. Model Regulation Guidelines for Energy-Efficient and Climate-Friendly Air Conditioners. [Google Scholar]
- 13.Ravillard P., Carvajal F., Lopez D., Chueca J.E., Hallack M. 2019. Towards Greater Energy Efficiency in Latin America and the Caribbean: Progress and Policies. [DOI] [Google Scholar]
- 14.OLADE, Panorama Energético de América Latina y el Caribe, 2021.
- 15.Yépez-García R.A., Hallack M., Ji Y., López Soto D. 2018. The Energy Path of Latin America and the Caribbean. [DOI] [Google Scholar]
- 16.IEA . International Energy Agency; 2021. Consumers Can Transform Latin America's Power Systems: Here's How.https://www.iea.org/commentaries/consumers-can-transform-latin-america-s-power-systems-here-s-how accessed. [Google Scholar]
- 17.OLADE . 2022. Energy Efficiency Laws in Latin America and the Caribbean.https://www.olade.org/publicaciones/leyes-de-eficiencia-energetica-en-america-latina-y-el-caribe/ [Google Scholar]
- 18.IEA . International Energy Agency; 2021. Tracking Report: Cooling.https://www.iea.org/reports/cooling accessed. [Google Scholar]
- 19.IEA . 2018. Special Report on Efficient Cooling : Considerations for Latin America. [Google Scholar]
- 20.GlobalABC, IEA, UNEP . Paris; 2020. GlobalABC Regional Roadmap for Buildings and Construction in Latin America: towards a Zero-Emission, Efficient and Resilient Buildings and Construction Sector.https://globalabc.org [Google Scholar]
- 21.Braungardt S., Göthner K.-C. 2017. Harmonisation of MEPS and Energy Labelling in Latin America and the Caribbean-Opportunities and Challenges, ECEE Summer Study Proceedings; pp. 1563–1572.https://www.eceee.org/library/conference_proceedings/eceee_Summer_Studies/2017/7-appliances-products-lighting-and-ict/harmonisation-of-meps-and-energy-labelling-in-latin-america-and-the-caribbean-opportunities-and-challenges/ [Google Scholar]
- 22.UNEP, Desk Study For The Evaluation Of The Energy Efficiency In The Servicing Sector - UNEP/OzL Pro/ExCom/87/7, Montreal. 2021 http://www.multilateralfund.org/87/pages/English.aspx [Google Scholar]
- 23.Park W.Y., Shah N., Choi J.Y., Kang H.J., Kim D.H., Phadke A. Lost in translation: overcoming divergent seasonal performance metrics to strengthen air conditioner energy-efficiency policies. Energy Sustain. Develop. 2020;55:56–68. doi: 10.1016/j.esd.2020.01.003. [DOI] [Google Scholar]
- 24.INEN . Servicio Ecuatoriano de Normalización; ECUADOR: 2017. Eficiencia energética para acondicionadores de aire sin ductos. [Google Scholar]
- 25.Costa F., Jannuzzi G., Lamberts R., Letschert V., Melo A.P., Borges K., Carvalho S., Goes R., Kishinami R., Karali N., Park W.Y., Shah N. São Paulo - Brasil; 2019. Estudo de impacto regulatório: diretrizes gerais e estudo de caso para condicionadores de ar tipo split system no Brasil.http://kigali.org.br/publicacoes/ [Google Scholar]
- 26.Mme . Ministerio de Minas y Energía; Colombia: 2021. Reglamento Técnico de Etiquetado RETIQ: Anexo General. [Google Scholar]
- 27.MINEM . Ministerio de Energía y Minas; Perú: 2017. Reglamento Técnico sobre el etiquetado de eficiencia energética para equipos energéticos.http://www.minem.gob.pe/_legislacionM.php?idSector=12&idLegislacion=11301 [Google Scholar]
- 28.MINEN. Resolución 4 EXENTA . Ministerio de Energía; Chile: 2018. FIJA ESTÁNDAR MÍNIMO DE EFICIENCIA ENERGÉTICA PARA EQUIPOS DE AIRE ACONDICIONADO. [Google Scholar]
- 29.UNEP . SUPPORTING INFORMATION; 2019. ACCELERATING THE GLOBAL ADOPTION OF ENERGY-EFFICIENT AND CLIMATE-FRIENDLY AIR CONDITIONERS. [Google Scholar]
- 30.DOE . United States of America; 2018. Energy Efficiency Standards and Their Compliance Dates, Deparment of Energy.https://www.law.cornell.edu/cfr/text/10/431.97#fn1_tbl2 [Google Scholar]
- 31.Meer . Quito-Ecuador; 2013. Plan Maestro de Electrificación 2012-2021. [Google Scholar]
- 32.ARCONEL. Estadistica Anual Y. 2019. MULTIANUAL DEL SECTOR ELECTRICO ECUATORIANO 2018.https://www.regulacionelectrica.gob.ec/boletines-estadisticos/ accessed. [Google Scholar]
- 33.INEC, Proyecciones y Estudios Demográficos - Sistema Nacional de Información 2017. http://sni.gob.ec/proyecciones-y-estudios-demograficos accessed.
- 34.Porras F., Arnaldo W., Soriano G., Jannuzzi G., Ramirez A. UNICAMP; 2020. Assessment of the Effects of Stricter Standards in Energy Efficiency Regulation for Residential Air Conditioning in Guayaquil , Ecuador.http://repositorio.unicamp.br/jspui/handle/REPOSIP/341900 [Google Scholar]
- 35.Litardo J., Palme M., Borbor-Cordova M., Caiza R., Macias J., Hidalgo-Leon R., Soriano G. Urban Heat Island intensity and buildings' energy needs in Duran, Ecuador: simulation studies and proposal of mitigation strategies. Sustain. Cities Soc. 2020;62 doi: 10.1016/j.scs.2020.102387. [DOI] [Google Scholar]
- 36.Macias J., Iturburu L., Rodriguez C., Agdas D., Boero A., Soriano G. Embodied and operational energy assessment of different construction methods employed on social interest dwellings in Ecuador. Energy Build. 2017;151:107–120. doi: 10.1016/j.enbuild.2017.06.016. [DOI] [Google Scholar]
- 37.INEN, EFICIENCIA ENERGÉTICA PARA ACONDICIONADORES DE AIRE SIN DUCTOS, MINISTERIO DE INDUSTRIAS Y PRODUCTIVIDAD . 2019. ECUADOR. [Google Scholar]
- 38.AN, Ley Orgánica de Eficiencia Energética . Ecuador; 2019. Asamblea Nacional Republica del Ecuador. [Google Scholar]
- 39.Republica del Ecuador, PRIMERA CONTRIBUCIÓN DETERMINADA A NIVEL NACIONAL PARA EL ACUERDO DE PARÍS BAJO LA CONVENCIÓN MARCO DE . 2019. NACIONES UNIDAS SOBRE CAMBIO CLIMÁTICO.https://www4.unfccc.int/sites/NDCStaging/pages/Party.aspx?party=ECU [Google Scholar]
- 40.Mpceip . 2021. Buenas prácticas en los procesos de instalación y mantenimiento de sistemas de refrigeración y aire acondicionado. [Google Scholar]
- 41.Meer Plan Nacional de. Quito-Ecuador; 2016. Eficiencia Energética 2016 - 2035. [Google Scholar]
- 42.MERNNR, Descripción de la gestión realizada durante la ejecución de la Primera Fase del Programa Emblemático RENOVA y propuesta de continuidad del mismo para una siguiente fase., Ministerio de Energía y Recursos Naturales no Renovables, Quito-Ecuador, (n.d).
- 43.Cep K.- 2019. Guidance on Incorporating Efficient, Clean Cooling into the Enhancement of Nationally Determined Contributions. [Google Scholar]
- 44.UNEP . OzonAction Fact Sheet; 2016. The Kigali Amendment to the Montreal Protocol: HFC Phase-Down.https://www.unep.org/ozonaction/resources/factsheet/kigali-amendment-montreal-protocol-hfc-phase-down [Google Scholar]
- 45.UNEP . 2017. OzonAction Series of Fact Sheets Relevant to the Kigali Amendment.https://www.unep.org/ozonaction/resources/factsheet/ozonaction-series-fact-sheets-relevant-kigali-amendment-quick-links [Google Scholar]
- 46.MINEN, Informe Técnico Estándar Mínimo de Eficiencia Energética Equipos de Aire Acondicionado, Santiago - Chile. 2017. [Google Scholar]
- 47.UNEP . 2015. Energy Efficient Cooling Products In Latin America And The Caribbean: An Opportunity To Cool Down The Planet And Accelerate The Regional Economy. [Google Scholar]
- 48.Wiel S., McMahon J.E. Collaborative Labeling and Appliance Standards Program (CLASP) second ed. Washington, D.C; .: 2005. Energy-efficiency labels and standards: a guidebook for appliances, equipment, and lighting.https://escholarship.org/uc/item/01d3r8jg [Google Scholar]
- 49.Mcneil M.A., Letschert V., van Buskirk R.D. vol. 179. LBNL. LBNL; Berkeley: 2007. Methodology for the Policy Analysis Modeling System (PAMS) [Google Scholar]
- 50.Mcneil M.A., Letschert V.E., van Buskirk R.D. LBNL; Berkeley: 2007. User Instructions for the Policy Analysis Modeling System (PAMS) LBNL-17974. [Google Scholar]
- 51.INEC . 2012. Ecuador - Encuesta Nacional de Ingresos y Gastos de Hogares Urbanos y Rurales 2011-2012 - Información General, ECU-INEC-DIES-ENIGHUR-2011-2012v1.4.https://anda.inec.gob.ec/anda/index.php/catalog/291 accessed. [Google Scholar]
- 52.INEC, Encuesta Nacional de Ingresos y Gastos de los Hogares Urbanos y Rurales – Bases de Datos . 2012. ENIGHUR 2004, 2011 - 2012.https://www.ecuadorencifras.gob.ec/encuesta-nacional-de-ingresos-y-gastos-de-los-hogares-urbanos-y-rurales-bases-de-datos/ accessed. [Google Scholar]
- 53.INEC . 2012. Banco de Datos Abiertos, ENEMDU.http://aplicaciones3.ecuadorencifras.gob.ec/BIINEC-war/index.xhtml accessed. [Google Scholar]
- 54.INEC . 2017. Instituto Nacional de Estadística y Censos.http://www.ecuadorencifras.gob.ec/estadisticas/ accessed. [Google Scholar]
- 55.INEC . Quito-Ecuador; 2012. Encuesta Nacional de ingresos y Gastos de los Hogares Urbanos y Rurales 2011-2012. [Google Scholar]
- 56.Un Household. Population Devision; 2019. Size and Composition 2018 - Countries, Depatment of Economic and Social Affairs.https://population.un.org/Household/#/countries/840%0Ahttps://population.un.org/Household/index.html#/countries/368 accessed. [Google Scholar]
- 57.IMF . Washington, DC; 2021. Regional Economic Outlook Western Hemisphere: A Long and Winding Road to Recovery.https://www.imf.org/en/Publications/REO/WH/Issues/2021/10/21/Regional-Economic-Outlook-October-2021-Western-Hemisphere accessed April 1, 2022) [Google Scholar]
- 58.IMF . 2021. Western Hemisphere Economic Outlook - by Country - Ecuador.https://data.imf.org/?sk=3E40CD07-7BD1-404F-BFCE-24018D2D85D2&sId=1461187795902 accessed. [Google Scholar]
- 59.BCE . 2022. Estadísticas Macroeconómicas.https://www.bce.fin.ec/index.php/informacioneconomica/publicaciones-generales accessed. [Google Scholar]
- 60.ARC, Estadística del Sector Eléctrico, (2021). https://www.controlrecursosyenergia.gob.ec/estadisticas-del-sector-electrico-ecuatoriano-buscar (accessed February 9, 2022).
- 61.ARCONEL . 2020. Plan Maestro de Electrificación.https://www.regulacionelectrica.gob.ec/plan-maestro-de-electrificacion/ accessed. [Google Scholar]
- 62.MEER . Quito-Ecuador; 2016. Plan Maestro de Electricidad 2016-2025. [Google Scholar]
- 63.WB . Data; 2019. GNI Per Capita, PPP (Current International $) https://data.worldbank.org/indicator/NY.GNP.PCAP.PP.CD. accessed. [Google Scholar]
- 64.Senae Adm. 2020. de nomenclatura y características de mercancías.http://ecuapass.aduana.gob.ec/ipt_server/ipt_flex/ipt_arancel.jsp accessed. [Google Scholar]
- 65.Wto Tariffs. Tariff Data; 2020. Comprehensive Tariff Data on the World Trade Organization Website.https://www.wto.org/english/tratop_e/tariffs_e/tariff_data_e.htm accessed. [Google Scholar]
- 66.Nair G., Gustavsson L., Mahapatra K. Factors influencing energy efficiency investments in existing Swedish residential buildings. Energy Pol. 2010;38:2956–2963. doi: 10.1016/j.enpol.2010.01.033. [DOI] [Google Scholar]
- 67.Radpour S., Hossain Mondal M.A., Kumar A. Market penetration modeling of high energy efficiency appliances in the residential sector. Energy. 2017;134:951–961. doi: 10.1016/j.energy.2017.06.039. [DOI] [Google Scholar]
- 68.Forrester S.P., Reames T.G. Understanding the residential energy efficiency financing coverage gap and market potential. Appl. Energy. 2020;260 doi: 10.1016/j.apenergy.2019.114307. [DOI] [Google Scholar]
- 69.McNeil M.A., Letschert V.E., de la Rue du S., Can J. Ke. Bottom-Up Energy Analysis System (BUENAS)-an international appliance efficiency policy tool. Energy Effic. 2013;6:191–217. doi: 10.1007/s12053-012-9182-6. [DOI] [Google Scholar]
- 70.McNeil M.A., Letschert V.E., de La Rue Du S. 760E. LBNL. LBNL-; Berkeley: 2008. Can, Global Potential of Energy Efficiency Standards and Labeling Programs; p. 102. [Google Scholar]
- 71.IMF, Regional Economic Outlook Western Hemisphere . Washington, DC; 2020. Pandemic Persistence Clouds the Recovery. [Google Scholar]
- 72.Castro Verdezoto P.L., Vidoza J.A., Gallo W.L.R. Analysis and projection of energy consumption in Ecuador: energy efficiency policies in the transportation sector. Energy Pol. 2019;134 doi: 10.1016/j.enpol.2019.110948. [DOI] [Google Scholar]
- 73.Pinzón K. Dynamics between energy consumption and economic growth in Ecuador: a granger causality analysis. Econ. Anal. Pol. 2018;57:88–101. doi: 10.1016/j.eap.2017.09.004. [DOI] [Google Scholar]
- 74.MERNNR . 2020. Plan Maestro de Electricidad 2019-2027, Quito-Ecuador.https://www.recursosyenergia.gob.ec/plan-maestro-de-electricidad/ [Google Scholar]
- 75.Santamouris M. Cooling the buildings – past , present and future. Energy Build. 2016;128:617–638. doi: 10.1016/j.enbuild.2016.07.034. [DOI] [Google Scholar]
- 76.McNeil M.A., Letschert V.E. 2008. Future Air Conditioning Energy Consumption in Developing Countries and what Can Be Done about it : the Potential of Efficiency in the Residential Sector. [Google Scholar]
- 77.Isaac M., van Vuuren D.P. Modeling global residential sector energy demand for heating and air conditioning in the context of climate change. Energy Pol. 2009;37:507–521. doi: 10.1016/j.enpol.2008.09.051. [DOI] [Google Scholar]
- 78.McNeil M.A., Letschert V.E. Modeling diffusion of electrical appliances in the residential sector. Energy Build. 2010;42:783–790. doi: 10.1016/j.enbuild.2009.11.015. [DOI] [Google Scholar]
- 79.Ürge-Vorsatz D., Cabeza L.F., Serrano S., Barreneche C., Petrichenko K. Heating and cooling energy trends and drivers in buildings. Renew. Sustain. Energy Rev. 2015;41:85–98. doi: 10.1016/j.rser.2014.08.039. [DOI] [Google Scholar]
- 80.Yao J. Modelling and simulating occupant behaviour on air conditioning in residential buildings. Energy Build. 2018;175:1–10. doi: 10.1016/j.enbuild.2018.07.013. [DOI] [Google Scholar]
- 81.McNeil M.A., Iyer M., Meyers S., Letschert V.E., McMahon J.E. Potential benefits from improved energy efficiency of key electrical products: the case of India. Energy Pol. 2008;36:3467–3476. doi: 10.1016/j.enpol.2008.05.020. [DOI] [Google Scholar]
- 82.Letschert V.E., Karali N., Jannuzzi G., Lamberts R., Costa F. ECEEE Summer Study on Energy Efficiency. European Council for an Energy Efficient Economy, Presqu’île de Gien; 2019. The manufacturer economics and national benefits of cooling efficiency for air conditioners in Brazil; pp. 1563–1572.https://www.eceee.org/summerstudy/about/ [Google Scholar]
- 83.ASHRAE . SI Edition; Atlanta: 2013. ASHRAE Handbook—Fundamentals. 2013. [Google Scholar]
- 84.ARCONEL, ESTADISTICA ANUAL Y . Quito-Ecuador; 2018. MULTIANUAL DEL SECTOR ELECTRICO ECUATORIANO 2017. [Google Scholar]
- 85.CNEL, CORPORACION NACIONAL DE ELECTRICIDAD 2018. https://www.cnelep.gob.ec/ accessed.
- 86.Ramirez A., Rivela B., Boero A., Melendres A.M. Lights and shadows of the environmental impacts of fossil-based electricity generation technologies: a contribution based on the Ecuadorian experience. Energy Pol. 2019;125:467–477. doi: 10.1016/j.enpol.2018.11.005. [DOI] [Google Scholar]
- 87.BCE, Banco Central del Ecuador . 2019. Tasas de Interés.https://contenido.bce.fin.ec/docs.php?path=/documentos/Estadisticas/SectorMonFin/TasasInteres/Indice.htm accessed. [Google Scholar]
- 88.CAF . Identificación de oportunidades; 2016. Eficiencia energética en Ecuador. [Google Scholar]
- 89.Brucal A., Roberts M.J. Do energy efficiency standards hurt consumers? Evidence from household appliance sales. J. Environ. Econ. Manag. 2019;96:88–107. doi: 10.1016/j.jeem.2019.04.005. [DOI] [Google Scholar]
- 90.CLASP, COOLING IN A WARMING WORLD . 2019. Global Markets & Policy Trends. [Google Scholar]
- 91.Osunmuyiwa O.O., Payne S.R., Vigneswara Ilavarasan P., Peacock A.D., Jenkins D.P. I cannot live without air conditioning! The role of identity, values and situational factors on cooling consumption patterns in India. Energy Res. Social Sci. 2020;69 doi: 10.1016/j.erss.2020.101634. [DOI] [PMC free article] [PubMed] [Google Scholar]
- 92.Agdas D., Barooah P. 2020. The COVID-19 Pandemic's Impact on Electricity Demand and Supply; pp. 1–13.https://eprints.qut.edu.au/200965/ [DOI] [PMC free article] [PubMed] [Google Scholar]
- 93.CAF, Proyecto Huella de Ciudades . 2016. Resultados Estratégicos Y Guía Metodológica.http://www.huelladeciudades.com/citiesfootprint/index.html [Google Scholar]
- 94.CAF, Huella de Ciudades No . Development Bank of Latin America; 2017. 6 Ciudad de Guayaquil.https://scioteca.caf.com/bitstream/handle/123456789/1663/Huellas de Ciudades-Ciudad de Guayaquil.pdf?sequence=44&isAllowed=y. [Google Scholar]
- 95.IDB . Energy Effic; 2020. Inter-American Development Bank - Willingness to Buy Energy Efficient Appliances.https://hubenergia.org/en/indicators/willingness-buy-energy-efficient-appliances accessed. [Google Scholar]
- 96.Zhao T., Bell L., Horner M.W., Sulik J., Zhang J. Consumer responses towards home energy financial incentives: a survey-based study. Energy Pol. 2012;47:291–297. doi: 10.1016/j.enpol.2012.04.070. [DOI] [Google Scholar]
- 97.de la Rue du Can S., Leventis G., Phadke A., Gopal A. Design of incentive programs for accelerating penetration of energy-efficient appliances. Energy Pol. 2014;72:56–66. doi: 10.1016/j.enpol.2014.04.035. [DOI] [Google Scholar]
- 98.Ramos A., Gago A., Labandeira X., Linares P. The role of information for energy efficiency in the residential sector. Energy Econ. 2015;52:S17–S29. doi: 10.1016/j.eneco.2015.08.022. [DOI] [Google Scholar]
- 99.ACUERDO MINISTERIAL PARA EXPEDIR LA POLITICA PÚBLICA . 2022. Del sector electrico, Ecuador. [Google Scholar]
- 100.Ministerio de Energía y Minas . Ecuador; 2022. Acuerdo Ministerial Para Expedir Las Políticas Públicas Para Fomentar La Eficienciaenergética En El Ecuador. [Google Scholar]
Associated Data
This section collects any data citations, data availability statements, or supplementary materials included in this article.
Supplementary Materials
Data Availability Statement
Data included in article/supp. material/referenced in article.