Abstract
This study investigated the pathogenesis of major depressive disorder (MDD) and acute myocardial infarction (AMI) using bioinformatics. We analyzed MDD and AMI (MDD-AMI) datasets provided by the Gene Expression Omnibus (GEO) database for genes common to MDD and AMI using GEO2R and weighted gene co-expression network analysis (WGCNA). We also performed Gene Ontology (GO) and Kyoto Encyclopedia of Genes and Genomes (KEGG) enrichment analyses, and we used Disease Ontology (DO) analysis to identify a) the pathways through which genes function and b) comorbidities. We also created a protein-protein interaction (PPI) network using the STRING database to identify the hub genes and biomarkers. NetworkAnalyst 3.0 was used to construct a transcription factor (TF) gene regulatory network. We also identified relevant complications and potential drug candidates. The 27 genes common to MDD and AMI were enriched in the pathways regulating TFs and mediating immunity and inflammation. The hub genes in the PPI network included TLR2, HP, ICAM1, LCN2, LTF, VCAN, S100A9 and NFKBIA. Key TFs were KLF9, KLF11, ZNF24, and ZNF580. Cardiovascular, pancreatic, and skeletal diseases were common complications. Hydrocortisone, simvastatin, and estradiol were candidate treatment drugs. Identification of these genes and their pathways may provide new targets for further research on the pathogenesis, biomarkers, and treatment of MDD-AMI. Together our results suggested that TLR2 and VCAN might be the key genes associated with MDD complicated by AMI.
Keywords: Major depression disorder, acute myocardial infarction, biomarkers, pathogenesis, bioinformatics analysis
Introduction
Major depressive disorder (MDD) is a serious psychiatric health complication and a leading cause of suicide. The World Health Organization indicates that by 2030 depression will comprise the major worldwide disease burden [1]. Acute myocardial infarction (AMI) has declined significantly with the use of evidence-based medicine; however, AMI is still a major contributor to global morbidity and mortality, affecting approximately seven million people worldwide anually [2]. MDD and AMI are closely related, and MDD increases the morbidity and mortality of individuals with cardiovascular disease, especially AMI [3]. For individuals with depression, after AMI, the all-cause mortality increases 2.25-fold, the risk of cardiac death increases by 2.71-fold, and the new cardiac risk increases by 1.59-fold [4]. Additionally, the incidence of one-year MDD was 13.8% higher in patients with AMI than in the healthy population [5,6]. Therefore, early diagnosis of MDD in AMI patients is critical for reducing morbidity and mortality.
MDD and AMI interacts via the neuroendocrine system that regulates the electrical activity of the heart. Patients with depression have a dysfunctional autonomic nervous system, which is manifested by an increased sympathetic tone and decreased vagal tone, thereby affecting cardiac function [7]. Also, patients with MDD have abnormal serotonin levels in the central nervous system, and the receptors for serotonin on platelets are similar to those in the central nervous system. Therefore, increased platelet activation and aggregation are potential mechanisms for the interaction between MDD and AMI [8]. Moreover, the onset and progression of MDD are associated with the activation of the immune system [9], with increased expression of inflammatory factors such as interleukin 6 (IL-6), tumor necrosis factor (TNF), and C-reactive protein (CRP) [10]. Increased TNF has been shown to be associated with depression after myocardial infarction [11]. Although the exact pathogenic mechanisms are unknown, genetic factors contribute to the onset and progression of depression [12]; GPR18, PDK4, NRG1, and EPHB2 are diagnostic markers for depression [13]. Similarly, IL1R2, IRAK3, and THBD are diagnostic markers for AMI [14]. However, no genetic studies yet explain the mechanisms underlying MDD-AMI.
We used high-throughput microarrays, an important tool for large-scale gene expression analysis [15], to screen for potential diagnostic markers of MDD-AMI. We used GEO2R and weighted gene co-expression network analysis (WGCNA) with the GSE98793 and GSE66360 datasets from the Gene Expression Omnibus (GEO) database to screen for genes commonly associated with both MDD and AMI. We also performed gene enrichment analysis to identify the gene regulatory mechanisms underlying MDD-AMI. Further, we created a protein-protein interaction (PPI) network to identify hub genes with a role in MDD-AMI. We also constructed a transcription factor (TF)-gene regulatory network and screened for drugs targeting the network. This study is the first to use a bioinformatics approach to explore the pathogenesis and biological markers characteristic of MDD-AMI.
Material and methods
Dataset acquisition and data preprocessing
We screened humans in the GEO database [16] and obtained two datasets, GSE98793 [17] and GSE66360 [18], corresponding to MDD and AMI, respectively (> 30 samples in each gene set). The dataset GSE98793 contains the whole blood data for 128 patients with MDD and 64 healthy controls, contributed by Kelly et al. [17] on platform GPL570, and GSE66360 contains the whole blood data for 49 patients with AMI and 50 healthy controls uploaded by Kramer ER et al. [18] using the GPL570 platform.
Screening for hub biomarkers
GEO2R is an online GEO tool to identify differentially expressed genes (DEGs) for two or more sets of samples. GEO2R includes the limma and GEOquery packages for data reading, ID conversion, forced normalization, and DEG acquisition. Our screening thresholds for DEGs between GSE98793 and GSE66360 were set to the absolute value of Log2 Fold Change ≥ 0.5 and P < 0.05.
The systems biology algorithm WGCNA identifies co-expression network modules to determine the relationship between these networks and phenotypic traits, generates gene regulatory networks, and identifies hub network module genes [19]. The gene co-expression network and adjacency matrix were constructed by removing outlier samples through dynamic shear tree clustering and filtering appropriate soft thresholds using the ickSoftThreshold function (package WGCNA), which was converted into a network topology matrix using appropriate β values [20]. Then, we set the minimum value of the network module to 80, obtained the gene regulatory network module, and determined the correlation between network modules and diseases using a Pearson correlation analysis. Genes within the network were analyzed to identify hub genes. We use the Venn package (version R 4.1.0) with the set of the DEGs obtained using GEO2R and the set of hub module genes analyzed by WGCNA to identify genes common to both sets for subsequent bioinformatics analysis.
Functional enrichment analysis
We analyzed molecular pathways associated with MDD-AMI using Gene Ontology (GO), Kyoto Encyclopedia of Genes and Genomes (KEGG), and Disease Ontology (DO) enrichment analyses, and we screened the genes common to MDD and AMI for functional enrichment analysis and disease prediction [21]. GO enrichment analysis identifies the pathways related to cellular components (CCs), molecular functions (MFs), and biological processes (BPs) in the gene set [22]. The specific actions and metabolic pathways of genes common to MDD and AMI were identified by KEGG analysis [23]. We used the R package org.Hs.eg.db to transform the gene names to gene IDs and carried out the GO, KEGG, and DO enrichment analyses using the R packages ClusterProfiler [24] and Disease Ontology Semantic and Enrichment analysis (DOSE) [25]. We considered P < 0.05 as indicating a significant enrichment and the enrichment results were visualized using ggplot2 (version R 4.1.0).
PPI network construction
PPI networks are involved in biological signaling, energy, and material metabolism, as well as gene expression and cell cycle regulation. We constructed and analyzed a PPI network to search for hub regulatory genes [26-28]. The STRING 11.0 (Version 11.0) [28] database was used to identify genes common to MDD and AMI and construct a PPI network, which was imported into Cytoscape for visualization. The Molecular Complex Detection algorithm (MCODE) plug-in in Cytoscape was used to analyze the identified genes to acquire gene modules with the following reference thresholds: setting parameters as degree cutoff = 2, node score = 0.2, k-core = 2, and maximum depth = 100 [29]. Cytoscape’s cytohubba plug-in was used to screen the hub genes using eight algorithms, including Degree, EcCentricity, BottleNeck, Density of Maximum Neighborhood Component (DMNC), Maximal Clique Centrality (MCC), Closeness, and Betweenness, which were displayed using an UpSet plot (a type of Venn diagram).
Construction of a TF-gene regulatory network
TFs are DNA-binding proteins that interact with specific genes to activate or inhibit transcription. A TF-gene regulatory network can identify the pathways by which TFs affect gene expression [30]. We applied the Encyclopedia of DNA Elements (ENCODE) database [31] from the web-based tool NetworkAnalyst 3.0 for analyzing gene expression to develop the TF-gene regulatory network.
Identification of drug candidates
Because there are no drugs to treat MDD-AMI and alleviate the psychological and physical burden on patients, we used bioinformatics to identify potential new drugs for clinical use in a shorter time and with less cost than typical drug development. The Drug Signature Database (DSigDB), which is hosted on the Enrichr web platform, associates drugs with their target genes [32]. We entered genes common to MDD and AMI into the Enrichr platform (https://amp. pharm.mssm.edu/enrichr/) to screen for drug candidates associated with these common genes in the DSigDB database.
Verify hub gene
To verify the validity of a hub gene, we analyzed the differences between the hub gene expression in the MDD dataset GSE38206 and the AMI dataset GSE60993. The GSE38206 dataset was obtained from the study by Belzeaux et al. [33] based on the GPL13607 platform, which analyzed peripheral blood samples from 18 healthy and 18 MDD groups. The GSE60993 dataset comprises data on blood samples uploaded by Park et al. [34] based on the GPL6884 platform for assessing and diagnosing biomarkers of ST-segment elevation myocardial infarction. We analyzed the difference between seven ST-segment elevation myocardial infarction samples, 10 non-ST-segment elevation myocardial infarction samples, and seven healthy controls. For the GSE60993 and the GSE38206 datasets, we used the limma R package to identify DEGs (|log2 FC| ≥ 0.5, P < 0.05), the limma package of R software for difference analysis, the normalizeBetweenArrays function for mandatory normalization of the data, and the ggplot2 package for hierarchical clustering analysis of DEGs. The Venn package was used to identify the intersection of DEGs between the validation data sets GSE38206 and GSE60993.
Statistical analysis
Differential analysis, WGCNA, and enrichment analysis between the two groups were performed using the R software (v.4.1.0). We did the enrichment analysis with hypergeometric tests, and paired data comparisons were made using the Wilcoxon test. Detailed statistical strategies used in processing the transcriptomic data are presented in the Materials and Methodology section. P < 0.05 indicated a significant difference.
Results
Screening of DEGs
The GSE66360 and GSE98793 datasets were analyzed using the limma and GEOquery packages of the GEO2R web tool. We identified 986 DEGs from the GSE66360 dataset, including 662 upregulated and 324 downregulated genes. The heat map of GSE66360 (Figure 1A) and gradient volcano map (Figure 1B) show the expression levels and distribution sites of these DEGs. In addition, we identified 496 DEGs from the GSE98793 dataset, including 250 upregulated genes and 246 downregulated genes. The heat map of GSE98793 (Figure 1C) and gradient volcano map (Figure 1D) show the expression levels and distribution sites of these DEGs.
Figure 1.
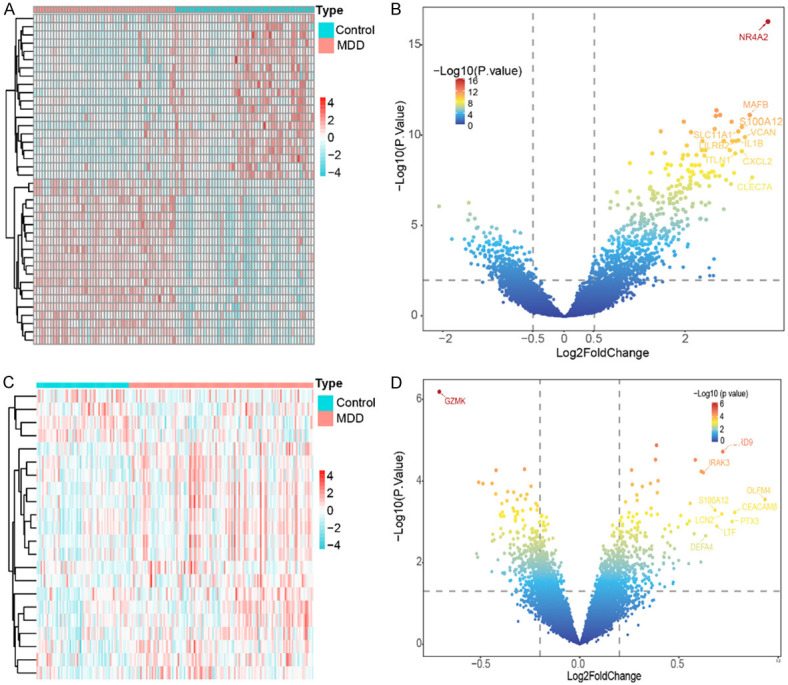
Identification of differentially expressed genes (DEGs) between GSE66360 and GSE98793. A. Heatmap of DEGs in GSE66360 (n = 99, adj. P < 0.05, |log2 fold change (FC)| > 0.5). B. Volcano plot of DEGs in GSE66360. C. Heatmap of DEGs in GSE98793 (n = 186, adj. P < 0.05, |log2 fold change (FC)| > 0.5). D. Volcano plot of DEGs in GSE98793.
WGCNA
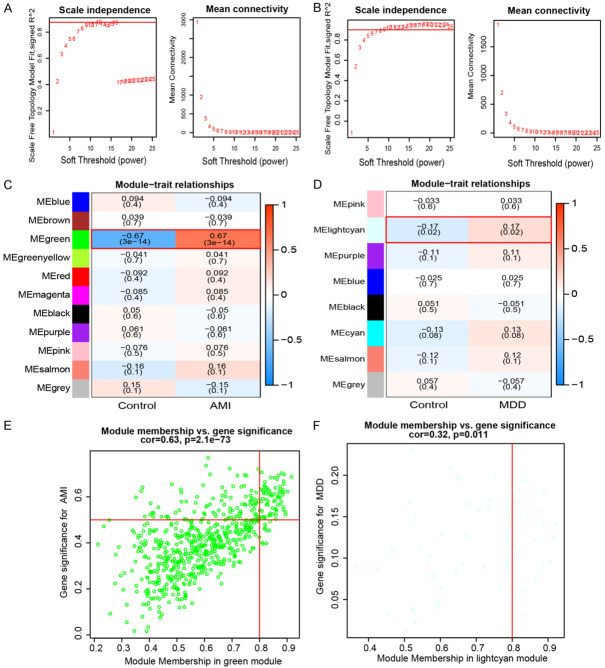
We used WGCNA to identify the links between relevant phenotypes and hub genes. Initially, we applied the dynamic shear tree method to eliminate one outlier sample in GSE98793 when the shear line was 130, and there were no outlier samples in GSE66360. Then, the two datasets were analyzed separately by WGCNA. The optimal soft threshold for GSE66360 was β = 12 (Figure 2A), yielding 11 network modules (Figure 2C), and for GSE98793, it was β = 9 (Figure 2B), yielding 11 network modules (Figure 2D). Then, we determined the link between network modules and clinical features. In the GSE66360 database, the green module had the strongest positive link with AMI (r = 0.67, P < 0.05), and module membership and gene significance were closely correlated (cor = 0.63, P = 2.1e-73) (Figure 2E). In the GSE98793 dataset, light cyan modules were statistically significant (r = 0.17, P < 0.05), where module membership and gene significance were closely correlated (cor = 0.32, P = 0.011) (Figure 2F).
Figure 2.
Weighted gene co-expression network analysis (WGCNA) of GSE66360 and GSE98793. A. Determination of soft thresholding power for GSE66360. B. Determination of soft-thresholding power for GSE98793. C. Heatmap of the correlation between module eigengenes and the occurrence of acute myocardial infarction (AMI). D. Heatmap of the correlation between module eigengenes and the occurrence of major depressive disorder (MDD). E. Module membership in green module vs. gene significance for AMI. F. Module membership in light cyan module vs. Gene significance for MDD.
We determined the intersection of the genes from the GEO2R differential analysis and WGCNA separately using the R package ggVennDiagram [35]. We identified 13 DEG intersections between GSE66360 and GSE98793 and 14 intersections for WGCNA, resulting in 27 genes common to MDD and AMI (Figure 3).
Figure 3.
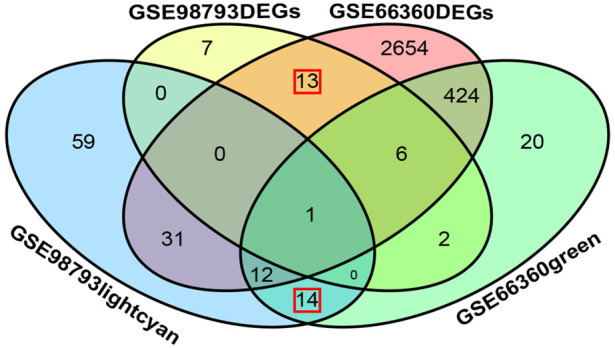
Venn diagram of MDD and AMI common genes. There were 27 genes common to MDD and AMI. Among them, 13 DEGs were obtained by differential analysis and 14 typical modular genes were obtained by WGCNA. Acute Myocardial Infarction (AMI), Major Depressive Disorder (MDD), Weighted Gene Co-expression Network Analysis (WGCNA).
Enrichment analyses
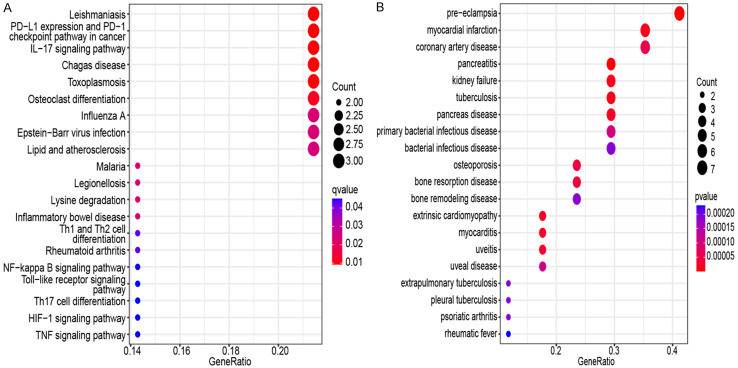
The analysis results for the top 10 GO terms indicated that the genes common to MDD and AMI were primarily enriched in the regulation of TFs and responses to bacteria and fungi. CC was primarily related to cellular granules and their release. BF was primarily related to carbohydrates, toll-like receptors, and other mutual interactions (Figure 4; Table 1). The analysis results for the top 10 KEGG terms revealed that genes common to MDD and AMI were primarily related to immunity and inflammation (Figure 5A; Table 2). In addition, MDD-AMI was significantly associated with cardiovascular, pancreatic, and skeletal diseases (Figure 5B).
Figure 4.
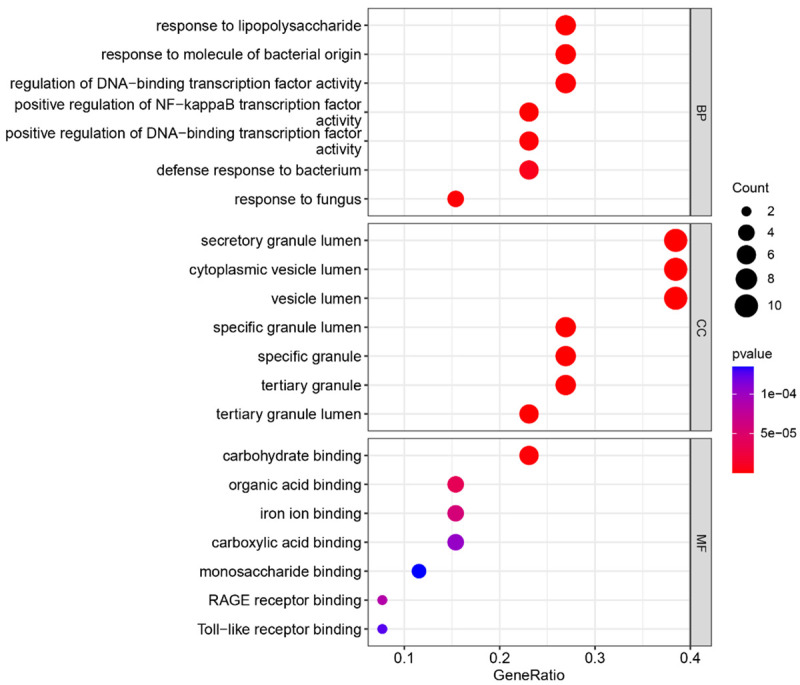
Gene Ontology (GO) enrichment analysis results for common genes.
Table 1.
Gene ontology (GO) category, GO ID, GO description, and their corresponding P-value
| Category | ID | Description | P-value |
|---|---|---|---|
| BP | GO:0051092 | positive regulation of NF-kappaB transcription factor activity | 5.22E-08 |
| BP | GO:0032496 | response to lipopolysaccharide | 3.18E-07 |
| BP | GO:0002237 | response to molecule of bacterial origin | 4.65E-07 |
| BP | GO:0051091 | positive regulation of DNA-binding transcription factor activity | 1.23E-06 |
| BP | GO:0009620 | response to fungus | 1.35E-06 |
| BP | GO:0051090 | regulation of DNA-binding transcription factor activity | 1.69E-06 |
| BP | GO:0042742 | defense response to bacterium | 6.86E-06 |
| BP | GO:0071222 | cellular response to lipopolysaccharide | 8.98E-06 |
| BP | GO:0071219 | cellular response to molecule of bacterial origin | 1.18E-05 |
| BP | GO:0071216 | cellular response to biotic stimulus | 1.97E-05 |
| CC | GO:0035580 | specific granule lumen | 1.43E-12 |
| CC | GO:0034774 | secretory granule lumen | 5.38E-12 |
| CC | GO:0060205 | cytoplasmic vesicle lumen | 5.89E-12 |
| CC | GO:0031983 | vesicle lumen | 6.26E-12 |
| CC | GO:1904724 | tertiary granule lumen | 8.25E-11 |
| CC | GO:0042581 | specific granule | 1.24E-09 |
| CC | GO:0070820 | tertiary granule | 1.48E-09 |
| CC | GO:0071682 | endocytic vesicle lumen | 0.000423 |
| CC | GO:0030867 | rough endoplasmic reticulum membrane | 0.000501 |
| CC | GO:0005791 | rough endoplasmic reticulum | 0.005291 |
| MF | GO:0030246 | carbohydrate binding | 1.75E-06 |
| MF | GO:0043177 | organic acid binding | 3.68E-05 |
| MF | GO:0005506 | iron ion binding | 5.7E-05 |
| MF | GO:0050786 | RAGE receptor binding | 8.61E-05 |
| MF | GO:0031406 | carboxylic acid binding | 0.000103 |
| MF | GO:0035325 | Toll-like receptor binding | 0.000126 |
| MF | GO:0048029 | monosaccharide binding | 0.000135 |
| MF | GO:0031418 | L-ascorbic acid binding | 0.00036 |
| MF | GO:0001530 | lipopolysaccharide binding | 0.00099 |
| MF | GO:0019842 | vitamin binding | 0.001163 |
Figure 5.
Kyoto Encyclopedia of Genes and Genomes (KEGG) enrichment analysis and complication analysis of common genes. A. KEGG enrichment analysis results for 27 genes screened by WGCNA. B. Complications of myocardial infarction major depression derived from analysis of 27 genes screened by WGCNA. Weighted Gene Co-expression Network Analysis (WGCNA).
Table 2.
Kyoto Encyclopedia of Genes and Genomes (KEGG) pathways ID and description and their corresponding P-value
| ID | Description | P-value |
|---|---|---|
| hsa05140 | Leishmaniasis | 0.000274 |
| hsa05235 | PD-L1 expression and PD-1 checkpoint pathway in cancer | 0.000421 |
| hsa04657 | IL-17 signaling pathway | 0.000494 |
| hsa05142 | Chagas disease | 0.000628 |
| hsa05145 | Toxoplasmosis | 0.000825 |
| hsa04380 | Osteoclast differentiation | 0.001215 |
| hsa05164 | Influenza A | 0.00279 |
| hsa05144 | Malaria | 0.003206 |
| hsa05134 | Legionellosis | 0.004148 |
| hsa05169 | Epstein-Barr virus infection | 0.004468 |
PPI network analysis
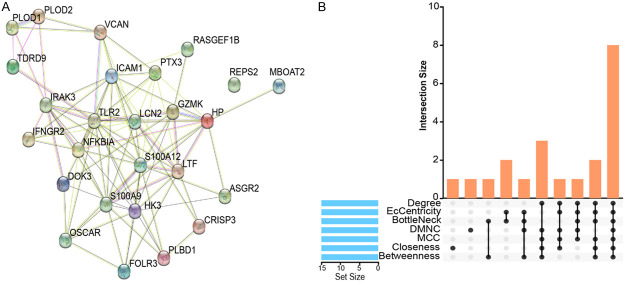
The interactions between proteins identified the pathways of interaction between genes common to MDD and AMI. A total of 26 hub targets (96 edges, an average number of nodes of 7.38, and an average clustering coefficient of 0.56) were obtained from the PPI network analysis with a confidence coefficient set to 0.15 (Figure 6A). Then, the PPI network was imported into Cytoscape and visualized by the MCODE and cytohubba plug-ins. In addition, eight of the plug-ins were selected for hub gene screening to obtain eight hub genes, including toll-like receptor (TLR2), haptoglobin (HP), intercellular adhesion molecule 1 (ICAM1), lipocalin 2 (LCN2), lactotransferrin (LTF), versican (VCAN), S100 calcium-binding protein A9 (S100A9), and nuclear factor of kappa light polypeptide gene enhancer in B-cells inhibitor, alpha (NFKBIA) (Figure 6B).
Figure 6.
Protein-protein interaction network. A. Protein-protein interaction (PPI) network. Based on the STRING database, protein-protein interaction networks of the common genes in the AMI and MDD. B. Upset Venn showed the number of core genes screened for overlap with each other for the eight models in the PPI network. Acute Myocardial Infarction (AMI), Major Depressive Disorder (MDD).
Construction of the TF-mRNA regulatory network
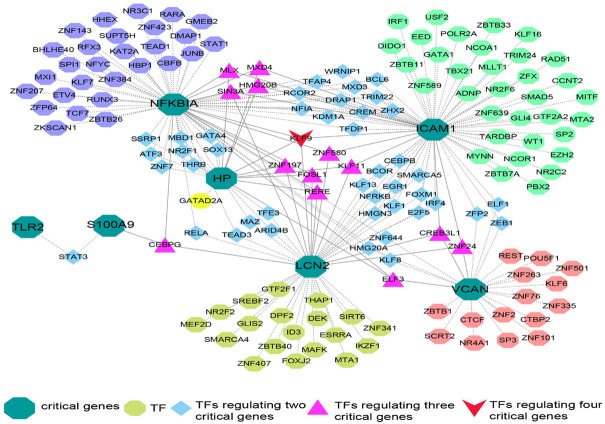
We used the ENCODE database of NetworkAnalyst 3.0 to construct the TF-gene regulatory network. The interaction between TFs and hub genes is illustrated in Figure 7. The network contained seven hub targets, 161 nodes, and 220 edges. ICAM1 was regulated by up to 71 TFs, whereas the TF Krüppel-like factor 9 (KLF9) regulated four core genes simultaneously.
Figure 7.
Transcription Factor (TF)-common gene regulatory network. The interrelationship between transcription factors and critical genes, dark green octagon represents critical genes, other color octagons represent TFs that can only regulate the corresponding core genes, sky blue quadrilateral represents TFs regulating two critical genes, the lavender triangle represents TFs regulating three critical genes, red quadrilateral represents TFs regulating four critical genes.
Identification of drug candidates
The hub genes were entered into the DSigDB database of the Enrichr platform to screen for drugs targeting these genes (Table 3). The top 10 drug candidates were glycoprotein, potassium persulphate, maltotriose, iron, trimethoprim, isoguanine, hydrocortisone, sodium dodecyl sulfate, simvastatin, and estradiol (Table 4).
Table 3.
Acute myocardial infarction (AMI) and Major depressive disorder (MDD) gene-targeted drugs
| Term | P-value | Combined Score | Genes |
|---|---|---|---|
| GLYCOPROTEIN BOSS | 3.91E-09 | 3473.479 | HP; LCN2; TLR2; ICAM1; LTF |
| POTASSIUM PERSULFATE CTD 00000451 | 6.45E-08 | 10443.16 | LCN2; S100A9; LTF |
| maltotriose BOSS | 4.51E-07 | 1626.416 | HP; TLR2; ICAM1; LTF |
| IRON BOSS | 4.82E-07 | 1592.053 | HP; LCN2; ICAM1; LTF |
| trimethoprim BOSS | 5.48E-07 | 1526.976 | LCN2; TLR2; ICAM1; LTF |
| Isoguanine BOSS | 5.59E-07 | 1516.576 | HP; TLR2; ICAM1; LTF |
| hydrocortisone BOSS | 6.32E-07 | 1456.666 | HP; TLR2; ICAM1; LTF |
| Sodium dodecyl sulfate CTD 00006753 | 2.47E-06 | 2236.6 | S100A9; TLR2; ICAM1 |
| simvastatin CTD 00007319 | 3.49E-06 | 824.7797 | NFKBIA; S100A9; TLR2; ICAM1 |
| estradiol CTD 00005920 | 4.86E-06 | 1533239 | NFKBIA; VCAN; HP; LCN2; S100A9; TLR2; ICAM1; LTF |
Table 4.
Detailed information on eight critical genes
| Gene | Full name | Gene-related function |
|---|---|---|
| TLR2 | Toll Like Receptor 2 | Toll-like receptors (TLRs) are single transmembrane cell surface receptors that play a key role in the innate immune system. |
| HP | Haptoglobin | Hp, also known as haptoglobin, reduces tissue damage caused by oxidative stress by binding to free hemoglobin. |
| ICAM1 | Intercellular Adhesion Molecule 1 | ICAM1 is a cell-surface glycoprotein that is involved in the binding of a cell to another cell or extracellular matrix. ICAM1 is commonly expressed on endothelial and immune system cells and plays a role in cell proliferation, differentiation, locomotion, transportation, apoptosis and tissue construction. |
| LCN2 | Lipocalin 2 | LCN2, also known as neutrophil gelatinase-associated calcitonin (NGAL), is a cytokine mainly secreted by adipocytes. Overexpression of LCN2 can exert cellular protective mechanisms through anti-inflammatory and antioxidant activities and reduce cardiac myocyte death and remodeling. |
| LTF | Lactotransferrin | LTF, a member of the transferrin gene family, has antimicrobial activity and is an important component of the non-specific immune system. |
| VCAN | Versican | VCAN is a large chondroitin sulfate proteoglycan that plays a role in intercellular signaling and in connecting cells to the extracellular matrix. It also plays a role in diseases such as wound healing and tissue remodeling. |
| S100A9 | S100 Calcium Binding Protein A9 | S100A9 leads to myocardial cell damage by inhibiting mitochondrial function. |
| NFKBIA | NFKB Inhibitor Alpha | NFKBIA plays an important role in atherosclerotic diseases by regulating the expression of pro-inflammatory genes. |
Verification of hub genes
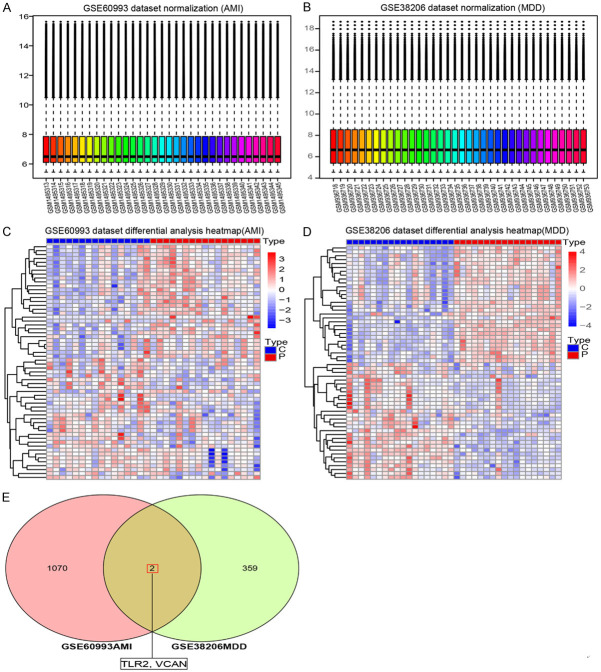
The MDD dataset GSE38206 and the AMI dataset GSE60993 were selected to verify hub genes. Figure 8A and 8B shows the forced normalization of the two datasets, and Figure 8C and 8D shows the hierarchical clustering heat maps of the DEGs in the two datasets. Figure 8E shows the common intersection of the DEGs between the two validation datasets, where hub genes TLR2 and VCAN were screened as genes common to MDD and AMI.
Figure 8.
Biomarker identification of AMI and MDD. Core gene verification (A) and (B) conducted mandatory normalization of GSE60993 and GSE38206 data sets, respectively. (C) Hierarchical cluster heat map of differentially expressed genes in the GSE60993 dataset. (D) Hierarchical cluster heat map of differentially expressed genes in the GSE38206 dataset. (E) The intersection of GSE60993 and GSE38206 differentially expressed genes. Acute Myocardial Infarction (AMI), Major Depressive Disorder (MDD).
Discussion
In the past ten years, our understanding of the biology of mood disorders and cardiovascular diseases has advanced significantly. Several pathophysiological aspects of depressive disorders may contribute to susceptibility to coronary heart disease. A systems biology approach has been used to develop a map of the processes that link depression with cardiovascular diseases [36]. In addition, mathematical models have identified a link between the symptoms of depression and 12-month mortality after myocardial infarction [37]. Platelet coagulation cascade, the autonomic nervous system, heart rate variability, inflammation, endothelial progenitor cell accessibility, hypothalamic-pituitary-adrenal and hypothalamic-pituitary-thyroid axis function, along with changes in vascular calcification, ventricular instability, oxidative stress, myocardial ischemia, and genetic factors may enhance the risk of coronary heart disease in depressed individuals. However, the mechanisms that associate MDD with AMI are unknown. This research intends to explore the mechanisms underlying MDD-AMI using bioinformatics.
We analyzed the gene sets GSE98793 and GSE66360 using WGCNA and GEO2R to identify genes common to MDD and AMI and performed enrichment analyses on these genes to identify the pathways in which the genes function. Then, STRING was applied to the genes common to MDD and AMI to construct the PPI network. Finally, eight hub genes (TLR2, HP, ICAM1, LCN2, LTF, VCAN, S100A9, and NFKBIA) were screened. After dataset verification, we found that TLR2 and VCAN were common to MDD and AMI. Although there is no information on the genetic mechanisms that underlie MDD-AMI, the genes HP, LCN2, NFKBIA, TLR2, and VCAN that were associated with both diseases may play a role in the occurrence and progression of MDD-AMI. SI00A9 has been studied in AMI; however, there are no studies on SI00A9 related to MDD. Neither LCAM1 nor LTF has been studied in the context of MDD-AMI, which needs further investigation.
Haptoglobin, encoded by HP, binds to free hemoglobin to reduce tissue damage from oxidative stress [38]. HP exists in three variant protein phenotypes, HP1-1, HP1-2, and HP2-2. HP2-2 was reportedlt to have lower antioxidant activity than the other variants, and myocardial infarction patients with HP2-2 have a poorer prognosis [39]. HP plasma levels were considerably higher in individuals with MDD vs. healthy controls or mildly depressed individuals [40]. Therefore, oxidative stress may be a critical pathway for MDD-AMI, and HP may be an important mechanism through which MDD and AMI mutually increase the risk of morbidity. However, the impact of different HP gene variants on the prognosis of patients with MDD needs further exploration.
LCN2, also called neutrophil gelatinase-associated lipocalin (NGAL), encodes a cytokine secreted primarily by adipocytes. LCN2 overexpression has anti-inflammatory and antioxidant cytoprotective effects that reduce cardiomyocyte death and remodeling [41,42]. Low expression of LCN2 in hippocampal neurons contributes to the onset of depression. In addition, LCN2 may lead to the comorbidity between myocardial infarction and depression through inflammation [43].
The NFKBIA-encoded protein mediates the expression of pro-inflammatory genes that are critically involved in atherosclerosis-like diseases [44]. Expression of NFKBIA, a stress-related gene, is elevated in the hippocampal and amygdala regions of mice with posttraumatic stress disorder [45]. High expression of NFKBIA may contribute to suicidal behavior in depressed patients through the pathways of apoptosis, cell death, and inflammation [46]; thus, this gene may be involved in the mechanism by which AMI causing depression.
S100A9 is a potential genetic marker for AMI [47]. In AMI-related reperfusion injury, S100A9 damages cardiomyocytes by inhibiting mitochondrial function, and S100A9-neutralizing antibodies significantly attenuate myocardial infarction-related reperfusion injury [48]. Additionally, higher S100A9 levels during a myocardial infarction exacerbate the risk of heart failure [49]. The unexplored relationship between S100A9 and MDD could be a new research direction.
Toll-like receptors (TLRs), a family of transmembrane proteins that bind primarily to microbial products, play a central role in innate immunity by recognizing pathogens and damage-related molecular patterns and are associated with a range of inflammatory and autoimmune diseases [50]. Damage to cardiomyocytes in mice with myocardial infarction is attenuated by the inhibition of TLR2 [51]. A TLR profile can predict the response to antidepressant treatment. Elevated TLR2 levels may contribute to suicide in patients with MDD [46], and the TLR2 levels decrease in depressed patients after treatment [52]. Our GO analysis suggested that toll-like receptors are essential for the hub genes to function. KEGG analysis also revealed that immunity and inflammation are important pathways for MDD-AMI. Therefore, TLR2 may be a key mechanism underlying MDD-AMI.
VCAN, encoding a large chondroitin sulfate proteoglycan, is involved in intercellular signaling and connecting cells to the extracellular matrix [53], as well as in wound healing and tissue remodeling. Elevated VCAN expression was observed in patients with AMI [54]. VCAN gene variants may contribute to the onset of depression through alterations in the microstructural integrity of brain white matter [55]. Here, we found that orthopedic disorders are a common complication of MDD-AMI; therefore, this gene may contribute to this complication.
LTF belongs to the family of transferrin genes, and the protein it encodes has anti-microbial activity, making it an essential component of the non-specific immune system. This transferrin regulates iron homeostasis, acts as a host defense against several microbial infections, has anti-inflammatory activity, regulates cell growth and differentiation, and protects against cancer progression and metastasis. LTF and its peptides have anti-microbial, anti-viral, anti-fungal, and anti-parasitic activities [56]. However, as it has not been associated with MDD-AMI, this could provide a new area for research.
Intercellular cell adhesion molecule-1 (LCAM1), a cell surface glycoprotein that mediates the binding of cells to each other or the extracellular matrix, is commonly expressed on endothelial cells [57] and immune system cells [58]. It is critical for cell proliferation, differentiation, motility, transport, apoptosis, and tissue construction. Because MDD is closely related to immunity [13], it could increase the risk of AMI through an immune pathway that affects the function of endothelial cells. Currently, there is no information about the relationship between LCAM1 and MDD-AMI.
Enrichment analyses revealed that the pathways of hub genes were primarily enriched in regulating TFs, suggesting that TFs are important for MDD-AMI. Krüppel-like factor 11 (KLF11) is a key regulator of MDD; the expression of KLF11 increases by 44% in the post-mortem cerebral cortex of patients with MDD compared with healthy subjects [59]. KLF9, a direct glucocorticoid receptor target gene induced by stress, mediates the action of glucocorticoids on brain gene expression and neuronal structure [60]. Zinc finger protein 580 (ZNF580) regulates vascular endothelial proliferation and migration [61]. Zinc finger protein 24 (ZNF24) inhibits the platelet-derived growth factor receptor beta (PDGFR-β), thereby inhibiting the progression of atherosclerosis.
Comorbidity analysis suggested that MDD-AMI may be complicated by cardiovascular diseases such as preeclampsia, myocarditis, cardiomyopathy, coronary artery diseases, orthopedic diseases such as osteoporosis and bone resorption disease, pancreatic diseases such as pancreatitis, and various other diseases such as renal failure, tuberculosis, and uveitis. MDD accelerates aging and increases the incidence of cardiovascular diseases and osteoporosis [62]. MDD is seven times more prevalent in patients with pancreatic cancer than in the general population [63].
No drugs are available for MDD-AMI treatment, and new drug development is costly and time-consuming. Therefore, bioinformatics approaches to find drugs that target hub genes could greatly improve efficiency and reduce costs. We suggest that hydrocortisone, simvastatin, and estradiol might be effective in treating MDD-AMI. The dysregulation of the hypothalamic-pituitary-adrenal axis and abnormal levels of cortisol secretion leads to shorter telomeres and reduced stress capacity in patients with MDD [64]. Therefore, hydrocortisone may improve the symptoms of patients with MDD-AMI. Because inflammation may lead to depression, the anti-inflammatory drug simvastatin may effectively treat AMI and MDD, thereby exhibiting anti-atherosclerotic and antidepressant roles [65]. Estradiol activates stress circuits in the bilateral amygdala, hippocampus, and hypothalamus. Estradiol regulation is low in women with MDD resulting in improved MDD in women [66].
This study has certain limitations. GSE98793 and GSE66360 are the largest available datasets for MDD and AMI, however, their sample sizes are still relatively small. Therefore, further mining experiments will require larger sample sizes. Additionally, we lacked data on patients with MDD-AMI and relevant gene sets. Further validation is needed for the diagnostic markers identified in this study.
Conclusions
The pathogenesis of AMI combined with MDD may be related to the regulation of transcription factors and the modulation of immunity and inflammation by genes common to MDD and AMI. Bioinformatics analysis identified 27 genes common to MDD and AMI. Eight critical genes and biomarkers (TLR2, HP, ICAM1, LCN2, LTF, VCAN, S100A9, and NFKBIA) were identified, and a TF-gene regulatory network was constructed to find relevant transcription factors. Complications related to MDD and AMI and potential treatment drugs were identified, providing new information for the clinical diagnosis and treatment of MDD complicated with AMI. Through dataset validation, we identified TLR2 and VCAN as possible biomarkers of MDD complicated with AMI.
Acknowledgements
We thank the authors of the GSE98793, GSE66360, GSE38206 and GSE60993 datasets for their contributions. We thank Bullet Edits Limited for the linguistic editing and proofreading of the manuscript. This work was supported by the Natural Science Foundation of Shandong Province (ZR2020QH306); Shandong Province’s Traditional Chinese Medicine Science and Technology Project (2021M144); Traditional Chinese Medicine Science and Technology Project of Shandong Province (2020M002); The Construction Project of National Famous Old Chinese Medicine Expert Inheritance Studio of Ding Yuanqing (Approval document No.: National Traditional Chinese Medicine Expert Education Letter No. 75 (2022)).
Disclosure of conflict of interest
None.
References
- 1.Lepine JP, Briley M. The increasing burden of depression. Neuropsychiatr Dis Treat. 2011;7:3–7. doi: 10.2147/NDT.S19617. [DOI] [PMC free article] [PubMed] [Google Scholar]
- 2.Nichols M, Townsend N, Scarborough P, Rayner M. Cardiovascular disease in Europe 2014: epidemiological update. Eur Heart J. 2014;35:2929. doi: 10.1093/eurheartj/ehu378. [DOI] [PubMed] [Google Scholar]
- 3.Nemeroff CB, Goldschmidt-Clermont PJ. Heartache and heartbreak-the link between depression and cardiovascular disease. Nat Rev Cardiol. 2012;9:526–539. doi: 10.1038/nrcardio.2012.91. [DOI] [PubMed] [Google Scholar]
- 4.Meijer A, Conradi HJ, Bos EH, Thombs BD, van Melle JP, de Jonge P. Prognostic association of depression following myocardial infarction with mortality and cardiovascular events: a meta-analysis of 25 years of research. Gen Hosp Psychiatry. 2011;33:203–216. doi: 10.1016/j.genhosppsych.2011.02.007. [DOI] [PubMed] [Google Scholar]
- 5.Liblik K, Mulvagh SL, Hindmarch CCT, Alavi N, Johri AM. Depression and anxiety following acute myocardial infarction in women. Trends Cardiovasc Med. 2022;32:341–347. doi: 10.1016/j.tcm.2021.07.005. [DOI] [PubMed] [Google Scholar]
- 6.Kala P, Hudakova N, Jurajda M, Kasparek T, Ustohal L, Parenica J, Sebo M, Holicka M, Kanovsky J. Depression and anxiety after acute myocardial infarction treated by primary PCI. PLoS One. 2016;11:e0152367. doi: 10.1371/journal.pone.0152367. [DOI] [PMC free article] [PubMed] [Google Scholar]
- 7.Lown B. Sudden cardiac death: biobehavioral perspective. Circulation. 1987;76:I186–I196. [PubMed] [Google Scholar]
- 8.Nair GV, Gurbel PA, O’Connor CM, Gattis WA, Murugesan SR, Serebruany VL. Depression, coronary events, platelet inhibition, and serotonin reuptake inhibitors. Am J Cardiol. 1999;84:321–3. A8. doi: 10.1016/s0002-9149(99)00284-2. [DOI] [PubMed] [Google Scholar]
- 9.Beurel E, Toups M, Nemeroff CB. The bidirectional relationship of depression and inflammation: double trouble. Neuron. 2020;107:234–256. doi: 10.1016/j.neuron.2020.06.002. [DOI] [PMC free article] [PubMed] [Google Scholar]
- 10.Maes M, Yirmyia R, Noraberg J, Brene S, Hibbeln J, Perini G, Kubera M, Bob P, Lerer B, Maj M. The inflammatory & neurodegenerative (I&ND) hypothesis of depression: leads for future research and new drug developments in depression. Metab Brain Dis. 2009;24:27–53. doi: 10.1007/s11011-008-9118-1. [DOI] [PubMed] [Google Scholar]
- 11.Liu H, Luiten PG, Eisel UL, Dejongste MJ, Schoemaker RG. Depression after myocardial infarction: TNF-α-induced alterations of the blood-brain barrier and its putative therapeutic implications. Neurosci Biobehav Rev. 2013;37:561–572. doi: 10.1016/j.neubiorev.2013.02.004. [DOI] [PubMed] [Google Scholar]
- 12.Howard DM, Adams MJ, Shirali M, Clarke TK, Marioni RE, Davies G, Coleman JRI, Alloza C, Shen X, Barbu MC, Wigmore EM, Gibson J, Hagenaars SP, Lewis CM, Ward J, Smith DJ, Sullivan PF, Haley CS, Breen G, Deary IJ, McIntosh AM. Genome-wide association study of depression phenotypes in UK Biobank identifies variants in excitatory synaptic pathways. Nat Commun. 2018;9:1470. doi: 10.1038/s41467-018-05310-5. [DOI] [PMC free article] [PubMed] [Google Scholar]
- 13.He S, Deng Z, Li Z, Gao W, Zeng D, Shi Y, Zhao N, Xu F, Li T, Li H, Peng D. Signatures of 4 autophagy-related genes as diagnostic markers of MDD and their correlation with immune infiltration. J Affect Disord. 2021;295:11–20. doi: 10.1016/j.jad.2021.08.005. [DOI] [PubMed] [Google Scholar]
- 14.Zhao E, Xie H, Zhang Y. Predicting diagnostic gene biomarkers associated with immune infiltration in patients with acute myocardial infarction. Front Cardiovasc Med. 2020;7:586871. doi: 10.3389/fcvm.2020.586871. [DOI] [PMC free article] [PubMed] [Google Scholar]
- 15.Franco M, Vivo JM. Cluster analysis of microarray data. Methods Mol Biol. 2019;1986:153–183. doi: 10.1007/978-1-4939-9442-7_7. [DOI] [PubMed] [Google Scholar]
- 16.Coordinators NR. Database resources of the national center for biotechnology information. Nucleic Acids Res. 2016;44:D7–19. doi: 10.1093/nar/gkv1290. [DOI] [PMC free article] [PubMed] [Google Scholar]
- 17.Leday GGR, Vertes PE, Richardson S, Greene JR, Regan T, Khan S, Henderson R, Freeman TC, Pariante CM, Harrison NA MRC Immunopsychiatry Consortium. Perry VH, Drevets WC, Wittenberg GM, Bullmore ET. Replicable and coupled changes in innate and adaptive immune gene expression in two case-control studies of blood microarrays in major depressive disorder. Biol Psychiatry. 2018;83:70–80. doi: 10.1016/j.biopsych.2017.01.021. [DOI] [PMC free article] [PubMed] [Google Scholar]
- 18.Muse ED, Kramer ER, Wang H, Barrett P, Parviz F, Novotny MA, Lasken RS, Jatkoe TA, Oliveira G, Peng H, Lu J, Connelly MC, Schilling K, Rao C, Torkamani A, Topol EJ. A whole blood molecular signature for acute myocardial infarction. Sci Rep. 2017;7:12268. doi: 10.1038/s41598-017-12166-0. [DOI] [PMC free article] [PubMed] [Google Scholar]
- 19.Ritchie ME, Phipson B, Wu D, Hu Y, Law CW, Shi W, Smyth GK. limma powers differential expression analyses for RNA-sequencing and microarray studies. Nucleic Acids Res. 2015;43:e47. doi: 10.1093/nar/gkv007. [DOI] [PMC free article] [PubMed] [Google Scholar]
- 20.Langfelder P, Horvath S. WGCNA: an R package for weighted correlation network analysis. BMC Bioinformatics. 2008;9:559. doi: 10.1186/1471-2105-9-559. [DOI] [PMC free article] [PubMed] [Google Scholar]
- 21.Subramanian A, Tamayo P, Mootha VK, Mukherjee S, Ebert BL, Gillette MA, Paulovich A, Pomeroy SL, Golub TR, Lander ES, Mesirov JP. Gene set enrichment analysis: a knowledge-based approach for interpreting genome-wide expression profiles. Proc Natl Acad Sci U S A. 2005;102:15545–15550. doi: 10.1073/pnas.0506580102. [DOI] [PMC free article] [PubMed] [Google Scholar]
- 22.Doms A, Schroeder M. GoPubMed: exploring PubMed with the gene ontology. Nucleic Acids Res. 2005;33:W783–786. doi: 10.1093/nar/gki470. [DOI] [PMC free article] [PubMed] [Google Scholar]
- 23.Kanehisa M, Goto S. KEGG: Kyoto encyclopedia of genes and genomes. Nucleic Acids Res. 2000;28:27–30. doi: 10.1093/nar/28.1.27. [DOI] [PMC free article] [PubMed] [Google Scholar]
- 24.Yu G, Wang LG, Han Y, He QY. clusterProfiler: an R package for comparing biological themes among gene clusters. OMICS. 2012;16:284–287. doi: 10.1089/omi.2011.0118. [DOI] [PMC free article] [PubMed] [Google Scholar]
- 25.Yu G, Wang LG, Yan GR, He QY. DOSE: an R/Bioconductor package for disease ontology semantic and enrichment analysis. Bioinformatics. 2015;31:608–609. doi: 10.1093/bioinformatics/btu684. [DOI] [PubMed] [Google Scholar]
- 26.Ben-Hur A, Noble WS. Kernel methods for predicting protein-protein interactions. Bioinformatics. 2005;21(Suppl 1):i38–46. doi: 10.1093/bioinformatics/bti1016. [DOI] [PubMed] [Google Scholar]
- 27.Ewing RM, Chu P, Elisma F, Li H, Taylor P, Climie S, McBroom-Cerajewski L, Robinson MD, O’Connor L, Li M, Taylor R, Dharsee M, Ho Y, Heilbut A, Moore L, Zhang S, Ornatsky O, Bukhman YV, Ethier M, Sheng Y, Vasilescu J, Abu-Farha M, Lambert JP, Duewel HS, Stewart II, Kuehl B, Hogue K, Colwill K, Gladwish K, Muskat B, Kinach R, Adams SL, Moran MF, Morin GB, Topaloglou T, Figeys D. Large-scale mapping of human protein-protein interactions by mass spectrometry. Mol Syst Biol. 2007;3:89. doi: 10.1038/msb4100134. [DOI] [PMC free article] [PubMed] [Google Scholar]
- 28.Szklarczyk D, Gable AL, Lyon D, Junge A, Wyder S, Huerta-Cepas J, Simonovic M, Doncheva NT, Morris JH, Bork P, Jensen LJ, Mering CV. STRING v11: protein-protein association networks with increased coverage, supporting functional discovery in genome-wide experimental datasets. Nucleic Acids Res. 2019;47:D607–D613. doi: 10.1093/nar/gky1131. [DOI] [PMC free article] [PubMed] [Google Scholar]
- 29.Shi W, Zhang X, Xu C, Pang R, Fan Z, Wan X, Jiang Z, Li H, Li Z, Zhang H. Identification of hub genes and pathways associated with oxidative stress of cartilage in osteonecrosis of femoral head using bioinformatics analysis. Cartilage. 2022;13:19476035221074000. doi: 10.1177/19476035221074000. [DOI] [PMC free article] [PubMed] [Google Scholar]
- 30.Soto LF, Li Z, Santoso CS, Berenson A, Ho I, Shen VX, Yuan S, Fuxman Bass JI. Compendium of human transcription factor effector domains. Mol Cell. 2022;82:514–526. doi: 10.1016/j.molcel.2021.11.007. [DOI] [PMC free article] [PubMed] [Google Scholar]
- 31.Zhou G, Soufan O, Ewald J, Hancock REW, Basu N, Xia J. NetworkAnalyst 3.0: a visual analytics platform for comprehensive gene expression profiling and meta-analysis. Nucleic Acids Res. 2019;47:W234–W241. doi: 10.1093/nar/gkz240. [DOI] [PMC free article] [PubMed] [Google Scholar]
- 32.Yoo M, Shin J, Kim J, Ryall KA, Lee K, Lee S, Jeon M, Kang J, Tan AC. DSigDB: drug signatures database for gene set analysis. Bioinformatics. 2015;31:3069–3071. doi: 10.1093/bioinformatics/btv313. [DOI] [PMC free article] [PubMed] [Google Scholar]
- 33.Belzeaux R, Bergon A, Jeanjean V, Loriod B, Formisano-Treziny C, Verrier L, Loundou A, Baumstarck-Barrau K, Boyer L, Gall V, Gabert J, Nguyen C, Azorin JM, Naudin J, Ibrahim EC. Responder and nonresponder patients exhibit different peripheral transcriptional signatures during major depressive episode. Transl Psychiatry. 2012;2:e185. doi: 10.1038/tp.2012.112. [DOI] [PMC free article] [PubMed] [Google Scholar]
- 34.Park HJ, Noh JH, Eun JW, Koh YS, Seo SM, Park WS, Lee JY, Chang K, Seung KB, Kim PJ, Nam SW. Assessment and diagnostic relevance of novel serum biomarkers for early decision of ST-elevation myocardial infarction. Oncotarget. 2015;6:12970–12983. doi: 10.18632/oncotarget.4001. [DOI] [PMC free article] [PubMed] [Google Scholar]
- 35.Gao CH, Yu G, Cai P. ggVennDiagram: an intuitive, easy-to-use, and highly customizable R package to generate venn diagram. Front Genet. 2021;12:706907. doi: 10.3389/fgene.2021.706907. [DOI] [PMC free article] [PubMed] [Google Scholar]
- 36.Stapelberg NJ, Neumann DL, Shum DH, McConnell H, Hamilton-Craig I. A topographical map of the causal network of mechanisms underlying the relationship between major depressive disorder and coronary heart disease. Aust N Z J Psychiatry. 2011;45:351–369. doi: 10.3109/00048674.2011.570427. [DOI] [PubMed] [Google Scholar]
- 37.Thombs BD, Ziegelstein RC, Parakh K, Stewart DE, Abbey SE, Grace SL. Probit structural equation regression model: general depressive symptoms predicted post-myocardial infarction mortality after controlling for somatic symptoms of depression. J Clin Epidemiol. 2008;61:832–839. doi: 10.1016/j.jclinepi.2007.09.008. [DOI] [PubMed] [Google Scholar]
- 38.Gutteridge JM. The antioxidant activity of haptoglobin towards haemoglobin-stimulated lipid peroxidation. Biochimica Et Biophysica Acta. 1987;917:219–223. doi: 10.1016/0005-2760(87)90125-1. [DOI] [PubMed] [Google Scholar]
- 39.Pontone G, Andreini D, Guaricci AI, Guglielmo M, Baggiano A, Muscogiuri G, Fusini L, Fazzari F, Berzovini C, Pasquini A, Mushtaq S, Conte E, Cosentino N, Rabbat MG, Marenzi G, Bartorelli AL, Pepi M, Tremoli E, Banfi C. Association between haptoglobin phenotype and microvascular obstruction in patients with STEMI: a cardiac magnetic resonance study. JACC Cardiovasc Imaging. 2019;12:1007–1017. doi: 10.1016/j.jcmg.2018.03.004. [DOI] [PubMed] [Google Scholar]
- 40.Maes M, Delanghe J, Scharpé S, Meltzer HY, Cosyns P, Suy E, Bosmans E. Haptoglobin phenotypes and gene frequencies in unipolar major depression. Am J Psychiatry. 1994;151:112–116. doi: 10.1176/ajp.151.1.112. [DOI] [PubMed] [Google Scholar]
- 41.Halabian R, Tehrani HA, Jahanian-Najafabadi A, Habibi Roudkenar M. Lipocalin-2-mediated upregulation of various antioxidants and growth factors protects bone marrow-derived mesenchymal stem cells against unfavorable microenvironments. Cell Stress Chaperones. 2013;18:785–800. doi: 10.1007/s12192-013-0430-2. [DOI] [PMC free article] [PubMed] [Google Scholar]
- 42.Alijani-Ghazyani Z, Sabzevari R, Roushandeh AM, Jahanian-Najafabadi A, Amiri F, Roudkenar MH. Transplantation of umbilical cord-derived mesenchymal stem cells overexpressing lipocalin 2 ameliorates ischemia-induced injury and reduces apoptotic death in a rat acute myocardial infarction model. Stem Cell Rev Rep. 2020;16:968–978. doi: 10.1007/s12015-020-10007-8. [DOI] [PubMed] [Google Scholar]
- 43.Gouweleeuw L, Naude PJ, Rots M, DeJongste MJ, Eisel UL, Schoemaker RG. The role of neutrophil gelatinase associated lipocalin (NGAL) as biological constituent linking depression and cardiovascular disease. Brain Behav Immun. 2015;46:23–32. doi: 10.1016/j.bbi.2014.12.026. [DOI] [PubMed] [Google Scholar]
- 44.Boccardi V, Rizzo MR, Marfella R, Papa M, Esposito A, Portoghese M, Paolisso G, Barbieri M. -94 ins/del ATTG NFKB1 gene variant is associated with lower susceptibility to myocardial infarction. Nutr Metab Cardiovasc Dis. 2011;21:679–684. doi: 10.1016/j.numecd.2009.12.012. [DOI] [PubMed] [Google Scholar]
- 45.Szklarczyk K, Korostynski M, Golda S, Solecki W, Przewlocki R. Genotype-dependent consequences of traumatic stress in four inbred mouse strains. Genes Brain Behav. 2012;11:977–985. doi: 10.1111/j.1601-183X.2012.00850.x. [DOI] [PubMed] [Google Scholar]
- 46.Zeng D, He S, Ma C, Wen Y, Song W, Xu Q, Zhao N, Wang Q, Yu Y, Shen Y, Huang J, Li H. Network-based approach to identify molecular signatures in the brains of depressed suicides. Psychiatry Res. 2020;294:113513. doi: 10.1016/j.psychres.2020.113513. [DOI] [PubMed] [Google Scholar]
- 47.Wang Y, Zhang X, Duan M, Zhang C, Wang K, Feng L, Song L, Wu S, Chen X. Identification of potential biomarkers associated with acute myocardial infarction by weighted gene coexpression network analysis. Oxid Med Cell Longev. 2021;2021:5553811. doi: 10.1155/2021/5553811. [DOI] [PMC free article] [PubMed] [Google Scholar]
- 48.Li Y, Chen B, Yang X, Zhang C, Jiao Y, Li P, Liu Y, Li Z, Qiao B, Bond Lau W, Ma XL, Du J. S100a8/a9 signaling causes mitochondrial dysfunction and cardiomyocyte death in response to ischemic/reperfusion injury. Circulation. 2019;140:751–764. doi: 10.1161/CIRCULATIONAHA.118.039262. [DOI] [PubMed] [Google Scholar]
- 49.Marinković G, Grauen Larsen H, Yndigegn T, Szabo IA, Mares RG, de Camp L, Weiland M, Tomas L, Goncalves I, Nilsson J, Jovinge S, Schiopu A. Inhibition of pro-inflammatory myeloid cell responses by short-term S100A9 blockade improves cardiac function after myocardial infarction. Eur Heart J. 2019;40:2713–2723. doi: 10.1093/eurheartj/ehz461. [DOI] [PubMed] [Google Scholar]
- 50.Liew FY, Xu D, Brint EK, O’Neill LA. Negative regulation of toll-like receptor-mediated immune responses. Nat Rev Immunol. 2005;5:446–458. doi: 10.1038/nri1630. [DOI] [PubMed] [Google Scholar]
- 51.Gao HK, Yin Z, Zhang RQ, Zhang J, Gao F, Wang HC. GSK-3beta inhibitor modulates TLR2/NF-kappaB signaling following myocardial ischemia-reperfusion. Inflamm Res. 2009;58:377–383. doi: 10.1007/s00011-009-0002-1. [DOI] [PubMed] [Google Scholar]
- 52.Keri S, Szabo C, Kelemen O. Expression of toll-like receptors in peripheral blood mononuclear cells and response to cognitive-behavioral therapy in major depressive disorder. Brain Behav Immun. 2014;40:235–243. doi: 10.1016/j.bbi.2014.03.020. [DOI] [PubMed] [Google Scholar]
- 53.Wight TN. Versican: a versatile extracellular matrix proteoglycan in cell biology. Curr Opin Cell Biol. 2002;14:617–623. doi: 10.1016/s0955-0674(02)00375-7. [DOI] [PubMed] [Google Scholar]
- 54.Toeda K, Nakamura K, Hirohata S, Hatipoglu OF, Demircan K, Yamawaki H, Ogawa H, Kusachi S, Shiratori Y, Ninomiya Y. Versican is induced in infiltrating monocytes in myocardial infarction. Mol Cell Biochem. 2005;280:47–56. doi: 10.1007/s11010-005-8051-4. [DOI] [PubMed] [Google Scholar]
- 55.Rutten-Jacobs LCA, Tozer DJ, Duering M, Malik R, Dichgans M, Markus HS, Traylor M. Genetic study of white matter integrity in UK Biobank (N = 8448) and the overlap with stroke, depression, and dementia. Stroke. 2018;49:1340–1347. doi: 10.1161/STROKEAHA.118.020811. [DOI] [PMC free article] [PubMed] [Google Scholar]
- 56.Nibbering PH, Ravensbergen E, Welling MM, van Berkel LA, van Berkel PH, Pauwels EK, Nuijens JH. Human lactoferrin and peptides derived from its N terminus are highly effective against infections with antibiotic-resistant bacteria. Infect Immun. 2001;69:1469–1476. doi: 10.1128/IAI.69.3.1469-1476.2001. [DOI] [PMC free article] [PubMed] [Google Scholar]
- 57.Pluskota E, D’Souza SE. Fibrinogen interactions with ICAM-1 (CD54) regulate endothelial cell survival. Eur J Biochem. 2000;267:4693–4704. doi: 10.1046/j.1432-1327.2000.01520.x. [DOI] [PubMed] [Google Scholar]
- 58.Scholer A, Hugues S, Boissonnas A, Fetler L, Amigorena S. Intercellular adhesion molecule-1-dependent stable interactions between T cells and dendritic cells determine CD8+ T cell memory. Immunity. 2008;28:258–270. doi: 10.1016/j.immuni.2007.12.016. [DOI] [PubMed] [Google Scholar]
- 59.Harris S, Johnson S, Duncan JW, Udemgba C, Meyer JH, Albert PR, Lomberk G, Urrutia R, Ou XM, Stockmeier CA, Wang JM. Evidence revealing deregulation of the KLF11-MAO A pathway in association with chronic stress and depressive disorders. Neuropsychopharmacology. 2015;40:1373–1382. doi: 10.1038/npp.2014.321. [DOI] [PMC free article] [PubMed] [Google Scholar]
- 60.Bonett RM, Hu F, Bagamasbad P, Denver RJ. Stressor and glucocorticoid-dependent induction of the immediate early gene Kruppel-like factor 9: implications for neural development and plasticity. Endocrinology. 2009;150:1757–1765. doi: 10.1210/en.2008-1441. [DOI] [PMC free article] [PubMed] [Google Scholar]
- 61.Shi C, Yao F, Li Q, Khan M, Ren X, Feng Y, Huang J, Zhang W. Regulation of the endothelialization by human vascular endothelial cells by ZNF580 gene complexed with biodegradable microparticles. Biomaterials. 2014;35:7133–7145. doi: 10.1016/j.biomaterials.2014.04.110. [DOI] [PubMed] [Google Scholar]
- 62.Wolkowitz OM, Reus VI, Mellon SH. Of sound mind and body: depression, disease, and accelerated aging. Dialogues Clin Neurosci. 2011;13:25–39. doi: 10.31887/DCNS.2011.13.1/owolkowitz. [DOI] [PMC free article] [PubMed] [Google Scholar]
- 63.Barnes AF, Yeo TP, Leiby B, Kay A, Winter JM. Pancreatic cancer-associated depression: a case report and review of the literature. Pancreas. 2018;47:1065–1077. doi: 10.1097/MPA.0000000000001148. [DOI] [PubMed] [Google Scholar]
- 64.Gotlib IH, LeMoult J, Colich NL, Foland-Ross LC, Hallmayer J, Joormann J, Lin J, Wolkowitz OM. Telomere length and cortisol reactivity in children of depressed mothers. Mol Psychiatry. 2015;20:615–620. doi: 10.1038/mp.2014.119. [DOI] [PMC free article] [PubMed] [Google Scholar]
- 65.Rahola JG. Somatic drugs for psychiatric diseases: aspirin or simvastatin for depression? Curr Neuropharmacol. 2012;10:139–158. doi: 10.2174/157015912800604533. [DOI] [PMC free article] [PubMed] [Google Scholar]
- 66.Jacobs EG, Holsen LM, Lancaster K, Makris N, Whitfield-Gabrieli S, Remington A, Weiss B, Buka S, Klibanski A, Goldstein JM. 17beta-estradiol differentially regulates stress circuitry activity in healthy and depressed women. Neuropsychopharmacology. 2015;40:566–576. doi: 10.1038/npp.2014.203. [DOI] [PMC free article] [PubMed] [Google Scholar]


