Abstract
Background
The extracellular matrix (ECM) plays a vital role in progression, expansion, and prognosis of malignancies. In this study, we aimed to explore a novel ECM-based prognostic model for patients with colon cancer (CC).
Methods
ECM-related genes were obtained from Molecular Signatures database. Differential expression analysis was performed using the CC dataset from The Cancer Genome Atlas (TCGA) database. Four ECM-related genes related to overall survival were identified using the Cox regression and LASSO analysis. Then an ECM-related signature was developed and verified in three independent CC cohorts (GSE33882, GSE39582 and GSE29621) from the Gene Expression Omnibus (GEO). A prognostic nomogram was developed incorporating the ECM-related gene signature with clinical risk factors. CIBERSORT was used to explore the immune cell infiltration level. Human Protein Atlas (HPA) database was utilized to validate the expression levels of identified prognostic ECM genes.
Results
Four ECM-related genes (CXCL13, CXCL14, SFRP5 and THBS4) were identified to develop an ECM-based gene signature and demarcated CC patients into the high- and low-risk groups. In training and validation datasets, patients in the low-risk group had better overall survival outcomes than those in the high-risk group (log-rank P<0.001). In addition, ECM-related signature was significantly associated with consensus molecular subtype 4 (CMS4) as well as other known clinical risk factors such as a higher Tumor, Nodal Involvement, Metastasis (TNM) stage. Moreover, the risk score derived from the ECM-based gene signature could be utilized as an independent prognostic factor for CC patients. A nomogram including the ECM-related gene signature, age and stage was developed to serve clinical practice. CIBERSORT analysis showed immune cell infiltration was different between high- and low-risk groups. The immunohistochemical results derived from HPA indicated differential expression of prognosis-related ECM genes in CC and normal tissues.
Conclusions
In the present study, a novel risk model based on ECM-signature could effectively reflect individual risk classification and provide potential therapeutic targets for CC patients. Moreover, the prognostic nomogram may help predict individualized survival.
Keywords: Prognosis, colon cancer (CC), extracellular matrix (ECM), the cancer genome atlas, Gene Expression Omnibus (GEO)
Highlight box.
Key findings
• A signature consisting of four extracellular matrix (ECM) genes (CXCL13, CXCL14, SFRP5, and THBS4) was selected to construct a prognostic model in TCGA colon cancer cohort and validated in three independent cohorts.
What is known and what is new?
• Cancer-associated ECM plays a vital role in progression, expansion, and prognosis of various malignancies.
• This study identified a novel ECM-related gene signature in colon cancer to provide clues for survival and immunotherapy.
What is the implication, and what should change now?
• This study highlights the prognostic value of ECM-related genes in colon cancer and reveals an ECM-related prognostic signature to further improve the prognosis prediction of patients with colon cancer. Our findings provide a basis for better understanding the vital roles of these genes in immune microenvironment organization and indicate the potential clinical implications of these genes in colon cancer.
Introduction
According to the global cancer statistics, colon cancer (CC) is the third most diagnosed malignancy and the fourth leading cause of cancer-related death worldwide (1). There are more than 2.2 million new CC cases and 1.1 million CC-related deaths predicted by 2030 (2). In recent years, diverse novel surgeries and specific treatments significantly reduce the mortality of CC patients than before (3,4). However, in terms of the insidious onset and invasive rapid-progression, patients with CC were usually diagnosed at advanced stages, which thereby could result in missing the optimal therapeutic opportunity (5-7).
Due to the high clinical heterogeneity of CC, the conventional clinical features including the current American Joint Committee on Cancer (AJCC) staging, Tumor, Nodal Involvement, Metastasis (TNM) staging, and grade are insufficient for accurately predicting individualized prognosis (8-11). Therefore, it is essential to establish novel and robust prognostic biomarker signatures to identify the molecular changes that can reliably estimate clinical outcomes of CC patients, which would have tremendous value of guiding appropriate individualized clinical managements and treatments for CC patients. Much effort has been devoted to determining how the changes of distinct gene signatures such as ferroptosis-related, RNA binding proteins (RBPs)-related, immune-related gene signatures can be utilized to predict CC prognosis recently (12-14). The extracellular matrix (ECM) is composed of complex network of non-cellular components (CCs) of tissue, including glycoproteins, collagens, and proteoglycans, that provides both essential structural and biomedical supports for its cellular constituents, which can regulate the development and maintain tissue homeostasis (15-18). As a major component of the tumor microenvironment, previous studies have reflected the important roles of the ECM in regulating cell proliferation, migration, and apoptosis (17,19,20). Therefore, the cancer-associated ECM is recognized as an important feature of a tumor. Moreover, cancer-associating ECM actively contributes to the histopathology and behavior of tumors (21,22). For instance, Slattery et al. found that expression of matrix remodeling genes such as matrix metalloproteinases (MMPs) predicts a poor prognosis for breast cancer patients (23). Boyd et al. identified increased mammographic density associating with elevated collagen deposition, correlates with an higher risk of developing breast cancer (24). In CC, a study from Stenzinger and colleagues showed that high extracellular matrix metalloproteinases inducer (EMMPRIN) expression was strongly and independently associated with poor prognosis (25). Recently, the consensus molecular subtypes (CMSs) established by Guinney and colleagues were considered the most reliable classification system available for CC. This system divides CC into four subtypes (CMS1-CMS4) with distinguishing features. Among them, CMS4, the mesenchymal type, shows poor prognosis. It is characterized by the activation of transforming growth factor-β (TGF-β) signaling, angiogenesis, and ECM remodeling pathways (26). Although this classification system has been recognized as a critical step forward in distinguishing subtypes of CC, the utilization of this approach for individual patient prognostication has been hampered as analysis of thousands of genes is required. Therefore, simpler approaches such as gene signature-based prognostic risk models are urgently needed to aid in clinical decision making. In view of the association between ECM remodeling pathway activation and the poor outcomes of CMS4 subtype in CC patients, herein, we focus our efforts on developing an ECM-based prognostic signature for patient prognosis.
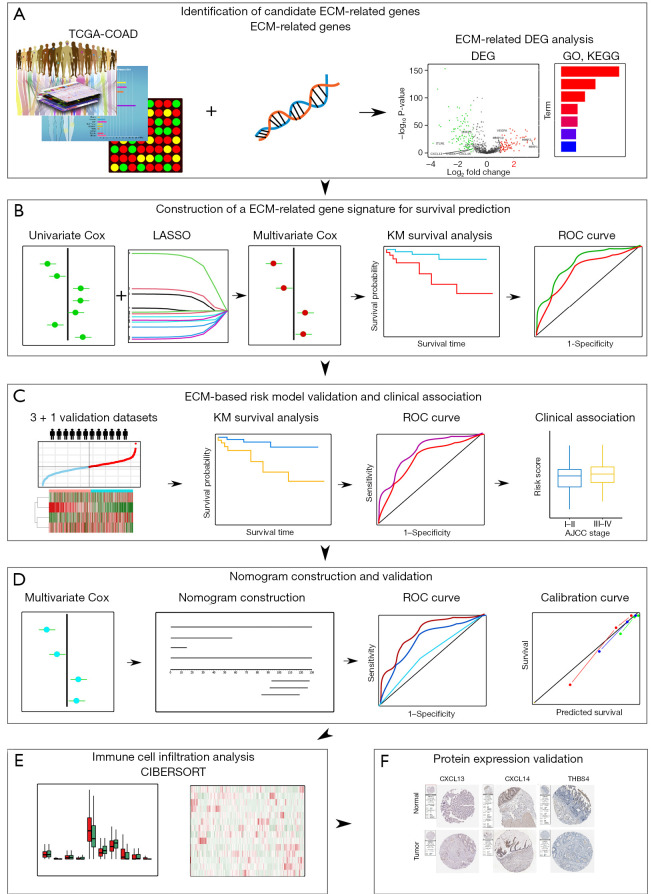
In this study, we mainly focused on investigating the prognostic implications of ECM-related genes in CC by analyzing publicly available datasets including The Cancer Genome Atlas (TCGA) and Gene Expression Omnibus (GEO). The pipeline of the study is illustrated in Figure 1. Firstly, by taking advantage of differential expression analysis and univariate Cox regression analysis, twelve ECM-related genes with notable prognostic value in CC were identified. Next, a novel four genes ECM-based gene signature for risk stratification and overall survival prediction of CC was constructed by using LASSO-penalized multivariate Cox regression. Then the association between the risk signature and clinical features was studied. Importantly, we also validated the prognostic performance of the ECM-based individualized signature in another independent dataset. Furthermore, a novel nomogram based on ECM-related gene signature and independent clinical factors was developed to predict 1-, 3- and 5-year overall survival probability for patients with CC. We also compared the immune cell infiltration level of high- and low-risk groups in both training and validation cohorts. Finally, the Human Protein Atlas (HPA) database was utilized to verify the expression level of proteins. We present the following article in accordance with the TRIPOD reporting checklist (available at https://tcr.amegroups.com/article/view/10.21037/tcr-22-2036/rc).
Figure 1.
Schematic diagram of the ECM-related prognostic signature construction and characterization. (A) The differentially expressed ECM genes were identified in CC through differential expression analysis. (B) ECM-related gene signature was constructed using training cohort. (C) ECM-related risk model was validated in various validation cohorts. (D) A new nomogram was constructed and validated. (E) Immune cell infiltration was analyzed. (F) Protein expression validation using Human Protein Atlas. TCGA, The Cancer Genome Atlas; COAD, colon adenocarcinoma; ECM, extracellular matrix; DEG, differentially expressed gene; KEGG, Kyoto Encyclopedia of Genes and Genomes; GO, gene ontology; Lasso, least absolute shrinkage and selection operator; KM, Kaplan-Meier survival analysis; ROC, receiver-operating characteristic.
Methods
CC datasets and ECM-related genes
In order to develop an ECM-based prognostic prediction model for patients with CC, we downloaded the RNA-seq transcriptome data and associated clinical data of CC patients from the public database Cancer Genome Atlas (TCGA-COAD) (https://portal.gdc.cancer.gov/) and GEO database (https://www.ncbi.nlm.nih.gov/geo). COAD cohort (n=366) was used as training cohort, GSE38832 (n=119), GSE39582 (n=556), GSE29621 (n=65) and combined dataset (n=740) were used as validation cohorts (27). ECM-related genes were obtained from the Molecular Signatures Database (MSigDB, version 6.2, https://www.gsea-msigdb.org/gsea/msigdb). Briefly, we downloaded the gene list encoding ECM and ECM-associated proteins from MsigDB (https://cdn.amegroups.cn/static/public/tcr-22-2036-1.xlsx). The study was conducted in accordance with the Declaration of Helsinki (as revised in 2013).
Identification of differentially expressed genes (DEGs)
The “limma” R package for RNA-seq transcriptome data was employed to do differential expression analysis to identify DEGs between tumor and normal samples in the training COAD cohort (28). The genes that meet the defined criteria: |logFC| >1 and FDR P<0.05, were considered as DEGs.
Kyoto Encyclopedia of Genes and Genomes (KEGG) pathway and Gene Ontology (GO) enrichment analysis
We applied “clusterProfiler” package to perform GO enrichment and KEGG analysis for comprehensively analyzing the biological functions of differentially expressed ECM-related genes (29). GO analysis terms include cell component (CC), molecular function (MF) and biological process (BP). FDR P value <0.05 was a filter criteria.
Construction and verification of prediction model
Normalized RNA-seq data and clinical data of training cohort including overall survival time and overall survival status were utilized as the input of the univariate Cox regression analysis. The candidate DEGs with notable prognostic value were then identified based on the P value (P<0.05). Thereafter, to avoid overfitting the model, we employed “glmnet” package to do the least absolute shrinkage and selection operator (LASSO) Cox regression analysis (30) to further screen the prognostic genes. Cox proportional hazard regression was employed to determine the optimal prognostic genes of the model (31). The formula for the gene signature is as follows: risk score = Ʃ (βi * Exp.i) (i = the number of prognostic genes, βi represents the coefficient of gene i, and Exp.i represents expression level of gene i). Finally, CC patients were divided into high- and low-risk groups based on the median risk score of the patients in each dataset.
In order to evaluate the prognostic performance of the established ECM-related signature, Kaplan-Meier survival curve analyses was used to determine whether a significant difference in overall survival time was existed between high- and low-risk groups using the “survival” and “survminer” R packages (32,33). The log-rank test (P<0.05) was utilized to determine the statistic difference. Furthermore, the predictive power of the ECM-based prognostic signature was assessed using time-dependent receiver-operating characteristic (ROC) curve analysis with “timeROC” and “survival” R packages (33,34). In addition, the validation cohort was applied for confirming the prediction ability of the prediction model.
Nomogram development and validation
Based on the multivariate Cox proportional hazard regression analysis, the “rms” R package was utilized to build a nomogram for predicting the survival of COAD patients in 1, 3, 5 years by combining the ECM-related risk model and clinical factors of age and stage (35). Then we used calibration curves and time-dependent ROC to evaluate the predictive power of the developed nomogram.
Immune cell infiltration analysis
We estimated the immune cell infiltration level of both training and validation cohorts utilizing the online CIBERSORT tool. CIBERSORT is a widely used tool for characterizing the immune cell composition of different tissues through the gene expression profile (36).
Protein expression validation
Immunohistochemical staining images of the gene expression in both CC tissues and normal tissues were extracted from the HPA.
Statistical analysis
In this study, R (4.0.1) was performed for data analysis. If not specified, a two-sided P value or adjusted P value less than 0.05 was considered statistically significant.
Results
Identification of differentially expressed ECM-related genes
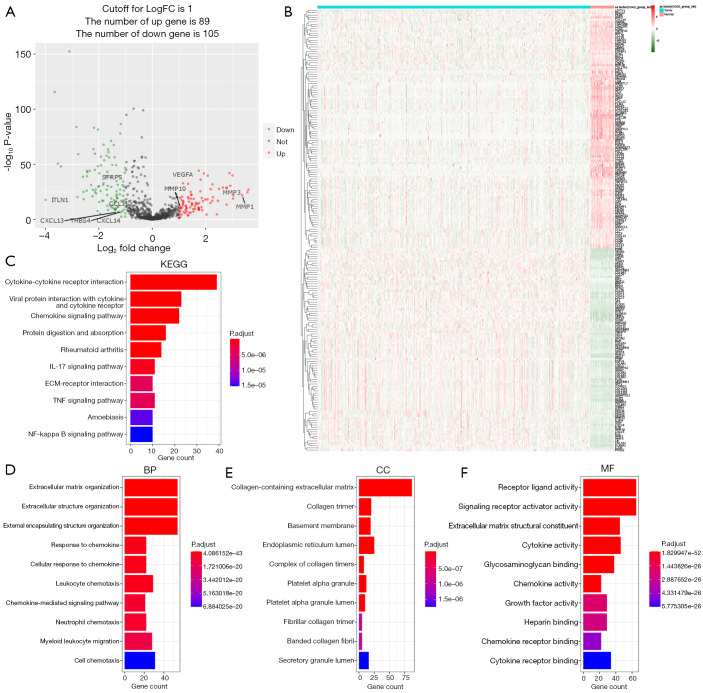
By analyzing RNA-seq data of 471 COAD samples and 41 normal colon tissues from the TCGA database, we first identified 1,026 ECM-related gene expression data. Then the “limma” R package was utilized to analyze the differentially expressed ECM-related genes between the tumor and normal samples. We followed (|logFC| >1 and FDR P value <0.05) as the criteria to obtain 89 up-regulated genes and 105 down-regulated ECM-related genes (Figure 2A,2B and https://cdn.amegroups.cn/static/public/tcr-22-2036-2.xlsx).
Figure 2.
Functional enrichment analysis of the identified differentially expressed ECM-related genes in TCGA-COAD cohort. (A) Volcano plot of identified differentially expressed ECM-related genes. Green dots represent 105 downregulated genes; red dots represent 89 upregulated genes. Venn diagram shows the intersection of differentially expressed genes and ECM-related genes. (B) Heatmap of identified differentially expressed ECM-related genes. Green represents downregulation, and red represents upregulation of genes. (C) Top 10 enriched KEGG pathways terms of differentially expressed ECM-related genes. (D-F) Top 10 enriched biological processes, molecular functions, cellular components terms of differentially expressed ECM-related genes. ECM, extracellular matrix; TCGA, The Cancer Genome Atlas; COAD, colon adenocarcinoma; KEGG, Kyoto Encyclopedia of Genes and Genomes; GO, gene ontology. BP, biological process; CC, cellular Component; MF, molecular function.
Functional enrichment analysis of differentially expressed ECM-related genes
To explore and better understand the functions and BPs of these identified differentially expressed ECM-related genes, we took advantage of KEGG analysis and GO analysis. KEGG analysis results showed that differentially expressed ECM-related genes mainly enriched in functional categories such as cytokine-cytokine receptor interaction, chemokine signaling pathway, IL-17 signaling pathway, ECM-receptor interaction, TNF and NF-kappa B signaling pathway (Figure 2C). In the GO analysis, differentially expressed ECM-related genes were mainly enriched in the BP including ECM organization, cellular response to chemokine, chemokine-mediated signaling pathway, leukocyte and neutrophil chemotaxis (Figure 2D). In terms of CC, the identified differentially expressed ECM-related genes were mainly related to collagen-containing ECM, collagen trimer and endoplasmic reticulum lumen (Figure 2E). In addition, MF analysis showed differentially expressed ECM-related genes enriched in receptor ligand activity and cytokine activity (Figure 2F).
Establishment of prognostic gene signature
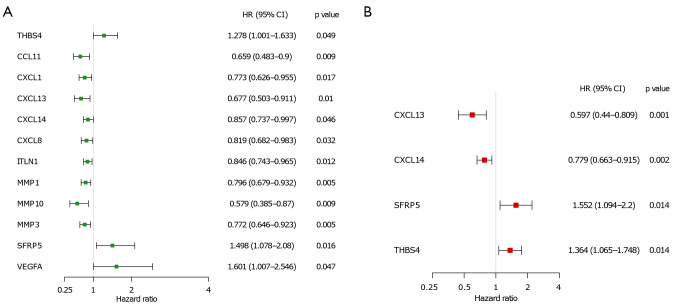
In order to comprehensively analyze the prognostic value of differentially expressed ECM-related genes in CC, we first performed univariate Cox regression analysis on them. The results showed that twelve ECM genes (CCL11, CXCL1, CXCL13, CXCL14, CXCL8, ITLN1, MMP1, MMP10, MMP3, SFRP5, THBS4, and VEGFA) were significantly related to the prognosis of CC patients with P value <0.05 (Figure 3A). Then, we conducted LASSO regression to avoid overfitting the model (Figure S1A,S1B). Eight ECM-related genes (CCL11, CXCL13, CXCL14, ITLN1, MMP1, MMP3, SFRP5, and THBS4) were selected as candidates for the next analysis according to the optimal value of the model. Subsequently, in order to evaluate their roles as independent prognostic factors, we performed multivariate Cox regression analysis on the eight candidate ECM-related. Finally, we identified 4 ECM-related genes (CXCL13, CXCL14, SFRP5 and THBS4) as potential prognostic signature (Figure 3B). The risk score was then calculated for each CC patient based on the following formula: -0.51575 * the expression levels of CXCL13 + (−0.24950) * the expression levels of CXCL14 + 0.43928 * the expression levels of SFRP5 + (−0.31070) * the expression level of THBS4.
Figure 3.
Development of ECM-based prognostic signature in TCGA cohort. (A) Univariate Cox regression analysis for identification of prognosis related ECM in TCGA-COAD cohort. (B) Multivariate Cox regression analysis for constructing model. ECM, extracellular matrix; TCGA, The Cancer Genome Atlas; COAD, colon adenocarcinoma; HR, hazard ratio; 95% CI, 95% confident interval.
Verification of accuracy of four ECM-related gene signature in CC
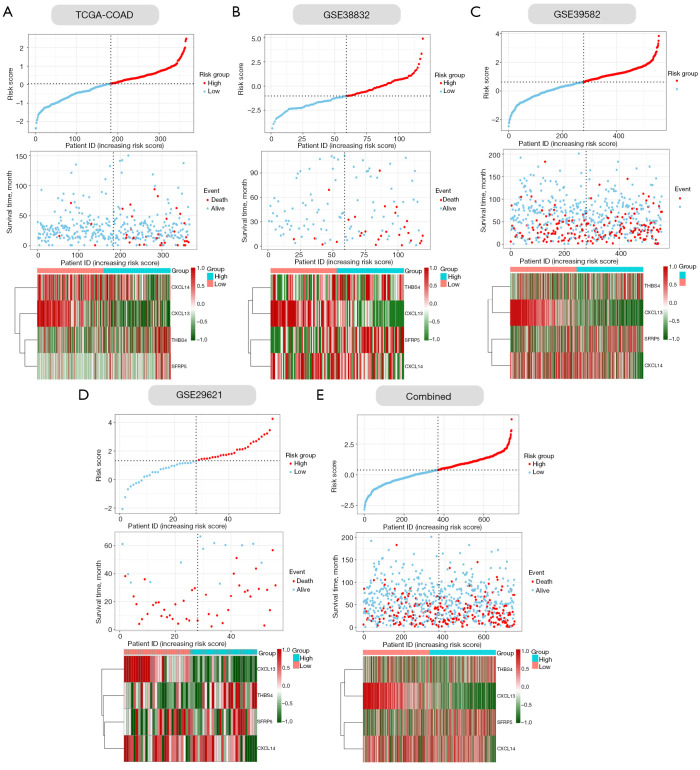
Next, we verified the accuracy of our four ECM-related genes signature model in the training cohort (COAD) and four validation cohorts (GSE33882, GSE39582, GSE29621 and their combination). The individual risk score of each CC patient was determined based on the ECM-related genes signature model. All CC patients were then divided into high- and low-risk group in the light of the median value of risk score of each cohort (Figure 4A-4E). Patients were ranked from low to high according to their risk scores, and we found the scatter plot indicated that the survival rate of low-risk patients was much higher than that of high-risk patients (Figure 4A-4E). In the scatter plots, red dots represent the dead patients, and blue dots represent the alive patients. The heat maps displayed the difference between expression levels of four ECM-related genes in high- and low-risk groups (Figure 4A-4E).
Figure 4.
The risk scores distribution plots, survival status plots, and heatmaps of four ECM genes in the training and validation cohorts. (A-E, upper panels) Distribution of risk scores based on the ECM-based prognostic signature in the COAD and validation cohorts. (A-E, middle panels) Survival status of CC patients with high- or low-risk scores in the COAD and validation cohorts. (A-E, lower panels) Heatmaps show the expression pattern of four ECM genes that constitute the prognostic signature in the COAD and validation cohorts (lower). ECM, extracellular matrix; TCGA, The Cancer Genome Atlas; COAD, colon adenocarcinoma.
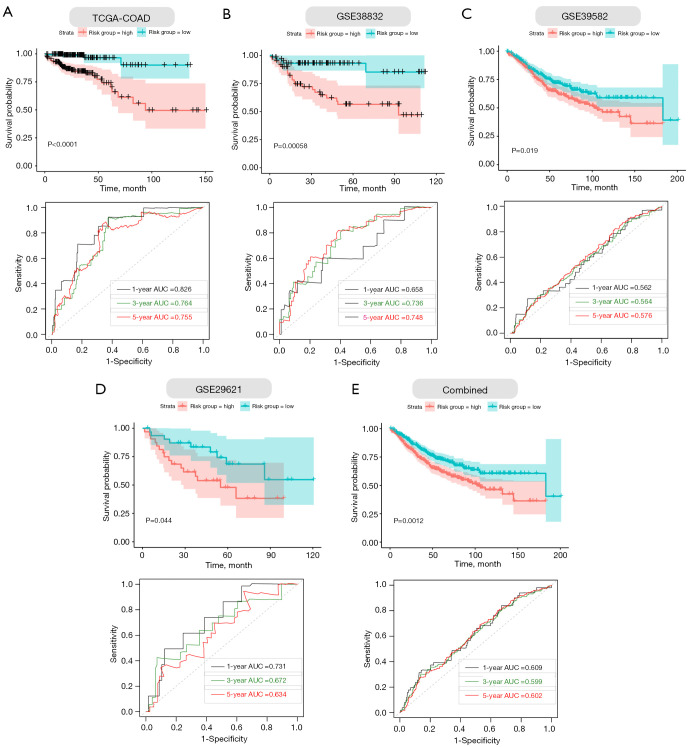
Furthermore, we performed Kaplan–Meier survival curve analyses and demonstrated that patients in the high-risk group exhibited a significantly worse overall survival than those in the low-risk group of both the training (log-rank P<0.001; Figure 5A) and validation cohorts (GSE38832: P=0.00058; GSE39582: P=0.019; GSE29621: P=0.044; combined: 0.0012; Figure 5B-5E). In addition, the areas under the curve (AUC) of the ROC curves for predicting 1-, 3-, and 5-year OS of CC were 0.826, 0.764, and 0.755 for the training cohort, respectively (Figure 5A). The AUCs for 1-, 3-, and 5-year OS were 0.685, 0.736, and 0.748 in the GSE38832 cohort, respectively (Figure 5B). The AUCs for 1-, 3-, and 5-year OS were 0.562, 0.564, and 0.576 in the GSE39582 cohort, respectively (Figure 5C). The AUCs for 1-, 3-, and 5-year OS were 0.731, 0.672, and 0.634 in the GSE29621 cohort, respectively (Figure 5D). When we combined the three GEO validation cohorts together, the AUCs for 1-, 3-, and 5-year OS were 0.609, 0.599, and 0.602, respectively (Figure 5E). Taken together, our four ECM-related gene signature can distinguish the prognosis of CC patients.
Figure 5.
Validation of the four gene ECM-based prognostic signature in training and validation cohorts. (A-E, upper panels) Kaplan-Meier survival curves show that the survival time of the high-risk groups are significantly shorter than that of the low-risk score groups in COAD and validation cohorts. (A-E, lower panels) Time-dependent ROC curves for the prognostic performance of the ECM-based signature in COAD and validation cohorts. ECM, extracellular matrix; TCGA, The Cancer Genome Atlas; COAD, colon adenocarcinoma; ROC, receiver-operating characteristic, AUC, area under the curve.
Association between the risk score and clinical features of CC patients
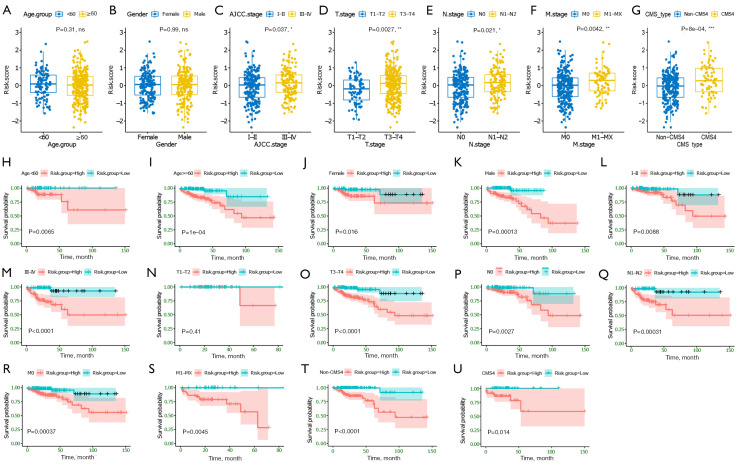
We next investigated the association between the ECM-related risk score and different clinical features. By comparing the risk score distribution of clinical features (Figure 6A-6F), we found that there were significant differences in AJCC stage, T stage, N stage, and M stage (P<0.05; Figure 6C-6F). Importantly, we also found CMS4 patients had significantly higher risk scores than non-CMS4 group (Figure 6G). In addition, based on risk score, age, gender, AJCC stage, T stage, N stage, and M stage could be grouped into high- and low-risk groups, and Kaplan-Meier analysis showed that there were significant prognostic differences between two groups except (P<0.05) for T1-T2 stage (P>0.05; Figure 6H-6T). Moreover, the ECM-related risk score remained effective at distinguishing survival when adjusting to CMSs (P>0.05; Figure 6U,6V). These results further suggested that the ECM-based risk score model had good predictive ability in terms of different clinical features.
Figure 6.
Association between the established four gene ECM-based signature and clinical features. (A-G) Correlation analyses of risk scores calculated based on the ECM-based signature with multiple clinical features of CC patients in the COAD cohort, including age, gender, AJCC stage, T stage, N stage, M stage, and CMSs. (H-U) Subgroup Kaplan-Meier curve analysis shows overall survival probability of high- and low-risk CC patients from the COAD cohort stratified by age (<60, ≥60), gender (female, male), AJCC stage (stage I/II, stage III/IV), T stage (T1-T2, T3-T4), N stage (N0, N1-T2), M stage (M0, M1-MX). Statistical significance was calculated using the log-rank test. *, P<0.05; **, P<0.01; and ***, P<0.001. ECM, extracellular matrix; COAD, colon adenocarcinoma; AJCC, American Joint Committee on Cancer; CMS subtype, consensus molecular subtype; T stage, Tumor stage; N stage, Nodal Involvement stage; M stage, Metastasis stage.
ECM-related gene prognostic signature is an independent prognostic factor
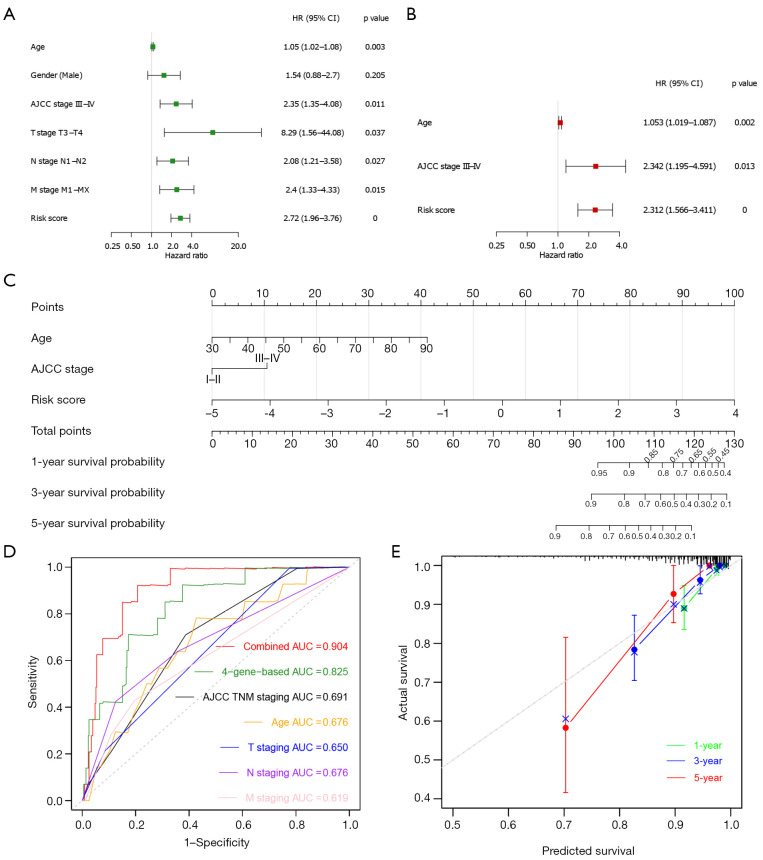
Next, to determine whether ECM-related gene prognostic signature is an independent predictor for the survival of CC patients, we applied both univariate and multivariate Cox regression analysis on clinical features (age, gender, AJCC stage, T stage, N stage and M stage) and risk score of patients in training cohort. Univariate analysis showed that age (P=0.01), AJCC stage III-IV (P=0.01), T3-T4 stage (P=0.032), N1-N2 stage (P=0.024), M1-MX stage (P=0.01), and risk score (P<0.0001) were significantly correlated with OS in training set (Figure 7A). Subsequent multivariate analysis further showed that age (P=0.008), AJCC stage III-IV (P=0.028), and risk score (P<0.0001) had significant correlation with overall survival in CC patients (Figure 7B). These results suggest that ECM-related gene prognostic signature is a significant independent factor affecting the prognosis of CC patients.
Figure 7.
Construction and verification of nomogram. (A) Univariate Cox regression analysis in training cohort. (B) Multivariate Cox regression analysis in training cohort. (C) The prognostic nomogram constructed based on the risk score of ECM-based signature and clinical factors predicted the overall survival rate of COAD patients at 1-, 3-, and 5-year. (D) Time-dependent ROC curves for the prognostic performance of the nomogram in COAD cohort. (E) Time-dependent calibration curves show the concordance between predicted and observed 1-, 3-, and 5-year survival rates. ECM, extracellular matrix; COAD, colon adenocarcinoma; ROC, receiver-operating characteristic; HR, hazard ratio; 95% CI, 95% confidence interval; AJCC, American Joint Committee on Cancer; T stage, Tumor stage; N stage, Nodal Involvement stage; M stage, Metastasis stage; AUC, area under the curve.
Construction of a nomogram
Then we developed a nomogram integrating multiple prognostic factors (age, stage, and risk score) to evaluate the 1-, 3- and 5-year overall survival probability of CC patients in training cohort (Figure 7C). The results showed that risk score had the greatest influence on overall survival prediction. In Figure 7D, ROC curve analysis exhibited that the 1-year AUC value of the ECM-related risk score model was 0.825, remarkably higher than the clinical factors including the AJCC TNM stage (AUC =0.691), patients’ age (AUC =0.676), T stage (AUC =0.650), N stage (AUC =0.676) and M stage (AUC =0.619) (Figure 7D). Importantly, when we comprehensively conducted the ROC analysis based on the risk score combined with clinical features (AJCC TNM stage and age), the ROC curve was notably higher than each alone (AUC =0.904). Meanwhile, we found the calibration curve also manifested a satisfactory agreement between predictive and actual observations at the probabilities of 1-, 3- and 5-year overall survival (Figure 7E). Together, these results indicate that the 1-, 3-, 5-year overall survival rate of patients with CC could be accurately predicted by the nomogram with risk score and it provides valuable insights for individualized clinical treatment of CC patients.
Correlation of the risk score with tumor-infiltrating immune cells
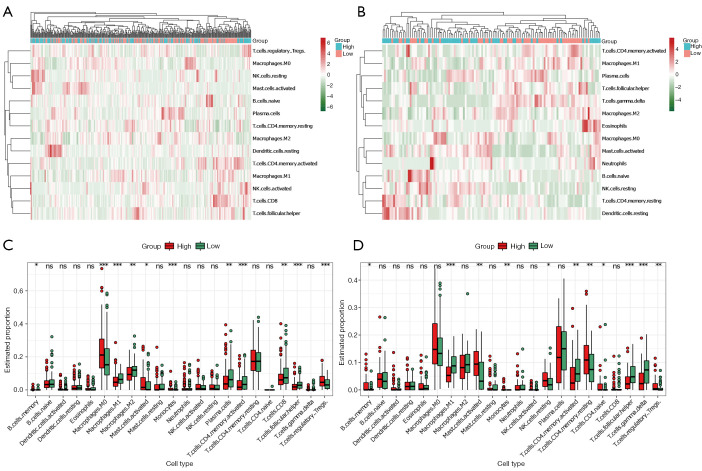
The GO analysis results in Figure 2 showed the differentially expressed ECM-related genes mainly focused on regulation of ECM organization, immune cells chemotaxis, and chemokine-mediated signaling pathway, which provided us with an important hint that the differences between high- and low-risk groups were related to immune response. Therefore, we attempted to analyze the relationship between the risk score and tumor immune microenvironment. By applying the online CIBERSORT tool to the RNA-seq data of both training and validation cohorts, the relative proportions of 22 immune cell subsets of CC were acquired. In Figure 8A,8B, we displayed the abundance of the 22 infiltrative immune cells in training and validation cohorts (GSE38832) in heat maps. Subsequently, as shown in the box plots (Figure 8C,8D), the infiltration levels of memory B cells, M0 macrophage, activated mast cells, monocytes, resting memory CD4+ T cells, and regulatory T cells were significantly higher in high-risk group compared to that in low-risk group. On the contrary, we found the infiltration levels of M1, M2 microphage, plasmas cells, activated memory CD4+ T cells, CD8+ T cells, follicular helper T cells, and gamma delta T cells were significantly higher in the low-risk group.
Figure 8.
Immune cell infiltration analysis. (A,B) Heatmaps showing the unsupervised cluster analysis of each immune cell proportion in COAD and GSE38832 cohorts. (C,D) Distribution level of 22 types of immune cells in the high- and low-risk groups in COAD and GSE38832 cohorts. * P<0.05; **, P<0.01; and ***, P<0.001, ns, not significant. COAD, colon adenocarcinoma.
Verification of prognostic ECM genes
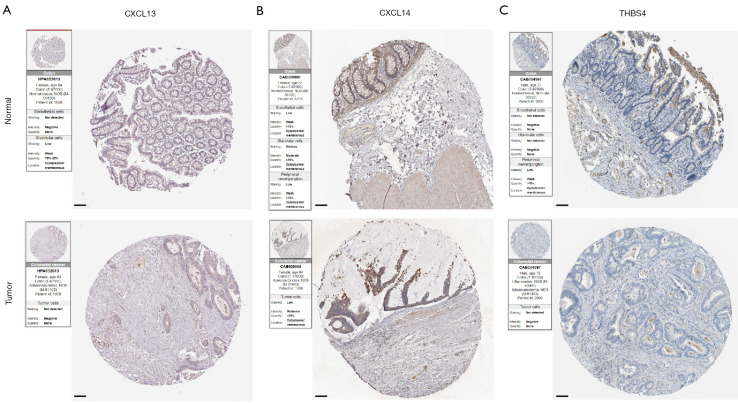
In order to explore the expression patterns of the proteins encoded by the 4 prognostic genes in our ECM-related signature, we then queried the HPA that provided representative immunohistochemistry images in normal and CC tissues (Figure 9A-9C). The results demonstrated that the expression of CXCL13, CXCL14 and THBS4 was decreased in CC tissues. For the remaining one SFRP5, the immunohistochemistry images are not currently available.
Figure 9.
Representative immunohistochemistry images of (A) CXCL13, (B) CXCL14 and (D) THBS4 in both normal and CC tissues sourced from the Human Protein Atlas database (https://www.proteinatlas.org/). Image credit goes to the Human Protein Atlas. The links to the individual normal and tumor tissues of each protein are provided for CXCL13 (https://www.proteinatlas.org/ENSG00000156234-CXCL13/tissue/Colon#img; https://www.proteinatlas.org/ENSG00000156234-CXCL13/pathology/colorectal+cancer#img), CXCL14 (https://www.proteinatlas.org/ENSG00000145824-CXCL14/tissue/Colon#img; https://www.proteinatlas.org/ENSG00000145824-CXCL14/pathology/colorectal+cancer#img), and THBS4 (https://www.proteinatlas.org/ENSG00000113296-THBS4/tissue/Colon#img; https://www.proteinatlas.org/ENSG00000113296-THBS4/pathology/colorectal+cancer#img), respectively. Scale bar, 100 μm. CC, colon cancer.
Discussion
CC is one of the most common aggressive malignant tumors of the digestive tract and the third most common malignant tumor worldwide. Due to the lack of effective diagnostic markers and molecular targeted therapies, the prognosis of CC patients remains poor. By taking advantage of rapid development of omics sequencing technologies, researchers can investigate the underlying molecular mechanisms of CC progression (27,37-39). Moreover, transcriptome profiling of colon tumors provided valuable information for researchers to develop biomarkers-based risk score models to promote the prognosis of CC (12-14,40,41). The ECM, which can convey specific signals to cells, thereby can regulate several critical processes including immune cell migration, immune cell activation, proliferation, and their differentiation (19,42,43). In the occurrence and progression of various tumors, ECM can be altered, which has attracted extensive attention in recent years (17,19,20). Some studies of various cancers prognosis based on the ECM have been reported recently. For instance, Zhang and colleagues reported an ECM-based signature (consisting of CST1, NELL2, ADAMTSL4, and ANGPTL7) associated with immune microenvironment could be used to predict the prognosis and therapeutic responses of patients with oesophageal squamous cell carcinoma (44). Pang et al. identified SPP1 as an ECM signature for metastatic castration-resistant prostate cancer (45). Bergamaschi et al. found that an ECM signature (consisting of MARCO, PUNC, and SPARC) could identify breast cancer subgroups with different clinical outcome (46). In addition, recent CMSs classification system characterized CMS4 subtype with the activation of several critical pathways including ECM remodeling pathway (26). Therefore, in this study, our efforts have led to develop a clinically translatable ECM-based gene signature for risk stratification and overall survival prediction in CC patients and investigate its important prognostic implications through comprehensive bioinformatics methods.
In the present study, we successfully identified and validated a novel ECM-based gene signature (consisting of CXCL13, CXCL14, SFRP5, and THBS4) that could be used to effectively predict the overall survival of CC patients for the first time. The Kaplan-Meier curves indicated that patients in the high-risk group had a significant shorter survival time than those in the low-risk group of both training and validation cohorts, which preliminarily provided some evidenced of the validity of the model predicting the risk of CC. In addition, the time-dependent ROC curves of training cohort presented a relatively high prognostic prediction value, with the AUC of 0.755, 0.764 and 0.826 at 1, 3 and 5 years, respectively. The AUC in validation cohort also indicated the excellent performance of this risk model, with the AUC of 0.658, 0.736 and 0.748 at 1, 3 and 5 years, respectively. Moreover, the result of multivariate Cox regression analysis showed that our ECM-based signature was the most independent risk factor after adjustment for clinical features, such as age and AJCC stage. Importantly, when we stratified the patients according to the different pathological clinical features, the signature remained a robust prognostic tool. The nomogram combined the known risk factors (age and AJCC stage), and risk score was then developed to predict the overall survival probability of 1, 3, and 5 years of CC, whose prognosis efficacy was notably prior to the single factor (age, AJCC stage and risk score only). In summary, our data suggests that the ECM-based risk model is an excellent signature for helping predict the prognosis of CC patients.
CXCL13 and CXCL14 belong to chemokines family, many studies have revealed their important function of tumor proliferation and metastasis. For instance, previous studies showed the important role of CXCL13 and chemokine receptor 5 (CXCR5) signaling axis in the occurrence and development of various human cancers (47-50). In terms of its role in CC, Zhu et al. identified it may promote the growth, migration, and invasion of CC cells via the PI3K/AKT pathway (51). CXCL14, an orphan member of the CXC chemokine subfamily, has also been reported to be associated with tumor progression and metastasis (52-55). Previous studies showed that the expression of CXCL14 mRNA and its protein were ubiquitously detected in normal tissues but were absent in tumor cell lines and in primary tumors (56,57). In terms of the role of CXCL14 in CC, a study from Yi Zhang’s group indicated the absence of CXCL14 contributed to the cancer metastasis that then causes poor outcomes of patients with CC (58). Zeng et al. found CXCL14 might be a potential novel prognostic factor to predict the cancer recurrence and overall survival in CC patients (59). Our differential expression analysis also showed down-regulation of the CXCL13 and CXCL14 in the CC samples, which was consistent with these studies. SFRP5 is a secreted glycoprotein and one of five members of the Secreted Frizzled-Related Protein (SFRP) family. This family has been ascertained as modulators of the canonical Wnt-signaling pathway, down-regulation of them can lead to aberrant activation of Wnt-signaling pathway and then induce tumorigenesis (60,61). For instance, SFRP1 downregulation has been found in several human cancers including CC, which mainly because of the hypermethylation of SFRP1 promoter (62-64). In addition, SFRP2, SFRP4 and SFRP5 were also found to exert their roles in various human cancers (65-67). In consistent with these studies, our results showed a significant down-regulation of SFRP5 in the patients with CC in COAD dataset. Thrombospondin-4 (THBS4) is a secreted ECM protein and one of five members of the thrombospondin protein family. Previous studies showed that THBS4 could affect intracellular migration, adhesion, and attachment as well as proliferation under different conditions (68-71). Increasing studies support the important role of THBS4 in various cancers, such as gastrointestinal and prostate tumors (72,73). Taken together, the four ECM-related genes in our risk model might play essential roles in CC and are worthy of further investigations.
To further investigate the function of our model, we also performed KEGG and GO analysis of the differentially expressed ECM-related genes. Differentially expressed ECM-related genes were enriched in functional categories such as cytokine-cytokine receptor interaction, chemokine signaling pathway, IL-17 signaling pathway, ECM-receptor interaction, TNF and NF-kappa B signaling pathway in the KEGG analysis, while GO analysis revealed that these genes significantly enriched in ECM organization, response to chemokine, chemokine-mediated signaling pathway. These data suggest that the ECM signature-associated genes might affect cancer progression in CC patients through the immune processes and pathways above. The results of CIBERSORT indicated that the levels of immune cell infiltration were significantly associated with the risk score, such as B cells, macrophages, monocytes, plasma cells, CD4+ T cells, CD8+ T cells, Treg, etc. To some extent, these interesting results suggested that this novel ECM-based signature may play a critical role in tumor progression through the immune system. However, although our bioinformatics analysis are relatively comprehensive, further well-designed experiments are required to verify the exact crosstalk and mechanisms of the prediction.
In this study, we developed a four ECM-related gene prognostic signature which was able to discriminate high-risk CC patients from low-risk ones. Besides, we validated this signature in an independent dataset. We also provided important clues to further explore the function of the identified prognostic genes in this risk model and crosstalk between immune and ECM to further improve immunotherapy for CC.
Supplementary
The article’s supplementary files as
Acknowledgments
Funding: None.
Ethical Statement: The authors are accountable for all aspects of the work in ensuring that questions related to the accuracy or integrity of any part of the work are appropriately investigated and resolved. The study was conducted in accordance with the Declaration of Helsinki (as revised in 2013).
Footnotes
Reporting Checklist: The authors have completed the TRIPOD reporting checklist. Available at https://tcr.amegroups.com/article/view/10.21037/tcr-22-2036/rc
Data Sharing Statement: Available at https://tcr.amegroups.com/article/view/10.21037/tcr-22-2036/dss
Peer Review File: Available at https://tcr.amegroups.com/article/view/10.21037/tcr-22-2036/prf
Conflicts of Interest: All authors have completed the ICMJE uniform disclosure form (available at https://tcr.amegroups.com/article/view/10.21037/tcr-22-2036/coif). The authors have no conflicts of interest to declare.
References
- 1.Siegel RL, Miller KD, Jemal A. Cancer statistics, 2018. CA Cancer J Clin 2018;68:7-30. 10.3322/caac.21442 [DOI] [PubMed] [Google Scholar]
- 2.Arnold M, Sierra MS, Laversanne M, et al. Global patterns and trends in colorectal cancer incidence and mortality. Gut 2017;66:683-91. 10.1136/gutjnl-2015-310912 [DOI] [PubMed] [Google Scholar]
- 3.Adam R, Delvart V, Pascal G, et al. Rescue surgery for unresectable colorectal liver metastases downstaged by chemotherapy: a model to predict long-term survival. Ann Surg 2004;240:644-57; discussion 657-8. 10.1097/01.sla.0000141198.92114.f6 [DOI] [PMC free article] [PubMed] [Google Scholar]
- 4.Xie YH, Chen YX, Fang JY. Comprehensive review of targeted therapy for colorectal cancer. Signal Transduct Target Ther 2020;5:22. 10.1038/s41392-020-0116-z [DOI] [PMC free article] [PubMed] [Google Scholar]
- 5.Goldstein DA, Zeichner SB, Bartnik CM, et al. Metastatic Colorectal Cancer: A Systematic Review of the Value of Current Therapies. Clin Colorectal Cancer 2016;15:1-6. 10.1016/j.clcc.2015.10.002 [DOI] [PMC free article] [PubMed] [Google Scholar]
- 6.Van der Jeught K, Xu HC, Li YJ, et al. Drug resistance and new therapies in colorectal cancer. World J Gastroenterol 2018;24:3834-48. 10.3748/wjg.v24.i34.3834 [DOI] [PMC free article] [PubMed] [Google Scholar]
- 7.Zare-Bandamiri M, Fararouei M, Zohourinia S, et al. Risk Factors Predicting Colorectal Cancer Recurrence Following Initial Treatment: A 5-year Cohort Study. Asian Pac J Cancer Prev 2017;18:2465-70. [DOI] [PMC free article] [PubMed] [Google Scholar]
- 8.Oliphant R, Horgan PG, Morrison DS, et al. Validation of a modified clinical risk score to predict cancer-specific survival for stage II colon cancer. Cancer Med 2015;4:84-9. 10.1002/cam4.352 [DOI] [PMC free article] [PubMed] [Google Scholar]
- 9.González N, Loroño A, Aguirre U, et al. Risk scores to predict mortality 2 and 5 years after surgery for colorectal cancer in elderly patients. World J Surg Oncol 2021;19:252. 10.1186/s12957-021-02356-6 [DOI] [PMC free article] [PubMed] [Google Scholar]
- 10.Han L, Dai W, Mo S, et al. Nomogram to predict the risk and survival of synchronous bone metastasis in colorectal cancer: a population-based real-world analysis. Int J Colorectal Dis 2020;35:1575-85. 10.1007/s00384-020-03612-z [DOI] [PubMed] [Google Scholar]
- 11.Zhang ZY, Luo QF, Yin XW, et al. Nomograms to predict survival after colorectal cancer resection without preoperative therapy. BMC Cancer 2016;16:658. 10.1186/s12885-016-2684-4 [DOI] [PMC free article] [PubMed] [Google Scholar]
- 12.Dai S, Xu S, Ye Y, et al. Identification of an Immune-Related Gene Signature to Improve Prognosis Prediction in Colorectal Cancer Patients. Front Genet 2020;11:607009. 10.3389/fgene.2020.607009 [DOI] [PMC free article] [PubMed] [Google Scholar]
- 13.Chang K, Yuan C, Liu X. A New RBPs-Related Signature Predicts the Prognosis of Colon Adenocarcinoma Patients. Front Oncol 2021;11:627504. 10.3389/fonc.2021.627504 [DOI] [PMC free article] [PubMed] [Google Scholar]
- 14.Qi X, Wang R, Lin Y, et al. A Ferroptosis-Related Gene Signature Identified as a Novel Prognostic Biomarker for Colon Cancer. Front Genet 2021;12:692426. 10.3389/fgene.2021.692426 [DOI] [PMC free article] [PubMed] [Google Scholar]
- 15.Frantz C, Stewart KM, Weaver VM. The extracellular matrix at a glance. J Cell Sci 2010;123:4195-200. 10.1242/jcs.023820 [DOI] [PMC free article] [PubMed] [Google Scholar]
- 16.Yue B. Biology of the extracellular matrix: an overview. J Glaucoma 2014;23:S20-3. 10.1097/IJG.0000000000000108 [DOI] [PMC free article] [PubMed] [Google Scholar]
- 17.Walker C, Mojares E, Del Río Hernández A. Role of Extracellular Matrix in Development and Cancer Progression. Int J Mol Sci 2018. 10.3390/ijms19103028 [DOI] [PMC free article] [PubMed] [Google Scholar]
- 18.Iyengar NM, Gucalp A, Dannenberg AJ, et al. Obesity and Cancer Mechanisms: Tumor Microenvironment and Inflammation. J Clin Oncol 2016;34:4270-6. 10.1200/JCO.2016.67.4283 [DOI] [PMC free article] [PubMed] [Google Scholar]
- 19.Pickup MW, Mouw JK, Weaver VM. The extracellular matrix modulates the hallmarks of cancer. EMBO Rep 2014;15:1243-53. 10.15252/embr.201439246 [DOI] [PMC free article] [PubMed] [Google Scholar]
- 20.DeBerardinis RJ. Tumor Microenvironment, Metabolism, and Immunotherapy. N Engl J Med 2020;382:869-71. 10.1056/NEJMcibr1914890 [DOI] [PubMed] [Google Scholar]
- 21.Provenzano PP, Inman DR, Eliceiri KW, et al. Collagen density promotes mammary tumor initiation and progression. BMC Med 2008;6:11. 10.1186/1741-7015-6-11 [DOI] [PMC free article] [PubMed] [Google Scholar]
- 22.Levental KR, Yu H, Kass L, et al. Matrix crosslinking forces tumor progression by enhancing integrin signaling. Cell 2009;139:891-906. 10.1016/j.cell.2009.10.027 [DOI] [PMC free article] [PubMed] [Google Scholar]
- 23.Slattery ML, John E, Torres-Mejia G, et al. Matrix metalloproteinase genes are associated with breast cancer risk and survival: the Breast Cancer Health Disparities Study. PLoS One 2013;8:e63165. 10.1371/journal.pone.0063165 [DOI] [PMC free article] [PubMed] [Google Scholar]
- 24.Boyd NF, Guo H, Martin LJ, et al. Mammographic density and the risk and detection of breast cancer. N Engl J Med 2007;356:227-36. 10.1056/NEJMoa062790 [DOI] [PubMed] [Google Scholar]
- 25.Stenzinger A, Wittschieber D, von Winterfeld M, et al. High extracellular matrix metalloproteinase inducer/CD147 expression is strongly and independently associated with poor prognosis in colorectal cancer. Hum Pathol 2012;43:1471-81. 10.1016/j.humpath.2011.10.023 [DOI] [PubMed] [Google Scholar]
- 26.Guinney J, Dienstmann R, Wang X, et al. The consensus molecular subtypes of colorectal cancer. Nat Med 2015;21:1350-6. 10.1038/nm.3967 [DOI] [PMC free article] [PubMed] [Google Scholar]
- 27.Tripathi MK, Deane NG, Zhu J, et al. Nuclear factor of activated T-cell activity is associated with metastatic capacity in colon cancer. Cancer Res 2014;74:6947-57. 10.1158/0008-5472.CAN-14-1592 [DOI] [PMC free article] [PubMed] [Google Scholar]
- 28.Ritchie ME, Phipson B, Wu D, et al. limma powers differential expression analyses for RNA-sequencing and microarray studies. Nucleic Acids Res 2015;43:e47. 10.1093/nar/gkv007 [DOI] [PMC free article] [PubMed] [Google Scholar]
- 29.Yu G, Wang LG, Han Y, et al. clusterProfiler: an R package for comparing biological themes among gene clusters. OMICS 2012;16:284-7. 10.1089/omi.2011.0118 [DOI] [PMC free article] [PubMed] [Google Scholar]
- 30.Tibshirani R. The lasso method for variable selection in the Cox model. Stat Med 1997;16:385-95. [DOI] [PubMed] [Google Scholar]
- 31.Motakis E, Ivshina AV, Kuznetsov VA. Data-driven approach to predict survival of cancer patients: estimation of microarray genes' prediction significance by Cox proportional hazard regression model. IEEE Eng Med Biol Mag 2009;28:58-66. 10.1109/MEMB.2009.932937 [DOI] [PubMed] [Google Scholar]
- 32.Alboukadel K, Marcin K, Przemyslaw B, et al. Survminer Drawing Survival Curves Using ‘ggplot2’. R Package Version 04 3. 2018.
- 33.Therneau T. A Package for Survival Analysis in R. R Package Version 3.2-3. Computer Software Rochester, MN Mayo Clinic. 2020.
- 34.Blanche P. TimeROC Time-Dependent ROC Curve and AUC for Censored Survival Data. R Package Version 2. 2015.
- 35.Zhang Z, Kattan MW. Drawing Nomograms with R: applications to categorical outcome and survival data. Ann Transl Med 2017;5:211. 10.21037/atm.2017.04.01 [DOI] [PMC free article] [PubMed] [Google Scholar]
- 36.Newman AM, Steen CB, Liu CL, et al. Determining cell type abundance and expression from bulk tissues with digital cytometry. Nat Biotechnol 2019;37:773-82. 10.1038/s41587-019-0114-2 [DOI] [PMC free article] [PubMed] [Google Scholar]
- 37.Gao M, Zhong A, Patel N, et al. High throughput RNA sequencing utility for diagnosis and prognosis in colon diseases. World J Gastroenterol 2017;23:2819-25. 10.3748/wjg.v23.i16.2819 [DOI] [PMC free article] [PubMed] [Google Scholar]
- 38.Marisa L, de Reyniès A, Duval A, et al. Gene expression classification of colon cancer into molecular subtypes: characterization, validation, and prognostic value. PLoS Med 2013;10:e1001453. 10.1371/journal.pmed.1001453 [DOI] [PMC free article] [PubMed] [Google Scholar]
- 39.Sheffer M, Bacolod MD, Zuk O, et al. Association of survival and disease progression with chromosomal instability: a genomic exploration of colorectal cancer. Proc Natl Acad Sci U S A 2009;106:7131-6. 10.1073/pnas.0902232106 [DOI] [PMC free article] [PubMed] [Google Scholar]
- 40.Ge CY, Wei LY, Tian Y, et al. A Seven-NF-κB-Related Gene Signature May Distinguish Patients with Ulcerative Colitis-Associated Colorectal Carcinoma. Pharmgenomics Pers Med 2020;13:707-18. 10.2147/PGPM.S274258 [DOI] [PMC free article] [PubMed] [Google Scholar]
- 41.Yang Y, Qu A, Wu Q, et al. Prognostic value of a hypoxia-related microRNA signature in patients with colorectal cancer. Aging (Albany NY) 2020;12:35-52. 10.18632/aging.102228 [DOI] [PMC free article] [PubMed] [Google Scholar]
- 42.Sangaletti S, Chiodoni C, Tripodo C, et al. Common extracellular matrix regulation of myeloid cell activity in the bone marrow and tumor microenvironments. Cancer Immunol Immunother 2017;66:1059-67. 10.1007/s00262-017-2014-y [DOI] [PMC free article] [PubMed] [Google Scholar]
- 43.Mushtaq MU, Papadas A, Pagenkopf A, et al. Tumor matrix remodeling and novel immunotherapies: the promise of matrix-derived immune biomarkers. J Immunother Cancer 2018;6:65. 10.1186/s40425-018-0376-0 [DOI] [PMC free article] [PubMed] [Google Scholar]
- 44.Zhang H, Shi Q, Yang Z, et al. An Extracellular Matrix-Based Signature Associated With Immune Microenvironment Predicts the Prognosis and Therapeutic Responses of Patients With Oesophageal Squamous Cell Carcinoma. Front Mol Biosci 2021;8:598427. 10.3389/fmolb.2021.598427 [DOI] [PMC free article] [PubMed] [Google Scholar]
- 45.Pang X, Xie R, Zhang Z, et al. Identification of SPP1 as an Extracellular Matrix Signature for Metastatic Castration-Resistant Prostate Cancer. Front Oncol 2019;9:924. 10.3389/fonc.2019.00924 [DOI] [PMC free article] [PubMed] [Google Scholar]
- 46.Bergamaschi A, Tagliabue E, Sørlie T, et al. Extracellular matrix signature identifies breast cancer subgroups with different clinical outcome. J Pathol 2008;214:357-67. 10.1002/path.2278 [DOI] [PubMed] [Google Scholar]
- 47.Kazanietz MG, Durando M, Cooke M. CXCL13 and Its Receptor CXCR5 in Cancer: Inflammation, Immune Response, and Beyond. Front Endocrinol (Lausanne) 2019;10:471. 10.3389/fendo.2019.00471 [DOI] [PMC free article] [PubMed] [Google Scholar]
- 48.Hussain M, Adah D, Tariq M, et al. CXCL13/CXCR5 signaling axis in cancer. Life Sci 2019;227:175-86. 10.1016/j.lfs.2019.04.053 [DOI] [PubMed] [Google Scholar]
- 49.Biswas S, Sengupta S, Roy Chowdhury S, et al. CXCL13-CXCR5 co-expression regulates epithelial to mesenchymal transition of breast cancer cells during lymph node metastasis. Breast Cancer Res Treat 2014;143:265-76. 10.1007/s10549-013-2811-8 [DOI] [PubMed] [Google Scholar]
- 50.Tian C, Li C, Zeng Y, et al. Identification of CXCL13/CXCR5 axis's crucial and complex effect in human lung adenocarcinoma. Int Immunopharmacol 2021;94:107416. 10.1016/j.intimp.2021.107416 [DOI] [PubMed] [Google Scholar]
- 51.Zhu Z, Zhang X, Guo H, et al. CXCL13-CXCR5 axis promotes the growth and invasion of colon cancer cells via PI3K/AKT pathway. Mol Cell Biochem 2015;400:287-95. 10.1007/s11010-014-2285-y [DOI] [PubMed] [Google Scholar]
- 52.Augsten M, Hägglöf C, Olsson E, et al. CXCL14 is an autocrine growth factor for fibroblasts and acts as a multi-modal stimulator of prostate tumor growth. Proc Natl Acad Sci U S A 2009;106:3414-9. 10.1073/pnas.0813144106 [DOI] [PMC free article] [PubMed] [Google Scholar]
- 53.Pelicano H, Lu W, Zhou Y, et al. Mitochondrial dysfunction and reactive oxygen species imbalance promote breast cancer cell motility through a CXCL14-mediated mechanism. Cancer Res 2009;69:2375-83. 10.1158/0008-5472.CAN-08-3359 [DOI] [PMC free article] [PubMed] [Google Scholar]
- 54.Westrich JA, Vermeer DW, Colbert PL, et al. The multifarious roles of the chemokine CXCL14 in cancer progression and immune responses. Mol Carcinog 2020;59:794-806. 10.1002/mc.23188 [DOI] [PMC free article] [PubMed] [Google Scholar]
- 55.Gowhari Shabgah A, Haleem Al-Qaim Z, Markov A, et al. Chemokine CXCL14; a double-edged sword in cancer development. Int Immunopharmacol 2021;97:107681. 10.1016/j.intimp.2021.107681 [DOI] [PubMed] [Google Scholar]
- 56.Frederick MJ, Henderson Y, Xu X, et al. In vivo expression of the novel CXC chemokine BRAK in normal and cancerous human tissue. Am J Pathol 2000;156:1937-50. 10.1016/S0002-9440(10)65067-5 [DOI] [PMC free article] [PubMed] [Google Scholar]
- 57.Meuter S, Moser B. Constitutive expression of CXCL14 in healthy human and murine epithelial tissues. Cytokine 2008;44:248-55. 10.1016/j.cyto.2008.08.009 [DOI] [PubMed] [Google Scholar]
- 58.Liu J, Wang D, Zhang C, et al. Identification of liver metastasis-associated genes in human colon carcinoma by mRNA profiling. Chin J Cancer Res 2018;30:633-46. 10.21147/j.issn.1000-9604.2018.06.08 [DOI] [PMC free article] [PubMed] [Google Scholar]
- 59.Zeng J, Yang X, Cheng L, et al. Chemokine CXCL14 is associated with prognosis in patients with colorectal carcinoma after curative resection. J Transl Med 2013;11:6. 10.1186/1479-5876-11-6 [DOI] [PMC free article] [PubMed] [Google Scholar]
- 60.Suzuki H, Watkins DN, Jair KW, et al. Epigenetic inactivation of SFRP genes allows constitutive WNT signaling in colorectal cancer. Nat Genet 2004;36:417-22. 10.1038/ng1330 [DOI] [PubMed] [Google Scholar]
- 61.Nojima M, Suzuki H, Toyota M, et al. Frequent epigenetic inactivation of SFRP genes and constitutive activation of Wnt signaling in gastric cancer. Oncogene 2007;26:4699-713. 10.1038/sj.onc.1210259 [DOI] [PubMed] [Google Scholar]
- 62.Caldwell GM, Jones C, Gensberg K, et al. The Wnt antagonist sFRP1 in colorectal tumorigenesis. Cancer Res 2004;64:883-8. 10.1158/0008-5472.CAN-03-1346 [DOI] [PubMed] [Google Scholar]
- 63.Takada T, Yagi Y, Maekita T, et al. Methylation-associated silencing of the Wnt antagonist SFRP1 gene in human ovarian cancers. Cancer Sci 2004;95:741-4. 10.1111/j.1349-7006.2004.tb03255.x [DOI] [PMC free article] [PubMed] [Google Scholar]
- 64.Lodygin D, Epanchintsev A, Menssen A, et al. Functional epigenomics identifies genes frequently silenced in prostate cancer. Cancer Res 2005;65:4218-27. 10.1158/0008-5472.CAN-04-4407 [DOI] [PubMed] [Google Scholar]
- 65.Zou H, Molina JR, Harrington JJ, et al. Aberrant methylation of secreted frizzled-related protein genes in esophageal adenocarcinoma and Barrett's esophagus. Int J Cancer 2005;116:584-91. 10.1002/ijc.21045 [DOI] [PubMed] [Google Scholar]
- 66.Pohl S, Scott R, Arfuso F, et al. Secreted frizzled-related protein 4 and its implications in cancer and apoptosis. Tumour Biol 2015;36:143-52. 10.1007/s13277-014-2956-z [DOI] [PubMed] [Google Scholar]
- 67.Zhao C, Bu X, Zhang N, et al. Downregulation of SFRP5 expression and its inverse correlation with those of MMP-7 and MT1-MMP in gastric cancer. BMC Cancer 2009;9:224. 10.1186/1471-2407-9-224 [DOI] [PMC free article] [PubMed] [Google Scholar]
- 68.Narouz-Ott L, Maurer P, Nitsche DP, et al. Thrombospondin-4 binds specifically to both collagenous and non-collagenous extracellular matrix proteins via its C-terminal domains. J Biol Chem 2000;275:37110-7. 10.1074/jbc.M007223200 [DOI] [PubMed] [Google Scholar]
- 69.Adams JC. Functions of the conserved thrombospondin carboxy-terminal cassette in cell-extracellular matrix interactions and signaling. Int J Biochem Cell Biol 2004;36:1102-14. 10.1016/j.biocel.2004.01.022 [DOI] [PubMed] [Google Scholar]
- 70.Arber S, Caroni P. Thrombospondin-4, an extracellular matrix protein expressed in the developing and adult nervous system promotes neurite outgrowth. J Cell Biol 1995;131:1083-94. 10.1083/jcb.131.4.1083 [DOI] [PMC free article] [PubMed] [Google Scholar]
- 71.Stenina OI, Desai SY, Krukovets I, et al. Thrombospondin-4 and its variants: expression and differential effects on endothelial cells. Circulation 2003;108:1514-9. 10.1161/01.CIR.0000089085.76320.4E [DOI] [PubMed] [Google Scholar]
- 72.Förster S, Gretschel S, Jöns T, et al. THBS4, a novel stromal molecule of diffuse-type gastric adenocarcinomas, identified by transcriptome-wide expression profiling. Mod Pathol 2011;24:1390-403. 10.1038/modpathol.2011.99 [DOI] [PubMed] [Google Scholar]
- 73.Liu J, Cheng G, Yang H, et al. Reciprocal regulation of long noncoding RNAs THBS4-003 and THBS4 control migration and invasion in prostate cancer cell lines. Mol Med Rep 2016;14:1451-8. 10.3892/mmr.2016.5443 [DOI] [PMC free article] [PubMed] [Google Scholar]
Associated Data
This section collects any data citations, data availability statements, or supplementary materials included in this article.
Supplementary Materials
The article’s supplementary files as


