

Letter to Editor
Bone metastasis (BoM) is a major cause of morbidity and mortality from breast cancer1. BoM treatment is hindered by tumor evolution and heterogeneity2, with limited clinically-relevant models to test and prioritize treatments3. Furthermore, heterogeneity between unique BoMs within a patient may drive treatment resistance4. To address these challenges, we investigated BoM evolution and heterogeneity in a case of primary ER+/PR-/HER2- invasive lobular breast carcinoma (ILC), which during adjuvant letrozole treatment progressed to the left pelvis (BoML) and right tibia (BoMR) (Figure S1A). The primary tumor, bilateral BoM and BoM patient-derived organoids (PDO) were subjected to bulk DNA/RNA and single cell RNA sequencing (scRNAseq).
Histopathology demonstrated evolution of disease from ER+ primary ILC to ER− BoM with mixed lobular/ductal carcinoma features (Figure 1A). DNAseq revealed 286 somatic substitutions gained in BoM compared to the primary tumor, with 169 shared between BoMs, 19 unique to BoML and 98 unique to BoMR (Figure 1B, Supplementary_table1). Clinically actionable mutations included PI3K-E545K (NM_006218) and BRCA1-D1834H (NM_007300) (Figure S1B, S1C) with BRCA1-D1834H gained in the BoM. These mutations were readily detected in circulating-free DNA (Figure S1D). RNAseq revealed shared and unique transcriptomic evolution in bilateral BoM, including loss of luminal and gain of basal/HER2 features (Figure S1E), up/down-regulation of actionable genes frequently altered in BoMs5 including EPHA3, ROS1 and PTPRD (Figure 1C), and enhanced cancer-hallmark pathways including PI3K-AKT-mTOR, angiogenesis, epithelial to mesenchymal transition (EMT), and androgen response (Figure 1D).
Figure 1. Histological and multiomics profiling of paired primary ILC and bilateral BoMs, and target evaluation with associated BoM PDOs.
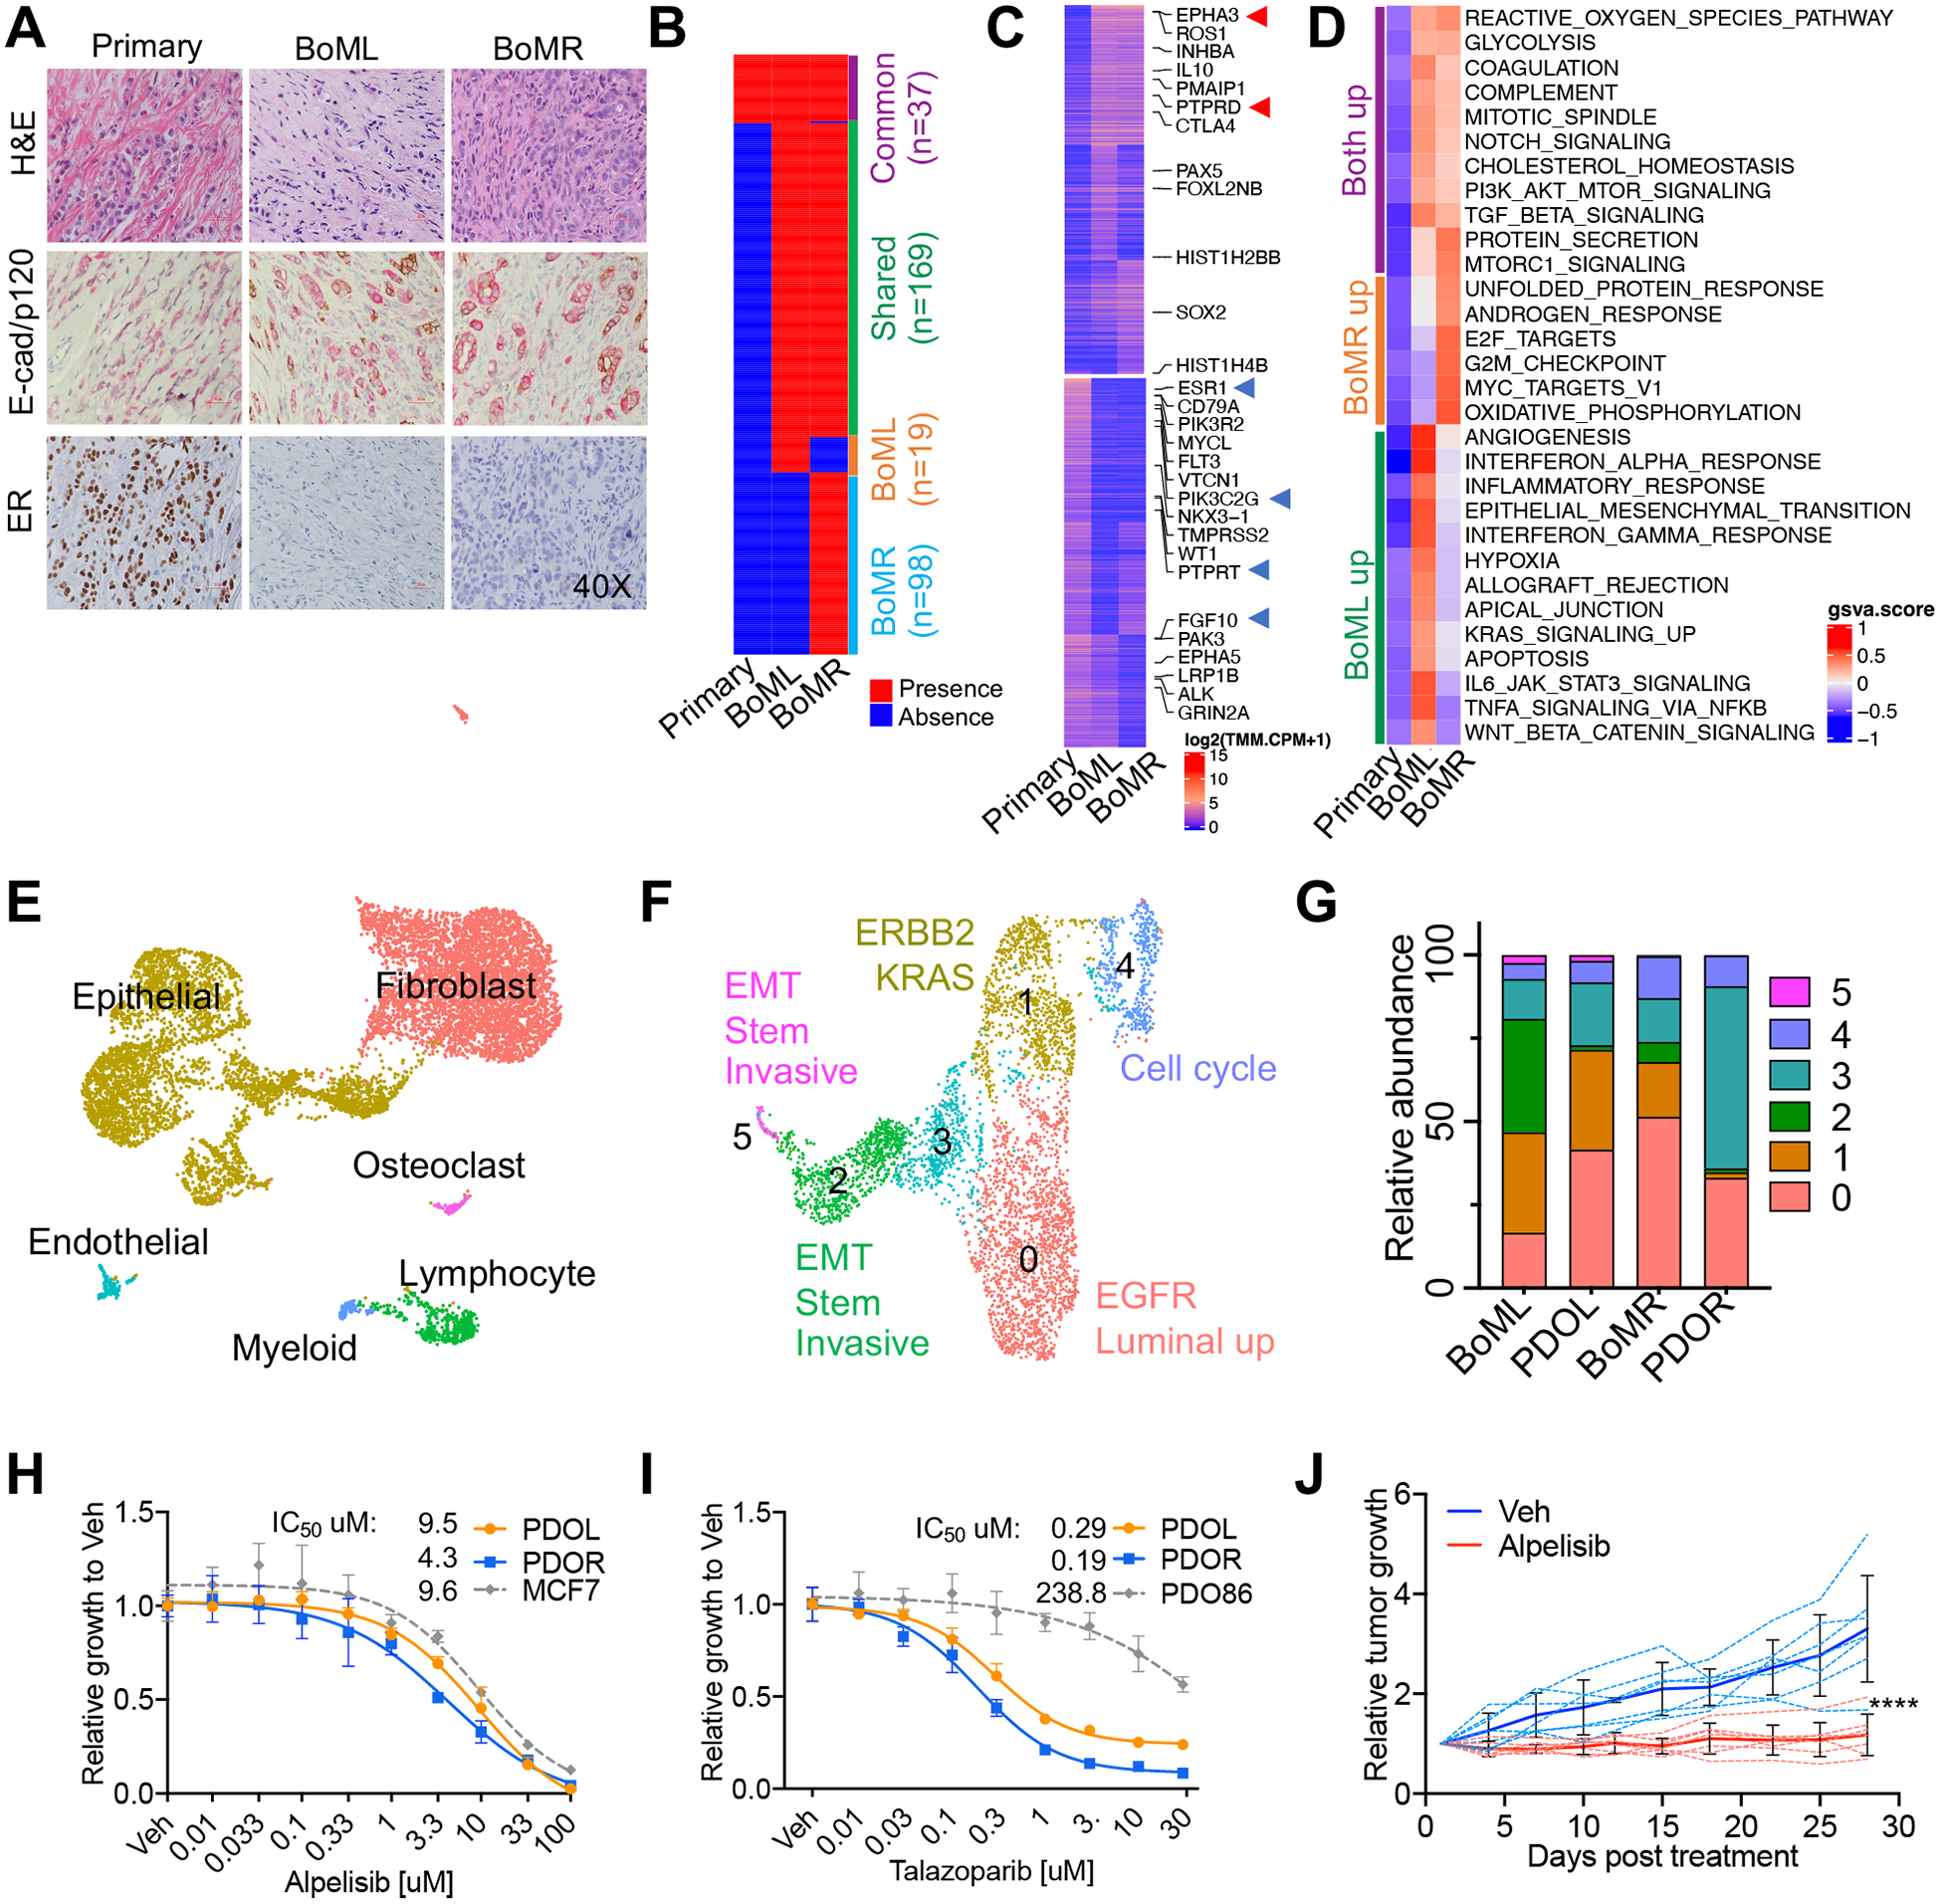
(A) Hematoxylin and eosin (H&E) staining, and immunohistochemical staining of E-cad/p120 and ER of primary tumor, left pelvis metastasis (BoML) and right tibia metastasis (BoMR). E-cad is stained brown, and p120 is stained pink.
(B) Comparison of exonic somatic substitutions identified in BoMs with primary tumor, with allele frequency cutoff ≥ 0.1.
(C) Genes with the top 3% fold change gains (top panel) and losses (bottom panel) in either BoM compared to the primary tumor. Labeled genes are clinical actionable genes based upon DGIdb. Arrows indicate frequently upregulated (red) and downregulated (blue) genes in breast cancer BoMs reported by Priedigkeit N et.al5.
(D) GSVA analysis of Hallmark gene sets from MsigDB in the primary tumor and BoMs. Pathways with GSVA score difference between the primary tumor and either BoM more than 0.6 are shown.
(E) UMAP of cell clusters identified by scRNAseq of BoML/R, with cell types assigned based on the expression of canonical markers and SingleR automatic cell type assignment.
(F) UMAP of subpopulations of epithelial cells from BoML/R with top enriched pathways of each cluster annotated.
(G) Comparison of relative abundance of epithelial subpopulations between PDO and paired BoM using FindTransferAnchors function of Seurat. Cluster numbers in Figure G correspond to cluster numbers in Figure F.
(H-I) Dose response curves of PDOs to Alpelisib (H) and Talazoparib (I). IC50 was calculated using a nonlinear regression model with variable slopes. MCF7 with PI3K (E545K) mutation and PDO86 with wild type BRCA1 were used as controls. Data is shown as mean −/+ SD. n=3 for each experiment.
(J) Relative growth of PDOL murine xenografts under the treatment of vehicle (Veh; 0.5% carboxymethylcellulose) or 50mg/kg/day Alpelisib by daily gavage for 4 weeks. Treatment was initiated when tumors reached ~200mm3 with 7 mice in each treatment arm. Tumor volume was measured twice a week with caliper. Dashed lines are the relative growth curves of individual tumor. Solid lines are the average relative growth of each group, shown as mean −/+ SD. p value of tumor growth differences between the Vehicle and Alpelisib groups was calculated by two-way ANOVA. ****p<0.0001.
E-cad: E-cadherin, ER: Estrogen receptor, BoM: bone metastasis, PDOs: patient-derived organoids, PDOL: patient-derived organoid left (bone metastases).
scRNAseq of BoMs identified six cell populations (Figure 1E), with BoML showing more stroma cells and BoMR containing more epithelial cells (Figure S1F). Six epithelial subpopulations were identified (Figure 1F), with BoML having more EMT and BoMR containing more Luminal/EGFR and proliferative cells (Figure S1G), consistent with RNAseq data (Figure 1D). EMT cells showed the highest hypoxia signature, and their feature genes were mostly regulated by PRRX/TWIST (Figure S1H, S1I). Nine fibroblast clusters featuring diverse functions were identified (Figure S1J). Consistent with bulk RNAseq showing higher hypoxia/angiogenesis signatures (Figure 1D), BoML had more mCAF/vCAF compared to BoMR (Figure S1K). BoMs showed comparable immune cell types (Figure S1L, S1M), but BoML contained more naïve-T/B cells while BoMR had more Tregs/macrophages. Expression of immune checkpoints and ligands were detected in CD8+T/NK/Treg cells (Figure S1N). In summary, multiomics profiling uncovered potential treatments, highlighting PI3K and BRCA1 for both BoMs, EMT, angiogenesis and PD1/PDL1 for BoML, and androgen response and proliferation for BoMR.
PDO were derived from BoML and BoMR. scRNAseq demonstrated that PDO retained the subclonal heterogeneity of BoMs epithelial cells (Figure 1G) and showed highly correlated gene expression with BoM (Figure S1O). PDO preserved >90% of somatic mutations and COSMIC mutational signatures of BoM (Figure S1P, S1Q, Supplementary_table2). Consistent with the PI3K-E545K and BRCA1-D1834H mutations, both PDOs showed robust in vitro growth inhibition in response to Alpelisib and Talazoparib (Figure 1H, 1I) and sensitivity to Alpelisib with PDOL as a murine xenograft (Figure 1J).
In conclusion, bulk and single cell profiling of bilateral BoMs, primary tumor and PDO revealed intratumor heterogeneity and evolution, and therapeutic opportunities for precision medicine.
Supplementary Material
Figure S1. Histological and multiomics profiling of paired primary ILC and bilateral BoMs, and target evaluation with associated BoM PDOs.
(A) Patient clinical history, and biosamples collection and profiling. D: Day, M: Month, BoML: bone metastasis left pelvis, BoMR: bone metastasis right tibia, PDOL/R: patient-derived organoid left/right (bone metastasis), PDOX: patient-derived organoid xenograft
(B) Allele frequency of somatic mutations detected in BoMs with a CHASM prediction to be a breast cancer driver mutation.
(C) Genes with detected somatic mutations in BoMs that are annotated as actionable in COSMIC, OncoKB or CIVIC database.
(D) Droplet digital PCR (ddPCR) of PI3K (E545K) and BRCA1 (D1834H) mutations using plasma cfDNA collected at the time of BoML surgery.
(E) Probability of PAM50 subtypes of primary tumor and BoMs predicted using genefu.
(F) Comparison of relative abundance of cell types between BoML and BoMR.
(G) Comparison of relative abundance of subpopulations of epithelial cells between BoML and BoMR.
(H) Module score of hallmark hypoxia signature from MsigDB across epithelial cell subpopulations as calculated by Seurat. p values are calculated by t.test. *** p<0.001, ****p<0.0001.
(I) Transcription factor enrichment analysis of the top100 significantly upregulated genes in epithelial cluster 5 with ChEA3, using Enrichr and ARCHS4 as transcription factor reference databases. Red indicates the gene is regulated by the transcription factor.
(J) UMAP of subpopulations of fibroblasts from BoML/R with top enriched pathways of each cluster annotated. ECM: extracellular matrix, mCAF: matrix cancer associated fibroblast, vCAF: vascular cancer associated fibroblast
(K) Comparison of relative abundance of subpopulations of fibroblasts between BoML and BoMR.
(L) Immune cell compositions of BoML/R determined based on expression of canonical markers.
(M) Comparison of relative abundance of immune cell types between BoML and BoMR.
(N) Expression (log normalized counts) of immune checkpoints and ligands in lymphocytes, with percentage of expression in CD8+ T cells noted in graph. Dot size represents percentage of expression and color indicates average expression.
(O) Pearson correlation analysis of global gene expression between PDOs and epithelial cells of paired BoMs, based on averaged gene expression of scRNAseq data. Cor. Correlation coefficient.
(P) Comparison of abundance of COSMIC mutational gene signatures between PDOs and the paired BoMs.
(Q) Comparison of somatic mutations between PDOs and the paired BoMs.
Acknowledgement
SO and AVL are Hillman Fellows. We would like to thank UPMC Genome Center, University of Pittsburgh HSCRF Genomics Research Core, and the University of Pittsburgh Center for Research Computing for supporting this study.
Funding
This work was supported by the Breast Cancer Research Foundation (AVL and SO, grant number not applicable); Susan G. Komen Scholar awards (SAC110021 to AVL, SAC160073 to SO); the Metastatic Breast Cancer Network Foundation [SO] (grant number not applicable); the National Cancer Institute (R01 CA252378 to SO/AVL]; Magee-Women’s Research Institute and Foundation, Nicole Meloche Foundation, and the Shear Family Foundation (grant number not applicable). This project used the Pitt Biospecimen Core/UPMC Hillman Cancer Center Tissue and Research Pathology Services supported in part by NIH grant award P30CA047904, Funding was in part provided by the Institute for Precision Medicine of the University of Pittsburgh and UPMC (grant number not applicable).
Footnotes
Disclosure
Authors have nothing to disclose.
References
- 1.Harbeck N, Penault-Llorca F, Cortes J et al. Breast cancer. Nature Reviews Disease Primers 2019; 5 (1): 66. [DOI] [PubMed] [Google Scholar]
- 2.Aftimos P, Oliveira M, Irrthum A et al. Genomic and Transcriptomic Analyses of Breast Cancer Primaries and Matched Metastases in AURORA, the Breast International Group (BIG) Molecular Screening Initiative. Cancer Discov 2021; 11 (11): 2796–2811. [DOI] [PMC free article] [PubMed] [Google Scholar]
- 3.Weilbaecher KN, Guise TA, McCauley LK. Cancer to bone: a fatal attraction. Nat Rev Cancer 2011; 11 (6): 411–425. [DOI] [PMC free article] [PubMed] [Google Scholar]
- 4.Wu JM, Fackler MJ, Halushka MK et al. Heterogeneity of breast cancer metastases: comparison of therapeutic target expression and promoter methylation between primary tumors and their multifocal metastases. Clinical cancer research : an official journal of the American Association for Cancer Research 2008; 14 (7): 1938–1946. [DOI] [PMC free article] [PubMed] [Google Scholar]
- 5.Priedigkeit N, Watters RJ, Lucas PC et al. Exome-capture RNA sequencing of decade-old breast cancers and matched decalcified bone metastases. JCI Insight 2017; 2 (17). [DOI] [PMC free article] [PubMed] [Google Scholar]
Associated Data
This section collects any data citations, data availability statements, or supplementary materials included in this article.
Supplementary Materials
Figure S1. Histological and multiomics profiling of paired primary ILC and bilateral BoMs, and target evaluation with associated BoM PDOs.
(A) Patient clinical history, and biosamples collection and profiling. D: Day, M: Month, BoML: bone metastasis left pelvis, BoMR: bone metastasis right tibia, PDOL/R: patient-derived organoid left/right (bone metastasis), PDOX: patient-derived organoid xenograft
(B) Allele frequency of somatic mutations detected in BoMs with a CHASM prediction to be a breast cancer driver mutation.
(C) Genes with detected somatic mutations in BoMs that are annotated as actionable in COSMIC, OncoKB or CIVIC database.
(D) Droplet digital PCR (ddPCR) of PI3K (E545K) and BRCA1 (D1834H) mutations using plasma cfDNA collected at the time of BoML surgery.
(E) Probability of PAM50 subtypes of primary tumor and BoMs predicted using genefu.
(F) Comparison of relative abundance of cell types between BoML and BoMR.
(G) Comparison of relative abundance of subpopulations of epithelial cells between BoML and BoMR.
(H) Module score of hallmark hypoxia signature from MsigDB across epithelial cell subpopulations as calculated by Seurat. p values are calculated by t.test. *** p<0.001, ****p<0.0001.
(I) Transcription factor enrichment analysis of the top100 significantly upregulated genes in epithelial cluster 5 with ChEA3, using Enrichr and ARCHS4 as transcription factor reference databases. Red indicates the gene is regulated by the transcription factor.
(J) UMAP of subpopulations of fibroblasts from BoML/R with top enriched pathways of each cluster annotated. ECM: extracellular matrix, mCAF: matrix cancer associated fibroblast, vCAF: vascular cancer associated fibroblast
(K) Comparison of relative abundance of subpopulations of fibroblasts between BoML and BoMR.
(L) Immune cell compositions of BoML/R determined based on expression of canonical markers.
(M) Comparison of relative abundance of immune cell types between BoML and BoMR.
(N) Expression (log normalized counts) of immune checkpoints and ligands in lymphocytes, with percentage of expression in CD8+ T cells noted in graph. Dot size represents percentage of expression and color indicates average expression.
(O) Pearson correlation analysis of global gene expression between PDOs and epithelial cells of paired BoMs, based on averaged gene expression of scRNAseq data. Cor. Correlation coefficient.
(P) Comparison of abundance of COSMIC mutational gene signatures between PDOs and the paired BoMs.
(Q) Comparison of somatic mutations between PDOs and the paired BoMs.