

Abstract
Healthy brain dynamics can be understood as the emergence of a complex system far from thermodynamic equilibrium. Brain dynamics are temporally irreversible and thus establish a preferred direction in time (i.e., arrow of time). However, little is known about how the time-reversal symmetry of spontaneous brain activity is affected by Alzheimer's disease (AD). We hypothesized that the level of irreversibility would be compromised in AD, signaling a fundamental shift in the collective properties of brain activity toward equilibrium dynamics. We investigated the irreversibility from resting-state fMRI and EEG data in male and female human patients with AD and elderly healthy control subjects (HCs). We quantified the level of irreversibility and, thus, proximity to nonequilibrium dynamics by comparing forward and backward time series through time-shifted correlations. AD was associated with a breakdown of temporal irreversibility at the global, local, and network levels, and at multiple oscillatory frequency bands. At the local level, temporoparietal and frontal regions were affected by AD. The limbic, frontoparietal, default mode, and salience networks were the most compromised at the network level. The temporal reversibility was associated with cognitive decline in AD and gray matter volume in HCs. The irreversibility of brain dynamics provided higher accuracy and more distinctive information than classical neurocognitive measures when differentiating AD from control subjects. Findings were validated using an out-of-sample cohort. Present results offer new evidence regarding pathophysiological links between the entropy generation rate of brain dynamics and the clinical presentation of AD, opening new avenues for dementia characterization at different levels.
SIGNIFICANCE STATEMENT By assessing the irreversibility of large-scale dynamics across multiple brain signals, we provide a precise signature capable of distinguishing Alzheimer’s disease (AD) at the global, local, and network levels and different oscillatory regimes. Irreversibility of limbic, frontoparietal, default-mode, and salience networks was the most compromised by AD compared with more sensory–motor networks. Moreover, the time-irreversibility properties associated with cognitive decline and atrophy outperformed and complemented classical neurocognitive markers of AD in predictive classification performance. Findings were generalized and replicated with an out-of-sample validation procedure. We provide novel multilevel evidence of reduced irreversibility in AD brain dynamics that has the potential to open new avenues for understating neurodegeneration in terms of the temporal asymmetry of brain dynamics.
Keywords: Alzheimer’s disease, dynamic networks, EEG, fMRI, irreversibility dynamics, machine learning
Introduction
The irreversibility [of time] is the mechanism that brings order out of chaos
(Prigogine and Stengers, 1984)
From physics to biology, the second law of thermodynamics states that closed systems evolve in the direction of entropy increases. A central consequence of the second law is the appearance of an asymmetry in the flow of temporal events that leads to the thermodynamic “arrow of time” (Eddington, 1928; Schrödinger, 1929). Such asymmetry distinguishes between reversible and irreversible/nonequilibrium (Seif et al., 2021). In the context of recent brain studies, large-scale self-organizing brain dynamics evolve away from thermodynamic equilibrium and remain in a healthy regime of multistability (Fingelkurts and Fingelkurts, 2004; Deco et al., 2017; Demirtaş et al., 2019; Luppi et al., 2019; Perl et al., 2021), where a positive correlation exists between neural dynamic complexity and the extent of temporal irreversibility, indicative of an association between healthy brain activity and nonequilibrium dynamics (Deco et al., 2022). Notably, this temporal signature reflects the complexity of the brain's functional organization and has been shown to relate to the level of consciousness (Perl et al., 2021; de la Fuente et al., 2022), cognitive performance (Deco et al., 2021; Lynn et al., 2021; Ibanez, 2022), and certain neuropsychiatric diseases (Zanin et al., 2019).
Across hundreds of studies, Alzheimer's disease (AD) has been characterized by an abnormal decrease in the complexity of brain activity, diminishing the entropy generation rate of neural dynamics (for review, see Sun et al., 2020). These imbalances in neural dynamics affect both cognition (Chand et al., 2018) and the intrinsic connectivity of resting-state networks (RSNs) across temporal levels [electroencephalography (EEG): Dottori et al., 2017] and spatial levels [functional magnetic resonance imaging (fMRI): Moguilner et al., 2021; see also both EEG and fMRI in the same study: Herzog et al., 2022)]. Therefore, the deviation from the expected level of entropy in the healthy brain may also involve substantial deviations from nonequilibrium, making brain dynamics in dementia less irreversible on different spatiotemporal scales. Despite this apparent connection, to our knowledge, no previous study has explored the arrow of time in the brain dynamics of AD patients.
Based on these considerations, we hypothesized that the level of irreversibility (i.e., the temporal asymmetry of brain dynamics and the variability of the global level of irreversibility over time), reflecting the nonstationarity nature of brain signals, would be compromised in AD patients. First, we anticipate that less irreversible brain dynamics would characterize AD across spatial (fMRI) and temporal (EEG) domains, from the global level (large-scale networks) to local regions and including different oscillatory frequency bands. Moreover, we propose that the more endogenous RSNs (i.e., default-mode, limbic, salience, and frontoparietal networks)—usually compromised in AD (Zhou and Seeley, 2014; Badhwar et al., 2017; Kucikova et al., 2021; Meng et al., 2022)—would show less irreversible dynamics than the more exogenous ones (somatosensory, motor, and visual networks) in AD patients. Second, we expect the level of irreversibility to be partially associated with classical neurocognitive markers of AD. We foresee an association of irreversibility with functional connectivity (FC) of RSNs and cognitive impairment. No specific associations would be observed between the level of irreversibility in AD and less transient measures such as brain atrophy. Finally, if less irreversible dynamics are a core signature of AD, the predictive classification power of multimodal irreversibility features (fMRI and EEG) would be similar to or greater than standard disease markers, including brain atrophy, functional brain connectivity, and cognitive deficits. Combining standard markers and irreversibility features would increase the classification power, suggesting that the latter measure provides additional information that the classic markers do not explain. We expect our measures to generalize to other unseen cohorts.
To test these hypotheses, we adopted a theoretical nonequilibrium thermodynamics-inspired framework (Deco et al., 2021, 2022; Perl et al., 2021; de la Fuente et al., 2022) and implemented the associated methods (Fig. 1) to capture the temporal asymmetry of brain dynamics acquired using fMRI and EEG in patients with AD and elderly healthy control subjects (HCs). We assessed the temporal irreversibility by comparing forward and backward time series through time-shifted correlations applied to multimodal neuroimaging data, seeking to identify the brain networks predominantly affected by neurodegeneration and their anatomic and neuropsychological correlates.
Figure 1.
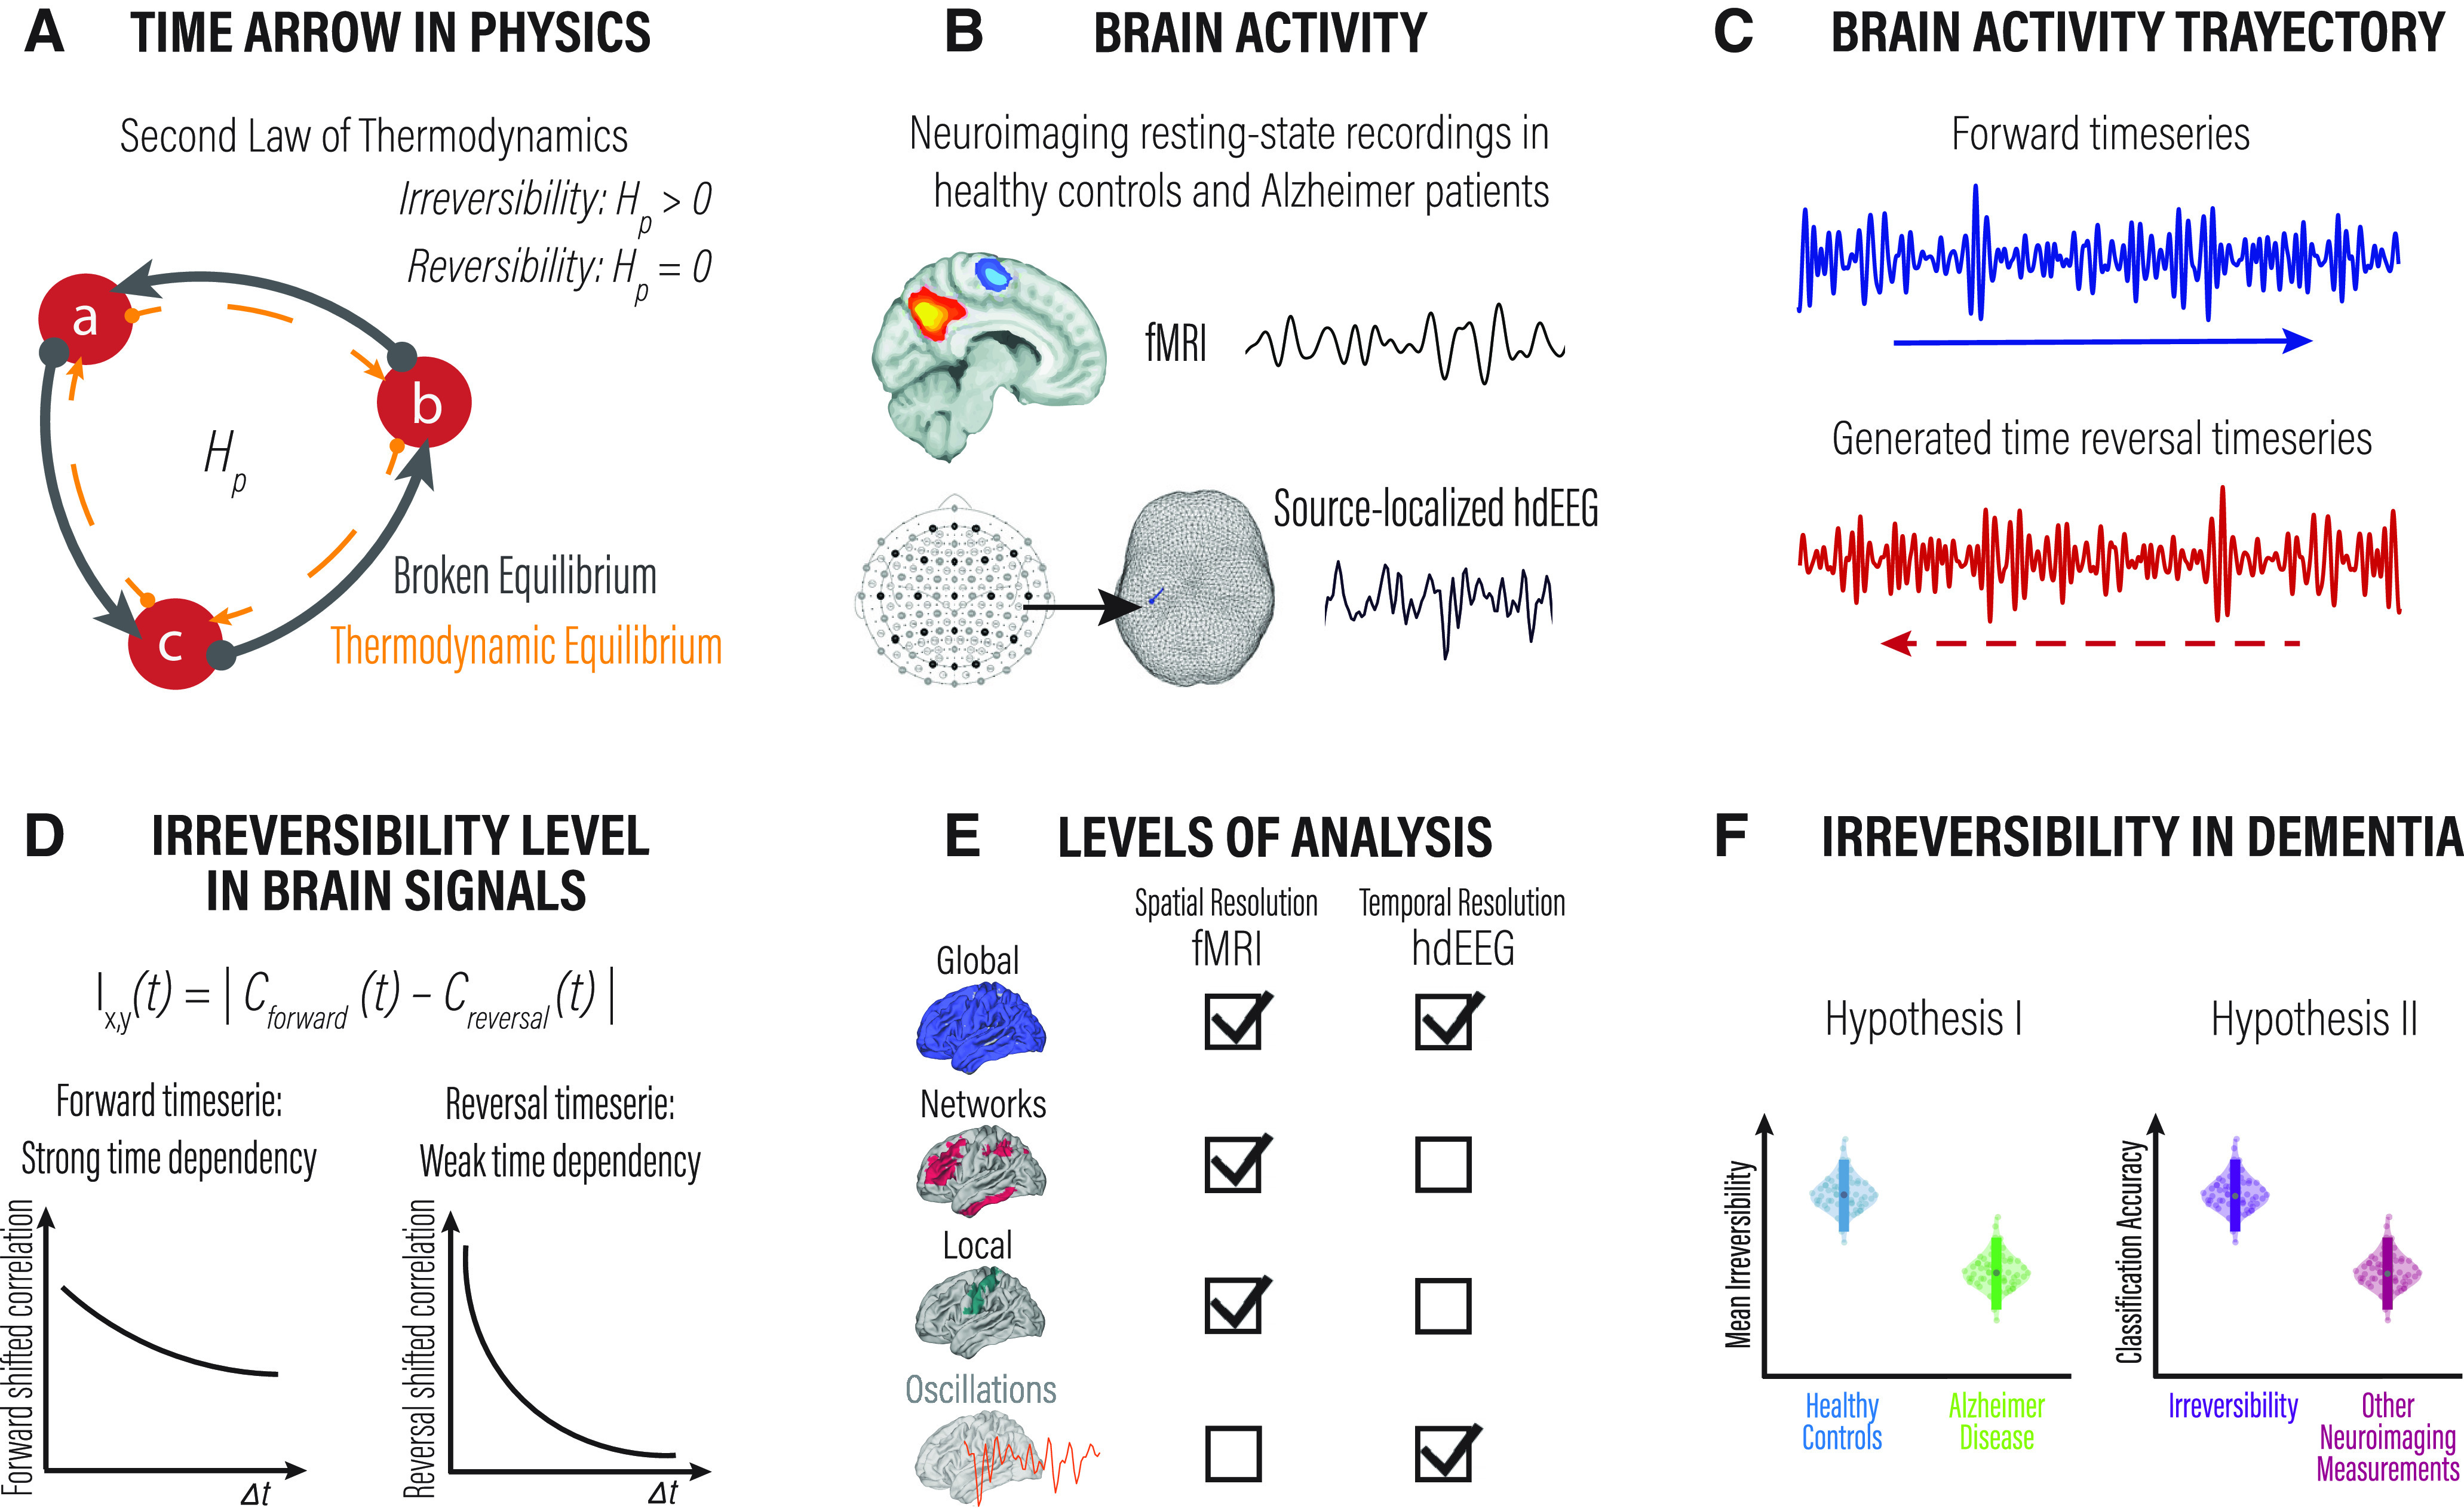
Overview of the framework to estimate the arrow of time in brain dynamics. We used a framework inspired by stochastic thermodynamics to capture the departure from equilibrium in large-scale brain dynamics as a potential distinctive signature of AD. A, The second law of thermodynamics accounts for the energy transfer direction often referred to in the concept of “the arrow of time.” This physical law establishes that the entropy of an isolated system left to spontaneous evolution does not decrease, explaining the irreversibility of natural processes. The panel shows a three-state system and its transitions illustrated by circles and arrows. A system at thermodynamic equilibrium does not produce entropy; therefore, there are no net probability fluxes of transitions between states leading to reversible dynamics. B, We used resting-state fMRI and source-inverted hdEEG data from the same pool of elderly healthy control subjects and Alzheimer's disease patients. Both datasets were parcellated using the AAL atlas. C, From all brain regions in all participants, we extracted the forward brain activity time series and generated the corresponding backward versions. D, The framework estimates the arrow of time (i.e., the level of irreversibility/nonequilibrium) using pairwise and multidimensional time-shifted correlation measurements. The correlation among time series captures the interaction between them. The bottom plots illustrate the interaction among the forward (left) and reversal (right) time series for a given time shift ( ). As can be seen, the correlation declines faster for signals with weak compared with a strong time dependency. E, The level of irreversibility/nonequilibrium was estimated at different spatial scales, from the global coverage of the entire brain, the level of networks, and the local level of individual brain regions. F, Finally, we used this framework to evaluate the irreversibility of neuroimaging data from patients with neurodegeneration. We hypothesized that the arrow of time would be affected by neurodegeneration and that this measure could equal or even surpass standard neuroimaging measures in the classification of neurodegenerative diseases.
Materials and Methods
Participants
We analyzed data from 107 male and female participants, 42 AD patients, and 65 matched elderly HCs, for which resting-state high-density EEG (hdEEG) and fMRI were acquired. Post hoc analyses revealed a calculated statistical power of 0.9898 (1 – β error probability) for the fMRI population sample, and 0.9979 for the hdEEG population sample. Recruitment was conducted in clinical centers in Chile (Geroscience Center for Brain Health and Metabolism, Memory and Neuropsychiatric Clinic, Universidad de Chile; Center for Social and Cognitive Neuroscience, Universidad Adolfo Ibáñez) and Argentina (Centro de Neurociencias Cognitivas, Universidad de San Andres) as part of an ongoing EEG/fMRI approach (Donnelly-Kehoe et al., 2019; Salamone et al., 2021; Birba et al., 2022; Legaz et al., 2022) led by BrainLat (Latin American Brain Health Institute; Duran-Aniotz et al., 2022). Consensus groups diagnosed participants with AD following National Institute of NINCDS (National Institute of Neurological and Communicative Disorders and Stroke)–ADRDA (Alzheimer's Disease and Related Disorders Association) clinical criteria (McKhann et al., 1984; 2011). Diagnoses were supported by an extensive battery of neurologic and neuropsychiatric assessments (Piguet et al., 2011; Baez et al., 2014; Melloni et al., 2016; Santamaría-García et al., 2017), conducted in line with the Multi-Partner Consortium to Expand Dementia Research in Latin America (ReDLat) protocol (Ibanez et al., 2021a, b; Maito et al., 2023). Participants with a history of neurologic disorders, primary language deficits, psychiatric disorders, or substance abuse were excluded. Table 1 reports demographic information for the fMRI, hdEEG, and matched samples, respectively. The relevant Institutional Review Boards approved the study, and all participants provided written informed consent before participation following the Helsinki declaration, National Institutes of Health guidelines, and local regulations.
Table 1.
Demographics and cognitive performance
| HCs | AD patients | Statistics | |
|---|---|---|---|
| fMRI sample | N = 65 | N = 42 | |
| Gender (F/M) | 41/24 | 26/16 | |
| Age (mean ± SD) | 69.92 ± 7.89 | 76.85 ± 7.46 | |
| Education (mean years) | 14.89 | 10.45 | |
| MoCA (mean) | 25.95 | 15.53 | |
| hdEEG sample | N = 25 | N = 28 | |
| Gender (F/M) | 15/10 | 17/11 | |
| Age (mean ± SD) | 72.16 ± 6.70 | 76.53 ± 7.61 | |
| Education (mean years) | 13.6 | 9.89 | |
| MoCA (mean) | 25.15 | 16.36 | |
| Matched sample | N = 22 | N = 22 | |
| Gender (F/M) | 13/9 | 13/9 | = 0; |
| Age (mean ± SD) | 71.86 ± 6.94 | 76.18 ± 7.7 | |
| Education (mean years) | 13.13 | 10 | |
| MoCA (mean) | 25.35 | 16.36 |
F, Female; M, male. Data presented for fMRI, hdEEG, and Matched samples. Categorical variables were analyzed using Pearson’s χ2 test, and continuous variables were assessed using ANOVA with an level of 0.05.
Participants for out-of-sample validation
For out-of-sample validation, we used data from the Alzheimer’s Disease Neuroimaging Initiative (ADNI) database (https://adni.loni.usc.edu/). We analyzed resting-state fMRI data from 206 participants, 91 AD patients, and 115 elderly HCs. Both clinical groups were matched in age, gender, and years of education (Table 2).
Table 2.
Demographics and cognitive performance for the ADNI cohort for out-of-sample validation procedures
| Out-of-sample fMRI-ADNI |
HCs (N = 115) | AD patients (N = 91) |
Statistics |
|---|---|---|---|
| Gender (F/M) | 59/56 | 38/53 | |
| Age (mean ± SD) | 72.75 ± 8.51 | 73.62 ± 7.95 | |
| Education (mean years) | 15.75 | 15.41 | |
| MoCA (mean) | 24.24 | 14.23 |
Categorical variables were analyzed using Pearson's χ2 test, and continuous variables were assessed using ANOVA with an α level of 0.05.
Neuropsychological assessment
The overall cognitive state of the participants was examined using the Montreal Cognitive Assessment (MoCA; Nasreddine et al., 2005). The MoCA evaluates multiple cognitive domains, including attention, concentration, orientation, memory, language, executive functions, visuospatial skills, abstraction, and calculation.
Neuroimaging data acquisition and preprocessing
hdEEG
Electrical brain signals were recorded using a Faraday cage with a 128-channel 24 bit resolution system (Active Two, Biosemi) located according to the radial electrode placement system and sampled at 1024 Hz while participants sat still and awake with their eyes closed. Two electrodes placed at the right and left mastoids served for offline rereference. Electrodes at periocular locations served to control for blinks and eye movements. Analog filters were applied at 0.03 and 100 Hz to the raw hdEEG data. Recordings were then bandpass filtered between 0.5 and 40 Hz using a zero-phase shift Butterworth filter, rereferenced to the average of all channels, and downsampled to 512 Hz. Malfunctioning electrodes were removed, and their values were estimated from neighboring electrodes using weighted spherical interpolation. Artifacts induced by eye movements were corrected using independent component analysis (Kim and Kim, 2012) and a visual inspection protocol (Schandry and Montoya, 1996; Dirlich et al., 1997; Pollatos and Schandry, 2004; Terhaar et al., 2012; García-Cordero et al., 2017; Yoris et al., 2017, 2018; Salamone et al., 2018). Recording and preprocessing of resting-state data followed current standards for multicentric connectivity studies in dementia harmonization regarding recording procedures, data acquisition Brain Imaging Data Structure (BIDS), preprocessing pipeline (denoising, artifact removal, spatial normalization, data normalization), and connectivity at the source space (Prado et al., 2022). All data and statistical analyses were performed using custom code written in MATLAB (MathWorks) following standard procedures (García-Cordero et al., 2017; Yoris et al., 2017, 2018; Mikulan et al., 2018; Salamone et al., 2018; Josefsson et al., 2019; Amoruso et al., 2022; Legaz et al., 2022).
EEG source space
We used the standardized Low-Resolution Electromagnetic Tomography (sLORETA) method (Pascual-Marqui et al., 1994) to estimate the neural sources of the hdEEG recordings. sLORETA computes the standardized current density at each of 2394 voxels located in the cortical gray matter and the hippocampus of a reference brain (MNI 305, Brain Imaging Center, Montreal Neurologic Institute) based on the linear, weighted sum of the scalp electric potentials. The electrodes layout was registered onto the scalp MNI152 coordinates, with landmarks for registering the electrodes located at the nasion, inion, the left preauricular point, and the right preauricular point. The locations of landmarks and recording electrodes were expressed in millimeters using the Cartesian coordinate system. To calculate the transformation matrix sLORETA (direct operator for the inverse solution problem), we used a regularization method with a signal-to-noise ratio of 1. The standardized current densities maps were obtained using a three-shell spherical head model registered to the Talairach space and parcellated using the Automated Anatomical Labeling (AAL; Tzourio-Mazoyer et al., 2002), removing subcortical regions. Time-varying current densities computed at each time point were averaged among voxels belonging to the same AAL region, such that a single (mean) time series was obtained for each cortical region (Prado et al., 2022).
fMRI recordings
Data were acquired at two different centers following Organization for Human Brain Mapping (OHBM) recommendations (Smith et al., 2013; Nichols et al., 2017; Poldrack et al., 2017) with the following parameters.
Center 1.
Imaging was performed on a 3 T system (Skyra, Siemens) with a standard head coil. T1-rapid gradient echo volumes, parallel to the plane connecting the anterior and posterior commissures, were acquired with the following parameters: repetition time (TR) = 1700 ms; echo time (TE) = 2000 ms; flip angle = 8°; 208 slices; matrix dimension = 224 × 224 × 208; voxel size = 1 × 1 × 1 mm. Functional ep2d_bold pulse sequences (parallel to the anterior–posterior commissures) covering the whole brain were acquired sequentially intercalating pair-ascending first with the following parameters fMRI parameters: TR = 2660 ms; TE = 30 ms; flip angle = 90°; 46 slices; matrix dimension = 76 × 76 × 46; voxel size in plane = 3 × 3 × 3 mm; slice thickness = 3 mm; sequence duration = 13.3 min; number of volumes = 300.
Center 2.
Imaging was performed on a 3-T Phillips system with a standard head coil. T1-rapid anatomic 3D gradient echo volumes were acquired parallel to the plane connecting the anterior and posterior commissures, with the following parameters: TR = 8300 ms; TE = 3800 ms; flip angle = 8°; 160 slices; matrix dimension = 224 × 224 × 160; voxel size = 1 × 1 × 1 mm. Functional spin echo volumes (parallel to the anterior–posterior commissures) covering the whole brain were sequentially and ascendingly acquired with the following parameters: TR = 2640 ms; TE = 30 ms; flip angle = 90°; 49 slices; matrix dimension = 80 × 80 × 49; voxel size in plane = 3 × 3 × 3 mm; slice thickness = 3 mm; sequence duration = 10 min; number of volumes = 220.
fMRI preprocessing
The data were preprocessed using the Data Processing Assistant for Resting-State fMRI (DPARSF version 2.3), an open-access toolbox with a standardized pipeline that uses Statistical Parametric Mapping software (SPM12) and the Resting-State fMRI Data Analysis Toolkit (REST version 1.7). The first five volumes of each subject’s resting-state recording were discarded to ensure that magnetization achieved a steady state. The preprocessing included slice-timing correction (using the middle slice of each volume as the reference scan) and realignment to the first scan of the session to correct head movement (implemented in SPM12; García-Cordero et al., 2016). Six motion parameters were regressed out: CSF and white matter (WM) signals to reduce potential effects of movement-related, physiological, and cardiorespiratory effects (REST version 1.7 toolboxes). Motion parameters were estimated during realignment, and CSF and WM masks were derived from the tissue segmentation of each subject’s T1 scan in native space with SPM12 (after coregistration of each subject’s structural image with the functional image). None of the participants showed head movements >3 mm and/or rotations >3°. Finally, images were normalized to the MNI space using the echoplanar imaging template from SPM12, smoothed using an 8 mm full-width-at-half-maximum (FWHM) isotropic Gaussian kernel, and bandpass filtered between 0.01 and 0.1 Hz to correct and remove low-frequency drifts from the MRI scanner. Data were parcellated with the AAL (AAL90; Tzourio-Mazoyer et al., 2002). There is substantial disagreement on global signal regression (GSR) in fMRI preprocessing. Given the potential bias that can be introduced in data analysis, we choose not to remove it. We based our decision on growing evidence supporting that GSR contains valuable information, including signals that correlate with electropshysiological sources and with vigilance fluctuations, among other signals of neurobiological relevance (Schölvinck et al., 2010; Wong et al., 2013; Chang et al., 2016; Wen and Liu, 2016; Liu et al., 2017; Turchi et al., 2018).
Atrophy maps
MRI acquisition and preprocessing are reported following OHBM recommendations (Smith et al., 2013; Nichols et al., 2017; Poldrack et al., 2017). Whole-brain T1-rapid anatomic three-dimensional gradient echo volumes were acquired. For voxel-based morphometry (VBM) analysis, data were processed on the DARTEL Toolbox following validated procedures (Ashburner and Friston, 2000; García-Cordero et al., 2016; Sedeño et al., 2017) via SPM12 (https://www.fil.ion.ucl.ac.uk/spm/software/spm12/). T1-weighted images in native space were segmented using the default parameters of the SPM12 (bias regularization, 0.001; bias FWHM, 60 mm cutoff) into gray matter, white matter, and CSF. These three tissues were used to estimate the total intracranial volume (TIV). The DARTEL module was run using the gray matter-segmented and white matter-segmented images to create a template from the complete dataset (increasing the intersubject alignment accuracy; Ashburner, 2007). Next, the DARTEL Tool “Normalize to MNI Space” was used to register the last template from the previous step in MNI space. This transformation was applied to bring all the gray matter-segmented scans to standard space. Subsequently, all images were modulated to correct volume changes by Jacobian determinants and to avoid bias in the intensity of an area because of its expansion during warping. Finally, data were smoothed using a 10 mm FWHM isotropic Gaussian kernel to accommodate anatomic intersubject variability. The size of the kernel was selected based on previous recommendations (Ashburner and Friston, 2000; Burton et al., 2004). To analyze all images together, avoiding a scanner effect, the normalized and smoothed DARTEL images were transformed into w-score (Jack et al., 1997; La Joie et al., 2012; Ossenkoppele et al., 2015; Chung et al., 2017; van Loenhoud et al., 2017). w-Scores represent the degree to which the observed gray matter volume in each voxel is higher or lower than expected, based on an individual’s global composite score adjusted for specific covariates (age, TIV, and scanner type). w-Scores were calculated by dividing each participant’s observed and predicted gray matter volume (residuals) by their SD. The resulting w-score maps of each subject were used for further analyses.
Method for determining levels of irreversibility/nonequilibrium
The level of irreversibility relies on the key idea of detecting the arrow of time through the degree of asymmetry obtained by comparing the lagged correlation between pairwise time series (i.e., the forward and the artificially generated reversed backward version). Figure 1 presents the general framework used to estimate the arrow of time and to provide a distinctive signature of health and disease in human brain recordings.
The detection of the level of irreversibility (i.e., the arrow of time) between two time series (t) and (t) requires creating the backward version of the time series. The reversed backward version of [t or (t)], that we call [or ], is obtained by flipping the time ordering [i.e., by ordering the time evolution of (or )] as the inverted sequence determined the initial state and final states. The potential causal dependency between the time series (t) and (t) is measured through the time-shifted correlation (Deco et al., 2022). The extent to which the forward and reversed time series are distinguishable determines the reversibility/equilibrium level. Therefore, when the forward and reversed time series are not distinguishable, the system is reversible and in equilibrium, whereas when the level of distinguishability increases, the system becomes more irreversible and closer to nonequilibrium.
For each participant, we extracted forward BOLD time series from the AAL parcellation using sliding windows of 20 TRs, which were then shifted 1 TR forward (2.6 s, according to the acquisition parameter). We chose a time window of 20 TRs because it allows a good balance between sensitivity and specificity in detecting dynamic changes in correlations (Lindquist et al., 2014). However, we tested our approach with different TRs (30, 40, and 50 TRs).
The same strategy was applied to the source-localized broadband-filtered (0.5–40 Hz) EEG data but shifted 2 TRs forward (∼4 ms). EEG time series were also filtered in the five canonical frequency bands [i.e., δ, 0.5–4 Hz; theta, 4–8 Hz; alpha, 8–12 Hz; beta, 12–30 Hz; and gamma, 30–40 Hz), with the following time shift length: Δt = 15, 7, 5, 3, and 2, respectively. The time shift lengths were defined as a function of the decay of the signal autocorrelation. Then, we generated the backward version of each sliding window by reversing them in time. For the forward evolution, the time-shifted correlation is given by the following:
And for the reversed backward evolution, the time-shifted correlation is given by the following:
The pairwise level of irreversibility (i.e., the degree of temporal asymmetry capturing the arrow of time) is given consequently by the absolute difference between these two time series in the forward and reversed backward evolution, at a given shift Δt = T, as follows:
The level of irreversibility/nonequilibrium for the global/multidimensional case can be generalized by defining the forward and reversal matrices of time-shifted correlations. Let indicate the forward version of a multidimensional time series reflecting the dynamic evolution of the variable describing the system. In this case, the subindex i denotes the different dimensions of the dynamic system (i.e., the brain regions). Let us denote with the corresponding reversed backward version. Then, and refer to the forward time series in regions i and j, and and to the reversed backward time series, both time shifted. The forward and reversal matrices expressing the causal dependencies between the different variables for the forward and artificially generated reversed backward version of the multidimensional system are given by the following:
The FS functional dependency matrices are expressed as the mutual information based on the respective time-shifted correlations. The level of irreversibility is given by the quadratic distance between the forward and reversal time-shifted matrices at a given shift . In other words, the level of irreversibility in the multidimensional case is given by the following:
Where the notation is defined as the mean value of the absolute squares of the elements of the matrix Q. In other words, if we define a difference matrix in the following way:
Then, the elements of the matrix are the square of the elements of the matrix where for each pair, the level of irreversibility is measured by the squared difference. Thus, is simply the mean value of the elements of . We also computed the SD of the elements of the matrix . The level of irreversibility for the local (nodal) case was estimated as the following:
fMRI functional connectivity
The functional connectivity are matrices of Pearson correlation coefficients across the entire duration of the BOLD time series of the 90 AAL brain regions (Friston, 1994).
EEG functional connectivity
Functional interaction between brain regions within a set frequency band was estimated using EEG coherence analysis. Coherence estimates relative amplitude and phase consistency among all pairs of data channels (Srinivasan et al., 2007).
Statistical analyses
Categorical variables (i.e., gender) were analyzed using Pearson's χ2 test, and continuous variables (i.e., age, years of education, and cognitive performance) were assessed using ANOVA. Demographic differences were controlled by performing a multivariate linear regression analysis on irreversibility at the global level. Differences between conditions in irreversibility were statistically assessed across subjects and across brain regions using the Wilcoxon rank-sum method. Additionally, we used the false discovery rate (FDR) at the 0.05 significance level to correct multiple comparisons (Hochberg and Benjamini, 1990). Changes in irreversibility at the network and local level were also assessed using Cohen’s d effect size, which measures the effect size in terms of the difference between the means of two populations (μ1, μ2) and the pooled SDs (s) as follows: . Following a standard criterion to relate Cohen’s d values to the effect size, d < 0.2 is considered a very low effect size, while d > 0.8 represents a very high effect size (Sawilowsky, 2009). Correlations between the irreversibility measurements with atrophy, cognitive performance, and functional connectivity were tested with Pearson’s R test and the associated p-values (with Benjamini–Hochberg correction). Subjects with irreversibility values that were more than three scaled median absolute deviations from the median were excluded from the analysis.
Random forest classifier
The fitcensemble MATLAB function was used with default parameters to train a random forest classifier with the purpose of distinguishing between the groups of participants. To perform cross-validation, the dataset was randomly partitioned with stratification of k = 5. Then, the model was fitted using four of these groups (training/test = 80/20), and its performance was tested using the group that remained. This procedure was repeated 50 times to obtain distributions and average measures of performance. The features used were the following: EEG irreversibility (NR); fMRI NR, fMRI, and hdEEG NR (combined); mean FC, atrophy, cognitive performance (MoCA results); all brain functional measurements (EEG/fMRI NR, FC); and multimodal measurements (EEG/fMRI NR, FC, atrophy, and cognitive performance). Missing data were estimated using the weighted K-nearest neighbors (KNNimpute; Troyanskaya et al., 2001), with k = 5. KNNimpute is a weighting procedure that exploits the correlation between a missing value and the available data, quantified using the support vector regression method. Classification performance was estimated using the receiver operating characteristic (ROC) area under the curve (AUC), precision, sensitivity, specificity, accuracy, and F-score metrics (Fawcett, 2006).
Results
Alzheimer's disease is associated with significant changes in the level of irreversibility/nonequilibrium in multimodal spatiotemporal dynamics
First, we explored whether the arrow of time estimated from fMRI was compromised in AD at a global level and whether the level of irreversibility/nonequilibrium could distinguish between HCs and AD patients. We found that the irreversibility in neural dynamics differentiated HCs from AD patients (Fig. 2A, left panels; p < 0.001, Wilcoxon rank-sum test, FDR corrected). In addition, we found that the variability of the global level of irreversibility over time was also distinguished between conditions (Fig. 2A, right panels; p < 0.001, Wilcoxon rank-sum test, FDR corrected). We further complemented these results using the source-localized hdEEG data filtered in the five canonical frequency bands (all p < 0.05, Wilcoxon rank-sum test, FDR corrected: delta, 0.5–4 Hz; theta, 4–8 Hz; alpha, 8–12 Hz; beta, 12–30 Hz; and gamma, 30–40 Hz), with a time shift length according to the frequency band (TR = 15, 7, 5, 3, and 2, respectively). We observed significant differences between groups at all frequency bands (Fig. 2B). In addition, we calculated the cross-modal correlation coefficient of the global irreversibility level and found no relationship (HC + AD: R = 0.04, p < 0.08.033; HC: R = 0.04, p < 0.8651; AD: R = 0.04, p < 0.8637).
Figure 2.
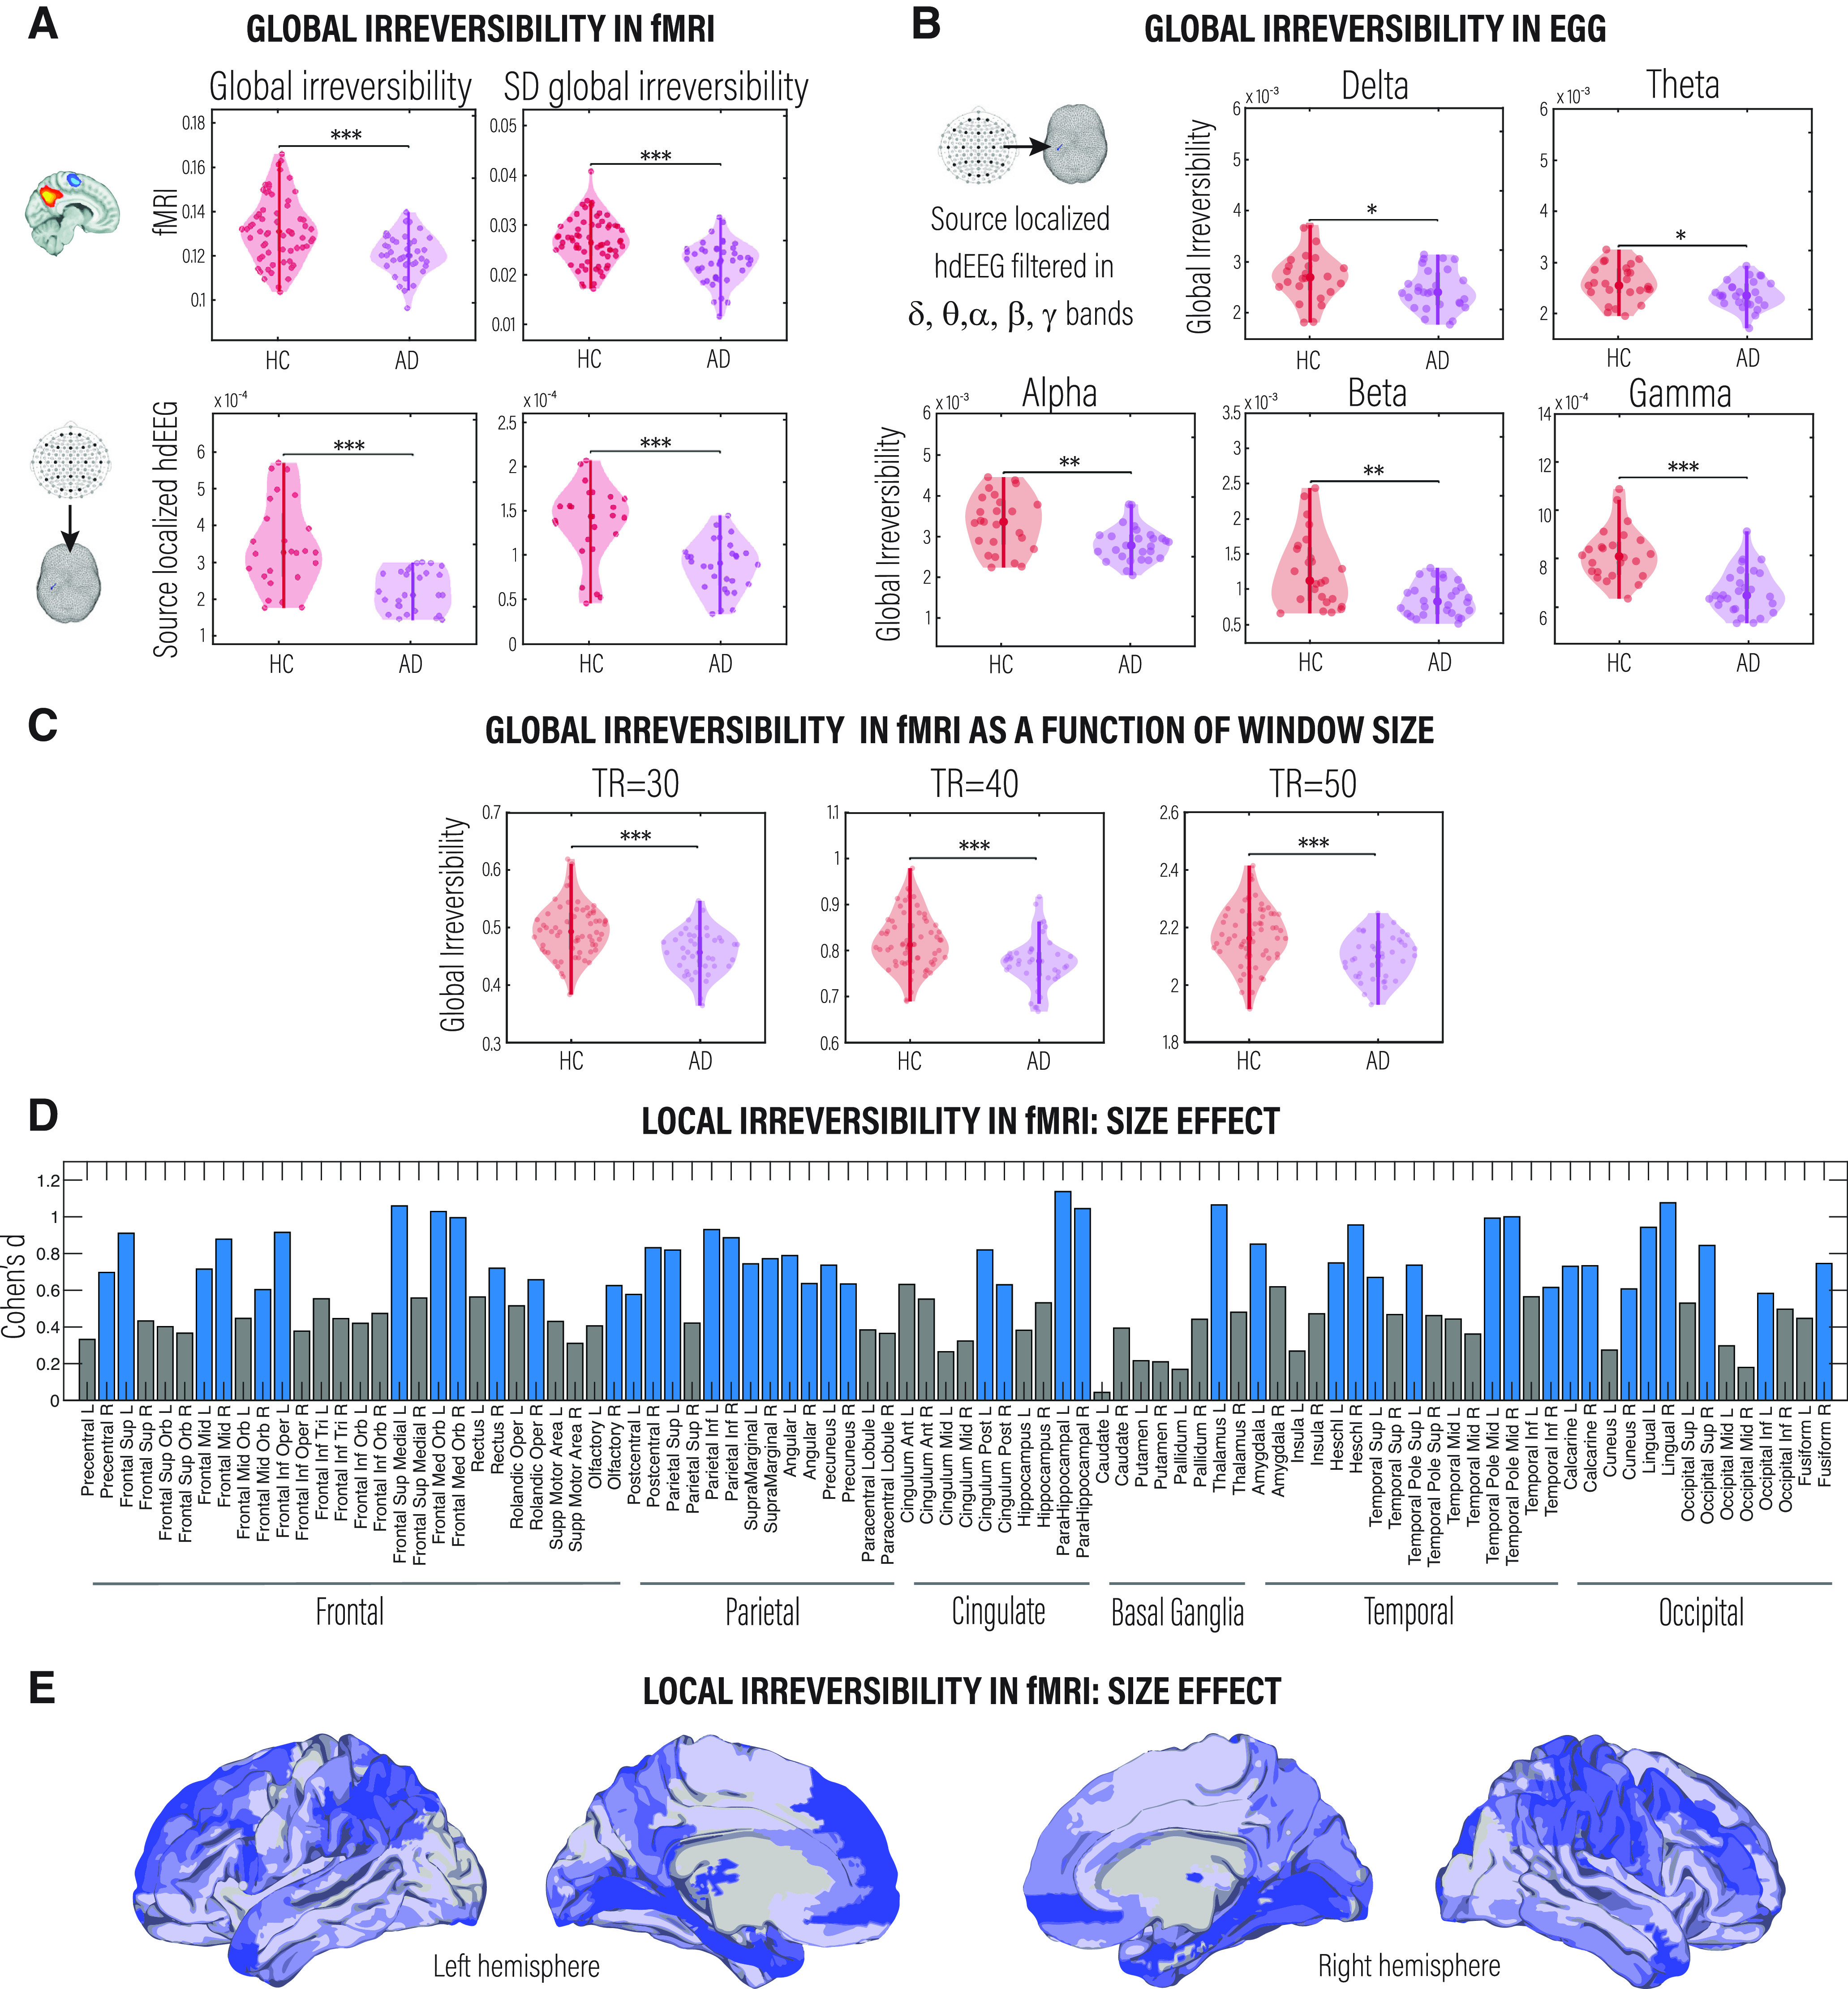
Irreversibility/nonequilibrium in large-scale brain signals as a signature of neurodegenerative diseases. A, Shows the global level of irreversibility and the variability of the global level of irreversibility for HCs compared with AD patients estimated in fMRI (top left and top right, respectively) and source-localized hdEEG data, broadband filtered (0.5–40 Hz; bottom left and bottom right, respectively). B, Comparison of the proximity to nonequilibrium brain dynamics between conditions for the source-localized hdEEG dataset filtered in frequency bands (delta, theta, alpha, beta, and gamma). All p-values were estimated using the Wilcoxon rank-sum test and FDR corrected for multiple comparisons with an α level of 0.05; *p < 0.05, **p < 0.01, and ***p < 0.001. C, Global irreversibility as a function of the window size (time length) in which the forward BOLD time series were extracted. D, Rendering of the effect size (estimated by Cohen’s d) of the level of the irreversibility of brain activity at each node defined by the AAL atlas. Blue bars indicate brain regions showing significant differences (p < 0.01, Wilcoxon rank-sum test, FDR corrected) between HCs and AD patients. E, As in C, the brain plots show the effect size (estimated by Cohen’s d) of the level of the irreversibility of brain activity at each node.
To rule out that our results depend on the length of the time window of BOLD time series, we estimated the level of irreversibility using three different TRs (30, 40, and 50) and replicated previous results (Fig. 2C). We also ruled out the possible influence of age and education (Table 1) on the results; we applied a multivariate linear regression analysis on irreversibility at the global level. This procedure replicated previous global results for the fMRI and EEG samples (p < 0.001, Wilcoxon rank-sum test; fMRI: r = 0.9877, p < 0.001; EEG: r = 0.9993, p < 0.001), suggesting that although temporal asymmetry in brain dynamics might be related to demographic variables, such as age and education, the level of irreversibility reflected changes mainly based on brain dynamics.
To capture the irreversibility/nonequilibrium changes at the node level, we applied the framework at each BOLD time series extracted from the AAL parcellation. We observed that the difference in irreversibility was significantly higher in bilateral frontal and temporoparietal regions in HCs than in AD patients. Figure 2D shows the magnitude of this difference, and Figure 2E highlights the areas presenting significant differences between conditions (p < 0.01, Wilcoxon rank-sum test, FDR corrected). Finally, to explore whether the size of the ROIs explains their level of irreversibility, we correlated the irreversibility at the local level with the size of each ROI (estimated as the number of voxels) and found that there is no relationship between them for any of the two conditions or techniques (HCs: fMRI, R = −0.00096047, p < 0.41202; EEG, R = 0.015287, p < 0.3658; AD patients: fMRI, R = −0.0031627, p < 0.50 261; EEG, R = 0.010345, p < 0.35 476).
Selective compromise of irreversibility across critical networks involved in neurodegeneration
Beyond the global and local analyses, we investigated the differences in the level of irreversibility associated with seven RSNs. To do so, we applied the same framework for the global level in the BOLD time series but now restricted it to brain regions in each of the seven RSNs.
The RSNs we considered involve some that are typically impaired in AD (i.e., limbic, frontoparietal, DMN, and salience) as well as other that act as control (i.e., somatosensory, visual, motor). We found decreases in the irreversibility level in AD patients compared with HCs only in networks known to be affected by AD: limbic, frontoparietal, DMN, and salience networks, which are also more endogenous networks (less driven by the external environment). Conversely, no significant differences were found in primary sensorimotor networks (visual, somatosensory, and motor networks). This result suggests that the impairment in sustaining the nonequilibrium is evident in the selective physiopathology of ADs, indexing different signatures in the balance of intrinsic and extrinsic brain dynamics. Figure 3A shows the differential responses between HCs and AD patients for the RSN by presenting boxplots (p < 0.05, Wilcoxon rank-sum test, FDR corrected). Figure 3B presents a combined radar plot illustrating the effect size of the different levels of irreversibility for each resting-state network.
Figure 3.
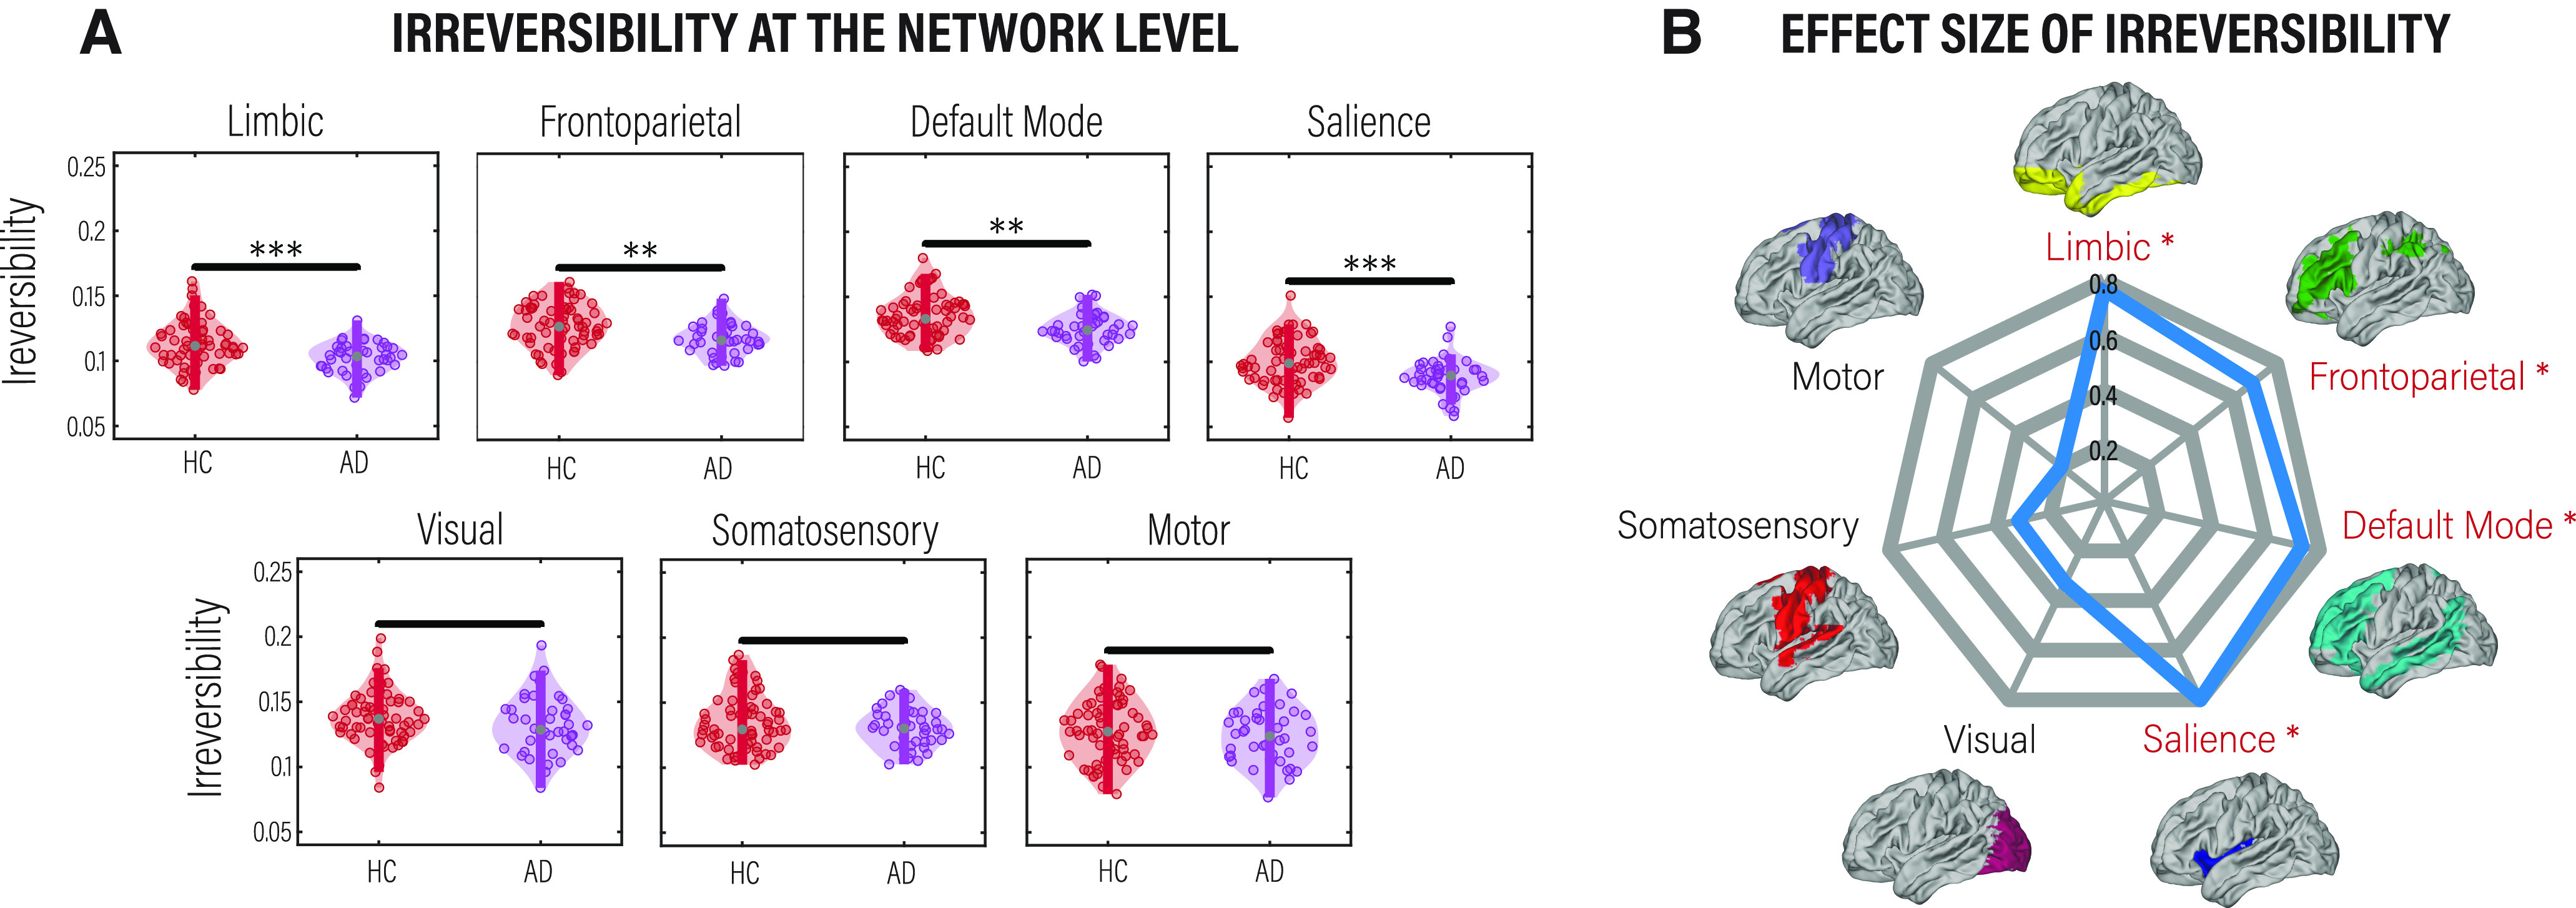
Level of irreversibility/nonequilibrium in fMRI resting-state networks. We followed the same procedure used in the global analysis but now in each subset of regions belonging to each of the seven networks. A, Comparison of the level of irreversibility for each network between HCs and AD patients. p-values were estimated using the Wilcoxon rank-sum test and FDR corrected for multiple comparisons with an α level of 0.05. **p < 0.01 and ***p < 0.001. B, Rendering of the effect size assessed by Cohen’s d. Names in red with an asterisk indicate networks showing significant differences between conditions.
Associations of irreversibility with neurocognitive markers of Alzheimer’s disease
Since AD is usually associated with specific patterns of atrophy, cognitive deficits, and alterations in functional connectivity, we explored whether the extent of irreversibility in the dynamics—estimated from both fMRI and EEG—was related to these variables. First, we related the irreversibility at the node level to atrophy, estimated as gray matter volume. We found a significant correlation between irreversibility and atrophy for HCs (fMRI: R = 0.19, p < 0.001; EEG: R = 0.06, p < 0.0185; FDR corrected) but not for AD patients (fMRI: R = 0.01, p < 0.6532; EEG: R = 0.01, p < 0.7899; FDR corrected), suggesting that the emergence of the arrow of time in brain dynamics is not primarily linked to atrophy in AD (Fig. 4A). Then, we explored the association with the mean functional connectivity, for which no significant results were found for HCs (fMRI: R = 0.06, p < 0.6546; EEG: R = 0.19, p < 0.3724; FDR corrected) and for AD patients (fMRI: R = −0.22, p < 0.1566; EEG: R = −0.16, p < 0.4101; FDR corrected; Fig. 4B). We then investigated the correlation between global irreversibility and cognitive performance using the MoCA. The results showed a significant correlation between the two measures in AD patients (fMRI: R = 0.36, p < 0.0012; EEG: R = 0.19, p < 0.3724; FDR corrected) but not in HCs (fMRI: R = 0.01, p < 0.9592; EEG: R = −0.16, p < 0.4101; FDR corrected; Fig. 4C). Finally, we restricted the association of irreversibility, atrophy, and FC to each of the seven RSNs and found solely a correlation between the irreversibility and atrophy in brain regions belonging to the salience network (R = 0.24, p < 0.2806, FDR corrected) in AD patients (Fig. 4D,E). No significant associations were found between the other RSNs and atrophy or functional connectivity levels.
Figure 4.
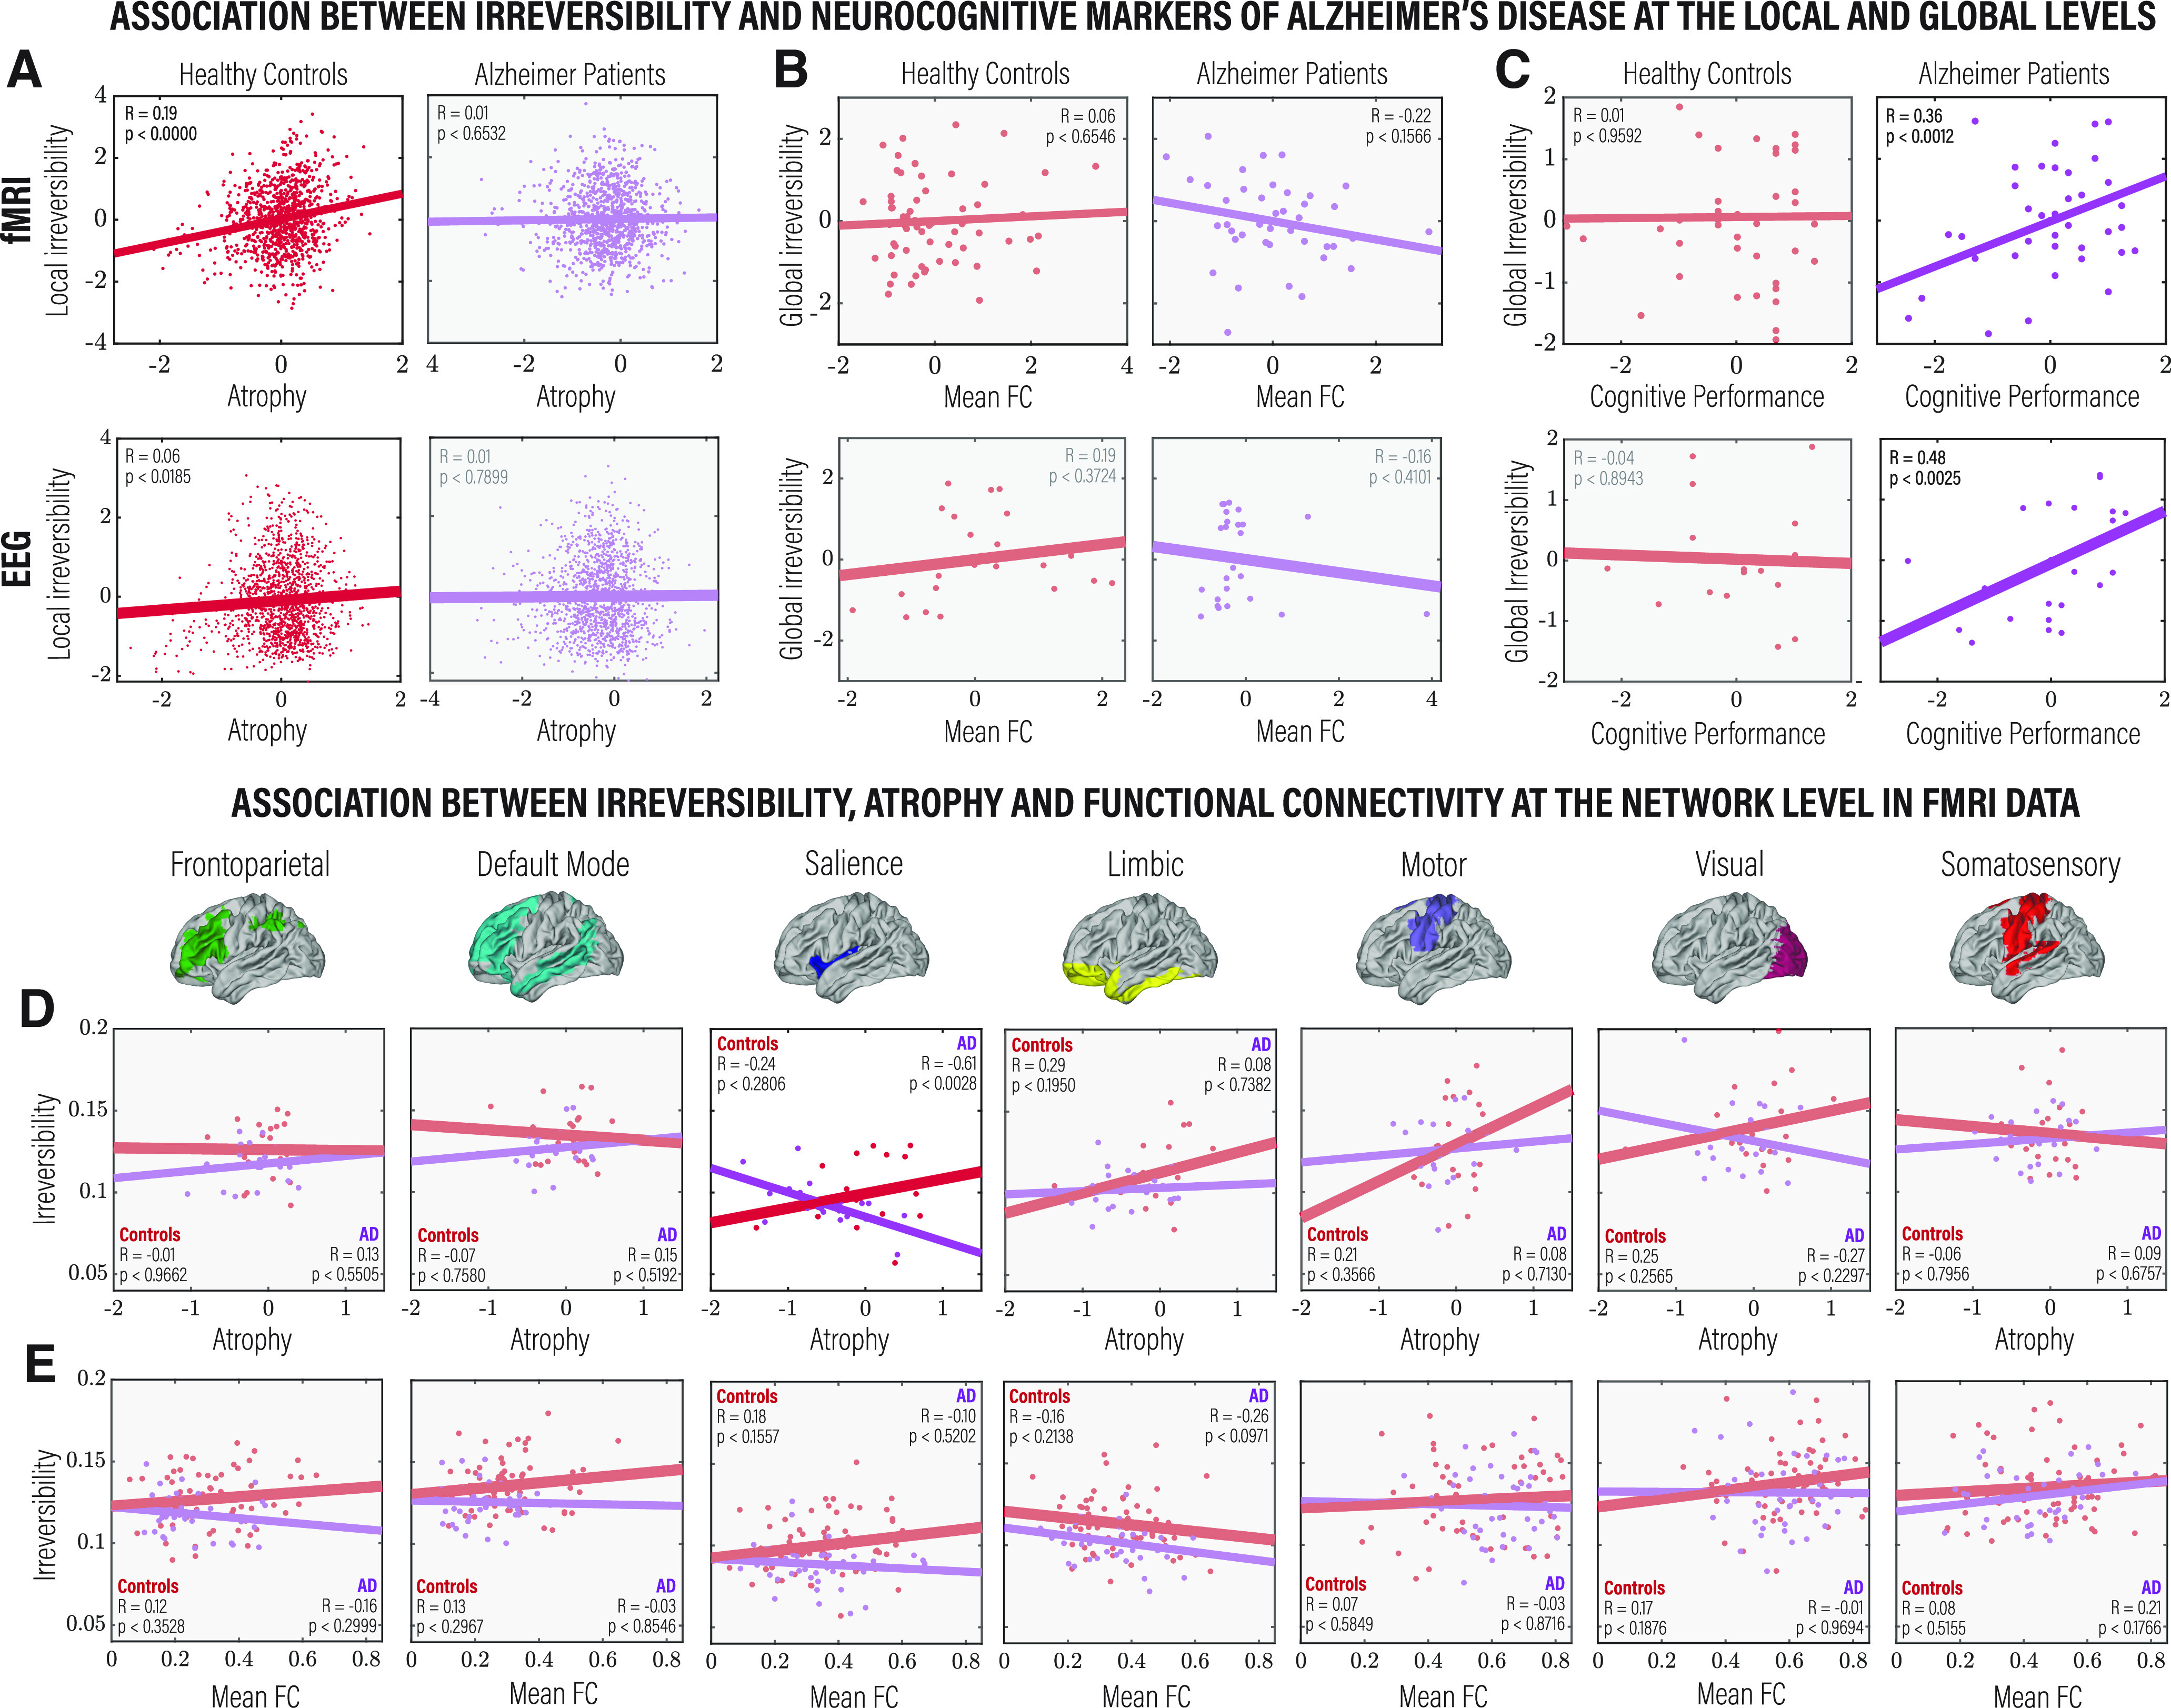
Comparison between levels of irreversibility estimated from fMRI and source-localized hdEEG data and standard structural, functional, and behavioral measurements, as well as with the local, global, and network levels. A, Correlation between irreversibility and gray matter volume (w-scores) at the node level in brain areas showing a significant difference in irreversibility between HCs and AD patients, for HCs (left) and AD patients (right), and for fMRI (top) and hdEEG (bottom). B, Association between global irreversibility and mean FC. C, Correlation between global irreversibility and cognitive performance estimated using the MoCA. D, Correlation between irreversibility and gray matter volume (w-scores) for each of the seven RSNs between HCs and AD patients. E, Association between global irreversibility and mean functional connectivity. All metrics are reported in z scores. Pearson’s R and the associated p-values are reported for each comparison and were FDR corrected for multiple comparisons with an α level of 0.05.
Comparing the selective and combined classification power of irreversibility dynamics with standard neurocognitive markers
Given the capacity of the irreversibility measure to distinguish between AD and HCs, we focused on its predictive power for classification accuracy. We tested the predictive power of the irreversibility measure in each modality against and in conjunction with other structural, functional, behavioral, and demographic measurements. The results revealed that the reversibility of the arrow of time estimated from fMRI and source-inverted hdEEG time series outperformed hdEEG/fMRI FC and atrophy measurements (Fig. 5A). Moreover, the highest classification was obtained by combining multimodal features, which suggests that irreversibility is a strong predictor of AD and brings information not covered by classical neurocognitive measures. Figure 5B presents the classification performance with multiple metrics.
Figure 5.
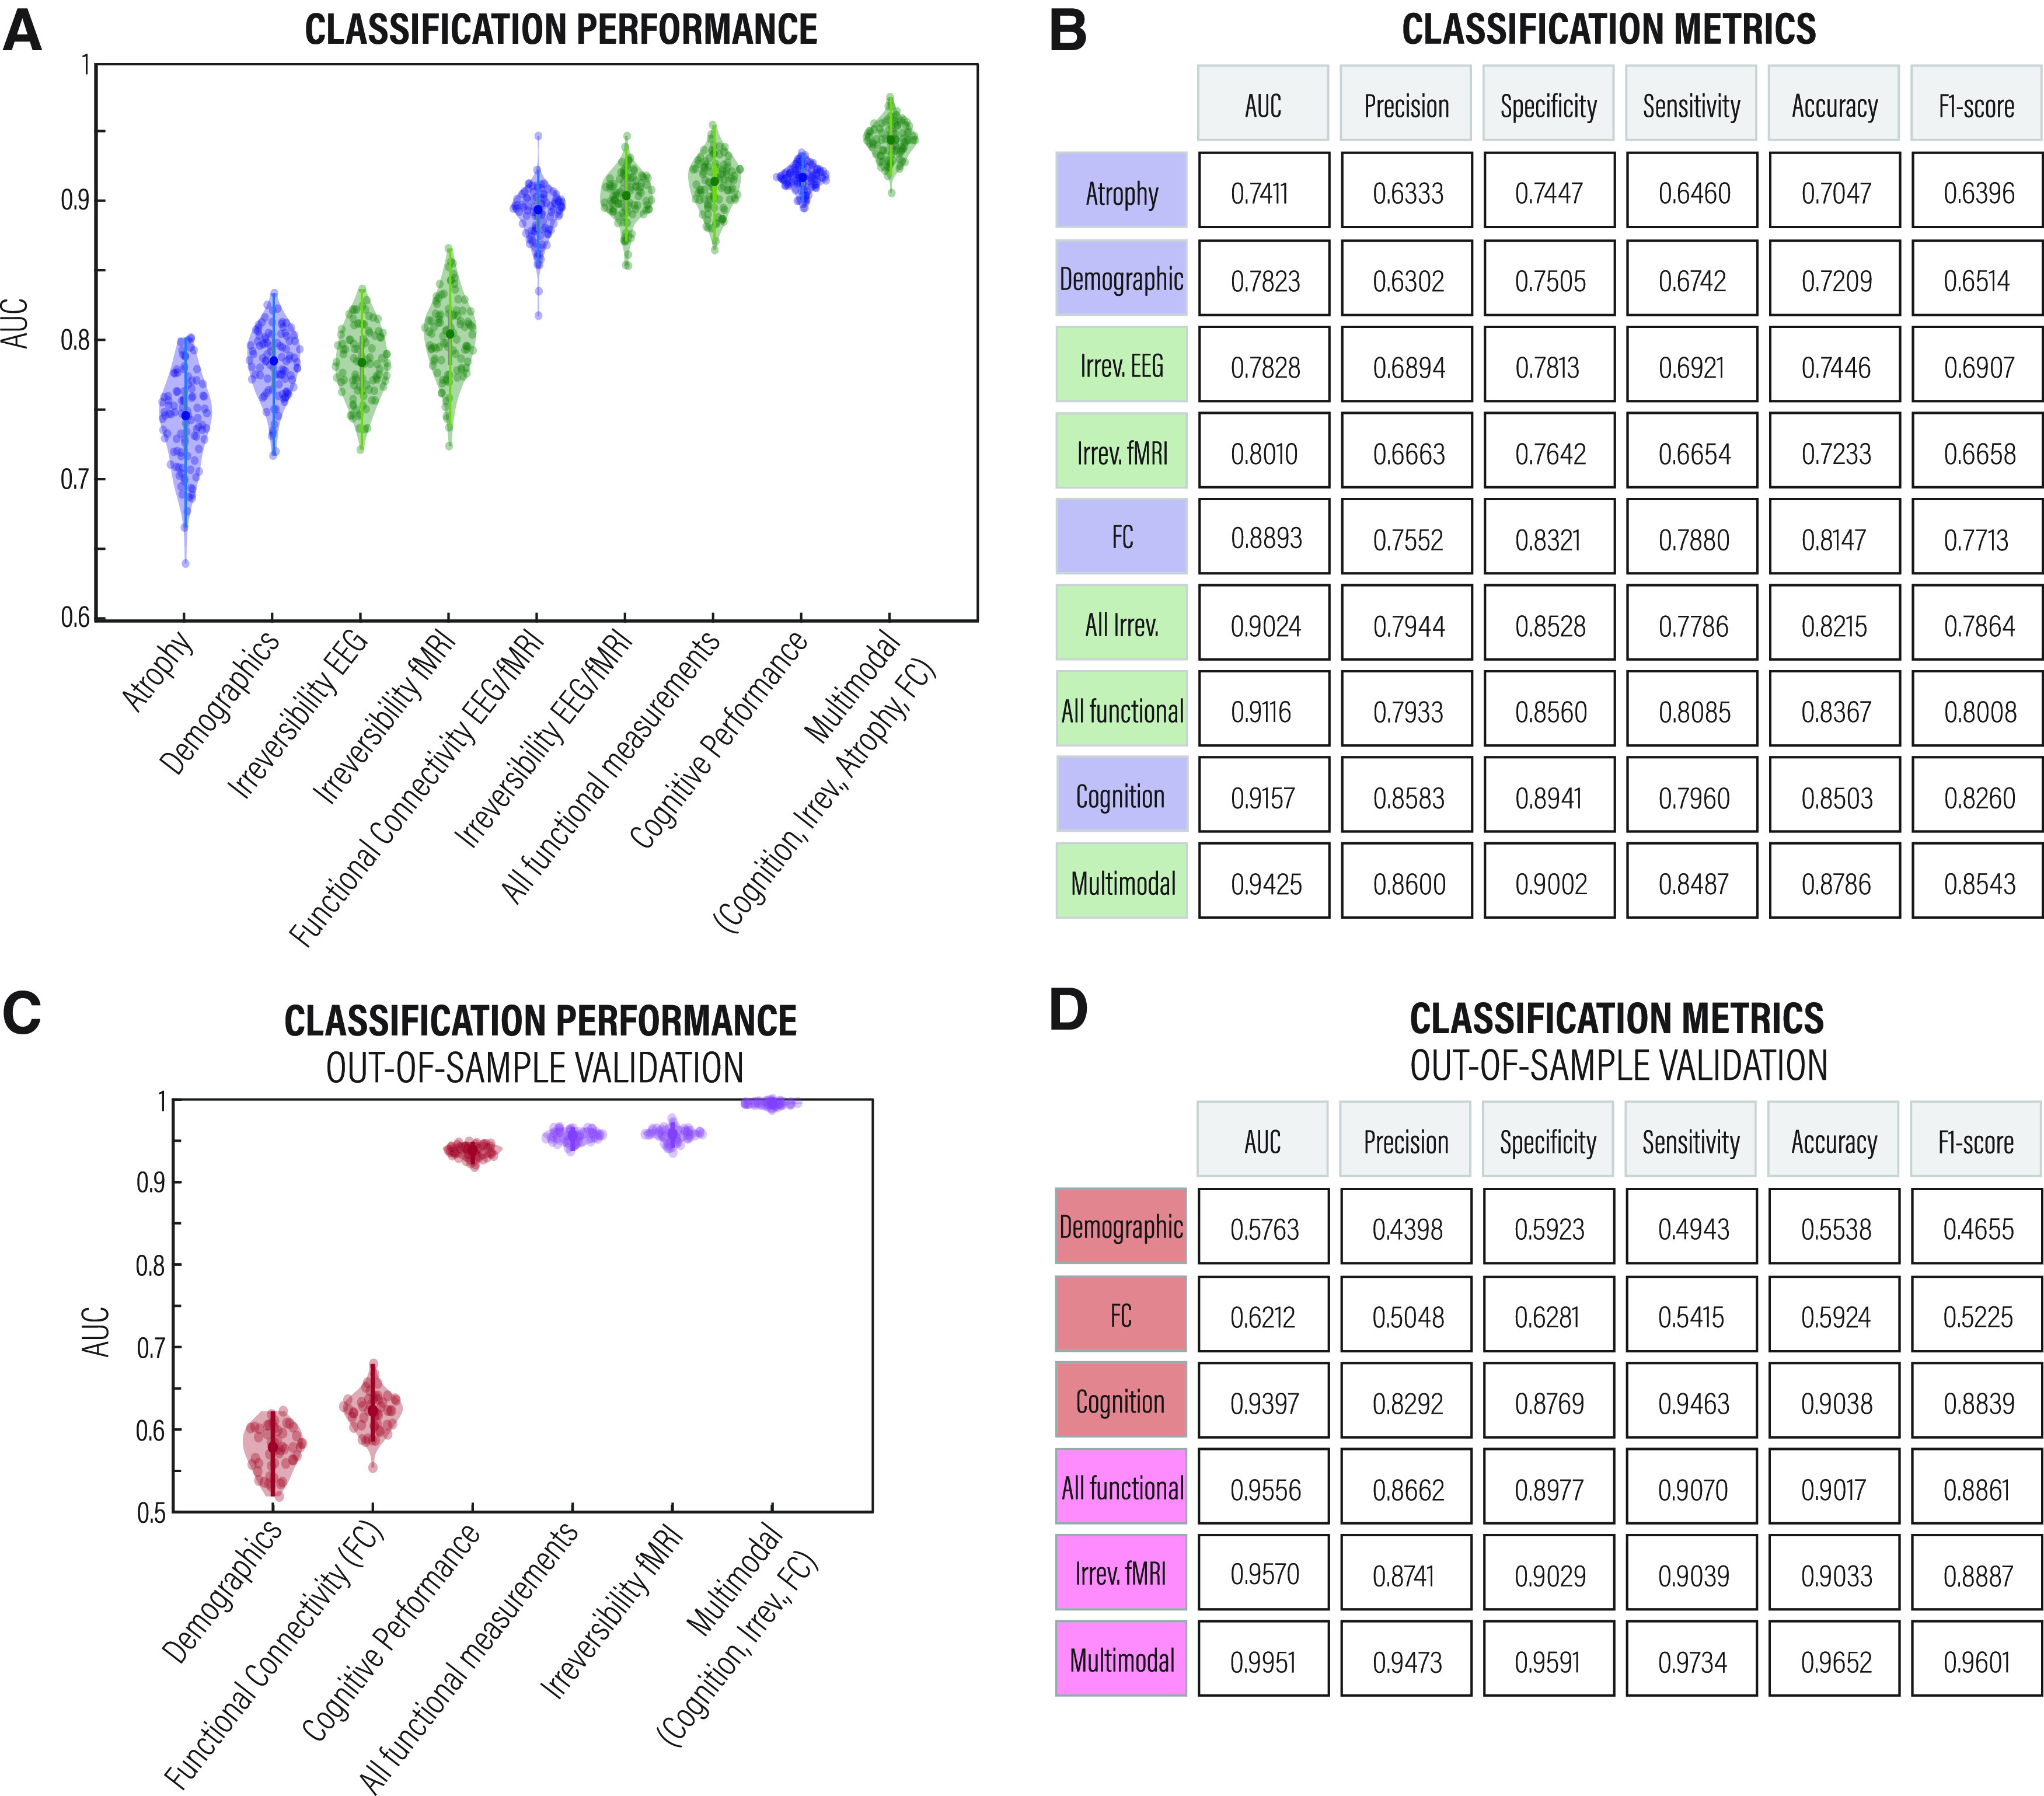
Classification accuracy. A, ROC AUC obtained from a random forest classifier trained using eight different independent features and an additional multimodal feature comprising cognitive performance, irreversibility estimated from EEG and fMRI data, atrophy, and functional connectivity, also estimated from EEG and fMRI data. B, The performance of the classifier was assessed using the AUC, precision, specificity, sensitivity, accuracy, and F1-score, obtaining one average value for each feature. When incorporating the irreversibility values, the classification accuracy score was >90%, surpassing the cognitive performance (assessed with MoCA). These tests were conducted using a normal train/test split and without much parameter tuning. C, D, ROC AUC and the classification metrics, respectively, from an independent cohort for results validation. Green and pink show irreversibility features or multimodal features that comprise irreversibility. Blue and red show other neurocognitive features of AD.
Generalization and replication with an out-of-sample validation
To test the generalization of our approach and rule out potential classification sample size biases in the dataset, we tested the arrow of time and the predictive power of the irreversibility measure on an independent dataset (i.e., the publicly available ADNI cohort). As shown in Figure 5, C and D, we replicated previous findings, further strengthening the results.
Discussion
We used a thermodynamics-inspired framework to gauge the impact of AD on the temporal asymmetry of empirically extracted brain signals (i.e., the level of irreversibility/nonequilibrium in large-scale dynamics estimated from fMRI and hdEEG). The results showed that resting brain activity in AD is associated with a reduction in irreversibility at the global level of the entire brain, local level of cortical regions defined in the AAL parcellation, network level of the prototypical RSNs, and at different oscillatory regimes. Complementarily, the decrease in irreversibility was associated with cognitive decline in AD patients and atrophy in HCs. In addition, we observed that the irreversibility property of brain dynamics outperformed classical neurocognitive measures in predictive classification performance. In addition, multimodal features comprising irreversibility, FC, atrophy, and cognitive performance reached the highest classification performance, surpassing 90% accuracy. On the one hand, our findings offer novel multilevel evidence of reduced irreversibility in AD brain dynamics, reinforcing the close pathophysiological link between brain dynamics and the clinical presentation of AD. On the other, our findings have the potential to open new avenues for understating neurodegeneration in terms of entropic asymmetry of brain dynamics.
These results allow for bridging the gap between large-scale dynamics and AD in threefold ways. First, we show that AD drives brain dynamics toward a different thermodynamic regime (i.e., a state of equilibrium), making them less irreversible in time as an indicator of brain disease. In classical thermodynamics, irreversibility is associated with the production of entropy. A drastic decrease in the entropy of spontaneous brain activity, as in the case of AD (for review of multiple studies, see Sun et al., 2020; for review of conflicting evidence, see Xue and Guo, 2018), would render brain dynamics pathologically subcritical, reducing the net fluxes between the underlying states and thus hampering the integrity of the level of irreversibility—probably because of the large amount of energy required. Therefore, it seems unlikely that a system can sustain the dynamic nature of healthy cognitive functions without substantial deviations from thermodynamic equilibrium on some spatial and temporal scales. Consistent with the entropy production interpretation, brain activity requires a certain level of entropy to maintain its functional flexibility; then, its reduction would lead to impairments in cognitive functions and adaptive behavior (Tagliazucchi et al., 2012; Grieder et al., 2018; Saxe et al., 2018; Wang, 2020). Second, to our knowledge, this is the first report of irreversibility as a multimodal feature of neurodegeneration. We show that the extent to which brain dynamics deviate from the state of equilibrium is a powerful marker of AD. This feature proves more powerful than, and complementary to, more classical neurocognitive measures in distinguishing AD. And third, particularly noteworthy, our neuroimaging research provides convergent evidence supporting pathologic irreversibility in AD across different recording techniques, spatial levels of analysis, and oscillatory regimes.
Irreversibility clearly distinguished AD patients from HCs, and the metric is robust across all spatiotemporal scales. Specifically, we found lower levels of irreversibility and variability of the irreversibility in the BOLD signal at the global level in AD patients than in HCs. We corroborated the results in source-localized hdEEG data-filtered broadband and in the five canonical frequency bands (delta, theta, alpha, beta, and gamma). We showed that the irreversibility differences between HCs and AD patients remain across a range of window sizes. Similarly, we found lower levels of irreversibility at the local level of individual brain regions in the distributed frontal and temporoparietal areas. This fact indicates that the degree of temporal asymmetry is inherent to neural dynamics regardless of the data modality and the temporal and spatial scales of the analysis. Also, the fact that fMRI and EEG provide the same results points out the robustness of the method. However, despite consistent results across modalities, these results were not correlated. This could be because EEG and fMRI measure signals from different origins and timescales, and they show different but complementary proxies of brain activity that do not necessarily appear correlated—and even less so when they have not been recorded simultaneously (Warbrick, 2022). This result fuels the growing need in current neuroimaging research to understand the functional links between quantitative measures derived from EEG and the BOLD signal assessed with fMRI.
We further investigated the irreversibility at the network level using the same framework applied to the global level but restricted to brain regions in each of the seven RSNs estimated using fMRI. We found that the more endogenous networks (i.e., limbic, frontoparietal, default mode, and salience) showed the lowest levels of irreversibility in AD. These findings align with previous neuroimaging studies that support AD as a disconnection syndrome in which these networks operate in significant isolation (i.e., at greater connectivity distances from the rest of the brain; Brier et al., 2014; Costumero et al., 2020). The results also suggest that in AD, the high-order processing performed by the more endogenous RSNs is less dependent on the interaction between the system and its environment, reducing top-down processing. From a functional perspective, this could translate into deficiencies that may play a role in cognitive decline because of, for example, poor information processing guided by experience and expectations or lack of allocation of attention to relevant features.
Because of its excellent temporal resolution, EEG has long been the hallmark tool for investigating the rapid dynamics of brain electrical activity in healthy and diseased human brains, enabling valuable scientific contributions to various research fields. However, among the methodological disadvantages of this technique is the limited spatial resolution and, thus, the difficulty of obtaining precise source locations. For this reason, in this work, we refrained from reporting EEG brain hubs and networks similar to those detected by fMRI and instead preferred to exploit and maximize their temporal strength by analyzing the five canonical frequency bands. Future studies may overcome this limitation by using 256 hdEEG electrodes as the spatial resolution of source reconstruction procedures improves localization accuracy with more dense-array sampling (Song et al., 2015).
When evaluating the association of the level of irreversibility, estimated from both fMRI and EEG data, with classical neurocognitive markers of AD, we found a significant correlation between node-level irreversibility and atrophy values in HCs, but not in AD patients; and between global-level irreversibility and cognitive performance in AD patients, but not in HCs. It is noteworthy that the results were consistent across recording techniques. In healthy brains, structural measures have an expected association with irreversibility/nonequilibrium dynamics, but these are abolished in AD. Likewise, cognitive performance—potentially related to multiple processes in healthy control subjects—is associated explicitly with core cognitive impairments in AD, suggesting a specific role of disrupted irreversibility in neurodegeneration and cognitive deficits. At the network level, an association between irreversibility and atrophy was found only in brain regions of the salience network in AD. The salience network identifies salient stimuli and switches between the frontoparietal network and the default mode network, both of which are impaired in AD (Agosta et al., 2012; Zhao et al., 2018, 2019). Alterations in functional connectivity in the salience network have also been related to AD (Balthazar et al., 2014; Lee et al., 2020). Moreover, these results suggest that the structural mechanisms related to dynamic switching between transient states are associated with less irreversible dynamics in AD. No associations were found between irreversibility and FC, suggesting that irreversible dynamics have different/unrelated properties to standard resting-state connectivity measurements—as supported by the higher classification performance of the former. Although somewhat unexpected, this result also supports previous studies focused on linear correlations of resting-state data that agree that this measure may not provide a complete description of the temporal properties of the brain signal, as it systematically underestimates the strength of the dependence structure (LaConte et al., 2004; Hlinka et al., 2011).
Using a recently developed multifeature approach (Moguilner et al., 2022) and after exploring the arrow of time in the empirical data, we focused on the predictive power for classification accuracy aiming to compare the results of standard measurements used in dementia research with the irreversibility metrics on the same population and two independent samples, as a way to further assess the generalizability of our findings via the process of cross-validation. Our results were bolstered by the high discriminative performance obtained using multimodal irreversibility features (fMRI and EEG) in contrast to standard neurocognitive markers of AD, including brain atrophy (Moradi et al., 2015; Lebedeva et al., 2017), functional connectivity (Chen et al., 2011; Challis et al., 2015), and cognitive deficits (Ewers et al., 2012; Binaco et al., 2020). Results show that irreversibility carries information not covered by classical neurocognitive measures, suggesting that it is a critical property of AD. Moreover, the combination of multimodal measurements (FC, cognition, atrophy, irreversibility) further increased the classification performance, suggesting that the irreversibility measure provides differential information not explained by classical AD markers.
Regarding formulation of the irreversibility measure, our analysis is based only on the effect size of the correlations (R2 coefficient) regardless of their statistical significance. Introducing a threshold based on a statistical test could be problematic, given the large number of tests applied for each temporal window and thus the need to perform a strict correction for multiple comparisons, leading to potentially very sparse matrices. Since our analysis weights connections according to the correlation of the corresponding BOLD time series, correlations that are not significant will have small values that will fluctuate around zero, overall making a small amount to the temporal irreversibility estimate relative to the stronger connections. We believe there are no reasons to suppose that the potential inclusion of some spurious correlations will selectively affect one of the groups more than the others (i.e., that they will confound the results concerning differences between groups).
While similar to or larger than other studies, we acknowledge that our small sample size is a potential methodological limitation that might affect the reporting of our results. Still, it was minimized by the large effect sizes observed, and the rigorous control of clinical variables, diagnostic procedures, and assessments (Piguet et al., 2011; Rascovsky et al., 2011; Gil et al., 2015; Melloni et al., 2016). Although small sample sizes are common, they can be particularly problematic for machine learning, as overall accuracy might be higher in studies with smaller sample sizes (Arbabshirani et al., 2017; Varoquaux, 2018). Since the features of our study were derived from the same dataset, which could lead to information leakage in machine learning, we conducted an out-of-sample validation analysis using fMRI data from the ADNI cohort. We successfully replicated the irreversibility findings and classification accuracy using this unseen independent cohort. The combined results support the potential generalization of our approach. The combined results support the potential generalization capability of our approach. Still, given that we are amid a replicability crisis, in which many scientific findings are not replicated in new datasets, one must proceed cautiously. Generalizability goes hand in hand with replicability, and issues at all stages could emerge (i.e., data collection, preprocessing pipeline, and data analysis).
In addition, as a result of the sample size limitation, future studies should involve the application of this framework in a greater sample size and ideally consider different stages of the disease to tackle the evolution of irreversibility in brain dynamics. Indeed, our findings have the effects of the influential covariates of demographics. To rule out that the reduction in irreversibility was not because of them, we performed a multivariate linear regression analysis on irreversibility at the global level. The fact that we got the same results confirms the findings. In addition, the machine learning classification based on demography presented smaller effects compared with all other cognitive, structural, functional, and irreversibility markers. In addition, future studies should further explore the association of this synergistic approach with cognition (Ibanez, 2022) and with combined forms of brain structural characterization, different functional connectivity measurements, and other biomarkers, such as metabolic changes acquired with PET or additional emerging plasma and CSF biomarkers (Migeot et al., 2022). Finally, it would be of particular importance to contrast these results with those of other neurodegenerative diseases to assess whether we are tackling a specific AD signature or a general property of neurodegeneration.
The present work provides a framework derived from the perspective of thermodynamic equilibrium for assessing irreversibility in time series at different spatiotemporal scales. We showed that AD is associated with less irreversible brain dynamics in spatial and temporal domains, spanning the global-level, large-scale networks and local regions, and multiple oscillatory regimes. This signature correlates with prototypical neurocognitive markers of AD, such as cognitive decline, and it provides higher classification accuracy than classical neurocognitive markers of AD, especially when combined with other features. Overall, the results suggest that the irreversibility of the time series reflects a genuine hallmark of inefficient brain dynamics in AD and points to the link between selective and relentlessly progressive pathologic changes and entropic brain dynamics in AD.
Footnotes
A.I. was supported by Takeda Grant CW2680521; Consejo Nacional de Investigaciones Científicas y Técnicas (CONICET); Fondo para la Investigación Científica y Tecnológica (FONCYT)-Proyectos de Investigación Científica y Tecnológica (PICT) Grants 2017-1818 and 2017-1820; Agencia Nacional de Investigación y Desarrollo (ANID)/Fondo Nacional de Desarrollo Científico, Tecnológico y de Innovación Tecnológica (FONDECYT) Regular Grants 1210195, 1210176, and 1220995); ANID/Fondo de Financiamiento de Centros de Investigación en Áreas Prioritarias (FONDAP) Grant 15150012; ANID-PIA ANILLOS Grant ACT210096; ANID/Fondo Nacional de la Defensa Argentino (FONDEF) Grants ID20I10152 and ID22I10029; and the Multi-Partner Consortium to Expand Dementia Research in Latin America (ReDLat), funded by the National Institutes of Aging of the National Institutes of Health under Grant R01-AG-057234, Alzheimer's Association Grant SG-20-725707-ReDLat, the Rainwater Foundation, and the Global Brain Health Institute. J.C. was supported by BrainLat Postdoctoral Fellowship. Y.S.-P. is supported by European Union's Horizon 2020 Research And Innovation Program under Marie Sklodowska-Curie Grant 896354. E.T. is supported by Grants PICT-2018-03103 and PICT-2019-02294 funded by Agencia I+D+I (Argentina), a Mercator fellowship granted by the German Research Foundation, and by ANID/FONDECYT Regular Grant 1220995 (Chile). G.D. was supported by the Human Brain Project Specific Grant Agreement 3 Grant 945539 and by the Spanish Research Project AWAKENING: Using Whole-Brain Models Perturbational Approaches for Predicting External Stimulation to Force Transitions between Different Brain States (reference PID2019-105772GB-I00/AEI/10.13039/501100011033), financed by the Spanish Ministry of Science, Innovation, and Universities (MCIU) and State Research Agency (AEI). M.L.K. is supported by the Center for Music in the Brain, funded by the Danish National Research Foundation (Grant DNRF117); and the Center for Eudaimonia and Human Flourishing at Linacre College, funded by the Pettit and Carlsberg Foundations. The content is solely the responsibility of the authors and does not represent the official views of those institutions.
The authors declare no competing financial interests.
References
- Agosta F, Pievani M, Geroldi C, Copetti M, Frisoni GB, Filippi M (2012) Resting state fMRI in Alzheimer's disease: beyond the default mode network. Neurobiol Aging 33:1564–1578. 10.1016/j.neurobiolaging.2011.06.007 [DOI] [PubMed] [Google Scholar]
- Amoruso L, Pusil S, García AM, Ibañez A (2022) Decoding motor expertise from fine-tuned oscillatory network organization. Hum Brain Mapp 43:2817–2832. 10.1002/hbm.25818 [DOI] [PMC free article] [PubMed] [Google Scholar]
- Arbabshirani MR, Plis S, Sui J, Calhoun VD (2017) Single subject prediction of brain disorders in neuroimaging: promises and pitfalls. Neuroimage 145:137–165. 10.1016/j.neuroimage.2016.02.079 [DOI] [PMC free article] [PubMed] [Google Scholar]
- Ashburner J (2007) A fast diffeomorphic image registration algorithm. Neuroimage 38:95–113. 10.1016/j.neuroimage.2007.07.007 [DOI] [PubMed] [Google Scholar]
- Ashburner J, Friston KJ (2000) Voxel-based morphometry—the methods. Neuroimage 11:805–821. 10.1006/nimg.2000.0582 [DOI] [PubMed] [Google Scholar]
- Badhwar A, Tam A, Dansereau C, Orban P, Hoffstaedter F, Bellec P (2017) Resting-state network dysfunction in Alzheimer's disease: a systematic review and meta-analysis. Alzheimers Dement (Amst) 8:73–85. 10.1016/j.dadm.2017.03.007 [DOI] [PMC free article] [PubMed] [Google Scholar]
- Baez S, Couto B, Torralva T, Sposato LA, Huepe D, Montañes P, Reyes P, Matallana D, Vigliecca NS, Slachevsky A, Manes F, Ibanez A (2014) Comparing moral judgments of patients with frontotemporal dementia and frontal stroke. JAMA Neurol 71:1172–1176. 10.1001/jamaneurol.2014.347 [DOI] [PubMed] [Google Scholar]
- Balthazar ML, Pereira FR, Lopes TM, da Silva EL, Coan AC, Campos BM, Duncan NW, Stella F, Northoff G, Damasceno BP, Cendes F (2014) Neuropsychiatric symptoms in Alzheimer's disease are related to functional connectivity alterations in the salience network. Hum Brain Mapp 35:1237–1246. 10.1002/hbm.22248 [DOI] [PMC free article] [PubMed] [Google Scholar]
- Binaco R, Calzaretto N, Epifano J, McGuire S, Umer M, Emrani S, Wasserman V, Libon DJ, Polikar R (2020) Machine learning analysis of digital clock drawing test performance for differential classification of mild cognitive impairment subtypes versus Alzheimer's disease. J Int Neuropsychol Soc 26:690–700. 10.1017/S1355617720000144 [DOI] [PubMed] [Google Scholar]
- Birba A, Santamaría-García H, Prado P, Cruzat J, Ballesteros AS, Legaz A, Fittipaldi S, Duran-Aniotz C, Slachevsky A, Santibañez R, Sigman M, García AM, Whelan R, Moguilner S, Ibáñez A (2022) Allostatic-interoceptive overload in frontotemporal dementia. Biol Psychiatry 92:54–67. 10.1016/j.biopsych.2022.02.955 [DOI] [PMC free article] [PubMed] [Google Scholar]
- Brier MR, Thomas JB, Ances BM (2014) Network dysfunction in Alzheimer's disease: refining the disconnection hypothesis. Brain Connect 4:299–311. 10.1089/brain.2014.0236 [DOI] [PMC free article] [PubMed] [Google Scholar]
- Burton EJ, McKeith IG, Burn DJ, Williams ED, O'Brien JT (2004) Cerebral atrophy in Parkinson's disease with and without dementia: a comparison with Alzheimer's disease, dementia with Lewy bodies and controls. Brain 127:791–800. 10.1093/brain/awh088 [DOI] [PubMed] [Google Scholar]
- Challis E, Hurley P, Serra L, Bozzali M, Oliver S, Cercignani M (2015) Gaussian process classification of Alzheimer's disease and mild cognitive impairment from resting-state fMRI. Neuroimage 112:232–243. 10.1016/j.neuroimage.2015.02.037 [DOI] [PubMed] [Google Scholar]
- Chand GB, Hajjar I, Qiu D (2018) Disrupted interactions among the hippocampal, dorsal attention, and central‐executive networks in amnestic mild cognitive impairment. Hum Brain Mapp 39:4987–4997. 10.1002/hbm.24339 [DOI] [PMC free article] [PubMed] [Google Scholar]
- Chang C, Leopold DA, Schölvinck ML, Mandelkow H, Picchioni D, Liu X, Ye FQ, Turchi JN, Duyn JH (2016) Tracking brain arousal fluctuations with fMRI. Proc Natl Acad Sci U S A 113:4518–4523. 10.1073/pnas.1520613113 [DOI] [PMC free article] [PubMed] [Google Scholar]
- Chen G, Ward BD, Xie C, Li W, Wu Z, Jones JL, Franczak M, Antuono P, Li SJ (2011) Classification of Alzheimer disease, mild cognitive impairment, and normal cognitive status with large-scale network analysis based on resting-state functional MR imaging. Radiology 259:213–221. 10.1148/radiol.10100734 [DOI] [PMC free article] [PubMed] [Google Scholar]
- Chung J, Yoo K, Lee P, Kim CM, Roh JH, Park JE, Kim SJ, Seo SW, Shin JH, Seong JK, Jeong Y (2017) Normalization of cortical thickness measurements across different T1 magnetic resonance imaging protocols by novel W-score standardization. Neuroimage 159:224–235. 10.1016/j.neuroimage.2017.07.053 [DOI] [PubMed] [Google Scholar]
- Costumero V, Marin-Marin L, Calabria M, Belloch V, Escudero J, Baquero M, Hernandez M, Ruiz de Miras J, Costa A, Parcet MA, Ávila C (2020) A cross-sectional and longitudinal study on the protective effect of bilingualism against dementia using brain atrophy and cognitive measures. Alzheimers Res Ther 12:11. 10.1186/s13195-020-0581-1 [DOI] [PMC free article] [PubMed] [Google Scholar]
- de la Fuente LA, Zamberlan F, Bocaccio H, Kringelbach M, Deco G, Perl YS, Pallavicini C, Tagliazucchi E (2022) Temporal irreversibility of neural dynamics as a signature of consciousness. Cereb Cortex 32:bhac177. [DOI] [PubMed] [Google Scholar]
- Deco G, Kringelbach ML, Jirsa VK, Ritter P (2017) The dynamics of resting fluctuations in the brain: metastability and its dynamical cortical core. Sci Rep 7:3095. 10.1038/s41598-017-03073-5 [DOI] [PMC free article] [PubMed] [Google Scholar]
- Deco G, Perl YS, Sitt JD, Tagliazucchi E, Kringelbach ML (2021) Deep learning the arrow of time in brain activity: characterising brain-environment behavioural interactions in health and disease. bioRxiv 450899. 10.1101/2021.07.02.450899 10.1101/2021.07.02.450899. [DOI] [Google Scholar]
- Deco G, Sanz Perl Y, Bocaccio H, Tagliazucchi E, Kringelbach ML (2022) The INSIDEOUT framework provides precise signatures of the balance of intrinsic and extrinsic dynamics in brain states. Commun Biol 5:572. 10.1038/s42003-022-03505-7 [DOI] [PMC free article] [PubMed] [Google Scholar]
- Demirtaş M, Burt JB, Helmer M, Ji JL, Adkinson BD, Glasser MF, Van Essen DC, Sotiropoulos SN, Anticevic A, Murray JD (2019) Hierarchical heterogeneity across human cortex shapes large-scale neural dynamics. Neuron 101:1181–1194.e13. 10.1016/j.neuron.2019.01.017 [DOI] [PMC free article] [PubMed] [Google Scholar]
- Dirlich G, Vogl L, Plaschke M, Strian F (1997) Cardiac field effects on the EEG. Electroencephalogr Clin Neurophysiol 102:307–315. 10.1016/s0013-4694(96)96506-2 [DOI] [PubMed] [Google Scholar]
- Donnelly-Kehoe PA, Pascariello GO, Garcia AM, Hodges JR, Miller B, Rosen H, Manes F, Landin-Romero R, Matallana D, Serrano C, Herrera E, Reyes P, Santamaria-Garcia H, Kumfor F, Piguet O, Ibanez A, Sedeño L (2019) Robust automated computational approach for classifying frontotemporal neurodegeneration: multimodal/multicenter neuroimaging. Alzheimers Dement (Amst) 11:588–598. 10.1016/j.dadm.2019.06.002 [DOI] [PMC free article] [PubMed] [Google Scholar]
- Dottori M, Sedeño L, Martorell Caro M, Alifano F, Hesse E, Mikulan E, García AM, Ruiz-Tagle A, Lillo P, Slachevsky A, Serrano C, Fraiman D, Ibanez A (2017) Towards affordable biomarkers of frontotemporal dementia: a classification study via network's information sharing. Sci Rep 7:3822. 10.1038/s41598-017-04204-8 [DOI] [PMC free article] [PubMed] [Google Scholar]
- Duran-Aniotz C, Sanhueza J, Grinberg LT, Slachevsky A, Valcour V, Robertson I, Lawlor B, Miller B, Ibañez A (2022) The Latin American Brain Health Institute, a regional initiative to reduce the scale and impact of dementia. Alzheimers Dement 18:1696–1698. 10.1002/alz.12710 [DOI] [PMC free article] [PubMed] [Google Scholar]
- Eddington A (1928) The nature of the physical world. London: Macmillan. [Google Scholar]
- Ewers M, Walsh C, Trojanowski JQ, Shaw LM, Petersen RC, Jack CR, Feldman HH, Bokde ALW, Alexander GE, Scheltens P, Vellas B, Dubois B, Weiner M, Hampel H (2012) Prediction of conversion from mild cognitive impairment to Alzheimer's disease dementia based upon biomarkers and neuropsychological test performance. Neurobiol Aging 33:1203–1214. 10.1016/j.neurobiolaging.2010.10.019 [DOI] [PMC free article] [PubMed] [Google Scholar]
- Fawcett T (2006) An introduction to ROC analysis. Pattern Recognit Lett 27:861–874. 10.1016/j.patrec.2005.10.010 [DOI] [Google Scholar]
- Fingelkurts AA, Fingelkurts AA (2004) Making complexity simpler: multivariability and metastability in the brain. Int J Neurosci 114:843–862. 10.1080/00207450490450046 [DOI] [PubMed] [Google Scholar]
- Friston KJ (1994) Functional and effective connectivity in neuroimaging: a synthesis. Hum Brain Mapp 2:56–78. 10.1002/hbm.460020107 [DOI] [Google Scholar]
- García-Cordero I, Sedeño L, de la Fuente L, Slachevsky A, Forno G, Klein F, Lillo P, Ferrari J, Rodriguez C, Bustin J, Torralva T, Baez S, Yoris A, Esteves S, Melloni M, Salamone P, Huepe D, Manes F, García AM, Ibañez A (2016) Feeling, learning from and being aware of inner states: interoceptive dimensions in neurodegeneration and stroke. Phil Trans R Soc B 371:20160006. 10.1098/rstb.2016.0006 [DOI] [PMC free article] [PubMed] [Google Scholar]
- García-Cordero I, Esteves S, Mikulan EP, Hesse E, Baglivo FH, Silva W, García MDC, Vaucheret E, Ciraolo C, García HS, Adolfi F, Pietto M, Herrera E, Legaz A, Manes F, García AM, Sigman M, Bekinschtein TA, Ibáñez A, Sedeño L (2017) Attention, in and out: scalp-level and intracranial EEG correlates of interoception and exteroception. Front Neurosci 11:411. [DOI] [PMC free article] [PubMed] [Google Scholar]
- Gil L, de Sánchez CR, Gil F, Romero SJ, Burgos FP (2015) Validation of the Montreal Cognitive Assessment (MoCA) in Spanish as a screening tool for mild cognitive impairment and mild dementia in patients over 65 years old in Bogotá, Colombia. Int J Geriatr Psychiatry 30:655–662. 10.1002/gps.4199 [DOI] [PubMed] [Google Scholar]
- Grieder M, Wang DJJ, Dierks T, Wahlund LO, Jann K (2018) Default mode network complexity and cognitive decline in mild Alzheimer's disease. Front Neurosci 12:770. 10.3389/fnins.2018.00770 [DOI] [PMC free article] [PubMed] [Google Scholar]
- Herzog R, Rosas FE, Whelan R, Fittipaldi S, Santamaria-Garcia H, Cruzat J, Birba A, Moguilner S, Tagliazucchi E, Prado P, Ibanez A (2022) Genuine high-order interactions in brain networks and neurodegeneration. Neurobiol Dis 175:105918. 10.1016/j.nbd.2022.105918 [DOI] [PMC free article] [PubMed] [Google Scholar]
- Hlinka J, Paluš M, Vejmelka M, Mantini D, Corbetta M (2011) Functional connectivity in resting-state fMRI: is linear correlation sufficient? Neuroimage 54:2218–2225. 10.1016/j.neuroimage.2010.08.042 [DOI] [PMC free article] [PubMed] [Google Scholar]
- Hochberg Y, Benjamini Y (1990) More powerful procedures for multiple significance testing. Stat Med 9:811–818. 10.1002/sim.4780090710 [DOI] [PubMed] [Google Scholar]
- Ibanez A (2022) The mind's golden cage and cognition in the wild. Trends Cogn Sci 26:1031–1034. 10.1016/j.tics.2022.07.008 [DOI] [PMC free article] [PubMed] [Google Scholar]
- Ibanez A, Parra MA, Butler C (2021a) The Latin America and the Caribbean Consortium on Dementia (LAC-CD): from networking to research to implementation science. J Alzheimers Dis 82:S379–S394. 10.3233/JAD-201384 [DOI] [PMC free article] [PubMed] [Google Scholar]
- Ibanez A, et al. (2021b) The multi-partner Consortium to Expand Dementia Research in Latin America (ReDLat): driving multicentric research and implementation science. Front Neurol 12:631722. [DOI] [PMC free article] [PubMed] [Google Scholar]
- Jack CR, Petersen RC, Xu YC, Waring SC, O’Brien PC, Tangalos EG, Smith GE, Ivnik RJ, Kokmen E (1997) Medial temporal atrophy on MRI in normal aging and very mild Alzheimer's disease. Neurology 49:786–794. 10.1212/wnl.49.3.786 [DOI] [PMC free article] [PubMed] [Google Scholar]
- Josefsson A, Ibáñez A, Parra M, Escudero J (2019) Network analysis through the use of joint-distribution entropy on EEG recordings of MCI patients during a visual short-term memory binding task. Healthc Technol Lett 6:27–31. 10.1049/htl.2018.5060 [DOI] [PMC free article] [PubMed] [Google Scholar]
- Kim D, Kim SK (2012) Comparing patterns of component loadings: principal component analysis (PCA) versus independent component analysis (ICA) in analyzing multivariate non-normal data. Behav Res Methods 44:1239–1243. 10.3758/s13428-012-0193-1 [DOI] [PubMed] [Google Scholar]
- Kucikova L, Goerdten J, Dounavi ME, Mak E, Su L, Waldman AD, Danso S, Muniz-Terrera G, Ritchie CW (2021) Resting-state brain connectivity in healthy young and middle-aged adults at risk of progressive Alzheimer’s disease. Neurosci Biobehav Rev 129:142–153. 10.1016/j.neubiorev.2021.07.024 [DOI] [PubMed] [Google Scholar]
- La Joie R, Perrotin A, Barré L, Hommet C, Mézenge F, Ibazizene M, Camus V, Abbas A, Landeau B, Guilloteau D, de La Sayette V, Eustache F, Desgranges B, Chételat G (2012) Region-specific hierarchy between atrophy, hypometabolism, and β-amyloid (Aβ) load in Alzheimer’s disease dementia. J Neurosci 32:16265–16273. 10.1523/JNEUROSCI.2170-12.2012 [DOI] [PMC free article] [PubMed] [Google Scholar]
- LaConte SM, Peltier SJ, Kadah Y, Ngan S-C, Deshpande G, Hu X (2004) Detecting nonlinear dynamics of functional connectivity. In: Medical imaging 2004: physiology, function, and structure from medical images (Amini AA, Manduca A, eds), pp 227–237. Bellingham, WA: SPIE. 10.1117/12.535804 [DOI] [Google Scholar]
- Lebedeva AK, Westman E, Borza T, Beyer MK, Engedal K, Aarsland D, Selbaek G, Haberg AK (2017) MRI-based classification models in prediction of mild cognitive impairment and dementia in late-life depression. Front Aging Neurosci 9:13. 10.3389/fnagi.2017.00013 [DOI] [PMC free article] [PubMed] [Google Scholar]
- Lee JS, Kim JH, Lee SK (2020) The relationship between neuropsychiatric symptoms and default-mode network connectivity in Alzheimer’s disease. Psychiatry Investig 17:662–666. 10.30773/pi.2020.0009 [DOI] [PMC free article] [PubMed] [Google Scholar]
- Legaz A, Abrevaya S, Dottori M, González Campo C, Birba A, Martorell Caro M, Aguirre J, Slachevsky A, Aranguiz R, Serrano C, Gillan CM, Leroi I, García AM, Fittipaldi S, Ibañez A (2022) Multimodal mechanisms of human socially reinforced learning across neurodegenerative diseases. Brain 145:1052–1068. 10.1093/brain/awab345 [DOI] [PMC free article] [PubMed] [Google Scholar]
- Lindquist MA, Xu Y, Nebel MB, Caffo BS (2014) Evaluating dynamic bivariate correlations in resting-state fMRI: a comparison study and a new approach. Neuroimage 101:531–546. 10.1016/j.neuroimage.2014.06.052 [DOI] [PMC free article] [PubMed] [Google Scholar]
- Liu TT, Nalci A, Falahpour M (2017) The global signal in fMRI: nuisance or Information? Neuroimage 150:213–229. 10.1016/j.neuroimage.2017.02.036 [DOI] [PMC free article] [PubMed] [Google Scholar]
- Luppi AI, Craig MM, Pappas I, Finoia P, Williams GB, Allanson J, Pickard JD, Owen AM, Naci L, Menon DK, Stamatakis EA (2019) Consciousness-specific dynamic interactions of brain integration and functional diversity. Nat Commun 10:4616. 10.1038/s41467-019-12658-9 [DOI] [PMC free article] [PubMed] [Google Scholar]
- Lynn CW, Cornblath EJ, Papadopoulos L, Bertolero MA, Bassett DS (2021) Broken detailed balance and entropy production in the human brain. Proc Natl Acad Sci U S A 118:e2109889118. [DOI] [PMC free article] [PubMed] [Google Scholar]
- Maito MA, et al. (2023) Classification of Alzheimer's disease and frontotemporal dementia using routine clinical and cognitive measures across multicentric underrepresented samples: a cross sectional observational study. Lancet Reg Health Am 17:100387. 10.1016/j.lana.2022.100387 [DOI] [PMC free article] [PubMed] [Google Scholar]
- McKhann G, Drachman D, Folstein M, Katzman R, Price D, Stadlan EM (1984) Clinical diagnosis of Alzheimer's disease: report of the NINCDS-ADRDA Work Group under the auspices of Department of Health and Human Services Task Force on Alzheimer's Disease. Neurology 34:939–944. 10.1212/wnl.34.7.939 [DOI] [PubMed] [Google Scholar]
- McKhann GM, Knopman DS, Chertkow H, Hyman BT, Jack CR Jr, Kawas CH, Klunk WE, Koroshetz WJ, Manly JJ, Mayeux R, Mohs RC, Morris JC, Rossor MN, Scheltens P, Carrillo MC, Thies B, Weintraub S, Phelps CH (2011) The diagnosis of dementia due to Alzheimer's disease: recommendations from the National Institute on Aging‐Alzheimer's Association workgroups on diagnostic guidelines for Alzheimer's disease. Alzheimers Dement 7:263–269. 10.1016/j.jalz.2011.03.005 [DOI] [PMC free article] [PubMed] [Google Scholar]
- Melloni M, Billeke P, Baez S, Hesse E, de la Fuente L, Forno G, Birba A, García-Cordero I, Serrano C, Plastino A, Slachevsky A, Huepe D, Sigman M, Manes F, García AM, Sedeño L, Ibanez A (2016) Your perspective and my benefit: multiple lesion models of self-other integration strategies during social bargaining. Brain 139:3022–3040. 10.1093/brain/aww231 [DOI] [PubMed] [Google Scholar]
- Meng X, Wu Y, Liang Y, Zhang D, Xu Z, Yang X, Meng L (2022) A triple-network dynamic connection study in Alzheimer's disease. Front Psychiatry 13:862958. [DOI] [PMC free article] [PubMed] [Google Scholar]
- Migeot JA, Duran-Aniotz CA, Signorelli CM, Piguet O, Ibañez A (2022) A predictive coding framework of allostatic-interoceptive overload in frontotemporal dementia. Trends Neurosci 45:838–853. 10.1016/j.tins.2022.08.005 [DOI] [PMC free article] [PubMed] [Google Scholar]
- Mikulan E, Hesse E, Sedeño L, Bekinschtein T, Sigman M, García MDC, Silva W, Ciraolo C, García AM, Ibanez A (2018) Intracranial high-gamma connectivity distinguishes wakefulness from sleep. Neuroimage 169:265–277. 10.1016/j.neuroimage.2017.12.015 [DOI] [PubMed] [Google Scholar]
- Moguilner S, García AM, Perl YS, Tagliazucchi E, Piguet O, Kumfor F, Reyes P, Matallana D, Sedeño L, Ibañez A (2021) Dynamic brain fluctuations outperform connectivity measures and mirror pathophysiological profiles across dementia subtypes: a multicenter study. Neuroimage 225:117522. 10.1016/j.neuroimage.2020.117522 [DOI] [PMC free article] [PubMed] [Google Scholar]
- Moguilner S, Birba A, Fittipaldi S, Gonzalez-Campo C, Tagliazucchi E, Reyes P, Matallana D, Parra MA, Slachevsky A, Farías G, Cruzat J, García A, Eyre HA, La Joie R, Rabinovici G, Whelan R, Ibáñez A (2022) Multi-feature computational framework for combined signatures of dementia in underrepresented settings. J Neural Eng 19:046048. 10.1088/1741-2552/ac87d0 [DOI] [PMC free article] [PubMed] [Google Scholar]
- Moradi E, Pepe A, Gaser C, Huttunen H, Tohka J (2015) Machine learning framework for early MRI-based Alzheimer's conversion prediction in MCI subjects. Neuroimage 104:398–412. 10.1016/j.neuroimage.2014.10.002 [DOI] [PMC free article] [PubMed] [Google Scholar]
- Nasreddine ZS, Phillips NA, Bédirian V, Charbonneau S, Whitehead V, Collin I, Cummings JL, Chertkow H (2005) The Montreal Cognitive Assessment, MoCA: a brief screening tool for mild cognitive impairment. J Am Geriatr Soc 53:695–699. 10.1111/j.1532-5415.2005.53221.x [DOI] [PubMed] [Google Scholar]
- Nichols TE, Das S, Eickhoff SB, Evans AC, Glatard T, Hanke M, Kriegeskorte N, Milham MP, Poldrack RA, Poline JB, Proal E, Thirion B, Van Essen DC, White T, Yeo BT (2017) Best practices in data analysis and sharing in neuroimaging using MRI. Nat Neurosci 20:299–303. 10.1038/nn.4500 [DOI] [PMC free article] [PubMed] [Google Scholar]
- Ossenkoppele R, et al. (2015) The behavioural/dysexecutive variant of Alzheimer's disease: clinical, neuroimaging and pathological features. Brain 138:2732–2749. 10.1093/brain/awv191 [DOI] [PMC free article] [PubMed] [Google Scholar]
- Pascual-Marqui RD, Michel CM, Lehmann D (1994) Low resolution electromagnetic tomography: a new method for localizing electrical activity in the brain. Int J Psychophysiol 18:49–65. 10.1016/0167-8760(84)90014-x [DOI] [PubMed] [Google Scholar]
- Perl YS, Bocaccio H, Pallavicini C, Pérez-Ipiña I, Laureys S, Laufs H, Kringelbach M, Deco G, Tagliazucchi E (2021) Nonequilibrium brain dynamics as a signature of consciousness. Phys Rev E 104:014411. 10.1103/PhysRevE.104.014411 [DOI] [PubMed] [Google Scholar]
- Piguet O, Hornberger M, Mioshi E, Hodges JR (2011) Behavioural-variant frontotemporal dementia: diagnosis, clinical staging, and management. Lancet Neurol 10:162–172. 10.1016/S1474-4422(10)70299-4 [DOI] [PubMed] [Google Scholar]
- Poldrack RA, Baker CI, Durnez J, Gorgolewski KJ, Matthews PM, Munafò MR, Nichols TE, Poline JB, Vul E, Yarkoni T (2017) Scanning the horizon: towards transparent and reproducible neuroimaging research. Nat Rev Neurosci 18:115–126. 10.1038/nrn.2016.167 [DOI] [PMC free article] [PubMed] [Google Scholar]
- Pollatos O, Schandry R (2004) Accuracy of heartbeat perception is reflected in the amplitude of the heartbeat‐evoked brain potential. Psychophysiology 41:476–482. 10.1111/1469-8986.2004.00170.x [DOI] [PubMed] [Google Scholar]
- Prado P, Birba A, Cruzat J, Santamaría-García H, Parra M, Moguilner S, Tagliazucchi E, Ibañez A (2022) Dementia ConnEEGtome: towards multicentric harmonization of EEG connectivity in neurodegeneration. Int J Psychophysiol 172:24–38. 10.1016/j.ijpsycho.2021.12.008 [DOI] [PMC free article] [PubMed] [Google Scholar]
- Prigogine I, Stengers I (1984) Order out of chaos: man's new dialogue with nature, Ed 1. New York: Bantam New Age Books. [Google Scholar]
- Rascovsky K, et al. (2011) Sensitivity of revised diagnostic criteria for the behavioural variant of frontotemporal dementia. Brain 134:2456–2477. 10.1093/brain/awr179 [DOI] [PMC free article] [PubMed] [Google Scholar]
- Salamone PC, Esteves S, Sinay VJ, García-Cordero I, Abrevaya S, Couto B, Adolfi F, Martorell M, Petroni A, Yoris A, Torquati K, Alifano F, Legaz A, Cassará FP, Bruno D, Kemp AH, Herrera E, García AM, Ibáñez A, Sedeño L (2018) Altered neural signatures of interoception in multiple sclerosis. Hum Brain Mapp 39:4743–4754. 10.1002/hbm.24319 [DOI] [PMC free article] [PubMed] [Google Scholar]
- Salamone PC, et al. (2021) Interoception primes emotional processing: multimodal evidence from neurodegeneration. J Neurosci 41:4276–4292. 10.1523/JNEUROSCI.2578-20.2021 [DOI] [PMC free article] [PubMed] [Google Scholar]
- Santamaría-García H, Baez S, Reyes P, Santamaría-García JA, Santacruz-Escudero JM, Matallana D, Arévalo A, Sigman M, García AM, Ibáñez A (2017) A lesion model of envy and schadenfreude: legal, deservingness and moral dimensions as revealed by neurodegeneration. Brain 140:3357–3377. 10.1093/brain/awx269 [DOI] [PMC free article] [PubMed] [Google Scholar]
- Sawilowsky SS (2009) New effect size rules of thumb. J Mod App Stat Meth 8:597–599. 10.22237/jmasm/1257035100 [DOI] [Google Scholar]
- Saxe GN, Calderone D, Morales LJ (2018) Brain entropy and human intelligence: a resting-state fMRI study. PLoS One 13:e0191582. 10.1371/journal.pone.0191582 [DOI] [PMC free article] [PubMed] [Google Scholar]
- Schandry R, Montoya P (1996) Event-related brain potentials and the processing of cardiac activity. Biol Psychol 42:75–85. 10.1016/0301-0511(95)05147-3 [DOI] [PubMed] [Google Scholar]
- Schölvinck ML, Maier A, Ye FQ, Duyn JH, Leopold DA (2010) Neural basis of global resting-state fMRI activity. Proc Natl Acad Sci U S A 107:10238–10243. 10.1073/pnas.0913110107 [DOI] [PMC free article] [PubMed] [Google Scholar]
- Schrödinger E (1929) Eddington, AS, the nature of the physical world. Die Naturwissenschaften 17:694. [Google Scholar]
- Sedeño L, et al. (2017) Tackling variability: a multicenter study to provide a gold-standard network approach for frontotemporal dementia. Hum Brain Mapp 38:3804–3822. 10.1002/hbm.23627 [DOI] [PMC free article] [PubMed] [Google Scholar]
- Seif A, Hafezi M, Jarzynski C (2021) Machine learning the thermodynamic arrow of time. Nat Phys 17:105–113. 10.1038/s41567-020-1018-2 [DOI] [Google Scholar]
- Smith SM, et al. (2013) Resting-state fMRI in the human connectome project. Neuroimage 80:144–168. 10.1016/j.neuroimage.2013.05.039 [DOI] [PMC free article] [PubMed] [Google Scholar]
- Song J, Davey C, Poulsen C, Luu P, Turovets S, Anderson E, Li K, Tucker D (2015) EEG source localization: sensor density and head surface coverage. J Neurosci Methods 256:9–21. 10.1016/j.jneumeth.2015.08.015 [DOI] [PubMed] [Google Scholar]
- Srinivasan R, Winter WR, Ding J, Nunez PL (2007) EEG and MEG coherence: measures of functional connectivity at distinct spatial scales of neocortical dynamics. J Neurosci Methods 166:41–52. 10.1016/j.jneumeth.2007.06.026 [DOI] [PMC free article] [PubMed] [Google Scholar]
- Sun J, Wang B, Niu Y, Tan Y, Fan C, Zhang N, Xue J, Wei J, Xiang J (2020) Complexity analysis of EEG, MEG, and fMRI in mild cognitive impairment and Alzheimer’s disease: a review. Entropy (Basel) 22:239. 10.3390/e22020239 [DOI] [PMC free article] [PubMed] [Google Scholar]
- Tagliazucchi E, Balenzuela P, Fraiman D, Chialvo DR (2012) Criticality in large-scale brain FMRI dynamics unveiled by a novel point process analysis. Front Physiol 3:15. 10.3389/fphys.2012.00015 [DOI] [PMC free article] [PubMed] [Google Scholar]
- Terhaar J, Viola FC, Bär KJ, Debener S (2012) Heartbeat evoked potentials mirror altered body perception in depressed patients. Clin Neurophysiol 123:1950–1957. 10.1016/j.clinph.2012.02.086 [DOI] [PubMed] [Google Scholar]
- Troyanskaya O, Cantor M, Sherlock G, Brown P, Hastie T, Tibshirani R, Botstein D, Altman RB (2001) Missing value estimation methods for DNA microarrays. Bioinformatics 17:520–525. 10.1093/bioinformatics/17.6.520 [DOI] [PubMed] [Google Scholar]
- Turchi J, Chang C, Ye FQ, Russ BE, Yu DK, Cortes CR, Monosov IE, Duyn JH, Leopold DA (2018) The basal forebrain regulates global resting-state fMRI fluctuations. Neuron 97:940–952.e4. 10.1016/j.neuron.2018.01.032 [DOI] [PMC free article] [PubMed] [Google Scholar]
- Tzourio-Mazoyer N, Landeau B, Papathanassiou D, Crivello F, Etard O, Delcroix N, Mazoyer B, Joliot M (2002) Automated anatomical labeling of activations in SPM using a macroscopic anatomical parcellation of the MNI MRI single-subject brain. Neuroimage 15:273–289. 10.1006/nimg.2001.0978 [DOI] [PubMed] [Google Scholar]
- van Loenhoud AC, Wink AM, Groot C, Verfaillie SCJ, Twisk J, Barkhof F, van Berckel B, Scheltens P, van der Flier WM, Ossenkoppele R (2017) A neuroimaging approach to capture cognitive reserve: application to Alzheimer's disease. Hum Brain Mapp 38:4703–4715. 10.1002/hbm.23695 [DOI] [PMC free article] [PubMed] [Google Scholar]
- Varoquaux G (2018) Cross-validation failure: small sample sizes lead to large error bars. Neuroimage 180:68–77. 10.1016/j.neuroimage.2017.06.061 [DOI] [PubMed] [Google Scholar]
- Wang Z (2020) Brain entropy mapping in healthy aging and Alzheimer's disease. Front Aging Neurosci 12:596122. 10.3389/fnagi.2020.596122 [DOI] [PMC free article] [PubMed] [Google Scholar]
- Warbrick T (2022) Simultaneous EEG-fMRI: what have we learned and what does the future hold? Sensors 22:2262. 10.3390/s22062262 [DOI] [PMC free article] [PubMed] [Google Scholar]
- Wen H, Liu Z (2016) Broadband electrophysiological dynamics contribute to global resting-state fMRI signal. J Neurosci 36:6030–6040. 10.1523/JNEUROSCI.0187-16.2016 [DOI] [PMC free article] [PubMed] [Google Scholar]
- Wong CW, Olafsson V, Tal O, Liu TT (2013) The amplitude of the resting-state fMRI global signal is related to EEG vigilance measures. Neuroimage 83:983–990. 10.1016/j.neuroimage.2013.07.057 [DOI] [PMC free article] [PubMed] [Google Scholar]
- Xue SW, Guo Y (2018) Increased resting-state brain entropy in Alzheimer's disease. Neuroreport 29:286–290. 10.1097/WNR.0000000000000942 [DOI] [PubMed] [Google Scholar]
- Yoris A, García AM, Traiber L, Santamaría-García H, Martorell M, Alifano F, Kichic R, Moser JS, Cetkovich M, Manes F, Ibáñez A, Sedeño L (2017) The inner world of overactive monitoring: neural markers of interoception in obsessive-compulsive disorder. Psychol Med 47:1957–1970. 10.1017/S0033291717000368 [DOI] [PubMed] [Google Scholar]
- Yoris A, Abrevaya S, Esteves S, Salamone P, Lori N, Martorell M, Legaz A, Alifano F, Petroni A, Sánchez R, Sedeño L, García AM, Ibáñez A (2018) Multilevel convergence of interoceptive impairments in hypertension: new evidence of disrupted body-brain interactions. Hum Brain Mapp 39:1563–1581. 10.1002/hbm.23933 [DOI] [PMC free article] [PubMed] [Google Scholar]
- Zanin M, Güntekin B, Aktürk T, Hanoğlu L, Papo D (2019) Time irreversibility of resting-state activity in the healthy brain and pathology. Front Physiol 10:1619. 10.3389/fphys.2019.01619 [DOI] [PMC free article] [PubMed] [Google Scholar]
- Zhao Q, Lu H, Metmer H, Li WXY, Lu J (2018) Evaluating functional connectivity of executive control network and frontoparietal network in Alzheimer's disease. Brain Res 1678:262–272. 10.1016/j.brainres.2017.10.025 [DOI] [PubMed] [Google Scholar]
- Zhao Q, Sang X, Metmer H, Swati ZNNK, Lu J (2019) Functional segregation of executive control network and frontoparietal network in Alzheimer's disease. Cortex 120:36–48. 10.1016/j.cortex.2019.04.026 [DOI] [PubMed] [Google Scholar]
- Zhou J, Seeley WW (2014) Network dysfunction in Alzheimer's disease and frontotemporal dementia: implications for psychiatry. Biol Psychiatry 75:565–573. 10.1016/j.biopsych.2014.01.020 [DOI] [PubMed] [Google Scholar]