

Abstract
Forebrain dopamine-sensitive (dopaminoceptive) neurons play a key role in movement, action selection, motivation, and working memory. Their activity is altered in Parkinson’s disease, addiction, schizophrenia, and other conditions, and drugs that stimulate or antagonize dopamine receptors have major therapeutic applications. Yet, similarities and differences between the various neuronal populations sensitive to dopamine have not been systematically explored. To characterize them, we compared translating mRNAs in the dorsal striatum and nucleus accumbens neurons expressing D1 or D2 dopamine receptor and prefrontal cortex neurons expressing D1 receptor. We identified genome-wide cortico-striatal, striatal D1/D2 and dorso-ventral differences in the translating mRNA and isoform landscapes, which characterize dopaminoceptive neuronal populations. Expression patterns and network analyses identified novel transcription factors with presumptive roles in these differences. Prostaglandin E2 was a candidate upstream regulator in the dorsal striatum. We pharmacologically explored this hypothesis and showed that misoprostol, a prostaglandin E2 (PGE2) receptors agonist, decreased the excitability of D2 striatal projection neurons in slices and diminished their activity in vivo during novel environment exploration. We found that it also modulates mouse behavior including by facilitating reversal learning. Our study provides powerful resources for characterizing dopamine target neurons, new information about striatal gene expression patterns and regulation. It also reveals the unforeseen role of PGE2 in the striatum as a potential neuromodulator and an attractive therapeutic target.
INTRODUCTION
Dopamine exerts neuromodulatory effects on large brain regions, including the dorsal striatum (DS), nucleus accumbens (NAc), and the prefrontal cortex (PFC)1. Among the five types of dopamine receptors, the D1 and D2 receptors (DRD1 and DRD2) are the most abundant in striatal projection neurons (SPNs, a.k.a. medium-size spiny neurons, MSNs). In the DS, D1-SPNs form the direct pathway, whereas D2-SPNs provide the first link in the indirect pathway2, both working in an integrated manner to shape behavior3. Dopamine receptors are also expressed, at much lower levels, in PFC4 pyramidal cells and GABAergic interneurons5,6. Dopamine controls movement execution, reward processing, and working memory7. Dopamine reduction results in Parkinsonian syndromes, whereas its repeated increase by drugs of abuse is a key element leading to addiction8,9. Alterations in dopamine transmission are also implicated in hyperactivity and attention deficit disorder and schizophrenia10. D2-SPNs are the first to degenerate in Huntington’s disease11 and DRD2 are decreased in chronic addiction12. Global differences in gene expression between D1- and D2-SPNs are well-documented13–16, whereas little is known about differences between DS, NAc, and PFC despite their specific functions and roles in pathology17. Single-cell RNA sequencing (RNAseq) emphasized the existence of multiple striatal cell populations18–20 but did not provide an in-depth characterization of regional differences or PFC D1-neurons.
To address regional differences in dopamine-sensitive (dopaminoceptive) neurons, we characterized their ribosome-associated mRNAs, or “translatome”14,21,22 using translating ribosome affinity purification (TRAP) combined with RNAseq (TRAP-Seq) in transgenic mice expressing enhanced green fluorescent protein (EGFP) fused to L10a ribosomal protein (Rpl10a)21,22 under the control of the Drd1 or Drd2 promoter14 (D1-TRAP and D2-TRAP mice). We explored mRNA expression and isoform/splicing profiles and found major differences between PFC and striatum D1-neurons, and, in the striatum, similarities and differences between D1- and D2-SPNs depending on their dorso-ventral localization. This comprehensive data set identified expression patterns of any gene of interest in dopaminoceptive cells. Network analysis indicated transcription factors possibly involved in striatal regional specification. Analysis of upstream regulators pointed to the potential role of prostaglandin E2 (PGE2) in the striatum and we provide evidence for its important modulatory role in dorsal striatum D2-SPNs.
METHODS
see Supplementary information for detailed procedures
Animals
We used male and female transgenic D1- and D2-TRAP14 (Supplementary Table 1a), Drd1-Cre, Drd2-Cre, Drd1-tdTomato, and Ai14-tdTomato, and wild-type male C57Bl/6 mice. Animal protocols followed the local and national regulations of the laboratory where they were performed (specifics in Supplementary Methods).
TRAP-Seq
TRAP mice were sacrificed by decapitation, the brain placed in an ice-cold brain form to cut thick slices and dissect PFC, NAc, and DS (Fig.1b). Samples from 1-3 mice (Supplementary Table 1a) were pooled for cell-type-specific ribosome-bound mRNA immunoprecipitation14,22. Reverse-transcribed mRNA (5 ng) was used for library construction and sequencing on Illumina HiSeq 2500 (>20 million 50-bp paired-end reads per sample).
Fig.1: EGFP-L10a expression and differences in ribosome-associated mRNA expression in the PFC and striatum of D1-TRAP mice.
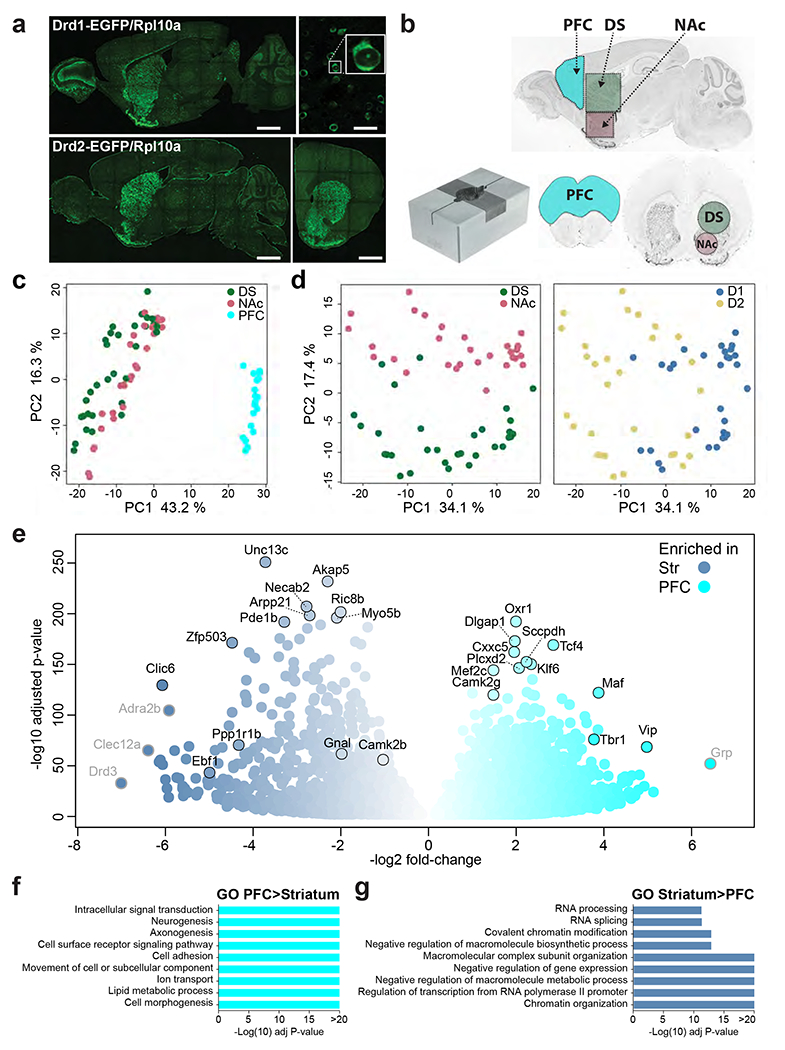
a. Brain sections from representative TRAP mice showing the location of the cells expressing EGFP-L10a (direct EGFP fluorescence). Upper panel, D1-TRAP mouse, left picture sagittal section (scale bar 1.5 mm), right picture higher magnification of the striatum (scale bar 50 μm) and blow up of a single neuron illustrating cytoplasmic and nucleolar labeling. Lower panel, D2-TRAP mouse, left picture, sagittal section, right picture, coronal section through the striatum (scale bars 1.5 mm). Images are stitched confocal sections. b. Collection of brain tissue samples. Brains were rapidly dissected and placed in a stainless steel matrix (lower left panel) with 0.5 mm coronal section interval, and two thick slices containing the PFC (cyan, 2 mm-thick) and the striatum (3 mm-thick) were obtained. The PFC was cut, and the dorsal striatum (DS, green) and the nucleus accumbens (NAc, light red) were punched out with a metal cannula on ice. Limits of the tissue samples are indicated on sagittal (left panel) and coronal (right panel) sections. c. PCA of RNAseq gene expression assessed in TRAP-purified mRNAs from PFC, DS and NAc of D1- or D2-TRAP mice. Each point corresponds to a sample of tissues from 1-3 mice. d. PCA of RNAseq from the DS and NAc of D1- and D2-TRAP mice. The same plot was differentially colored for DS and NAc samples (left panel) or D1 and D2 samples (right panel). e. Volcano plot showing differential mRNA expression between striatal D1 samples (blue) and D1 samples from PFC (cyan). Names of some top representative mRNAs are indicated (those with low expression levels are in grey). f-g. Main gene ontology (GO) pathways for genes more expressed in PFC than in striatum (f) or more expressed in striatum than in PFC (g). Only the most significant non-redundant pathways are shown. For complete results, see Supplementary Tables 3g, h.
Bioinformatics analysis
After raw data quality assessment using FastQC23, libraries were mapped to Mus musculus genome GRCm38 (UCSC mm10) using HISAT224. Reads were quantified (SeqMonk25) and exported with the corresponding gene annotations, excluding sex chromosomes (NCBI-GEO #GSE137153). Differential expression was assessed with DESeq226. After filtering out sequencing bias with RSeQC27 differential exon usage was determined with DEXseq28 and Ensembl release 70. For network inference we followed DREAM5 conclusions29 and combined CLR30 and GENIE331, visualized with Cytoscape32 (Supplementary material: Network-Inference.R).
mRNA and protein analysis
Reverse transcription quantitative PCR (RT-qPCR) was normalized to a house-keeping gene using the delta-delta-CT (ddCT) method. Receptors mRNA expression was detected by single molecule fluorescent in situ hybridization (smFISH)33, confocal microscopy (Leica SP8) and image analysis at the Montpellier RIO imaging facility. Immunoblotting of CNTNAP2/Caspr2 isoforms34, PKA substrates35, and phospho-rpS6 immunohistofluorescence36 were as described.
Pharmacological treatments
For acute i.p. injections, misoprostol (0.1 mg.kg-1) was dissolved in phosphate-buffered saline (PBS) and haloperidol in saline. For chronic infusion, osmotic mini-pumps were placed under pentobarbital (40-60 mg.kg−1) anesthesia either i.p. (model 1004; Alzet, Palo Alto, CA) or subcutaneously (Alzet model 2004) and connected to bilateral 28-gauge stainless steel cannulas stereotaxically implanted in the DS and fixed on the skull37.
Electrophysiology
Mice injected with misoprostol or saline were anesthetized with isoflurane, decapitated and coronal brain slices were prepared. D1-SPNs and putative D2-SPNs identified in the DS were patch-clamped and recorded in whole-cell voltage or current clamp as described38.
Fiber photometry
Drd1-Cre or Drd2-Cre mice were anesthetized and stereotactically injected with pAAV.Syn.Flex.GCaMP6f.WPRE.SV40 virus into the DS or NAc, as described39. A chronically implantable cannula composed of an optical fiber and a fiber ferrule was implanted 100 μm above the location of the viral injection site and fixed onto the skull. Real-time fluorescence was recorded40 before and after change in environment (mouse placed in a new cage). Each mouse was recorded twice with an interval of at least a day and received an i.p. injection of misoprostol (0.1 mg.kg−1) or vehicle, 30 min (in random order) before the recording start.
Behavioral assays
Haloperidol-induced catalepsy was measured 45-180 min after haloperidol injection. The behavior of mice chronically implanted with osmotic minipumps was explored using rotarod and food-cued Y-maze, adapted from T-maze paradigm41, 9-15 days and 20-25 days after implantation, respectively.
RESULTS
Data quality
We molecularly profiled D1- and D2-neurons in D1- and D2-TRAP mice. We verified that they expressed high levels of EGFP-L10a in the cytoplasm (Fig.1a) with a pattern consistent with the previously described expression in D1- and D2-SPNs14,42. In the PFC only D1-TRAP mice expressed sufficient amounts of EGFP-Rpl10a to allow ribosome-associated mRNA purification. We studied by TRAP-Seq mRNA from PFC, DS, and NAc in D1-TRAP mice and DS and NAc in D2-TRAP mice (Fig.1b), using 14-19 independent samples per population (Supplementary Table 1a). RNAseq at high read depth yielded 37-62 million reads per sample (Supplementary Table 1b) and a total of 20,689 out of 25,883 genes in the reference genome used were mapped in at least one sample (Supplementary Table 1c). Read numbers were low for signature transcripts of non-neuronal cells (Supplementary Table 1d). Principal component analysis (PCA) showed high data reproducibility and lower biological replicates variability than differences between regions (Fig.1c,d). The main source of variance between the 79 samples was the brain region (43% of the variance, Fig.1c) and within the striatum, D1/D2 (PC1, 34%) and DS/NAc (PC2, 17%, Fig.1d). We compared the translatomes of these various populations of dopamine target neurons using DESeq2 (Supplementary Table 2), presented below as two-by-two comparisons. To select the most biologically relevant differences between the two cell populations, we used stringent criteria (Padj <0.001, fold-change ≥2, i.e., L2FC>1, expression level baseMean ≥10) and also pinpointed genes consistently differentially expressed by identifying mRNAs higher in all samples of one population than in all samples of the other.
Comparison of translating mRNA in PFC and striatum D1-neurons
Several thousand gene products were differentially associated with ribosomes between D1 neurons of the PFC and striatum (i.e., pooled DS and NAc, Supplementary Tables 3a,b), with a significance threshold (Padj < 0.01), illustrating the power of TRAP-Seq applied to many independent biological replicates. Differences are presented with stringent significance criteria (Fig.1e, Supplementary Tables 3c,d) or consistency in all samples of PFC (Supplementary Tables 3e,f). We confirmed the validity of TRAP-Seq differences in independent wild-type samples, using RT-qPCR for transcripts with diverse levels of expression and enrichment in the PFC (Supplementary Fig.1a). In situ hybridization patterns (Allen Brain Institute http://mouse.brain-map.org/) showed similar differences for some genes (e.g., Tbr1), but TRAP-Seq was more informative for less expressed ones (Supplementary Fig.1b).
The core set of differentially expressed genes included transcripts characteristic of cortical pyramidal cells or SPNs. Gene ontology (GO) analysis indicated that genes more expressed in PFC are also related to neuronal differentiation, morphogenesis, and adhesion (Fig.1f, Supplementary Table 3g). In contrast, those more expressed in the striatum are also related to RNA processing, chromatin, and transcription (Fig.1g, Supplementary Table 3h), underlining major differences between the transcriptional/translational landscapes in cortical and striatal D1-neurons. These differences provide information about the distinct properties of D1-neurons in PFC and striatum illustrated by genes with identified functions in the International union of basic and clinical pharmacology (IUPHAR) data base (Supplementary Tables 3i,j).
The sequencing depth and sample number allowed investigating differences in usage of individual exons, corresponding to different mRNA isoforms generated by alternative splicing or selection of transcription start site or polyadenylation site (Supplementary Table 4). Approximately 4,000 exon fragments were differentially used (Supplementary Tables 5a,b), with several differences often occurring in the same genes (Supplementary Table 5c). The exon usage changes were dissociated from those in total gene expression (congruent in only 20-30% of genes with exon usage differences, Supplementary Tables 5d,e). A striking example is Arpp21, which included 42 exons more used in PFC compared to 19 more used in striatum (Supplementary Table 5f). Interestingly, striatal-enriched exons included the coding sequence of ARPP-21 (Supplementary Table 5f, highlighted blue), a regulator of calmodulin signaling43 enriched in SPNs44, whereas PFC-enriched exons included those coding for TARPP (highlighted orange), a longer protein first described in thymocytes45, which binds RNA through domains absent from ARPP-2146. These results provide the first in-depth characterization of the transcripts in D1-neurons in the PFC and striatum, revealing the high degree of cell-type specificity of isoform expression, which is in part independent of total gene expression regulation.
Comparison of translating mRNA in striatal D1- and D2-neurons
We examined differences between D1- and D2-neurons in the DS and NAc (Fig.2a–b, Supplementary Tables 2, 6a–g). Although TRAP could enrich ribosome-associated mRNA from both D2-SPNs and cholinergic interneurons (ChINs) that also express Drd247, the levels of ChIN markers significantly enriched in D2 vs. D1 neurons were very low (Supplementary Tables 1d, 2), indicating that ChINs represented a minor component of the total mRNA. This low contribution contrasts with that observed in D2-Ribo-Tag mice33, in which the expression of the reporter is driven by the endogenous Rpl22 promoter independently of the activity of the Drd2 promoter. We concluded that most of TRAP-Seq striatal mRNA originated from D1- and D2-SPNs and analyzed their differences in the DS and NAc separately. In the DS, D1-SPNs innervate the substantia nigra and the internal globus pallidus, while D2-SPNs project to the external globus pallidus2, whereas in the NAc, receptor expression pattern and neuronal connections are less dichotomic48,49. Using stringent criteria (Fig.2a,b, Supplementary Tables 6h–m) we found many D1/D2 differences common between NAc and DS (Fig.2c, Supplementary Tables 6j,m), underlining the existence of similar population-specific gene expression mechanisms in these two regions. We present genes providing robust markers in Supplementary Tables 6n–s, GO pathways enrichment in Fig.2d and Supplementary Tables 7a–c, and IUPHAR function in Supplementary Tables 7g,h.
Fig.2: Differential ribosome-associated mRNA expression in striatal regions of D1- and D2-TRAP mice.
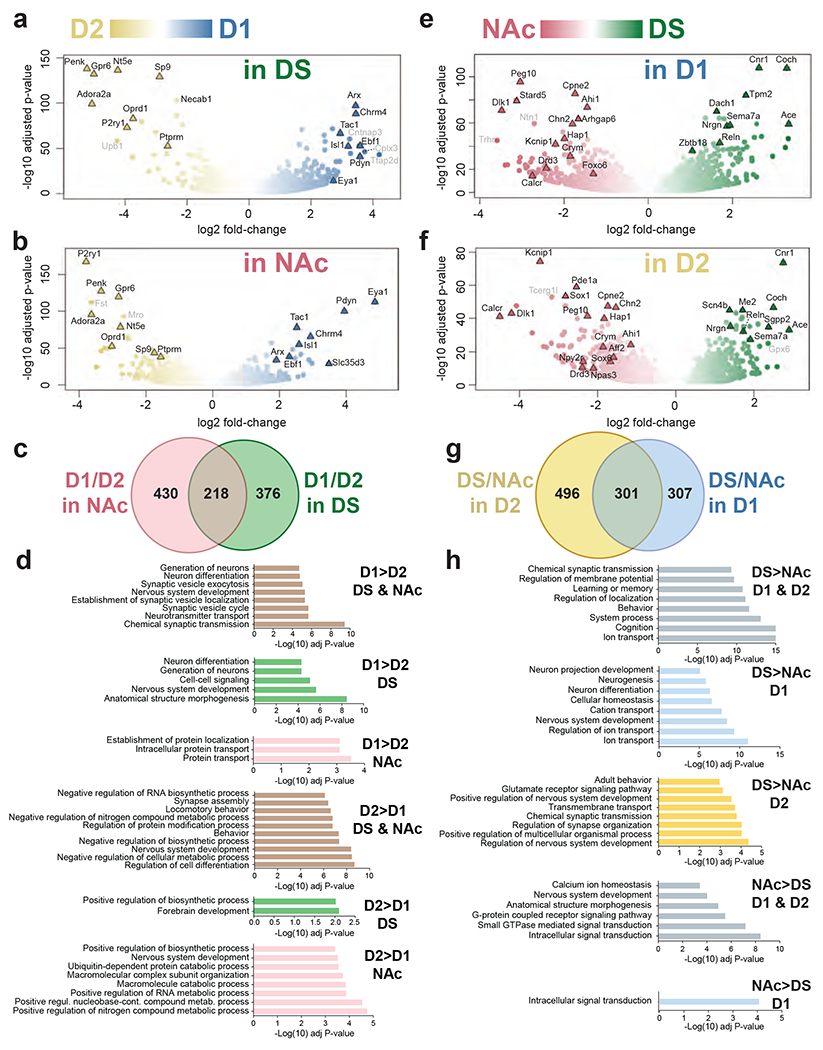
mRNA was purified by BAC-TRAP from the DS and NAc of D1- or D2-TRAP mice and analyzed by RNAseq. a-b. Volcano plots of the differences in expression patterns between D1 (blue) and D2 (yellow) samples in the DS (a) or the NAc (b). c. Venn diagram of data in a and b showing the number of mRNAs differentially expressed in D1 vs. D2 samples in the NAc (light red) and DS (green). d. Main gene ontology (GO) pathways for genes more expressed in D1 or in D2 neurons in DS, NAc or both, as indicated. Only the most significant non-redundant pathways are shown. For complete results, see Supplementary Tables 7a–f. e, f. Volcano plot of the differences between DS (green) and NAc (red) in D1 (e) and D2 (f) samples. g. Venn diagram of the data in e and f showing the number of mRNAs differentially expressed in DS vs. NAc samples in the D1 (blue) and D2 (yellow) samples. h. Main gene ontology (GO) pathways for genes more expressed in DS or in NAc neurons in D1, D2, or both, as indicated. Only the most significant non-redundant pathways are shown (complete results in Supplementary Tables 12a–f). In a, b, e, and f, the names of top representative mRNAs are indicated (those with low expression levels are in grey). In a-c and e-g thresholds were Padj < 10−3, fold-change > 2 and mean baseMean ≥ 10.
We then examined the D1/D2 differences in exon usage in DS and NAc (Supplementary Tables 8,9). The differences were less numerous in DS (Supplementary Tables 10a,b) than in NAc (Supplementary Tables 10c,d). In either case the same genes often included several differentially used exons (Supplementary Tables 10e). Most D1/D2 differences observed in DS were also found in NAc, including genes with some exons preferentially expressed in D1 and others in D2 neurons. Characteristic examples are the neurexin genes (Nrx1-3), which encode presynaptic adhesion proteins with many splice isoforms and alternative transcription start sites with cell-type specific expression and properties50 (Supplementary Table 10e, highlighted blue).
Comparison of translating mRNA DS and NAc neurons
As shown by PCA (Fig.1d), gene expression profiles easily distinguish DS and NAc samples in both D1- and D2-neurons (Fig.2e,f, Supplementary Tables 2, 11a–s), in line with the many differences between these two regions17,51. RT-qPCR in wild-type mice confirmed differences for selected genes (Supplementary Fig.2a,b) with only some visually detectable by in situ hybridization (Supplementary Fig.2c,d). D1- and D2-neurons shared many of these dorso-ventral differences (Fig.2g, Supplementary Tables 11a,d). GO analysis indicated a predominance of ion transport-related pathways in DS and signaling pathways in NAc (Fig.2h, Supplementary Tables 12a–f, IUPHAR function in Supplementary Tables 12g,h).
We also investigated the DS/NAc differences in exon usage (Supplementary Tables 13, 14). As above for the D1/D2 differences, these differences were concentrated in a relatively small number of genes, which often included several differentially expressed exons (Supplementary Tables 15a–e). Many DS/NAc differences were common between D1- and D2-neurons (up to half of those in D1-neurons, Supplementary Table 15e), highlighting common regulatory mechanisms in these two populations. Only a small proportion of differences in exon usage corresponded to overall differences in gene expression (Supplementary Tables 15f–i). As an example, we focused on Cntnap2, a gene coding for a transmembrane cell-adhesion protein, Caspr2, associated with autism spectrum disorder and other neuropsychiatric disorders52. A short isoform (Iso2) lacks the extracellular domain and corresponding protein-protein interactions of the full-length isoform53 (Iso1, Supplementary Fig.3a–e). Exons encoding the extracellular domain, specific for Iso1, were enriched in the DS compared to the NAc whereas exons common to Iso1 and Iso2 were enriched in the NAc, in both D1- and D2-neurons (Supplementary Table 15e, Supplementary Fig.3b,c). These results were confirmed at the protein level by immunoblotting, with a Iso2/Iso1 ratio higher in the NAc than in the DS (Supplementary Fig.3d,e). These results suggest possible Cntnap2 functional differences in NAc and DS in relation to Iso2 levels and illustrate the utility of high-resolution translatome comparisons between neuronal populations. Overall the comparison of NAc and DS separately for D1- and D2-neurons reveals the importance of dorso-ventral differences shared, to a large extent, by the two populations.
Comparison with other approaches
The number of differences we identified between D1- and D2-neurons was much larger than with TRAP-microarrays14 (Supplementary Fig.4a). The few genes for which we did not replicate differential expression had low fold-changes in both studies (Supplementary Fig.4b,c). We confirmed many D1-enriched (80%) and D2-enriched (67%) genes identified in a study using single-cell RNAseq18, a technique that avoids possible insertional effects of BAC-TRAP transgene, and revealed many other genes (Supplementary Fig.4d). Most genes we did not confirm exhibited a low expression (e.g., Rbp4) and/or a low fold-change (|Log2FC|<1). Discrepancies may originate from sampling bias or stochastic dropout of genes with low base counts in single-cells.
Transcription factor expression and transcriptional networks
Since the mRNA isolated by our TRAP-Seq approach in the striatum mostly originated from SPNs (see above), we sought to identify putative regulators of their transcriptional profiles by focusing on transcription factor (TF) mRNA (Supplementary Tables 16a–f). The top differentially expressed TFs included some previously described during development, including higher expression in D1-SPNs of DS and NAc of Isl1 and Ebf1, which govern striatonigral neuron differentiation54–56. Conversely, Sp9 was more expressed in all D2-SPNs and Ikzf2 (Helios) in DS D2-SPNs than in DS D1-SPNs, in agreement with their role in striatopallidal neurons development57,58. Importantly, we identified many other TFs with D1/D2 or DS/NAc differences (Supplementary Tables 16a–f), whose role in striatal differentiation has not yet been explored. Some but not all of these TFs have been associated with neuronal development outside of the striatum59–61. Our results provide strong incentive for their exploration in SPNs differentiation.
To evaluate the potential functional importance of TFs in the regulation of transcriptional profiles in adult striatal neurons, we then used a gene expression-based network inference procedure (see Supplementary Methods, Supplementary Figs. 5 and 6). Coloring this subnetwork with relative expression in D1 and D2 populations or in DS and NAc, suggests key TFs. Genes linked to Nr4a2, coding for Nurr1 associated with the development of dyskinesia62,63 and Ebf1 (see above) are strongly differentially expressed between D1-band D2-SPNs (Supplementary Fig.5). In contrast, genes linked to Onecut2, a homeobox gene associated with neuronal differentiation64, and Zbtb18 are strongly differentially expressed in DS and NAc (Supplementary Figure 6, Supplementary Tables 6a,b). Zbtb18 encodes a transcriptional repressor of key proneurogenic genes whose mutation is implicated in intellectual deficit65. Interestingly, most influences of Zbtb18 are outgoing (66/83) or bidirectional predominantly outgoing (7/83) (Supplementary Fig.7), suggesting it is an important upstream regulator of gene expression in the striatum. Thus, our analysis suggests that Onecut2 and Zbtb18 are TFs important for striatal dorso-ventral differences.
Modulatory role of PGE2 in the dorsal striatum
In a different approach to identifying potential factors contributing to DS/NAc differences, we used Ingenuity pathway analysis (IPA) combining D1 and D2 neuron data (Supplementary Table 17). Prostaglandin 2 (PGE2) was a top candidate among endogenous molecules regulating DS-enriched genes and we further investigated its possible role in this region. PGE2 is produced in striatal slices in response to dopamine receptors stimulation66 and the phenotype of mice lacking PGE2 receptor-1 (Ptger1/EP1) suggests that PGE2 enhances DRD1 and DRD2 responses66. Our mRNA analysis indicated that several genes coding for proteins involved in PGE2 metabolism or action, including its receptors, Ptger1, Ptger2, and Ptger4, were expressed in SPNs (Supplementary Table 18). Single-molecule fluorescent in situ hybridization in DS showed the expression of Ptger1 and Ptger2 in both D1- and D2-SPNs, and Ptger4 mostly in D1-SPNs (Fig.3a–c). RT-qPCR indicated that these receptors mRNA were generally more abundant in DS than NAc (Fig.3d–f).
Fig.3: Expression of PGE2 receptors in the striatum and cell population-specific effects of PGE2 receptor stimulation.

a-c. Single-molecule fluorescent in situ hybridization for PGE2 receptors in the DS. Sections through the DS of brains from wild-type C57/Bl6 male mice were processed for single molecule fluorescent in situ hybridization. Sections were labeled with probes for PGE2 receptor mRNAs, Ptger1 (a), Ptger2 (b), and Ptger4 (c) in red, and Drd1 (green), and Drd2 (cyan), as indicated, and counterstained with DAPI (gray scale). Ptger1 and Ptger2 are expressed in D1- and D2-SPNs, whereas Ptger4 is mostly in D1. Confocal microscope images, scale bar, 10 μm. d-f. RT-qPCR quantification of Ptger1 (d), Ptger2 (e), and Ptger4 (f) mRNA levels in ribosome-associated mRNA purified from the NAc or DS of D1- and D2-TRAP mice. Quantification by comparative ddCt method using Rpl19 as an internal control (arbitrary units, not comparable from one graph to the other). Note that because of gene overlap with Ptger1 we cannot exclude a contribution of Pkn1 transcripts. g. Examples of immunofluorescence of pSer235-236-rpS6 (blue) in DS sections of mice treated with vehicle (PBS) or misoprostol 30 min before sacrifice. Mice were transgenic for Drd1-tdTomato (red) and D2-TRAP (green) to identify D1- and D2-SPNs. Scale bar, 30 μm. h-i. Quantification of results as in g in D1 and D2-SPNs of NAc (h) and DS (i, n=12, 6 mice per group and 2 areas of interest per mouse). Statistical analysis, 2-way ANOVA (Supplementary Table 19), Holm-Sidak’s multiple comparisons tests, ** p<0.01, **** p<10−4.
To test the functionality of PGE2 receptors we used misoprostol (0.1 mg.kg−1 i.p. 30 min), a PGE2 receptors agonist that crosses the blood-brain barrier67. Misoprostol exposure led to increased cAMP-dependent protein kinase (PKA) substrates phosphorylation measured by immunoblotting (Supplementary Fig.8a,b). Misoprostol also increased immunohistofluorescence for pSer235-236-ribosomal protein S6, a PKA-substrate36 (Fig.3g), in D2-SPNs of NAc and DS (Fig.3h–i). A similar, albeit not significant, trend was observed in D1-SPNs (Fig.3h–i).
To address functional effects of PGE2 receptors in the DS, we then performed whole-cell patch-clamp recording in brain slices of mice pretreated with misoprostol or vehicle, in which we identified D1-SPNs and putative D2-SPNs based on tdTomato fluorescence and morphology (Supplementary Fig.9a–c). Whereas misoprostol pretreatment did not alter D1-SPNs excitability (Fig.4a), it markedly decreased D2-SPNs excitability (Fig.4b). Accordingly, misoprostol pretreatment increased the minimal current to elicit action potentials (the rheobase) only in D2-SPNs (Fig.4c). Misoprostol pretreatment hyperpolarized the resting membrane potential and reduced the membrane resistance in D2-SPNs, but not in D1-SPNs (Fig.4d,e), without altering the action potential threshold (Supplementary Fig.9d). Overall, these data suggest that PGE2 receptor stimulation reduces D2-SPNs excitability by affecting intrinsic cellular properties.
Fig.4: Effects of PGE2 receptor stimulation on electrophysiological properties of DS D1-SPNs and D2-SPNs neurons.
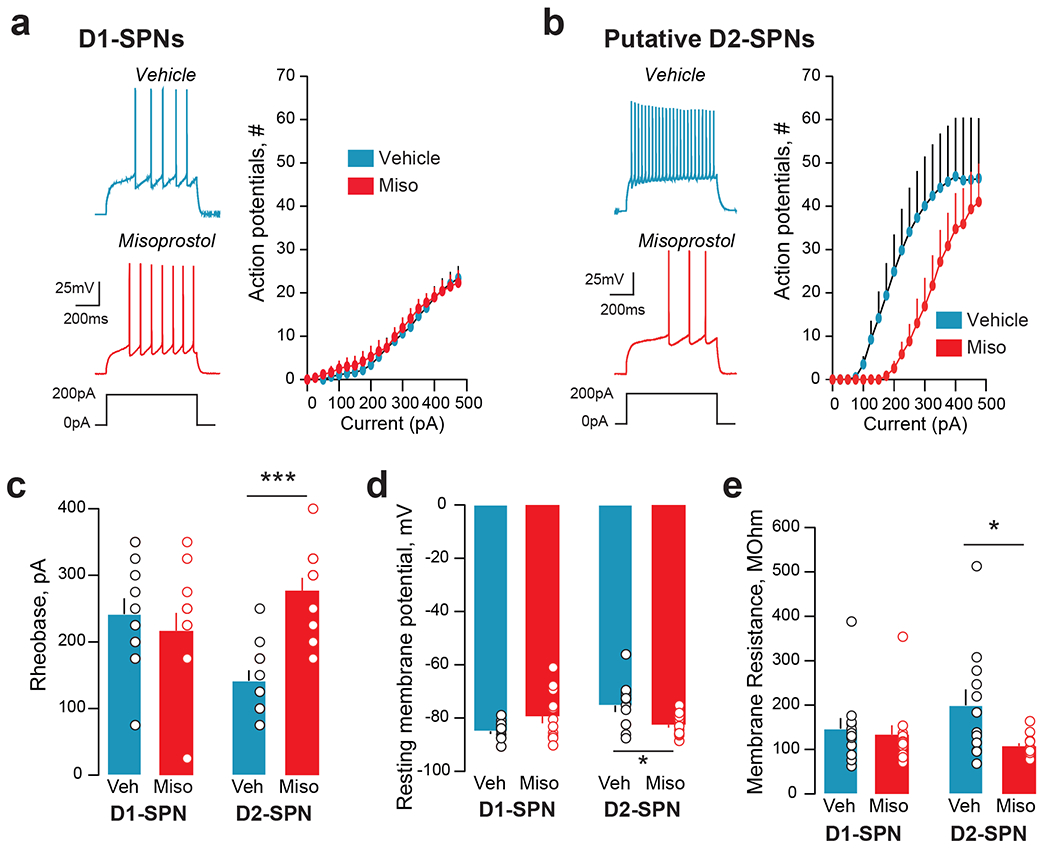
Male Drd1-Cre x Ai14 tdTomato reporter mice were injected i.p. with vehicle or misoprostol (0.1 mg.kg−1). Thirty minutes later mice were sacrificed, and brain slices were made for patch clamp electrophysiological experiments. D1- and putative D2-SPNs in the dorsomedial striatum were identified based on red fluorescence and morphology and patched. a. In current clamp, incrementally increasing depolarizing currents were injected into the cell, while action potential output was monitored. In D1-SPNs no differences occurred between cells from animals pretreated with vehicle (Veh, ncells=12; nmice=5) or with misoprostol (Miso, ncells=12; nmice=6). Left: representative examples of action potential profiles in response to a depolarizing current injection of 200 pA. Right: Average current-action potential number relationship across cells from the vehicle or misoprostol condition. Two-way repeated measures-ANOVA (RM-ANOVA), misoprostol effect not significant. b. In D2-SPNs misoprostol pre-treatment (ncells=12; mmice=5) compared to vehicle (ncells=12; nmice=5), resulted in a reduction of action potential output (RM-ANOVA, misoprostol effect, p=0.04). c. The rheobase (i.e., the minimal injected current into a neuron required to make it fire an action potential) was not affected by misoprostol pretreatment in D1-SPNs, but was significantly increased by it in D2-SPNs (2-way ANOVA, interaction, p=0.001). d. The resting membrane potential was unaltered by misoprostol in D1-SPNs, but reduced in D2-SPNs (2-way ANOVA interaction, p=0.002). e. Misoprostol reduced the membrane resistance of D2-SPNs (2-way ANOVA misoprostol effect, p=0.037). c-e, multiple comparisons with Holm-Sidak’s test, *p<0.05, ***p<0.001. See Supplementary Table 19 for detailed statistical results.
We then evaluated the effects of misoprostol in vivo using fiber photometry in awake mice expressing the calcium sensor GCaMP6f in D1- or D2-neurons (presumably essentially SPNs, Supplementary Fig.10a–c). We examined the increased activity induced by a novel environment39,68. The calcium transients in DS D1-neurons were similar in mice pretreated with vehicle or misoprostol (Fig.5a–c). In contrast, this increase was attenuated by misoprostol in DS D2-neurons (Fig.5d–f). A small effect of misoprostol was also observed in NAc D2-neurons (Supplementary Fig.10d–f). These results in slices and in vivo revealed an inhibitory effect of misoprostol on D2-neurons reminiscent of the action of a DRD2 agonist8,69. To test whether PGE2 receptor stimulation could mimic DRD2 stimulation, we pretreated mice with misoprostol or vehicle before injecting them with haloperidol, a dopamine DRD2-antagonist that induces catalepsy. Pretreatment with misoprostol inhibited haloperidol-induced catalepsy (Fig.5g), suggesting that stimulation of PGE2 receptors functionally opposes DRD2 antagonist effects.
Fig.5: Effects of PGE2 receptor stimulation on DS neurons activity and mouse behavior.
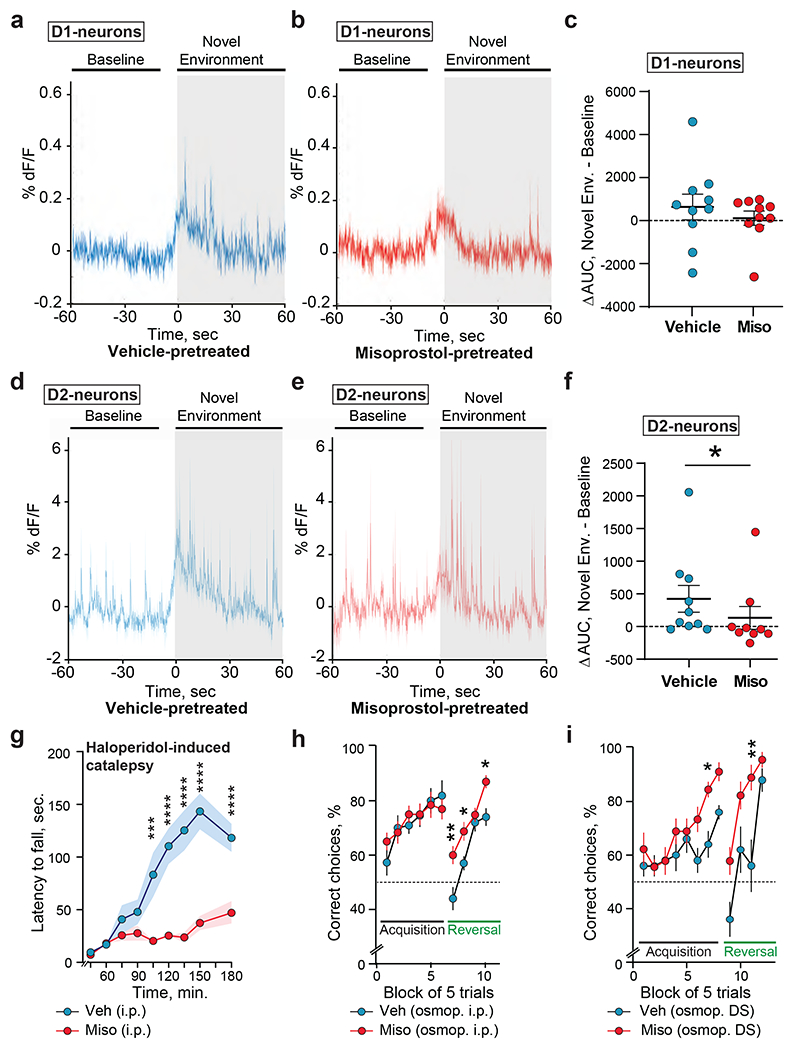
a-c. Misoprostol pretreatment does not alter D1 neurons Ca2+ activity during exploration of a novel environment (new cage). The activity was evaluated by fiber photometry in the DS of Drd1-Cre mice stereotactically injected with an AAV GCaMP6f (Supplementary Fig.10a–c). Each mouse was recorded twice with an interval ≥ 1 day, 30 min after receiving either vehicle (Veh) or misoprostol (Miso, 0.1 mg.kg−1, i.p.). a. Average traces of mice injected with vehicle and placed for 1 min in a novel environment. b. Same as in a for mice injected with misoprostol. c. Plot of the area under the curve (AUC) in a and b during the novel environment exploration (60 s) minus the AUC during baseline (50 s), 10 mice per group. Mann-Whitney test, p = 0.39. d-f. Misoprostol decreases Ca2+ responses to change in environment in D2 neurons. Same experiment as in a-c but in Drd2-Cre mice injected with vehicle (d, n = 10) or misoprostol (e, n = 9). Mann-Whitney test, p = 0.043. g. The effects of PGE2 receptors stimulation on DRD2 function were investigated by evaluating the immobility 45-180 min after haloperidol injection (0.1 mg.kg−1, i.p.), in mice pretreated 15 min before haloperidol with misoprostol (0.1 mg.kg−1, i.p.) or vehicle (9 mice per group). The same experiment was run twice on different groups of mice with results similar to the one shown here. 2-way repeated measures-ANOVA (RM-ANOVA), misoprostol and time effects, both p<10−4. h, i. Effects of chronic misoprostol on procedural learning and reversal. (h) Wild-type male mice were implanted with an i.p. osmopump delivering vehicle (20 mice) or misoprostol (24 mice). Acquisition and reversal of the food-rewarded arm choice in a Y maze was tested 20-25 days later. RM-ANOVA, misoprostol effect, learning phase, not significant, reversal, p=2.10−4. (i) Same as h except that osmopump infusion bilaterally delivered into the DS vehicle (10 mice) or misoprostol (9 mice). 2-way RM-ANOVA, misoprostol effect, learning phase, p=0.003, reversal, p=0.002. g-i, multiple comparison Holmes-Sidak’s tests, *p < 0.05, **p < 0.01, ***p<0.001, **** p<10−4. See Supplementary Table 19 for detailed statistical results.
We then evaluated effects on the behavior of long-term stimulation of PGE2 receptors, by mini-pump infusion of misoprostol or vehicle either i.p. or, to exclude peripheral effects, directly into the DS. We first examined the motor performance of these mice in a rotarod test. Although mice infused with misoprostol or vehicle, either i.p. or in the DS, learned similarly to remain on an accelerating rotarod, intrastriatal misoprostol infusion improved performance at a fixed challenging speed (Supplementary Fig.11a–d). We then examined DS-dependent procedural learning in the same mice learning to locate the baited arm in a food-cued Y-maze, without external cues, using an egocentric strategy41,70,71. The learning phase was similar in mice treated with i.p. infusion of vehicle or misoprostol, but in the reversal task, in which locations of the bated and non-reinforced arms were inverted, relearning was faster in misoprostol-treated mice (Fig.5h). The mice infused with misoprostol in the DS learned better the stable location of the bated arm and, after reversal, relearned faster than vehicle-infused animals (Fig.5i). Together these results indicate that misoprostol improved procedural learning reversal, and that this effect resulted from a local action in the DS. Because DRD2 antagonists block reversal learning in the DS72, the opposite effects of PGE2 receptors stimulation are compatible with a functional mimicry or enhancement of DRD2 stimulation. Altogether, our results reveal a modulatory role of PGE2 in the striatum decreasing the excitability and activity of D2-SPNs.
DISCUSSION
This study reports an in-depth genome-wide regional comparative analysis of translated mRNAs in the main forebrain dopaminoceptive cell populations. The TRAP-Seq method provided information about mRNA from cells highly expressing DRD1 or DRD2. As expected, striking differences were identified between cortical and striatal D1-neurons, including mRNA processing-related genes more expressed in the striatum and morphogenesis-related genes more expressed in the PFC. In the striatum we provide a comprehensive view of differences between D1- and D2-neurons, essentially corresponding to SPNs, with the first regional comparative evaluation of the DS and NAc. Our work extends previous reports13–16 on D1/D2 differences in gene expression with the use of RNAseq instead of microarrays increasing >10-fold the sensitivity of the TRAP approach. Our study also complements single-cell approaches that allow unbiased cell-type classification, but are limited to the most highly expressed genes. Single-cell RNAseq analysis suggested a transcriptional gradient attributed to the patch/matrix organization of the striatum18. Interestingly, we find that genes defining this gradient are highly enriched either in the NAc (Wfs1, Crym) or the DS (Cnr1), rather indicating a correlation with the dorso-ventral organization.
Our analyses also provided genome-wide information about exon usage and isoform differences between dopaminoceptive neuronal populations with multiple differences often grouped in the same genes. Most of these differences occurred independently from those in total mRNA levels, indicating a dissociation between regulatory mechanisms controlling cell-type-specific transcription and mRNA processing. Importantly, we show that for translating mRNA levels and exon usage, many dorso-ventral differences are shared by D1 and D2 neurons, while most D1/D2 differences are found in both the NAc and DS. This reveals the intricacy of regulations, with intersected D1/D2 and DS/NAc gene expression programs, which give rise to the identity of the various SPN populations. Our analysis of TFs identified potential regulators of these differences between D1/D2 and DS/NAc populations. This approach was validated by confirming the few TFs already known to be implicated in D1/D2 differences. We identified several additional novel TFs potentially involved in SPN regulation. Among these, gene network analyses identified a role of Nr4a2 in D1/D2 differences and Onecut2 and Zbtb18 in DS/NAc differences. These factors, which can now be experimentally investigated during development in vivo, may also help refine protocols used to generate specific subtypes of SPNs in vitro73.
In-depth striatal gene profile characterization suggested a possible influence of PGE2. Although PGE2 is an important lipid mediator extensively studied outside the nervous system, it has received little attention in the striatum66,74. We explored the potential role of PGE2 using a pharmacological approach. Misoprostol, a PGE2 receptor agonist, increased cAMP-dependent protein phosphorylation in SPNs possibly through activation of Ptger2/EP2, which increases cAMP production67 or atypical coupling of Ptger1/EP1 receptor to adenylyl cyclase-774. Misoprostol also reduced the excitability of D2-SPNs by affecting intrinsic cellular properties and decreased their Ca2+ activity during the exploration of a novel environment. These effects were presumably distinct from those on cAMP, which are expected to have opposite consequences8,9. Instead, PGE2 ability to decrease D2-SPNs activity in vivo, was similar to the stimulation of DRD2, which, in addition to decreasing cAMP, increases K+ currents and inhibits Ca2+ and Na+ currents8,69. This dual property of PGE2 is reminiscent of the ability of EP1/Ptger1 to enhance both DRD1- and DRD2-like signaling pathways beyond the classical Gq-coupling of these receptors66. The identity of the PGE2 receptors involved in the effects reported here and their potential interactions with DA receptors at the receptor level or through downstream signaling remain to be investigated. The existence of subpopulations of SPNs with distinct responses is also a possibility to explore. The possible role of PGE2 in striatal function was indicated by the effects of local infusion of misoprostol in the DS, which enhanced mouse performance on a rotarod test and improved procedural learning and its reversal. Because dopamine is reported to enhance striatal production of PGE266, these observations suggest the existence of a positive PGE2-mediated feedforward regulation of DRD2 signaling, in which dopamine-increased PGE2 reinforces dopamine effects on DRD2. Given the key functional role of D2-SPNs8, the down-regulation of DRD2 in addiction-like maladaptive behavior75, their sensitivity to neurodegeneration in Huntington’s disease11, and their importance in schizophrenia10, this potential modulatory role of PGE2 indicates novel potential pharmacological targets of therapeutic interest and warrants further exploration.
Supplementary Material
Acknowledgments
The manuscript is dedicated to the memory of Paul Greengard who passed away on April 13th, 2019, before the manuscript was completed.
Authors thank the Babraham Institute’s Bioinformatics team for help with read mapping and counting, Vincent Knight-Shrijver for his volcano-plot R script, and Lucile Marion-Poll for helpful suggestions.
Support
This work was supported by Inserm and Sorbonne Université, and grants from European Research Council (ERC, AIG-250349) and Biology for Psychiatry Laboratory of excellence (Labex Bio-Psy) to J.A.G., Fondation pour la Recherche Médicale (FRM # DPA20140629798) and ANR (Epitraces, ANR-16-CE16-0018) to J.A.G. and E.V., ANR-17-CE37-0007 (Metacognition) to C.M., the United States Army Medical Research and Material Command (USAMRMC) Award No. W81XWH-14-1-0046 to J.P.R., the Fisher Center for Alzheimer’s Disease Research to P.G., NIH grants DA018343 and DA040454 to A.C.N. E.M. was supported by a Marie Curie International Training Network (ITN) N-PLAST. A. G. is a Ramón y Cajal fellow (RYC-2016-19466) and is supported by a grant from the Spain Ministerio de Ciencia, Innovación y Universidades (Project no. RTI2018-094678-A-I00). Y.N. was recipient of Uehara Memorial Foundation and Fyssen Foundation fellowships. NGL was supported by BBSRC (BB/P013406/1, BB/P013414/1, BB/P013384/1). KDN received an Amgen Scholarship. LV received support from the Erasmus+ program. Work in FJM lab was supported by the ERC under the European Union’s Horizon 2020 research and innovation program (grant agreement 804089; ReCoDE) and the NWO Gravitation project BRAINSCAPES: A Roadmap from Neurogenetics to Neurobiology (024.004.012).
Footnotes
Conflict of interest
The authors declare no conflicts of interest.
Data sets
Sequencing data have been deposited in NCBI’s Gene Expression Omnibus and are accessible through GEO Series accession number GSE137153: https://www.ncbi.nlm.nih.gov/geo/query/acc.cgi?acc=GSE137153
REFERENCES
- 1.Bjorklund A, Dunnett SB. Dopamine neuron systems in the brain: an update. Trends Neurosci 2007; 30(5): 194–202. [DOI] [PubMed] [Google Scholar]
- 2.Gerfen CR, Engber TM, Mahan LC, Susel Z, Chase TN, Monsma FJ Jr. et al. D1 and D2 dopamine receptor-regulated gene expression of striatonigral and striatopallidal neurons. Science 1990; 250: 1429–1432. [DOI] [PubMed] [Google Scholar]
- 3.Tecuapetla F, Jin X, Lima SQ, Costa RM. Complementary Contributions of Striatal Projection Pathways to Action Initiation and Execution. Cell 2016; 166(3): 703–715. [DOI] [PubMed] [Google Scholar]
- 4.Beaulieu JM, Gainetdinov RR. The physiology, signaling, and pharmacology of dopamine receptors. Pharmacol Rev 2011; 63(1): 182–217. [DOI] [PubMed] [Google Scholar]
- 5.Santana N, Mengod G, Artigas F. Quantitative analysis of the expression of dopamine D1 and D2 receptors in pyramidal and GABAergic neurons of the rat prefrontal cortex. Cereb Cortex 2009; 19(4): 849–860. [DOI] [PubMed] [Google Scholar]
- 6.Khlghatyan J, Quintana C, Parent M, Beaulieu JM. High Sensitivity Mapping of Cortical Dopamine D2 Receptor Expressing Neurons. Cereb Cortex 2019; 29(9): 3813–3827. [DOI] [PMC free article] [PubMed] [Google Scholar]
- 7.Schultz W Multiple dopamine functions at different time courses. Annu Rev Neurosci 2007; 30: 259–288. [DOI] [PubMed] [Google Scholar]
- 8.Gerfen CR, Surmeier DJ. Modulation of striatal projection systems by dopamine. Annu Rev Neurosci 2011; 34: 441–466. [DOI] [PMC free article] [PubMed] [Google Scholar]
- 9.Girault JA. Signaling in striatal neurons: the phosphoproteins of reward, addiction, and dyskinesia. Prog Mol Biol Transl Sci 2012; 106: 33–62. [DOI] [PubMed] [Google Scholar]
- 10.Simpson EH, Gallo EF, Balsam PD, Javitch JA, Kellendonk C. How changes in dopamine D2 receptor levels alter striatal circuit function and motivation. Mol Psychiatry 2021. [DOI] [PMC free article] [PubMed] [Google Scholar]
- 11.Mitchell IJ, Cooper AJ, Griffiths MR. The selective vulnerability of striatopallidal neurons. Prog Neurobiol 1999; 59(6): 691–719. [DOI] [PubMed] [Google Scholar]
- 12.Volkow ND, Fowler JS, Wang GJ, Swanson JM. Dopamine in drug abuse and addiction: results from imaging studies and treatment implications. Mol Psychiatry 2004; 9(6): 557–569. [DOI] [PubMed] [Google Scholar]
- 13.Heiman M, Heilbut A, Francardo V, Kulicke R, Fenster RJ, Kolaczyk ED et al. Molecular adaptations of striatal spiny projection neurons during levodopa-induced dyskinesia. Proc Natl Acad Sci USA 2014; 111(12): 4578–4583. [DOI] [PMC free article] [PubMed] [Google Scholar]
- 14.Heiman M, Schaefer A, Gong S, Peterson JD, Day M, Ramsey KE et al. A translational profiling approach for the molecular characterization of CNS cell types. Cell 2008; 135(4): 738–748. [DOI] [PMC free article] [PubMed] [Google Scholar]
- 15.Lobo MK, Karsten SL, Gray M, Geschwind DH, Yang XW. FACS-array profiling of striatal projection neuron subtypes in juvenile and adult mouse brains. Nat Neurosci 2006; 9(3): 443–452. [DOI] [PubMed] [Google Scholar]
- 16.Ena SL, De Backer JF, Schiffmann SN, de Kerchove d’Exaerde A. FACS array profiling identifies Ecto-5’ nucleotidase as a striatopallidal neuron-specific gene involved in striatal-dependent learning. J Neurosci 2013; 33(20): 8794–8809. [DOI] [PMC free article] [PubMed] [Google Scholar]
- 17.Belin D, Jonkman S, Dickinson A, Robbins TW, Everitt BJ. Parallel and interactive learning processes within the basal ganglia: relevance for the understanding of addiction. Behav Brain Res 2009; 199(1): 89–102. [DOI] [PubMed] [Google Scholar]
- 18.Gokce O, Stanley GM, Treutlein B, Neff NF, Camp JG, Malenka RC et al. Cellular Taxonomy of the Mouse Striatum as Revealed by Single-Cell RNA-Seq. Cell Rep 2016; 16(4): 1126–1137. [DOI] [PMC free article] [PubMed] [Google Scholar]
- 19.Ho H, Both M, Siniard A, Sharma S, Notwell JH, Wallace M et al. A Guide to Single-Cell Transcriptomics in Adult Rodent Brain: The Medium Spiny Neuron Transcriptome Revisited. Front Cell Neurosci 2018; 12: 159. [DOI] [PMC free article] [PubMed] [Google Scholar]
- 20.Munoz-Manchado AB, Bengtsson Gonzales C, Zeisel A, Munguba H, Bekkouche B, Skene NG et al. Diversity of Interneurons in the Dorsal Striatum Revealed by Single-Cell RNA Sequencing and PatchSeq. Cell Rep 2018; 24(8): 2179–2190 e2177. [DOI] [PMC free article] [PubMed] [Google Scholar]
- 21.Doyle JP, Dougherty JD, Heiman M, Schmidt EF, Stevens TR, Ma G et al. Application of a translational profiling approach for the comparative analysis of CNS cell types. Cell 2008; 135(4): 749–762. [DOI] [PMC free article] [PubMed] [Google Scholar]
- 22.Heiman M, Kulicke R, Fenster RJ, Greengard P, Heintz N. Cell type-specific mRNA purification by translating ribosome affinity purification (TRAP). Nature protocols 2014; 9(6): 1282–1291. [DOI] [PMC free article] [PubMed] [Google Scholar]
- 23.Andrews S FastQC: a quality control tool for high throughput sequence data. https://wwwbioinformaticsbabrahamacuk/projects/fastqc/ 2010.
- 24.Kim D, Langmead B, Salzberg SL. HISAT: a fast spliced aligner with low memory requirements. . Nature Methods 2015; 12: 357–360. [DOI] [PMC free article] [PubMed] [Google Scholar]
- 25.Andrews S SeqMonk: A tool to visualise and analyse high throughput mapped sequence data. https://wwwbioinformaticsbabrahamacuk/projects/seqmonk/ 2008.
- 26.Love MI, Huber W, Anders S. Moderated estimation of fold change and dispersion for RNA-seq data with DESeq2. Genome Biol 2014; 15(12): 550. [DOI] [PMC free article] [PubMed] [Google Scholar]
- 27.Wang L, Wang S, Li W. RSeQC: quality control of RNA-seq experiments. Bioinformatics 2012; 28(16): 2184–2185. [DOI] [PubMed] [Google Scholar]
- 28.Anders S, Reyes A, Huber W. Detecting differential usage of exons from RNA-seq data. Genome Res 2012; 22(10): 2008–2017. [DOI] [PMC free article] [PubMed] [Google Scholar]
- 29.Consortium TD, Marbach D, Costello JC, Küffner R, Vega NM, Prill RJ et al. Wisdom of crowds for robust gene network inference. Nature Methods 2012; 9: 796–804. [DOI] [PMC free article] [PubMed] [Google Scholar]
- 30.Faith JJ, Hayete B, Thaden JT, Mogno I, Wierzbowski J, Cottarel G et al. Large-scale mapping and validation of Escherichia coli transcriptional regulation from a compendium of expression profiles. PLoS biology 2007; 5(1): e8. [DOI] [PMC free article] [PubMed] [Google Scholar]
- 31.Huynh-Thu VA, Irrthum A, Wehenkel L, P. G. Inferring regulatory networks from expression data using tree-based methods. PLoS One 2010; 5(9): e12776. [DOI] [PMC free article] [PubMed] [Google Scholar]
- 32.Shannon P, Markiel A, Ozier O, Baliga NS, Wang JT, Rmage D et al. Cytoscape: A Software Environment for Integrated Models of Biomolecular Interaction Networks. Genome Res 2003; 13: 2498–2504. [DOI] [PMC free article] [PubMed] [Google Scholar]
- 33.Puighermanal E, Castell L, Esteve-Codina A, Melser S, Kaganovsky K, Zussy C et al. Functional and molecular heterogeneity of D2R neurons along dorsal ventral axis in the striatum. Nature communications 2020; 11(1): 1957. [DOI] [PMC free article] [PubMed] [Google Scholar]
- 34.Denisenko-Nehrbass N, Oguievetskaia K, Goutebroze L, Galvez T, Yamakawa H, Ohara O et al. Protein 4.1B associates with both Caspr/paranodin and Caspr2 at paranodes and juxtaparanodes of myelinated fibres. Eur J Neurosci 2003; 17(2): 411–416. [DOI] [PubMed] [Google Scholar]
- 35.Alcacer C, Santini E, Valjent E, Gaven F, Girault JA, Herve D. Galpha(olf) mutation allows parsing the role of cAMP-dependent and extracellular signal-regulated kinase-dependent signaling in L-3,4-dihydroxyphenylalanine-induced dyskinesia. J Neurosci 2012; 32(17): 5900–5910. [DOI] [PMC free article] [PubMed] [Google Scholar]
- 36.Biever A, Puighermanal E, Nishi A, David A, Panciatici C, Longueville S et al. PKA-dependent phosphorylation of ribosomal protein S6 does not correlate with translation efficiency in striatonigral and striatopallidal medium-sized spiny neurons. J Neurosci 2015; 35(10): 4113–4130. [DOI] [PMC free article] [PubMed] [Google Scholar]
- 37.Anglada-Huguet M, Vidal-Sancho L, Giralt A, Garcia-Diaz Barriga G, Xifro X, Alberch J. Prostaglandin E2 EP2 activation reduces memory decline in R6/1 mouse model of Huntington’s disease by the induction of BDNF-dependent synaptic plasticity. Neurobiol Dis 2016; 95: 22–34. [DOI] [PubMed] [Google Scholar]
- 38.Meye FJ, Valentinova K, Lecca S, Marion-Poll L, Maroteaux MJ, Musardo S et al. Cocaine-evoked negative symptoms require AMPA receptor trafficking in the lateral habenula. Nat Neurosci 2015; 18(3): 376–378. [DOI] [PMC free article] [PubMed] [Google Scholar]
- 39.Berland C, Montalban E, Perrin E, Di Miceli M, Nakamura Y, Martinat M et al. Circulating Triglycerides Gate Dopamine-Associated Behaviors through DRD2-Expressing Neurons. Cell metabolism 2020; 31(4): 773–790 e711. [DOI] [PMC free article] [PubMed] [Google Scholar]
- 40.Lerner TN, Shilyansky C, Davidson TJ, Evans KE, Beier KT, Zalocusky KA et al. Intact-Brain Analyses Reveal Distinct Information Carried by SNc Dopamine Subcircuits. Cell 2015; 162(3): 635–647. [DOI] [PMC free article] [PubMed] [Google Scholar]
- 41.Oliveira MG, Bueno OF, Pomarico AC, Gugliano EB. Strategies used by hippocampal- and caudate-putamen-lesioned rats in a learning task. Neurobiol Learn Mem 1997; 68(1): 32–41. [DOI] [PubMed] [Google Scholar]
- 42.Bertran-Gonzalez J, Bosch C, Maroteaux M, Matamales M, Herve D, Valjent E et al. Opposing patterns of signaling activation in dopamine D1 and D2 receptor-expressing striatal neurons in response to cocaine and haloperidol. J Neurosci 2008; 28(22): 5671–5685. [DOI] [PMC free article] [PubMed] [Google Scholar]
- 43.Rakhilin SV, Olson PA, Nishi A, Starkova NN, Fienberg AA, Nairn AC et al. A network of control mediated by regulator of calcium/calmodulin-dependent signaling. Science 2004; 306(5696): 698–701. [DOI] [PubMed] [Google Scholar]
- 44.Ouimet CC, Hemmings HC Jr., Greengard P. ARPP-21, a cyclic AMP-regulated phosphoprotein enriched in dopamine-innervated brain regions. II. Immunocytochemical localization in rat brain. J Neurosci 1989; 9(3): 865–875. [DOI] [PMC free article] [PubMed] [Google Scholar]
- 45.Kisielow J, Nairn AC, Karjalainen K. TARPP, a novel protein that accompanies TCR gene rearrangement and thymocyte education. Eur J Immunol 2001; 31(4): 1141–1149. [DOI] [PubMed] [Google Scholar]
- 46.Rehfeld F, Maticzka D, Grosser S, Knauff P, Eravci M, Vida I et al. The RNA-binding protein ARPP21 controls dendritic branching by functionally opposing the miRNA it hosts. Nature communications 2018; 9(1): 1235. [DOI] [PMC free article] [PubMed] [Google Scholar]
- 47.Dawson VL, Dawson TM, Filloux FM, Wamsley JK. Evidence for dopamine D-2 receptors on cholinergic interneurons in the rat caudate-putamen. Life Sci 1988; 42(20): 1933–1939. [DOI] [PubMed] [Google Scholar]
- 48.Gangarossa G, Espallergues J, de Kerchove d’Exaerde A, El Mestikawy S, Gerfen CR, Herve D et al. Distribution and compartmental organization of GABAergic medium-sized spiny neurons in the mouse nucleus accumbens. Front Neural Circuits 2013; 7: 22. [DOI] [PMC free article] [PubMed] [Google Scholar]
- 49.Kupchik YM, Brown RM, Heinsbroek JA, Lobo MK, Schwartz DJ, Kalivas PW. Coding the direct/indirect pathways by D1 and D2 receptors is not valid for accumbens projections. Nat Neurosci 2015; 18(9): 1230–1232. [DOI] [PMC free article] [PubMed] [Google Scholar]
- 50.Treutlein B, Gokce O, Quake SR, Sudhof TC. Cartography of neurexin alternative splicing mapped by single-molecule long-read mRNA sequencing. Proc Natl Acad Sci USA 2014; 111(13): E1291–1299. [DOI] [PMC free article] [PubMed] [Google Scholar]
- 51.Voorn P, Vanderschuren LJ, Groenewegen HJ, Robbins TW, Pennartz CM. Putting a spin on the dorsal-ventral divide of the striatum. Trends Neurosci 2004; 27(8): 468–474. [DOI] [PubMed] [Google Scholar]
- 52.Saint-Martin M, Joubert B, Pellier-Monnin V, Pascual O, Noraz N, Honnorat J. Contactin-associated protein-like 2, a protein of the neurexin family involved in several human diseases. Eur J Neurosci 2018; 48(3): 1906–1923. [DOI] [PubMed] [Google Scholar]
- 53.Chen N, Koopmans F, Gordon A, Paliukhovich I, Klaassen RV, van der Schors RC et al. Interaction proteomics of canonical Caspr2 (CNTNAP2) reveals the presence of two Caspr2 isoforms with overlapping interactomes. Biochim Biophys Acta 2015; 1854(7): 827–833. [DOI] [PubMed] [Google Scholar]
- 54.Garel S, Marin F, Grosschedl R, Charnay P. Ebf1 controls early cell differentiation in the embryonic striatum. Development 1999; 126(23): 5285–5294. [DOI] [PubMed] [Google Scholar]
- 55.Lobo MK, Yeh C, Yang XW. Pivotal role of early B-cell factor 1 in development of striatonigral medium spiny neurons in the matrix compartment. J Neurosci Res 2008; 86(10): 2134–2146. [DOI] [PubMed] [Google Scholar]
- 56.Lu KM, Evans SM, Hirano S, Liu FC. Dual role for Islet-1 in promoting striatonigral and repressing striatopallidal genetic programs to specify striatonigral cell identity. Proc Natl Acad Sci USA 2014; 111(1): E168–177. [DOI] [PMC free article] [PubMed] [Google Scholar]
- 57.Zhang Q, Zhang Y, Wang C, Xu Z, Liang Q, An L et al. The Zinc Finger Transcription Factor Sp9 Is Required for the Development of Striatopallidal Projection Neurons. Cell Rep 2016; 16(5): 1431–1444. [DOI] [PMC free article] [PubMed] [Google Scholar]
- 58.Martin-Ibanez R, Pardo M, Giralt A, Miguez A, Guardia I, Marion-Poll L et al. Helios expression coordinates the development of a subset of striatopallidal medium spiny neurons. Development 2017; 144(8): 1566–1577. [DOI] [PMC free article] [PubMed] [Google Scholar]
- 59.Anderson SA, Qiu M, Bulfone A, Eisenstat DD, Meneses J, Pedersen R et al. Mutations of the homeobox genes Dlx-1 and Dlx-2 disrupt the striatal subventricular zone and differentiation of late born striatal neurons. Neuron 1997; 19(1): 27–37. [DOI] [PubMed] [Google Scholar]
- 60.Wapinski OL, Vierbuchen T, Qu K, Lee QY, Chanda S, Fuentes DR et al. Hierarchical mechanisms for direct reprogramming of fibroblasts to neurons. Cell 2013; 155(3): 621–635. [DOI] [PMC free article] [PubMed] [Google Scholar]
- 61.Hoekman MF, Jacobs FM, Smidt MP, Burbach JP. Spatial and temporal expression of FoxO transcription factors in the developing and adult murine brain. Gene Expr Patterns 2006; 6(2): 134–140. [DOI] [PubMed] [Google Scholar]
- 62.Sellnow RC, Steece-Collier K, Altwal F, Sandoval IM, Kordower JH, Collier TJ et al. Striatal Nurr1 Facilitates the Dyskinetic State and Exacerbates Levodopa-Induced Dyskinesia in a Rat Model of Parkinson’s Disease. J Neurosci 2020; 40(18): 3675–3691. [DOI] [PMC free article] [PubMed] [Google Scholar]
- 63.Steece-Collier K, Collier TJ, Lipton JW, Stancati JA, Winn ME, Cole-Strauss A et al. Striatal Nurr1, but not FosB expression links a levodopa-induced dyskinesia phenotype to genotype in Fisher 344 vs. Lewis hemiparkinsonian rats. Exp Neurol 2020; 330: 113327. [DOI] [PMC free article] [PubMed] [Google Scholar]
- 64.van der Raadt J, van Gestel SHC, Nadif Kasri N, Albers CA. ONECUT transcription factors induce neuronal characteristics and remodel chromatin accessibility. Nucleic Acids Res 2019; 47(11): 5587–5602. [DOI] [PMC free article] [PubMed] [Google Scholar]
- 65.de Munnik SA, Garcia-Minaur S, Hoischen A, van Bon BW, Boycott KM, Schoots J et al. A de novo non-sense mutation in ZBTB18 in a patient with features of the 1q43q44 microdeletion syndrome. Eur J Hum Genet 2014; 22(6): 844–846. [DOI] [PMC free article] [PubMed] [Google Scholar]
- 66.Kitaoka S, Furuyashiki T, Nishi A, Shuto T, Koyasu S, Matsuoka T et al. Prostaglandin E2 acts on EP1 receptor and amplifies both dopamine D1 and D2 receptor signaling in the striatum. J Neurosci 2007; 27(47): 12900–12907. [DOI] [PMC free article] [PubMed] [Google Scholar]
- 67.Breyer RM, Bagdassarian CK, Myers SA, Breyer MD. Prostanoid receptors: subtypes and signaling. Annu Rev Pharmacol Toxicol 2001; 41: 661–690. [DOI] [PubMed] [Google Scholar]
- 68.Cui G, Jun SB, Jin X, Pham MD, Vogel SS, Lovinger DM et al. Concurrent activation of striatal direct and indirect pathways during action initiation. Nature 2013; 494(7436): 238–242. [DOI] [PMC free article] [PubMed] [Google Scholar]
- 69.Hooper KC, Banks DA, Stordahl LJ, White IM, Rebec GV. Quinpirole inhibits striatal and excites pallidal neurons in freely moving rats. Neuroscience letters 1997; 237(2–3): 69–72. [DOI] [PubMed] [Google Scholar]
- 70.Baudonnat M, Huber A, David V, Walton ME. Heads for learning, tails for memory: reward, reinforcement and a role of dopamine in determining behavioral relevance across multiple timescales. Front Neurosci 2013; 7: 175. [DOI] [PMC free article] [PubMed] [Google Scholar]
- 71.Watson DJ, Stanton ME. Spatial discrimination reversal learning in weanling rats is impaired by striatal administration of an NMDA-receptor antagonist. Learn Mem 2009; 16(9): 564–572. [DOI] [PMC free article] [PubMed] [Google Scholar]
- 72.Sala-Bayo J, Fiddian L, Nilsson SRO, Hervig ME, McKenzie C, Mareschi A et al. Dorsal and ventral striatal dopamine D1 and D2 receptors differentially modulate distinct phases of serial visual reversal learning. Neuropsychopharmacol 2020; 45(5): 736–744. [DOI] [PMC free article] [PubMed] [Google Scholar]
- 73.Victor MB, Richner M, Hermanstyne TO, Ransdell JL, Sobieski C, Deng PY et al. Generation of human striatal neurons by microRNA-dependent direct conversion of fibroblasts. Neuron 2014; 84(2): 311–323. [DOI] [PMC free article] [PubMed] [Google Scholar]
- 74.Ehrlich AT, Furuyashiki T, Kitaoka S, Kakizuka A, Narumiya S. Prostaglandin E receptor EP1 forms a complex with dopamine D1 receptor and directs D1-induced cAMP production to adenylyl cyclase 7 through mobilizing G(betagamma) subunits in human embryonic kidney 293T cells. Mol Pharmacol 2013; 84(3): 476–486. [DOI] [PubMed] [Google Scholar]
- 75.Johnson PM, Kenny PJ. Dopamine D2 receptors in addiction-like reward dysfunction and compulsive eating in obese rats. Nat Neurosci 2010; 13(5): 635–641. [DOI] [PMC free article] [PubMed] [Google Scholar]
Associated Data
This section collects any data citations, data availability statements, or supplementary materials included in this article.