

Abstract
Cerebellar hypoplasia in fetal alcohol spectrum disorders (FASD) is associated with inhibition of insulin and insulin-like growth factor (IGF) signaling in the brain. Aspartyl (asparaginyl)-β-hydroxylase (AAH) is a mediator of neuronal motility, and stimulated by insulin and IGF activation of PI3 kinase-Akt, or inhibition of GSK-3β. Since ethanol inhibits PI3 Kinase-Akt and increases GSK-3β activity in brain, we examined the effects of ethanol and GSK-3β on AAH expression and directional motility in neuronal cells. Control and ethanol-exposed (100 mM × 48 h) human PNET2 cerebellar neuronal cells were stimulated with IGF-1 and used to measure AAH expression and directional motility. Molecular and biochemical approaches were used to characterize GSK-3β regulation of AAH and neuronal motility. Ethanol reduced IGF-1 stimulated AAH protein expression and directional motility without inhibiting AAH’s mRNA. Further analysis revealed that: (1) AAH protein could be phosphorylated by GSK-3β; (2) high levels of GSK-3β activity decreased AAH protein; (3) inhibition of GSK-3β and/or global Caspases increased AAH protein; (4) AAH protein was relatively more phosphorylated in ethanol-treated compared with control cells; and (5) chemical inhibition of GSK-3β and/or global Caspases partially rescued ethanol-impaired AAH protein expression and motility. Ethanol-impaired neuronal migration is associated with reduced IGF-I stimulated AAH protein expression. This effect may be mediated by increased GSK-3β phosphorylation and Caspase degradation of AAH. Therapeutic strategies to rectify CNS developmental abnormalities in FASD should target factors underlying the ethanol-associated increases in GSK-3β and Caspase activation, e.g. IGF resistance and increased oxidative stress.
Keywords: Aspartyl (asparaginyl)-β-hydroxylase, Fetal alcohol spectrum disorders, Caspase, Neuronal migration, Insulin, Central nervous system, Glycogen synthase kinase 3β
Introduction
Fetal alcohol spectrum disorders (FASD) are caused by maternal alcohol consumption during pregnancy [31], and fetal alcohol syndrome (FAS), the most severe form of FASD, are associated with increased fetal demise, intrauterine growth restriction, central nervous system (CNS) malformations, mental retardation, craniofacial and skeletal defects, and cognitive and behavioral impairments [2, 18]. Experimental models have confirmed that in utero exposure to ethanol impairs neuronal survival, growth, migration, synaptogenesis, maturation, neurotransmitter function, and intracellular adhesion [27–29, 35, 36, 42]. The adverse effects of ethanol on neuronal survival in the developing CNS have been linked to inhibition of insulin and insulin-like growth factor (IGF) signaling [11, 14, 41, 45], which results in increased apoptosis [14, 45] and mitochondrial dysfunction [11, 14, 30]. However, little is known about how ethanol impairs neuronal migration during development. Since aspartyl (asparaginyl)-β-hydroxylase (AAH) has a demonstrated role in neuronal motility, and is a down-stream target of insulin and IGF signaling [22, 32], we postulated that ethanol-impaired neuronal migration in the developing CNS is mediated by inhibition of insulin and IGF stimulation of AAH expression and/or function.
The AAH is an ~86 kD [24] Type 2 transmembrane protein and member of the α-ketoglutarate-dependent dioxygenase family of hydroxylases [20, 40]. AAH catalyzes post-translational hydroxylation of β carbons of aspartate and asparagine residues within epidermal growth factor (EGF)-like domains of proteins such as Notch and Jagged [5, 16, 24], which have known roles in cell growth, differentiation, and migration [23, 43]. Correspondingly, inhibition of AAH with antisense oligodeoxynucleotides or small interfering (si) RNAs reduces cell motility [5, 32], whereas over-expression of AAH increases cell motility [5, 12]. AAH mRNA is regulated by insulin or IGF-I signaling through Erk MAPK and PI3 kinase-Akt [5, 12, 22]. In a recent study, we showed that AAH protein, but not its mRNA, is increased by inhibition GSK-3β activity [22]. This finding led to the hypothesis that GSK-3β activation may have direct effects on AAH protein through phosphorylation. In this regard, Western blot analysis consistently detects expression of slower migrating AAH-immunoreactive proteins (~110 kD or greater) [22, 24], and subsequence analysis using MacVector 8.1 (Accelrys Software Inc., UK) identified multiple potential phosphorylation sites, most (N = 13 of 24) of which have the consensus sequence for GSK-3β, as demonstrated with the long peptide subsequence motif algorithm (Fig. 1). Since ethanol increases GSK-3β activity [41], we investigated the effects of increased or decreased GSK-3β activity on AAH protein phosphorylation, AAH steady-state protein levels, and directional motility, and assessed the role of increased GSK-3β in relation to ethanol-impaired neuronal migration.
Fig. 1.
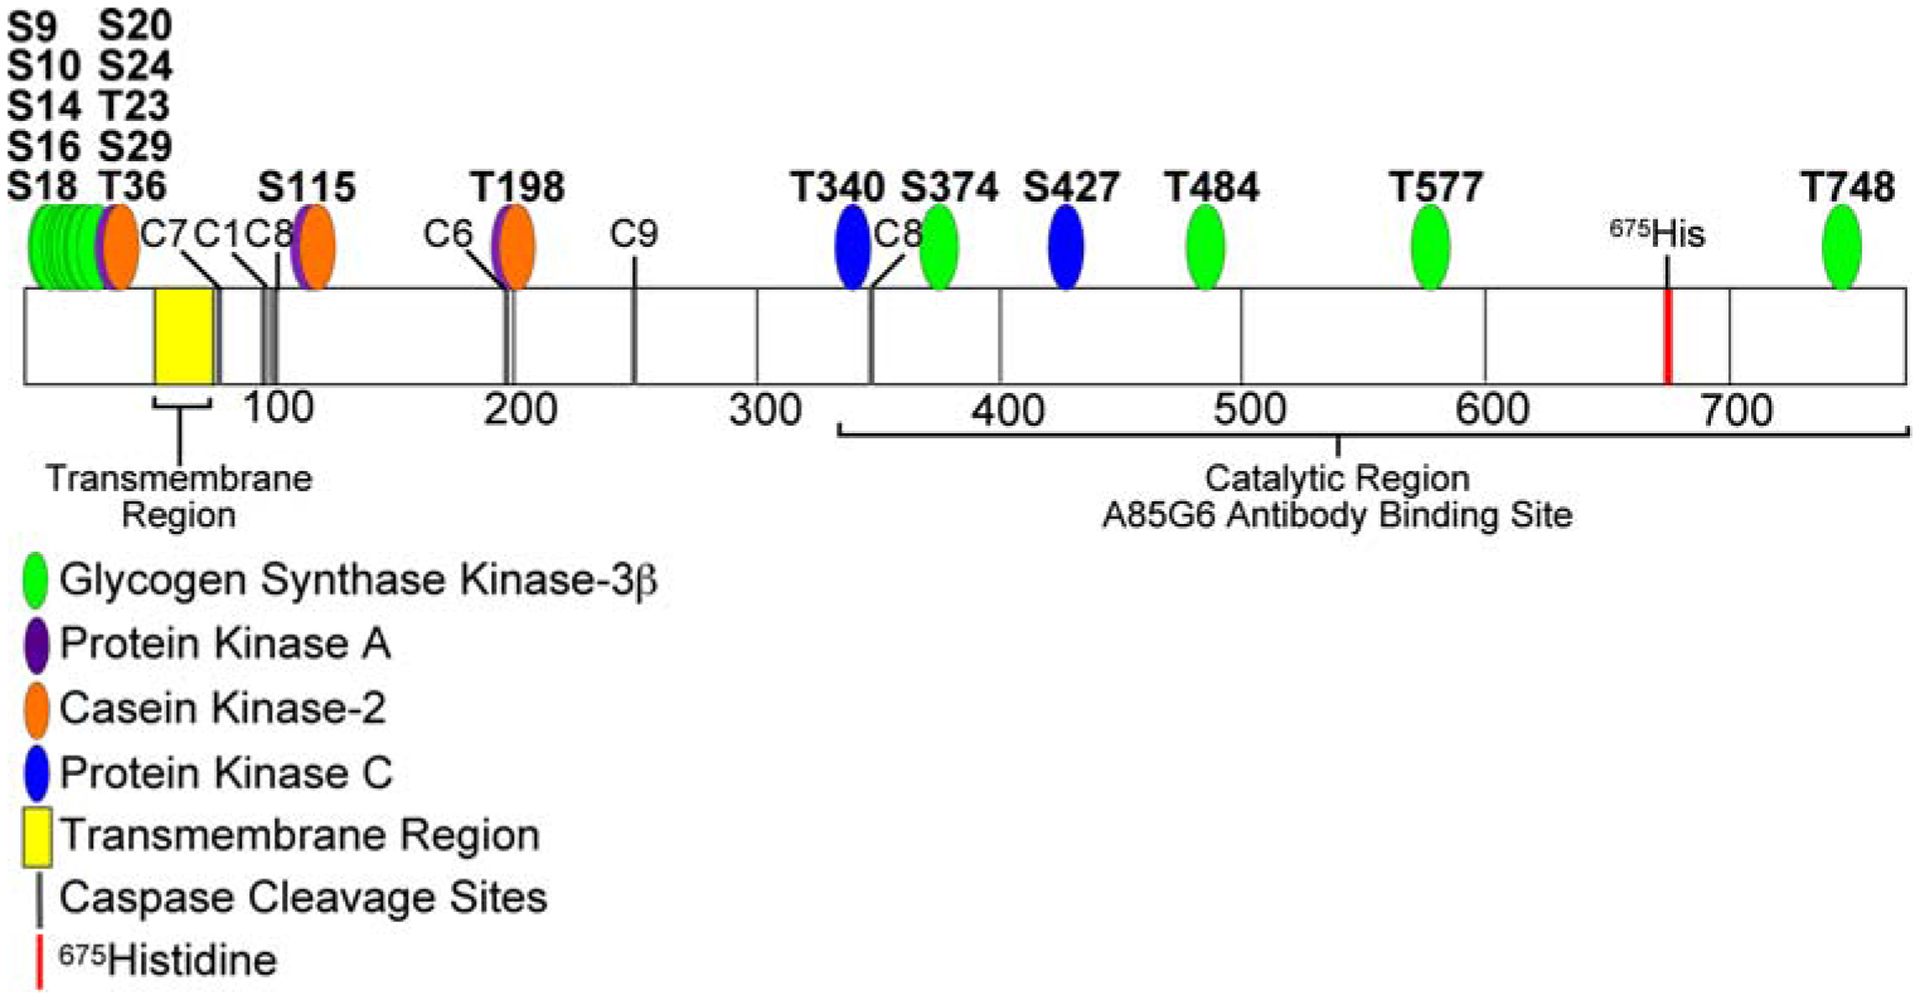
Diagram of predicted AAH phosphorylation sites. The translated amino acid sequence of human AAH was analyzed using the Long Peptide Subsequence Analysis module of MacVector 8.1 software. Positions of amino acids 100, 200, 300, 400, 500, 600, and 700 are indicated. Disks overlap with predicted Ser or Thr phosphorylation sites for glycogen synthase kinase 3β (GSK-3β-green), protein kinase A (PKA-violet), casein kinase 2 (CK II-orange), or protein kinase C (PKC-blue) phosphorylation. Note that the majority of the predicted sites (N = 13 of 24) have a consensus sequence corresponding to GSK-3β phosphorylation and are located within the N-terminal region of AAH protein. The transmembrane region (yellow), position of 675His (red), which is critical for AAH’s catalytic activity, and the C-terminal large cleavage fragment that has catalytic activity and is distinct from Humbug (underlined) are indicated
Experimental procedures
Cell culture
Human CNS-derived primitive neuroectodermal tumor 2 (PNET2) cells [38], were maintained in culture as previously described [22, 32]. Experiments were initiated by placing freshly seeded cells into humidified chambers in which 0 or 100 mM ethanol was supplied in a reservoir tray and allowed to vaporize and equilibrate with the culture medium for up to 96 h at 37°C [21]. Chambers were flushed with gas containing 75% nitrogen, 20% oxygen, and 5% carbon dioxide, and both the medium and the reservoir tray were refreshed daily. To measure growth factor stimulated responses, 48-h cultures were serum-starved for 16 h, and then stimulated with 10 nM IGF-I or vehicle for up to 24 h in the sealed chambers. Although 100 mM ethanol appears to be excessive, this level is generally used to treat rapidly dividing and continuous cell lines due to inherent resistance to oxidative stress and ethanol toxicity, whereas treatment of primary cell cultures is more frequently performed using lower ethanol concentrations, e.g. 25–50 mM [4, 6, 19, 34, 37].
Protein studies
We measured AAH, GAPDH, β-actin, and p85 subunit of PI3 kinase (negative control) immunoreactivities in cellular homogenates by Western blot analysis and enzyme-linked immunosorbant assay (ELISA) [32, 41]. Protein concentrations were measured with the bicinchoninic acid (BCA) assay (Pierce, Rockford, IL, USA). In addition, a cellular ELISA was used to measure immunoreactivity directly in cultured cells (96-well plates) [9]. The only modification of the original protocol was that immunoreactivity was detected with the Amplex Red fluorophore (Ex 530/Em 590) (Pierce), and measured in a Spectramax M5 microplate reader (Molecular Dynamics, Inc., Sunnyvale, CA, USA). Cell density was assessed by measuring fluorescence after staining the cells with Hoechst H33342 (Ex360 nm/Em460 nm; Molecular Probes, Eugene, OR, USA). The calculated ratios of fluorescence immunoreactivity to H33342 were used for inter-group comparisons. At least eight replicate cultures were analyzed in each experiment.
Immunofluorescence staining
PNET2 cells were cytocentrifuged onto positive-charge slides (Fisher Scientific Co., Pittsburgh, PA, USA), fixed in Histofix (Amresco, Solon, OH, USA), and then permeabilized with 0.05% saponin in TBS [5, 32]. Non-specific binding was blocked with normal horse serum diluted 1:200 in SuperBlock-TBS (Pierce Chemical Co., Rockford, IL, USA). After overnight incubation at 4°C with 1 μg/ml of AAH or non-relevant mAb (Hepatitis B virus Surface antigen), immunoreactivity was detected with biotinylated secondary antibody and Streptavidin-conjugated DyLight 488 or DyLight 649 fluorophore (Pierce Chemical Co.). The cells were counterstained with DAPI and imaged by confocal laser microscopy (Zeiss 410 Microscope, Carl Zeiss, Inc., Thornwood, NY, USA).
Quantitative (q) RT-PCR assays
Total RNA was isolated from cultured PNET2 cells using TRIzol reagent (Invitrogen, Carlsbad, CA, USA) and qRT-PCR was performed as previously described [5, 12, 41], except that the amplified signals were detected and analyzed using the Mastercycler ep realplex instrument and software (Eppendorf AG, Hamburg, Germany). Gene-specific primer sequences used to measure AAH mRNA and 18S rRNA are listed in Table 1.
Table 1.
Primer pairs for quantitative RT-PCR
| Primer | Sequence (5′ → 3′) | Position (mRNA) | Amplicon (bp) |
|---|---|---|---|
| AAH-For | GGG AGA TTT TAT TTC CAC CTG GG | 1650 | 257 |
| AAH-Rev | CCT TTG GCT TTA TCC ATC ACT GC | 1906 | |
| 18S-For | GGA CAC GGA CAG GAT TGA CA | 70 | 50 |
| 18S-Rev | ACC CAC GGA ATC GAG AAA GA | 119 |
AAH human aspartyl–asparaginyl-β-hydroxylase, For forward primer, Rev reverse primer, Position initial nucleotide for primer binding, bp base pair size of amplicon
Directional motility assay
Directional motility was measured using the ATP Luminescence-Based Motility-Invasion (ALMI) assay [10]. Briefly, serum-free culture medium containing 10 nM IGF-I was placed in the bottoms of blind well chambers (Neuro Probe, Gaithersburg, MD, USA), and 8-μm pore diameter polycarbonate filters divided the upper and lower chambers. 100,000 viable cells were seeded into the upper chambers, and cell migration was allowed to proceed for 30 min at 37°C in a CO2 incubator. Cells collected from the upper chambers (non-motile), under surfaces of the filters (motile adherent), and bottoms of the wells (motile non-adherent) were quantified using ATPLite reagent (Perkin-Elmer, Waltham, MA, USA) [10]. The percentages of non-motile, motile adherent, motile non-adherent cells in eight replicate assays were calculated and used for statistical analysis. Because this assay separately quantifies motile adherent and motile non-adherent sub-populations, it provides information about both motility and cell adhesion. For example, treatments that enhance cell motility without improving cell adhesion could lead to increased percentages of motile non-adherent cells and virtually no change is observed in the percentages of motile-adherent cells. Since ethanol inhibits both cell motility and cell adhesion, it was of interest to determine if measures to increase AAH protein expression resulted in increased motility of motile non-adherent, motile adherent, or both populations of cells.
GSK-3β regulation of AAH expression
To examine the role of GSK-3β on AAH expression and cell motility, PNET2 cells were transiently transfected with recombinant plasmid containing constitutively active GSK-3β under the control of a CMV promoter [25, 44]. In parallel studies, GSK-3β expression was silenced with commercially generated Smartpool siRNA molecules (Dharmacon, Inc., Chicago, IL, USA). Transfections were achieved using the Amaxa electroporation apparatus (Amaxa, Inc, Gaithersburg, MD, USA), which consistently resulted in transfection efficiencies between 70 and 80%. As negative controls, cells were transfected with GFP-expressing plasmid or scrambled RNA sequences [5, 12, 22]. AAH protein levels were assessed by Western blot analysis or cellular ELISA, and directional motility was measured using the ALMI assay [10]. Preliminary studies demonstrated no significant differences in AAH expression or motility between untreated control cells and cells that were transfected with either pGFP or siRNA-Scrambled. Therefore, the data analysis was focused on comparing cells transfected with pGFP versus pGSK-3β or siRNA-Scrambled versus siRNA-GSK-3β.
AAH phosphorylation by GSK-3β
Initial studies determined if AAH protein could be phosphorylated in vivo by metabolically labeling cells with [32P] orthophosphoric acid [7], and immunoprecipitating AAH protein with the FB50 and 15C7 mAb’s [3]. The immunoprecipitants were fractionated by SDS-PAGE and detected with a phosphorimager (Molecular Dynamics, Sunnyvale, CA, USA). Since the majority of the predicted GSK-3β phopshorylation sites were on Serine residues, we used anti-phospho-Serine Western blot analysis of FB50/15C7 immunoprecipitants to detect Serine phosphorylation of AAH. In addition, immunoprecipitants obtained with phospho-Serine conjugated agarose beads (Sigma-Aldrich, St. Louis, MO, USA) were probed by Western blot analysis using the FB50 mAb.
Analysis of mechanisms of ethanol-impaired AAH expression and motility in neuronal cells
To determine if ethanol inhibition of AAH protein expression was associated with increased AAH protein phosphorylation, cellular homogenates were fractionated over Phosphoprotein Purification Columns (Qiagen, Inc., Valencia, CA, USA). Unfractionated, unphosphorylated, and phosphorylated proteins were subjected to Western blot analysis using the A85G6 AAH mAb. Further studies determined if AAH protein expression and directional motility in ethanol-treated cells could be rescued, i.e. restored toward control levels by LiCl inhibition of GSK-3β. In addition, we investigated the role of Caspases as mediators of AAH protein depletion, since previous studies demonstrated increased Caspase activation in ethanol-exposed neuronal cells [8, 13, 30], and phosphorylation can serve to target specific proteins for Caspase degradation [26, 39].
Source of reagents
Recombinant IGF-I was obtained from Sigma-Aldrich (St. Louis, MO, USA). QuantiTect SYBR Green PCR Mix was obtained from Qiagen Inc. (Valencia, CA, USA). Fluorophores and H33342 were purchased from Molecular Probes (Eugene, OR, USA) or CalBiochem (Carlsbad, CA, USA). ATPLite reagents were purchased from PerkinElmer (Boston, MA, USA). All other fine chemicals and antibodies were purchased from AbCam (Cambridge, MA, USA), CalBiochem (Carlsbad, CA, USA), Sigma-Aldrich (St. Louis, MO, USA), or Vector Laboratories (Burlingame, CA, USA). The A86G6, FB-50, and 15C7 AAH mAbs were generated to human recombinant protein (Carlson, et al. 2006, unpublished) and purified over Protein G columns (GE Healthcare, Piscataway, NJ, USA).
Statistical analysis
Data depicted in the graphs represent the means ± SEMs for each group. Inter-group comparisons were made using Student t-tests or two-way analysis of variance (ANOVA) with the post hoc Dunn’s multiple comparisons test. Statistical analyses were performed using the Number Cruncher Statistical System (Dr. Jerry L. Hintze, Kaysville, UT, USA) and significant P-values (<0.05) are indicated over the graphs.
Results
Ethanol inhibits AAH expression
Western blot analysis using the A85G6 mAb detected the expected ~86 kD protein corresponding to AAH, and a slower migrating protein (~110 kD) that is thought to represent post-translationally modified AAH (Fig. 2a). Ethanol exposure significantly reduced AAH immunoreactivity as demonstrated by digital image analysis of the Western blot signals (Fig. 2b), direct ELISA (Fig. 2c), and cellular ELISA (Fig. 2d). In contrast, similar levels of p85 (negative or loading control) were observed in all samples, as shown by Western blot analysis (Fig. 2a). Ethanol-mediated reduction in AAH immunoreactivity was confirmed by immunofluorescence staining and confocal imaging of the cultured cells (Fig. 2f, g). Negative control studies in which a non-relevant mAb replaced the AAH mAb yielded no specific immunofluorescence signal (Fig. 2h). In contrast to the protein studies, qRT-PCR analysis revealed similar or slightly increased levels of AAH mRNA in ethanol-treated relative to control cells (Fig. 2e). Therefore, ethanol inhibition of AAH protein expression was not accompanied by reduced levels of AAH’s mRNA in PNET2 cells.
Fig. 2.
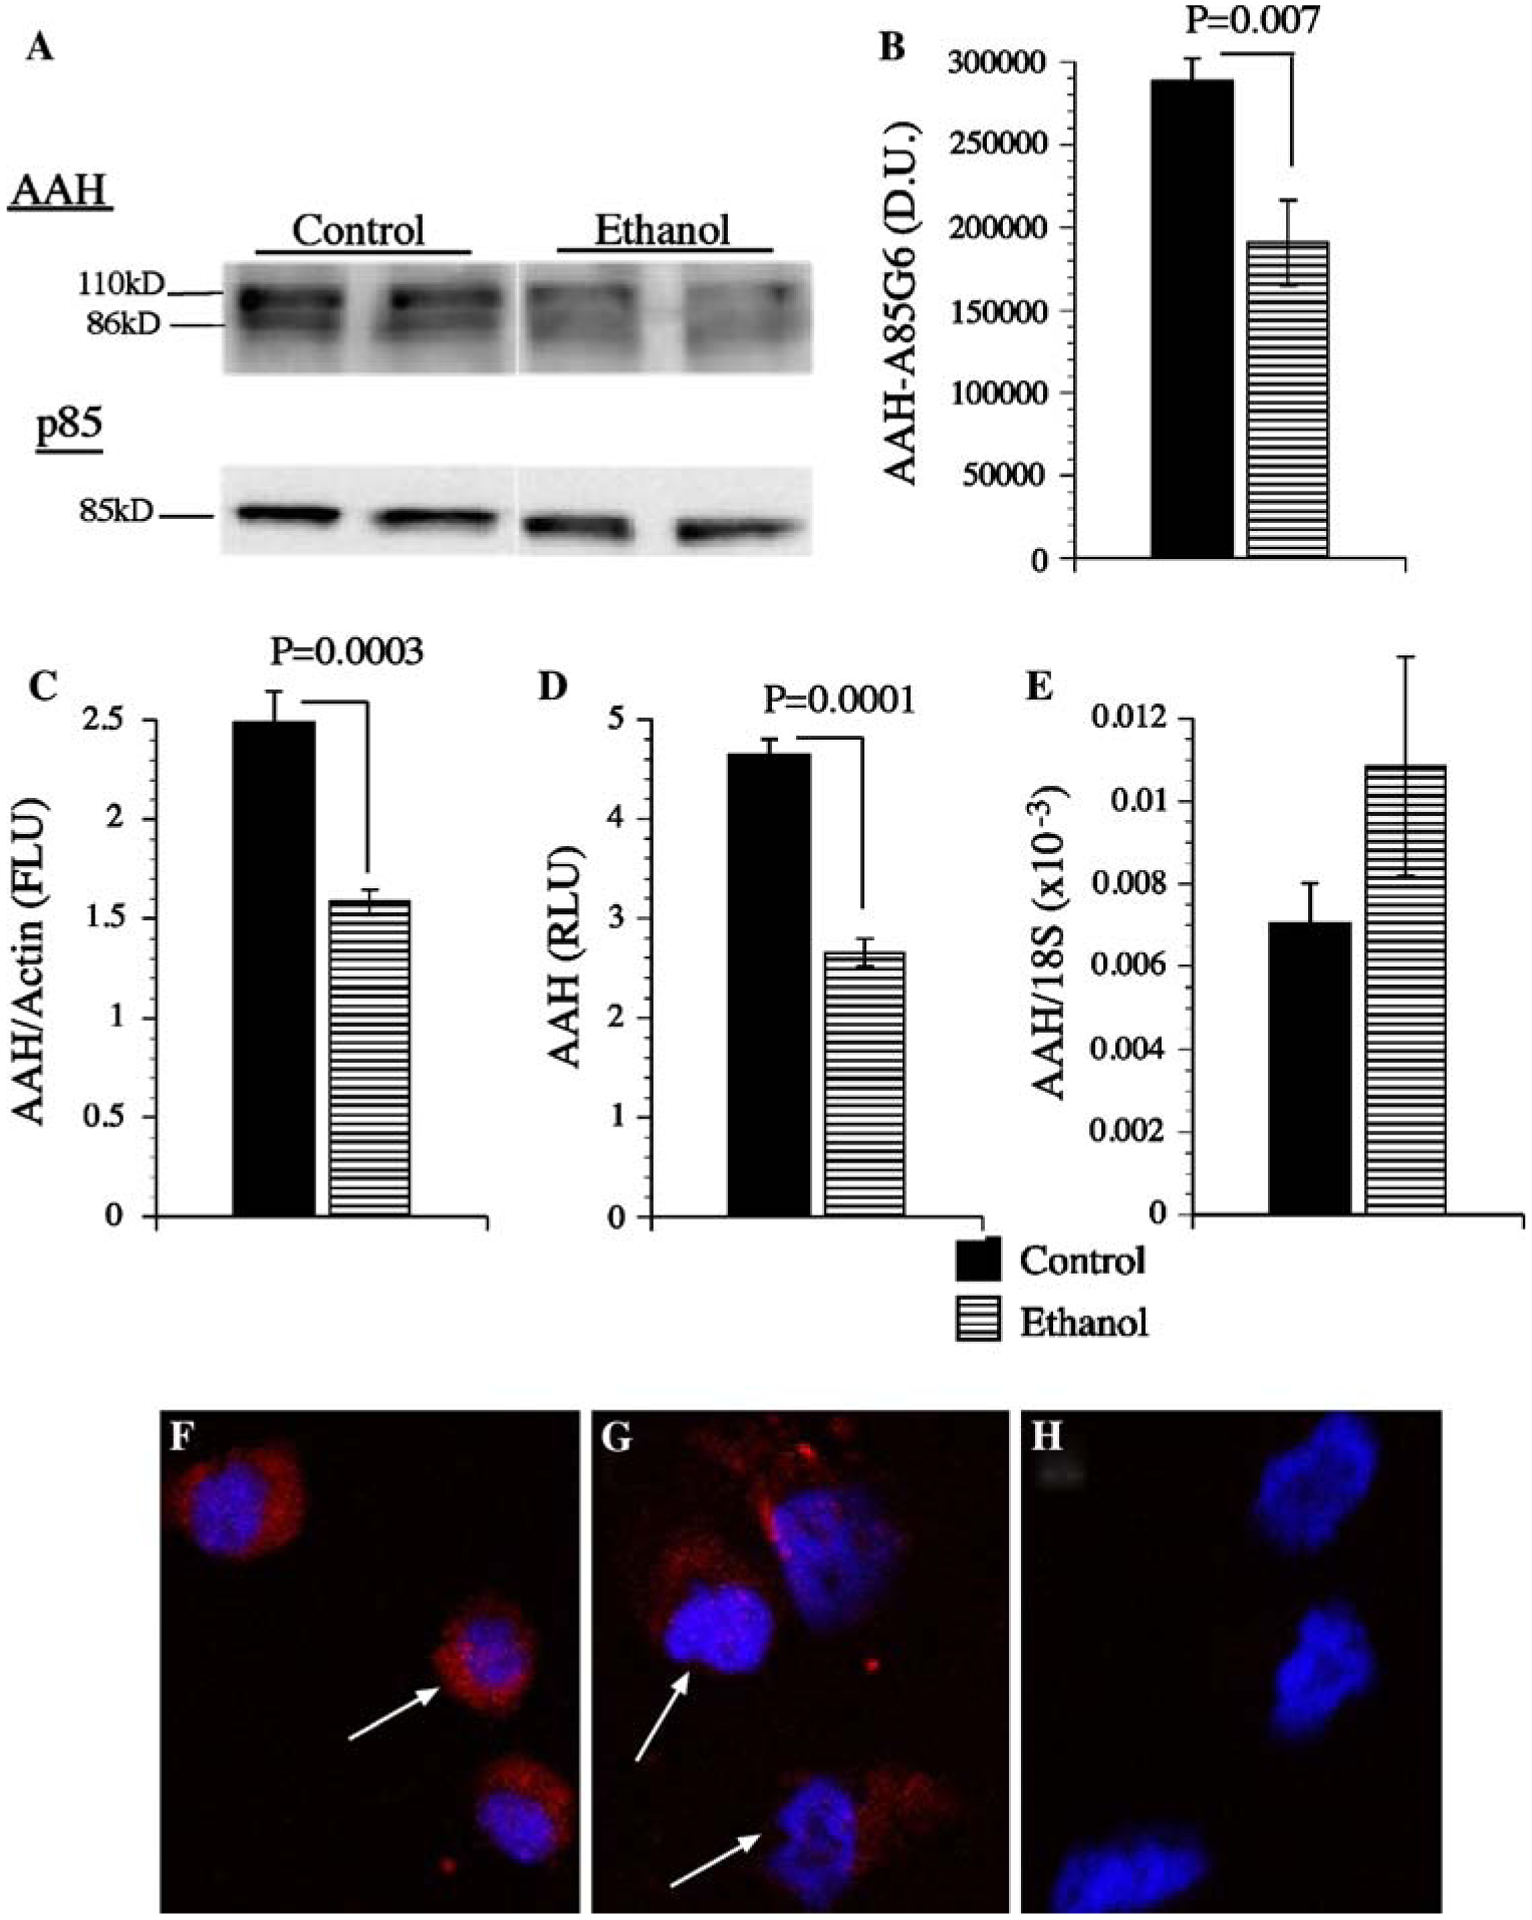
Ethanol inhibits AAH Expression. PNET2 neuronal cells were treated with 100 mM ethanol or vehicle for 96 h. During the last 24 h of treatment, cells were stimulated with 10 nM IGF-1 in serum-free medium. a AAH was detected by Western blot analysis (~86 and ~110 kD) using the A85G6 mAb. Blots were stripped and re-probed for the p85 subunit of PI3 kinase as a loading control. b Digital image quantification of the mean (±SEM) AAH protein levels detected by Western blot analysis (N = 6 per group). IGF-I stimulated AAH expression demonstrated by c ELISA, d cellular ELISA, e qRT-PCR, or f–h immunofluorescence. Graphs depict group means ± SEM, and significant inter-group differences are indicated by P-values over the graphs. In panels f and g, AAH immunoreactivity is shown in red, and nuclei counterstained with DAPI are shown in blue. Panel h represents a negative control study in which the non-relevant mAb to Hepatitis B virus was used instead of the AAH mAb. Cells were imaged by confocal microscopy
Ethanol inhibits IGF-I stimulated directional motility
Directional motility was measured using the ALMI assay in which 10 nM IGF-1 were supplied as the stimulus. In the absence of a trophic factor, directional motility occurs in less than 10% of the cells. Ethanol treatment significantly reduced the percentages of motile adherent cells (Fig. 3b), and overall (total) cell motility, and increased the mean percentages of non-motile (Fig. 3a) and motile non-adherent (Fig. 3c) cells (Fig. 3d). The latter suggests that ethanol differentially increases the fraction of non-adherent motile cells because cells capable of being motile are still deficient with respect to their adhesive properties.
Fig. 3.
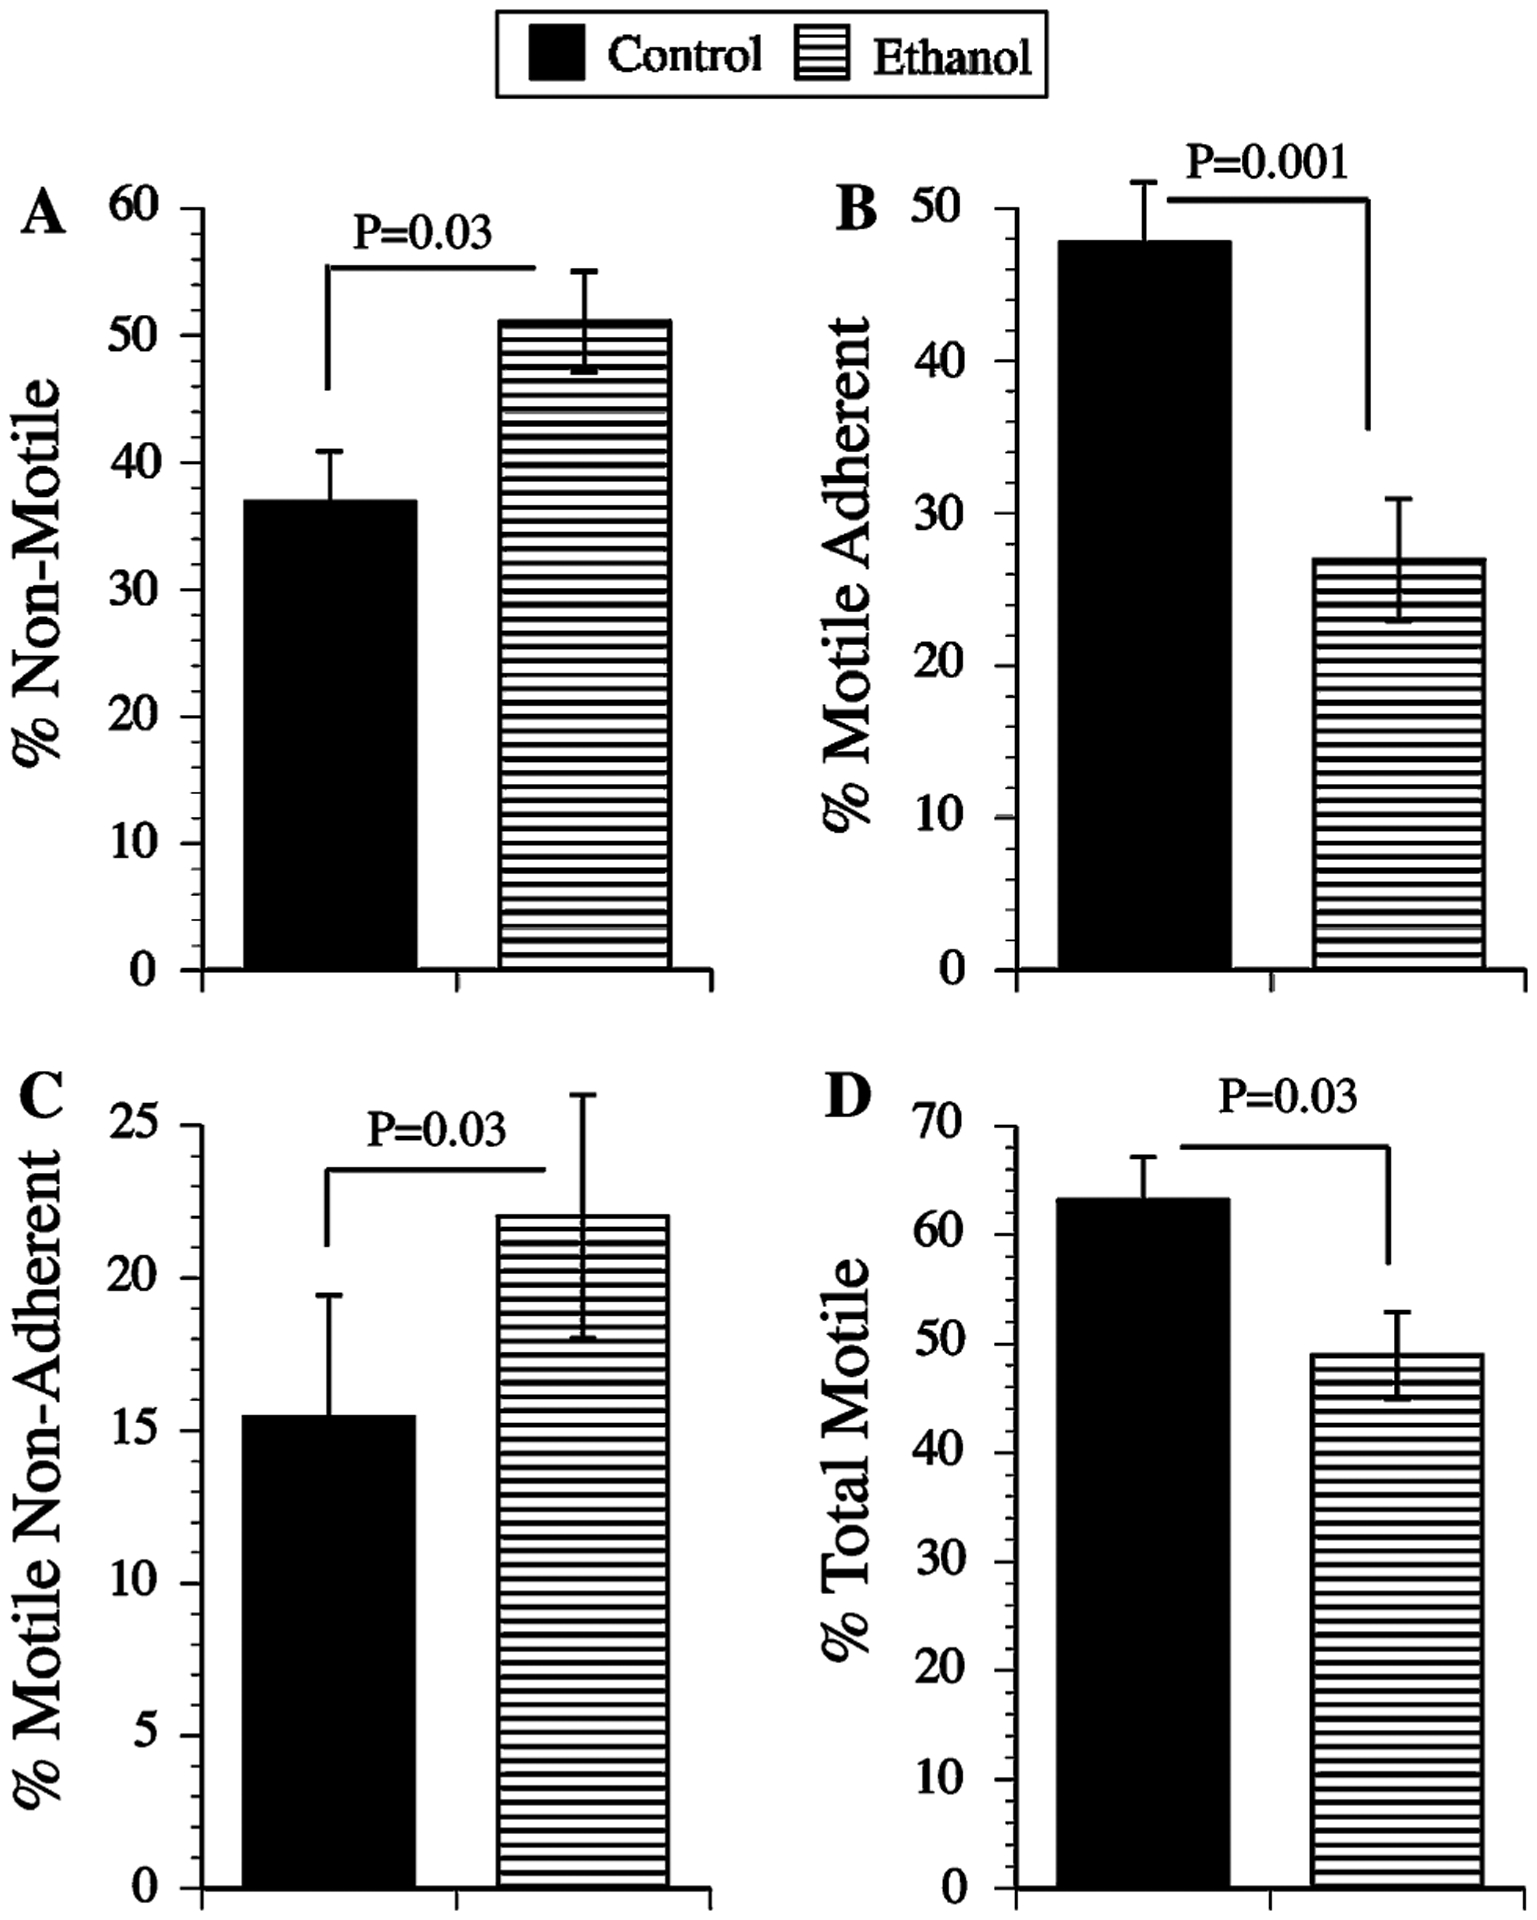
Ethanol inhibits directional motility in neuronal cells. Directional motility was measured using the ALMI assay with 10 nM IGF-1 provided as the trophic factor (see Experimental procedures). Graphs depict mean (±SEM) percentages of a non-motile, b motile-adherent, c motile non-adherent, and d motile-adherent + motile non-adherent (total) cells. Statistical comparisons were made using Student t-tests. Significant inter-group differences are indicated over the graphs
AAH phosphorylation studies
To determine if the super-shifted AAH-immunoreactive bands detected by Western blot analysis represented phosphorylated AAH as predicted by subsequence analysis of the protein (Fig. 1), PNET2 cells were metabolically labeled with [32P] orthophosphoric acid, and subsequently, FB50 + 15C7 immunoprecipitants were subjected to SDS-PAGE and autoradiography. As predicted, several high molecular weights, as well as smaller (possibly cleaved) AAH immunoreactive proteins were detected (Fig. 4a). Similar bands were not observed when non-relevant HBSAg mAb was used for immunoprecipitation. Serine phosphorylation of AAH was demonstrated by Western blot probing of anti-phospho-Serine immunoprecipitates with the FB50 mAb (Fig. 4b), and reciprocally probing FB50 + 15C7 immunoprecipitants with anti-phospho-Serine (data not shown). Finally, treatment of PNET2 cells with 20 mM LiCl to inhibit GSK-3β reduced the levels of AAH immunoreactivity in anti-phospho-Serine immunoprecipitates, and rendered the ~110 and ~140 kD AAH-immunoreactive bands virtually undetectable (Fig. 4c).
Fig. 4.
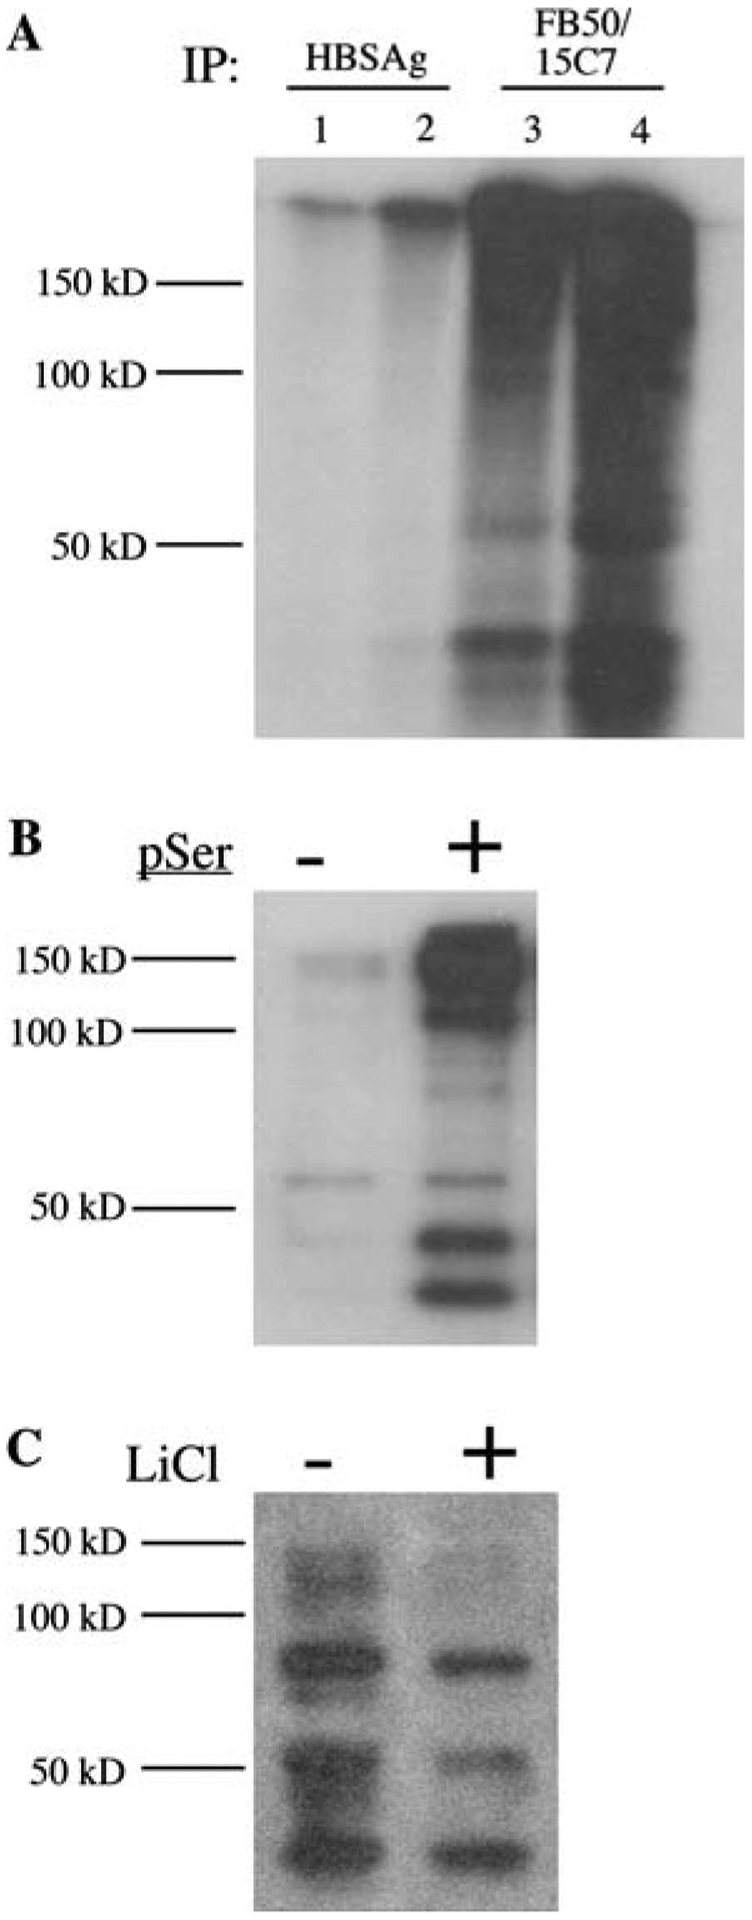
Evidence of AAH phosphorylation in neuronal cells: a PNET2 cells were metabolically labeled with [32P] orthophosphoric acid and proteins immunoprecipitated with mAb to hepatitis B virus surface antigen (HBSAg) or AAH (FB50 + 15C7) were fractionated by SDS-PAGE and detected by Wlm autoradiography. Lanes 1 and 3 represent immunoprecipitates from 250 μg protein. Lanes 2 and 4 correspond to immunoprecipitates from 500 μg protein. b Immunoprecipitates obtained using agarose conjugated IgG (−) or anti-phospho-Serine (pSer; +) were fractionated by SDS-PAGE and subjected to Western blot analysis with the FB50 mAb to AAH. c PNET2 cells were stimulated with 5 ng/ml IGF-1 and treated with vehicle (−) or 20 mM LiCl (+) for 16 h. Proteins subjected to phospho-enrichment were Western blotted with the FB50 mAb. Positions of molecular weight standards are indicated along the left side of each panel
Effect of GSK-3β over-expression on AAH protein levels
Western blot analysis demonstrated that over-expression of constitutively active GSK-3β in transiently transfected cells increased GSK-3β and reduced AAH protein relative to control cells transfected with GFP-expressing plasmid. Transfection efficiency was 75–80% based on fluorescence imaging of cells co-transfected with pGFP as a reporter gene. Digital quantification of the Western blot signals and inter-group statistical comparisons with Student t-tests (N = 3 per group; Fig. 5b, c) confirmed that over-expression of GSK-3β significantly reduces AAH protein expression. In contrast, similar mean levels of p85 subunit of PI3 kinase protein were measured in pGSK-3β- and pGFP-transfected cells (Fig. 5a, d).
Fig. 5.
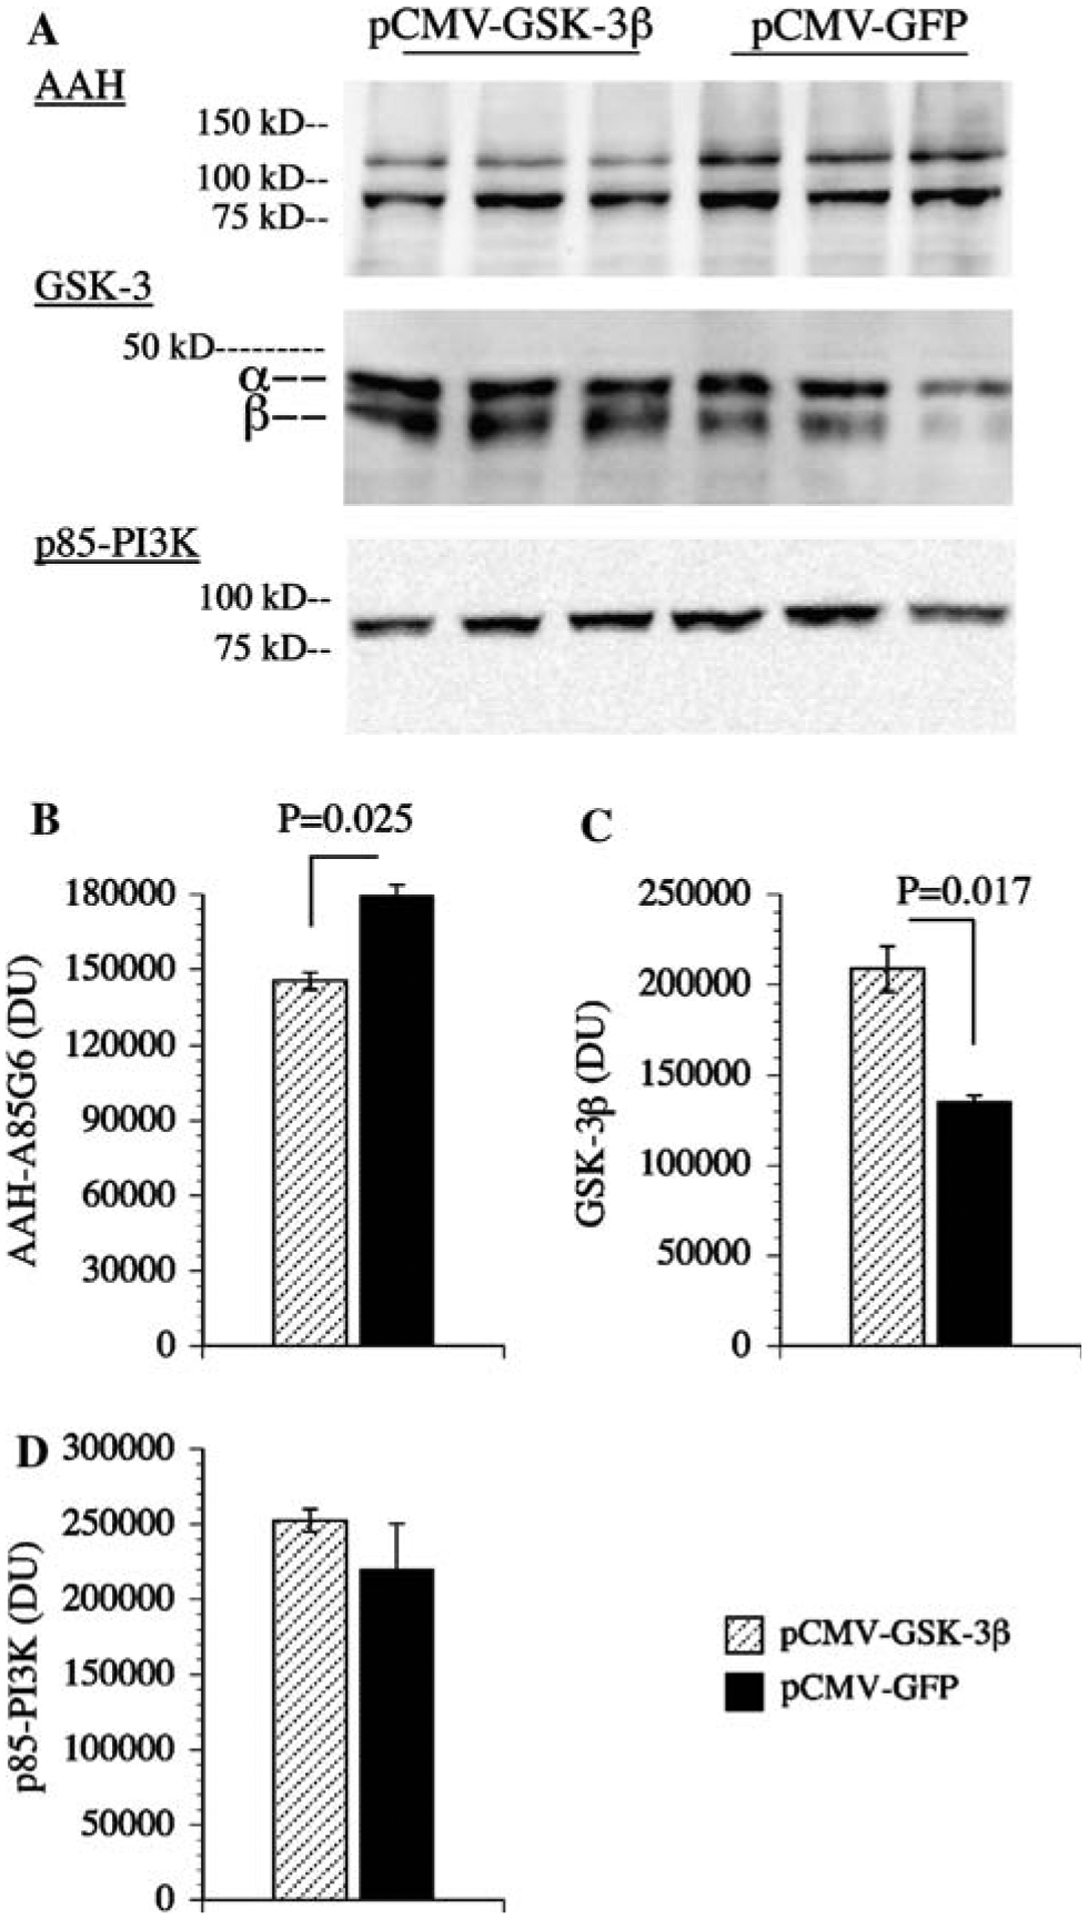
Overexpression of GSK-3β reduces AAH protein expression: PNET2 cells were transfected with recombinant plasmid containing GSK-3β (pGSKβ) or green fluorescent protein (pGFP) cDNA using Amaxa electroporation. a 48 h after transfection, cells were examined for AAH, GSK-3β, and p85 (PI3K-negative control) immunoreactivity by Western blot analysis. Levels of b AAH, c GSK-3, and d p85 immunoreactivities were quantified by digital imaging of the Western blot signals. Graphs depict mean ± SEM levels of immunoreactivity. Inter-group statistical comparisons were made using Student t-tests and significant P-values are indicated over the bars
Effect of GSK-3β inhibition on AAH protein levels
Western blot analysis demonstrated that PNET2 cells transiently transfected with siRNA duplexes targeting GSK-3β (siRNA-GSK-3β) had reduced levels of GSK-3β and not GSK-3α, and increased levels of AAH protein (both ~86 and ~48 kD-cleaved) relative to control cells transfected with scrambled (negative control) RNA duplexes (Fig. 6a). Digital quantification of the Western blot images and inter-group statistical comparisons with Student t-tests confirmed that inhibition of GSK-3β was associated with increased AAH protein (~86 kD) expression (N = 3 per group; Fig. 6b, c). In contrast, similar mean levels of p85 subunit of PI3 kinase protein were observed in all samples (Fig. 6d).
Fig. 6.
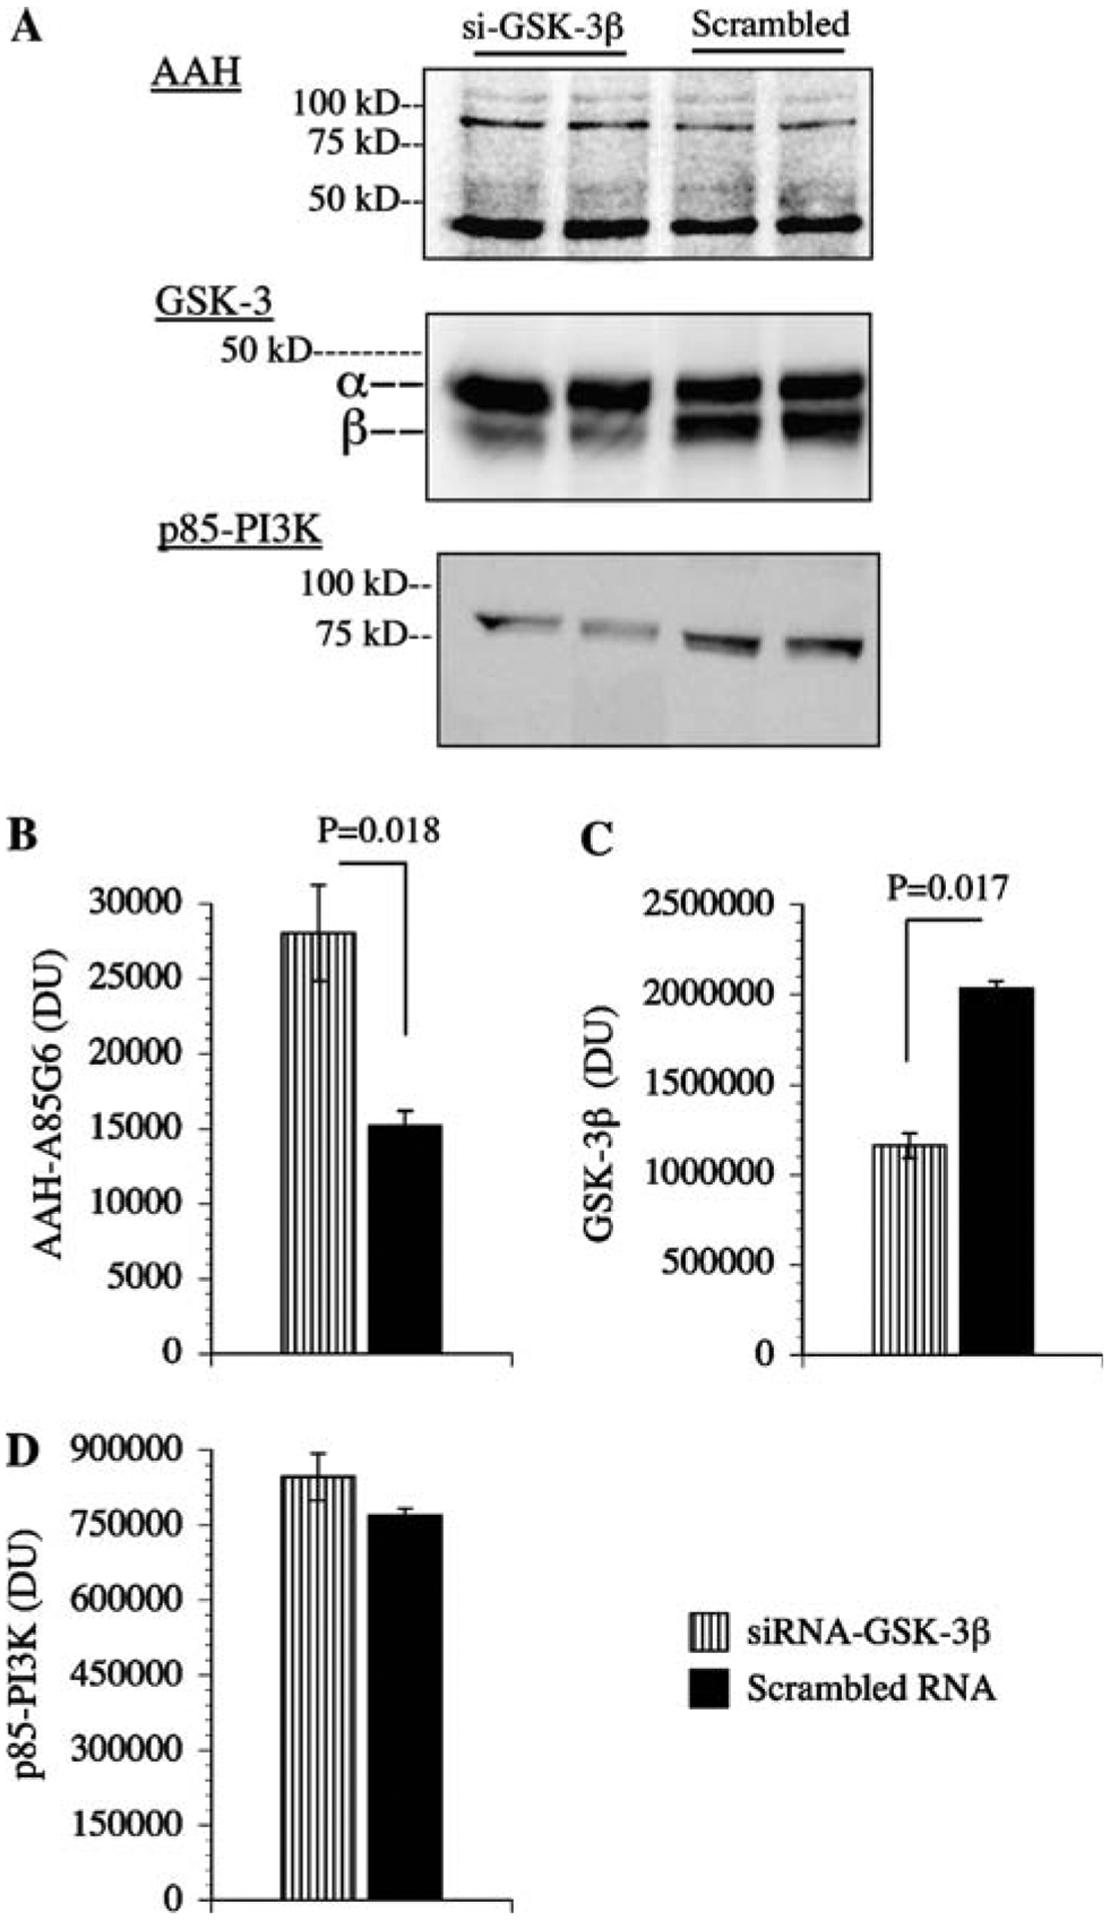
Inhibition of GSK-3β increases AAH protein expression: PNET2 cells were transfected with siRNA-GSK-3β or scrambled RNA sequences. 24 h later, cells were examined for a AAH, GSK-3β, and p85 (PI3K) immunoreactivities by Western blot analysis and (b–d) digital image quantification of the Western blot signals. Graphs depict the mean ± SEM levels of immunoreactivity. Inter-group statistical comparisons were made using Student t-tests and significant P-values are shown over the bars
Directional motility is modulated by GSK-3β
To examine the functional consequences of increased or decreased GSK-3β expression, directional motility was measured in transfected PNET2 cells using the ALMI assay. Over-expression of GSK-3β significantly increased the percentages of non-motile cells, and reduced the percentages of motile non-adherent cells (Fig. 7a, c). The percentages of motile adherent cells were also lower among pGSK-3β transfected cells, but the difference did not reach statistical significance (P = 0.12; Fig. 7b). Cells transfected with siRNA-GSK-3β had significantly lower percentages of non-motile cells (Fig. 7d), and increased percentages of motile adherent cells (Fig. 7e). Although the percentages of motile non-adherent cells were also higher in siRNA-GSK-3β transfected cells, the inter-group difference did not reach statistical significance (P = 0.11; Fig. 7f).
Fig. 7.
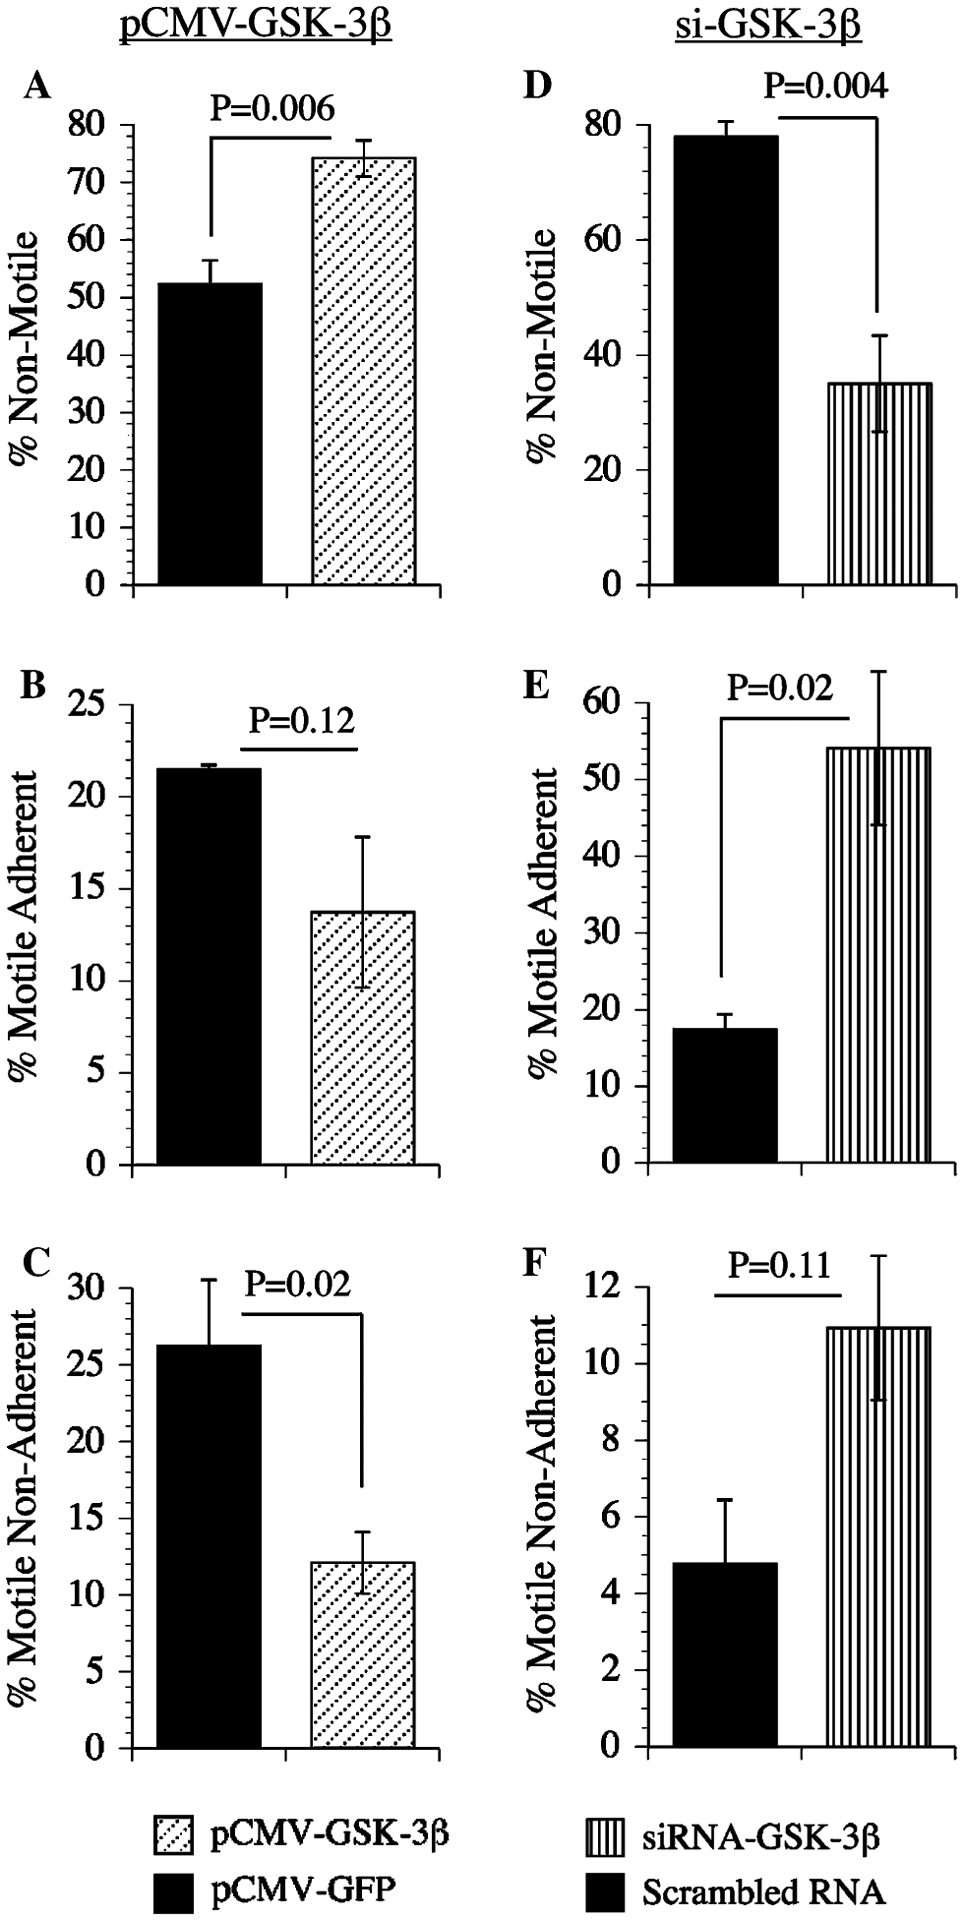
Effects of GSK-3β over-expression and GSK-3β(inhibition on neuronal motility. PNET2 cells transfected with a–c pGFP or pGSK-3β, or d–f siRNA-GSK-3β(or scrambled sequences were used in ALMI (directional motility) assays (see Experimental procedures). Graphs depict the mean ± SEM percentages of motile-adherent motile non-adherent, and motile-adherent + motile non-adherent (total percentage of motile) cells. Inter-group statistical comparisons were made using Student t-tests and significant differences are indicated over the bars
AAH is more phosphorylated in ethanol-treated relative to control PNET2 cells
The earlier studies demonstrated that: (1) AAH protein is phosphorylated on Serine residues; (2) AAH protein phosphorylation is reduced by inhibition of GSK-3β activity; (3) high levels of GSK-3β inhibit AAH expression and motility, and (4) siRNA inhibition of GSK-3β increases AAH expression and directional motility. Taken together with an earlier finding that ethanol increases GSK-3β activity [1, 41], we predicted that AAH would be more highly phosphorylated in ethanol-exposed relative to control cells. To test this hypothesis, we performed Western blot analysis on protein homogenates that were fractionated into phospho-enriched and non-phosphorylated pools, using the A85G6 mAb to AAH. Those studies demonstrated higher levels of AAH immunoreactivity in the phospho-enriched fractions of ethanol-treated relative to control cells, and lower levels of total AAH protein in unfractionated samples from ethanol-exposed cells (Fig. 8a). Digital image quantification of the Western blot signals within the ~52 to 110 kD band cluster revealed significantly higher mean levels of phospho-AAH/non-phospho-AAH (Fig. 8d), and phospho-AAH/total AAH (Fig. 8e) in ethanol-exposed cells. The phospho-enrichment fractionation procedure was partly validated by the fact that, after stripping and re-probing the blots, virtually all of the phospho-Tau immunoreactivity was detected in the phospho-enriched pool (Fig. 8b, c).
Fig. 8.
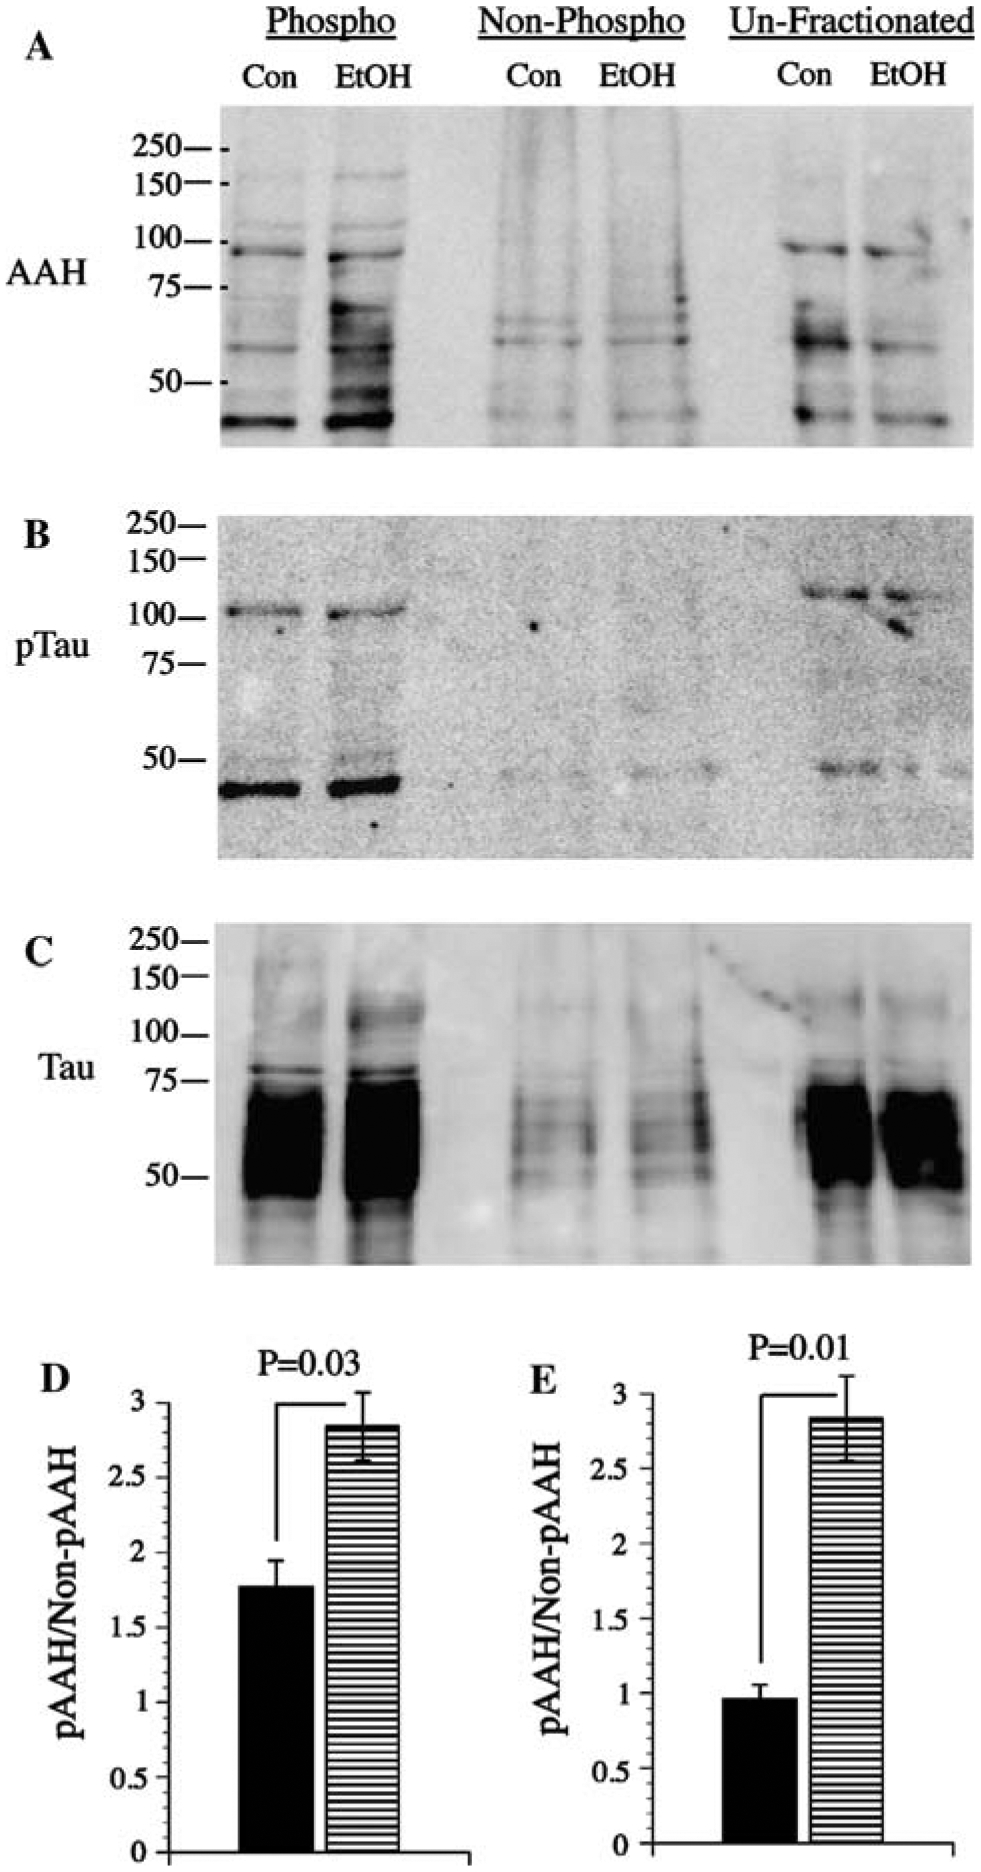
Ethanol treatment increases AAH phosphorylation. Control (Con) and ethanol-treated (EtOH) PNET2 cell protein lysates were subjected to phospho-enrichment fractionation, and equivalent amounts of protein within phosphorylated, flow through (non-phosphorylated), and unfractionated samples were analyzed by Western blotting with the A86G6 mAb to AAH. As control, replicate blots were probed with polyclonal antibodies to Tau, or mAb to phospho-Tau. Positions of molecular weight standards are shown along the left side of each panel
To further confirm that ethanol increases phospho-AAH, while reducing total AAH protein in PNET2 cells, the phospho-enriched and flow through (non-phosphorylated) fractions were analyzed by ELISA using the A85G6 mAb to AAH. As a negative control, β-actin immunoreactivity was measured simultaneously. Corresponding with the Western blot results, ELISAs revealed significantly higher mean levels of phospho-AAH and reduced total AAH protein in ethanol-treated relative to control cells (Fig. 9a, c). Although the levels of non-phosphorylated AAH were slightly reduced in ethanol-exposed cells, the difference relative to control did not reach statistical significance (Fig. 9b). The mean levels of β-actin in the phospho-enriched and non-phosphorylated pools were similar in control and in ethanol-treated cells (Fig. 9d, e). In addition, total β-actin protein expression was similar in the two groups (Fig. 9f).
Fig. 9.
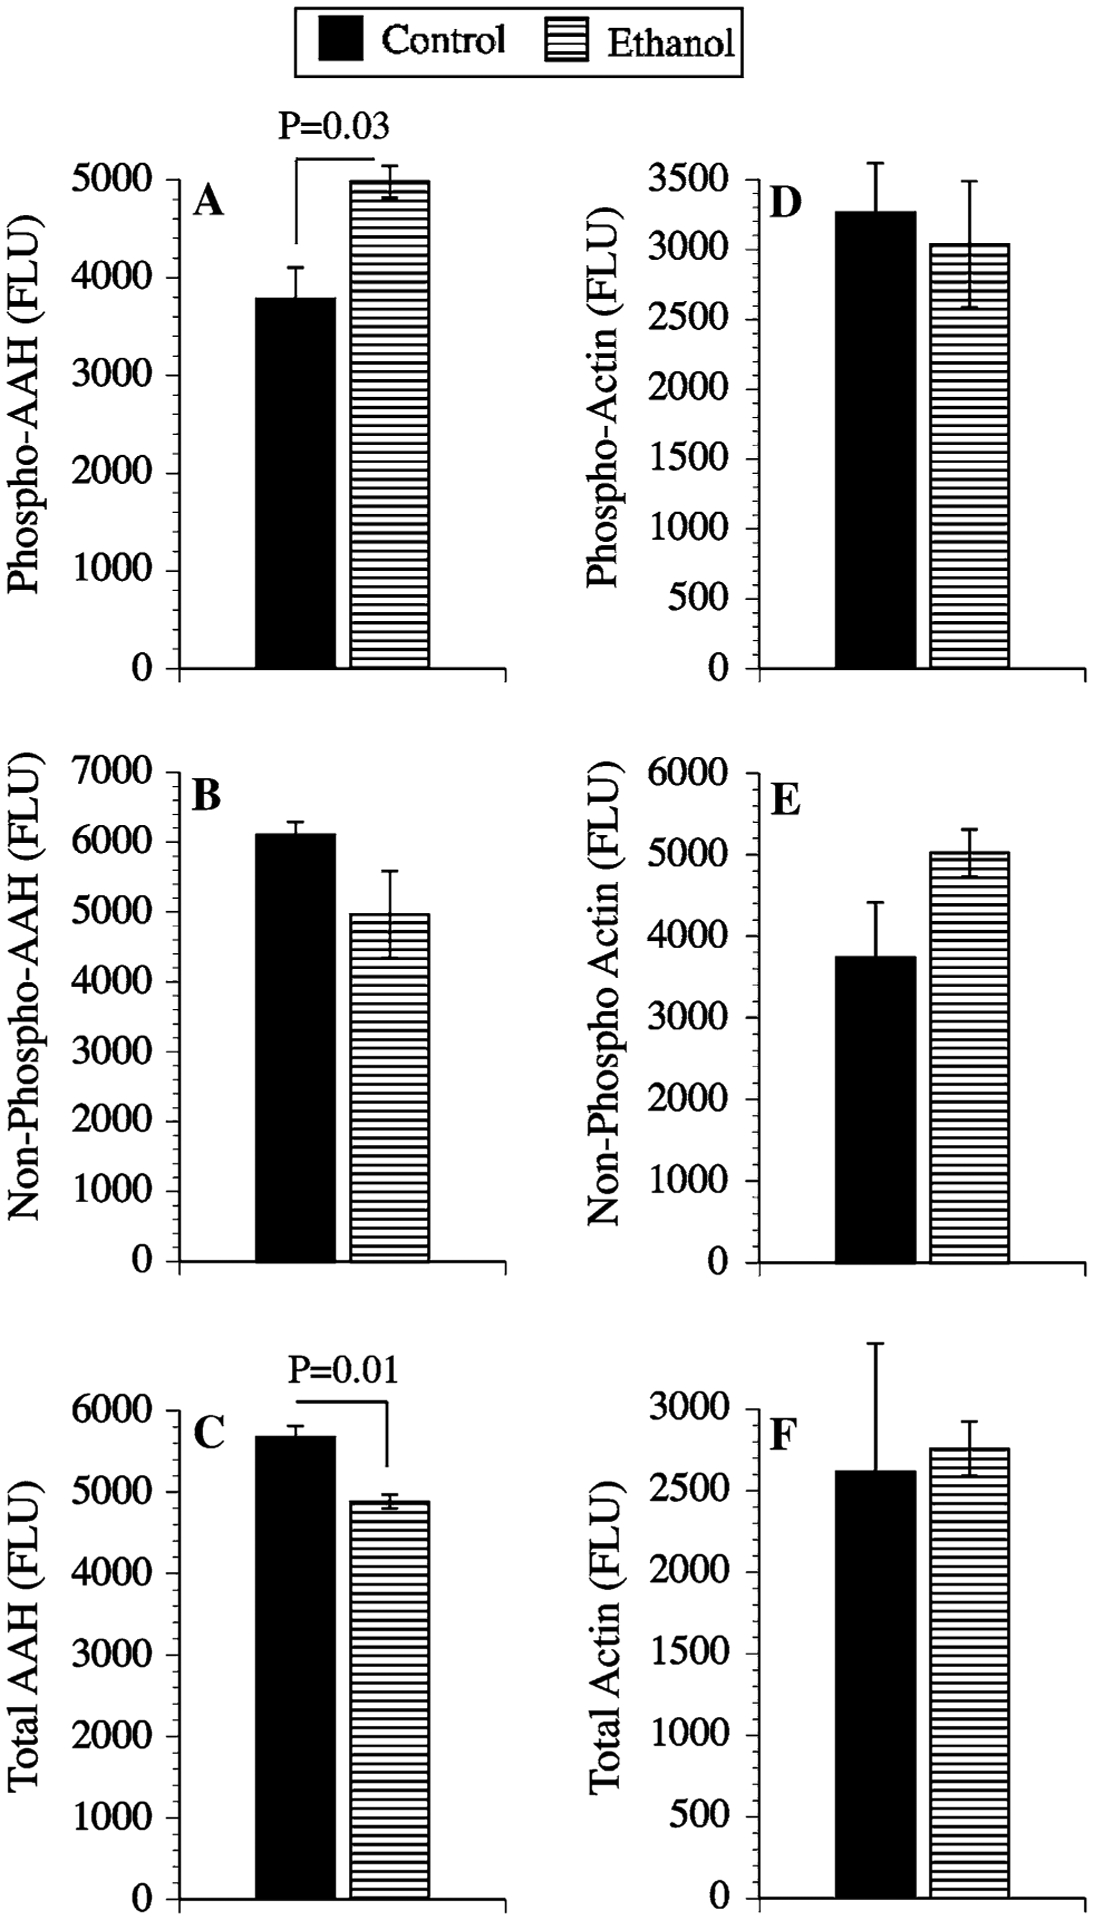
Ethanol treatment increases phosphorylated AAH but decreases total AAH protein. Homogenates of control or ethanol-exposed PNET2 cells were subjected to phospho-enrichment fractionation, and equivalent amounts of protein from phosphorylated, non-phosphorylated, and unfractionated samples were analyzed by ELISA using mAb to (a–c) AAH (A86G6), or β-Actin (control). Immunoreactivity was detected with HRP-conjugated secondary antibody and Amplex Red reagent. Fluorescence intensity (Ex 530 nm/Em 590 nm) was quantified in an M5 microplate reader. Graphs depict the mean ± SEM levels of immunoreactivity (Fluorescencce light units; FLU). Between group statistical comparisons were made using Student t-tests and significant P-values are indicated over the bars
Partial rescue of ethanol-impaired AAH expression
Experiments were conducted to determine the degree to which ethanol-impaired AAH protein expression and directional motility could be rescued by inhibiting GSK-3β. In addition, since phosphorylation often serves to target proteins for Caspase cleavage and degradation [26, 39], and Caspase activity is increased in ethanol-exposed neuronal cells and brains [8, 30], we sought to determine if AAH protein expression in ethanol-treated PNET2 cells could be restored to control levels by inhibiting Caspase activity, in the presence or absence of a GSK-3β inhibitor. First, we used ELISAs to confirm that GSK-3β (Fig. 10a) and Caspase 3/7 (Fig. 10b) activities were significantly increased in ethanol-exposed relative to control cells. Then, we examined the effects of LiCl and benzyloxycarbonyl-Val-Ala-Asp (OMe) fluoromethylketone (Z-VAD.FMK) on AAH expression using ELISAs with results normalized to β-Actin (Fig. 10c). Finally, directional motility was measured using the ALMI assay (Fig. 10d–f). All experimental conditions were analyzed simultaneously in replicates of N = 4 cultures per group. Inter-group statistical comparisons were performed using two-way ANOVAs with the Dunn’s post hoc multiple comparison test of significance. These studies demonstrated that in vehicle-treated cells, AAH immunoreactivity was significantly higher in control versus ethanol-exposed cells. In control cells, LiCl, Z-VAD.FMK, or LiCl + Z-VAD.FMK either did not change or slightly reduced AAH protein. In contrast, LiCl, Z-VAD.FMK, or LiCl + Z-VAD.FMK increased AAH expression in ethanol-exposed cells, with the combined treatments producing the largest increases in AAH (Fig. 10c).
Fig. 10.
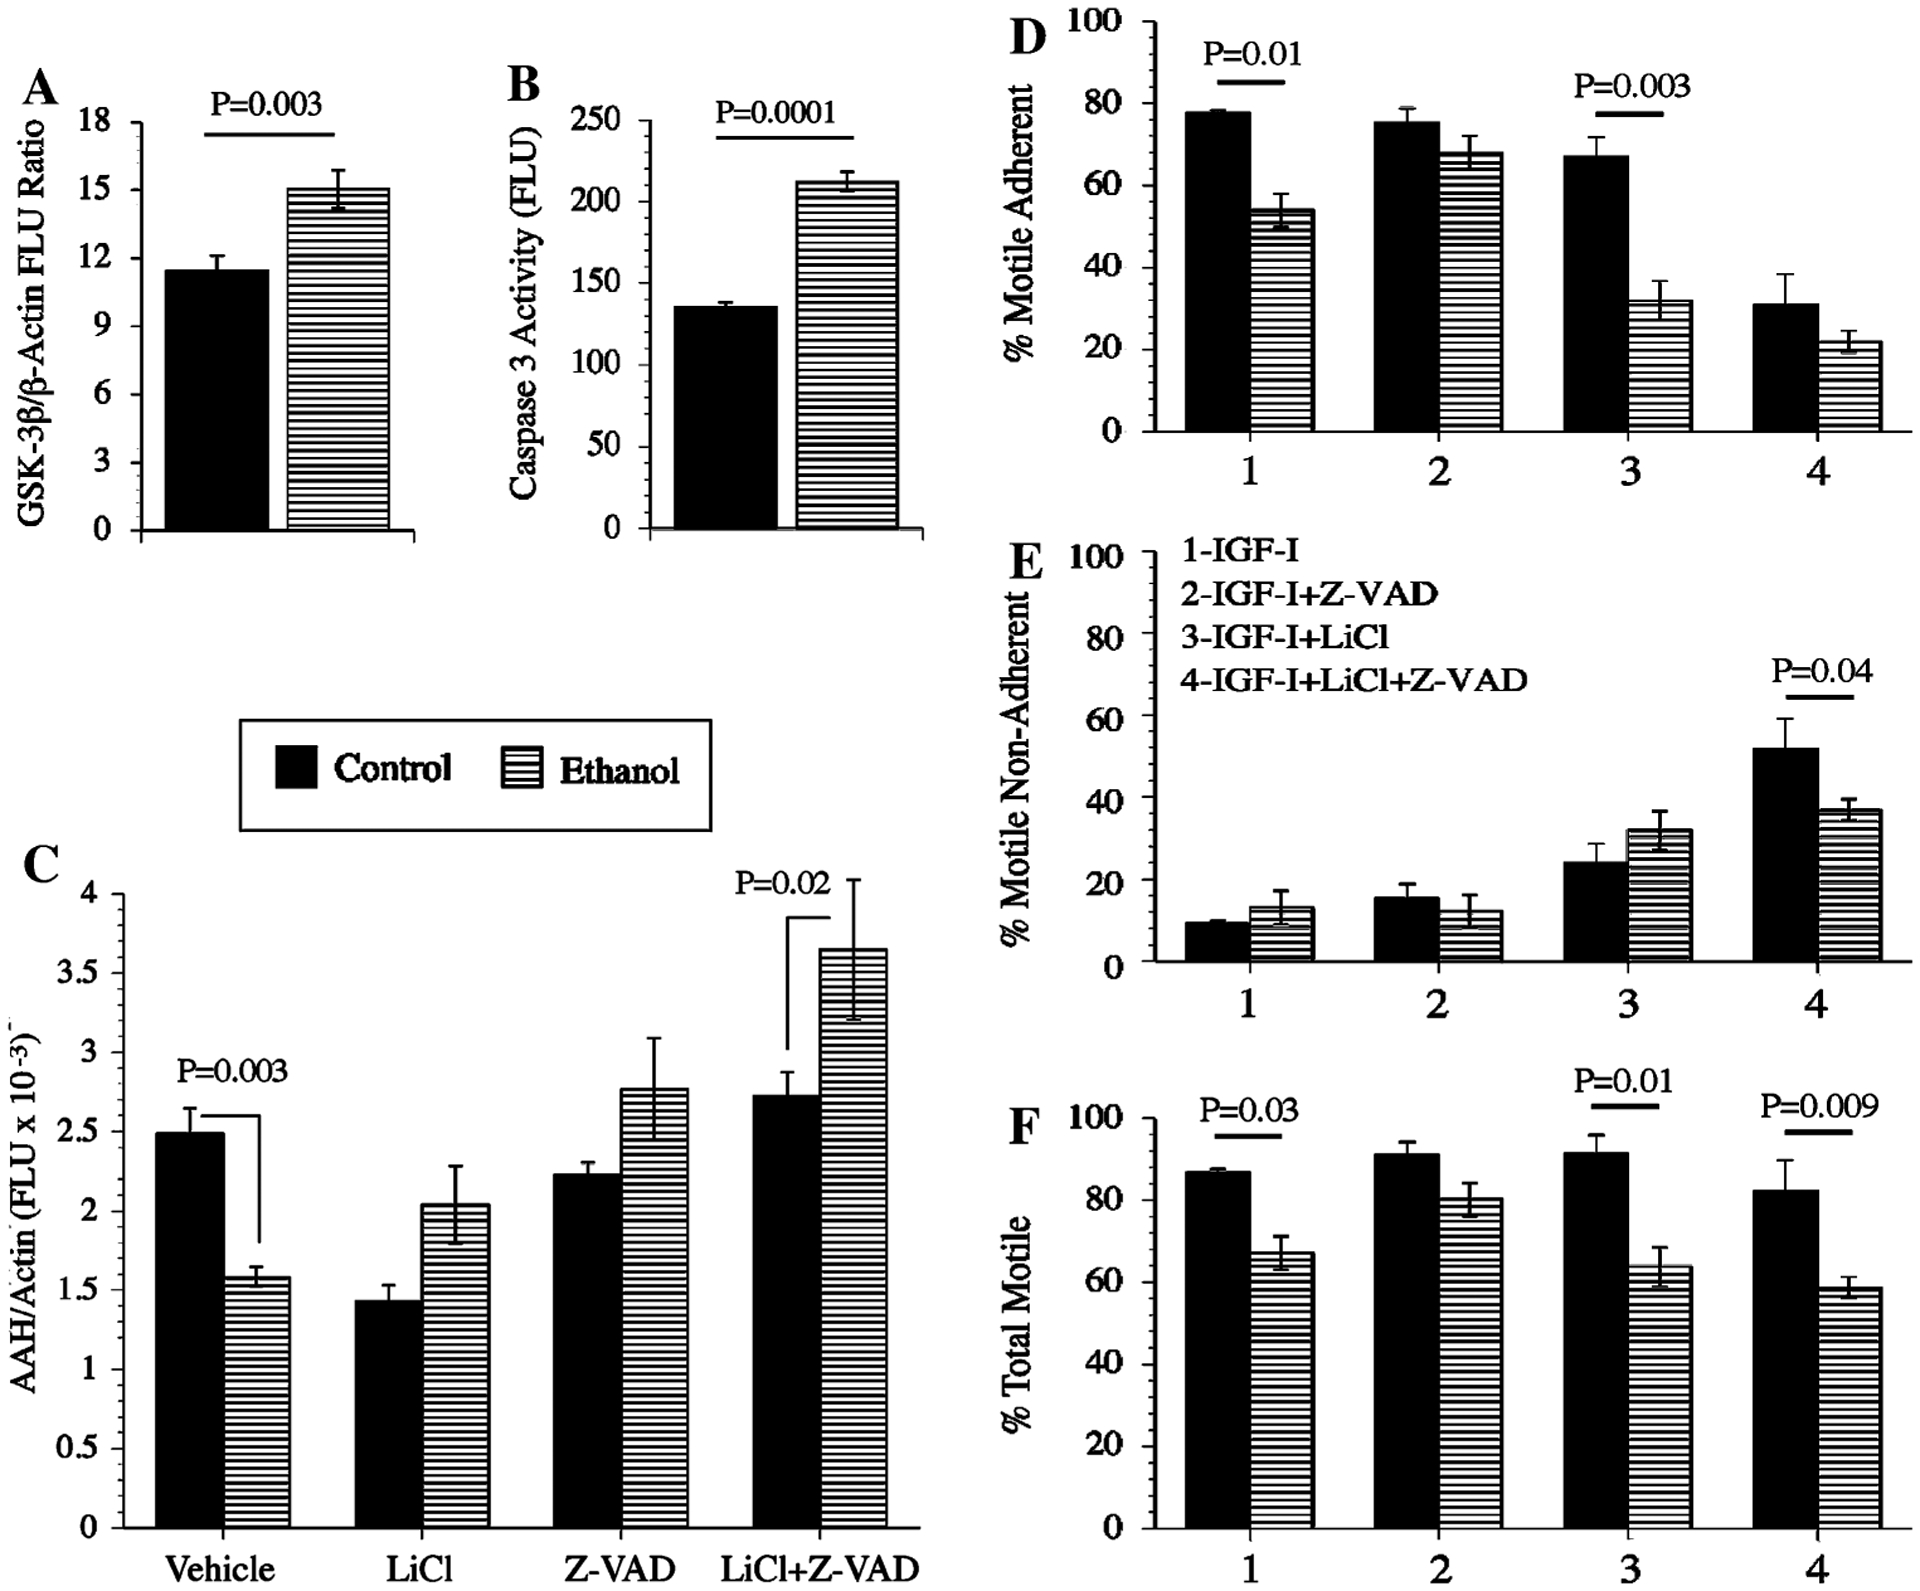
Chemical inhibition of GSK-3β and/or Global Caspases increases AAH protein expression and directional motility in ethanol-exposed PNET2 cells: a GSK-3β and b Caspase 3/7 activity were measured in control or ethanol-exposed PNET2 cells by competitive ELISA. To determine the effects of inhibiting GSK-3β and/or Caspases on AAH protein expression and motility, c cells were pre-treated with vehicle or 20 mM LiCl, and 3 h prior to harvest, cells were treated with 5 mM Z-VAD.FMK (global caspase inhibitor), or vehicle, resulting in four simultaneously studied and paired treatment groups of control and ethanol-exposed cells: Vehicle, LiCl, Z-VAD.FMK, and LiCl + Z-VAD.FMK. AAH immunoreactivity was measured by ELISA using the A85G6 mAb (see Experimental procedures). β-Actin was used as a control. Graphs depict the mean ± SEM levels of immunoreactivity (Fluorescence light units; FLU). d–f Directional motility was measured using the ALMI assay and graphs depict the mean ± SEM percentages of d motile adherent, e motile non-adherent, and f total motile cells. Six replicate samples were used per assay. Inter-group statistical comparisons were made using two-way ANOVA with the post hoc Dunn’s multiple comparison test. Significant differences relative to paired controls are indicated over the bars
In control cells, LiCl, Z-VAD.FMK, and LiCl + Z-VAD.FMK treatments had no significant effect on total motility, but LiCl + Z-VAD.FMK treatment significantly reduced the percentage of motile adherent cells and increased the percentage of motile-non-adherent cells (Fig. 10d–f). In ethanol-exposed cells, LiCl and LiCl + Z-VAD.FMK reduced the mean percentages of motile-adherent, while increasing the percentages of motile non-adherent cells (Fig. 10). Z-VAD.FMK only marginally increased total motility in ethanol-exposed cells. Therefore, the major effect of LiCl, in the presence or absence of Z-VAD.FMK was to reduce cell adhesion and thereby increase the proportion of motile non-adherent cells. Z-VAD.FMK treatment alone did not significantly alter total motility in either control or ethanol-exposed PNET2 cells.
Discussion
Ethanol inhibits AAH protein expression and neuronal migration
This project was initiated to investigate mechanisms of impaired CNS neuronal migration in FASD. Our research focused on AAH because previous studies showed that: (1) high levels of AAH expression increase cell motility and invasion [5, 12]; (2) inhibition of AAH reduces cell motility [5, 12]; (3) the consensus sequence for β-hydroxylation (catalytic activity) exists in epidermal growth factor-like domains of proteins such as Notch and Jagged, which have known roles in neuronal migration, and in extracellular matrix molecules that mediate cell adhesion in the CNS [24]; (4) AAH is regulated by insulin and IGFs [5, 12, 22]; and (5) insulin and IGF signaling are major targets of ethanol-mediated CNS neurotoxicity in FASD [11, 14, 41, 45]. Ethanol inhibition of insulin/IGF signaling in immature neuronal cells is mediated by reduced ligand binding and signaling through the receptor, rather than reduced receptor expression [35, 41]. Herein, we demonstrate, using multiple complementary approaches, that ethanol inhibits IGF-I stimulated AAH protein expression, directional motility, and adhesion (decreased percentages of motile-adherent cells) in PNET2 cells. Ethanol inhibition of neuronal cell adhesion mechanisms has been documented in previous publications [17, 29]. Because the adverse effects of ethanol on AAH protein expression were not accompanied by reductions in AAH’s mRNA, we hypothesized that ethanol inhibition of AAH protein was mediated by post-translational mechanisms.
Post-translational regulation of AAH
To assess potential mechanisms of AAH protein modulation by post-translational mechanisms, we performed computer-assisted subsequence analysis of AAH protein to identify potential sites for phosphorylation, glycosylation, hydroxylation, etc. These investigations predicted the presence of multiple phosphorylation sites, mainly on Serine residues and with consensus sequences for GSK-3β. Although AAH is also predicted to be phosphorylated by other kinases, including PKC, PKA, and CKII, we investigated the role of GSK-3β-mediated phosphorylation as a negative regulator of AAH protein because previous studies showed that directional motility and AAH protein, but not AAH’s mRNA, were increased by LiCl inhibition of GSK-3β [22]. The studies and experiments described herein demonstrate that: (1) AAH protein could be phosphorylated; (2) AAH is phosphorylated on Serine residues; and (3) LiCl inhibition of GSK-3β virtually abolishes Serine phosphorylation of AAH. Therefore, AAH protein expressed in PNET2 CNS neuronal cells can undergo post-translational modification by GSK-3β mediated phosphorylation of Serine residues.
GSK-3β regulation of AAH protein and neuronal motility
To more specifically examine the effects of increased or decreased GSK-3β activity on AAH protein expression and directional motility, we transfected PNET2 cells with recombinant plasmid carrying constitutively active GSK-3β, or with siRNA that targets GSK-3β. These studies showed that increased GSK-3β activity inhibits AAH protein and directional motility, whereas inhibition of GSK-3β results in increases AAH protein expression and directional motility. The aggregate results suggest that GSK-3β negatively regulates AAH protein expression by post-translational mechanisms, probably through phosphorylation, and that the attendant reductions in AAH protein result in decreased directional cell motility. Correspondingly, inhibition of GSK-3β-mediated phosphorylation of AAH leads to increased levels of the protein, possibly due to increased stability, i.e. reduced turnover/degradation, resulting in increased cell motility.
AAH protein is more highly phosphorylated in ethanol-exposed PNET2 cells
Ethanol increases GSK-3β activity because it inhibits PI3 kinase-Akt and increases PTEN activity [14, 33, 41]. Since AAH protein can be phosphorylated by GSK-3β, and increased GSK-3β activity results in decreased AAH protein expression and neuronal motility, we next determined whether ethanol mediates its adverse effects on AAH and neuronal motility through increased phosphorylation of AAH. As predicted, the ethanol-exposed PNET2 cells had higher levels of phosphorylated versus total AAH protein relative to control cells. The potential relevance of these results to FASD is that ethanol-mediated increases GSK-3β activity in neuronal cells and brain [1, 41] could lead to increased phosphorylation of AAH, rendering AAH protein more prone to degradation. The consequent reductions in AAH protein would likely contribute to the impaired CNS neuronal migration observed in FASD.
Partial rescue of AAH expression and motility by inhibition of GSK-3β and/or global Caspases
In light of the present and previous [1, 14, 41] findings that GSK-3β activity is increased in ethanol-exposed neuronal cells, we constructed experiments to examine the role of increased GSK-3β as a mediator of ethanol-impaired AAH protein expression and directional motility. Therefore, it was important to determine if inhibition of GSK-3β could reduce or block the inhibitory effects of ethanol on AAH protein expression and neuronal motility. In addition, we considered the concept that reduced protein expression following its phosphorylation could be mediated by increased degradation. We focused our investigations on the role of Caspases as mediators of AAH protein degradation because: (1) ethanol increases Caspase activity in brain [17, 41]; (2) Caspase cleavage can be triggered by changes in protein phosphorylation state [26, 39]; and (3) exploratory studies supported a role for Caspases and excluded a role for general or global proteases as regulators of AAH protein half-life.
The partial rescue of ethanol-impaired AAH protein expression in cells treated with LiCl or Z-VAD.FMK, and further increases in AAH protein in cells treated with LiCl + Z-VAD.FMK suggest that AAH phosphorylation by GSK-3β may render AAH protein more susceptible to proteolytic degradation by Caspases. However, the findings with respect to directional motility were more complex because treatment with the global Caspase inhibitor, Z-VAD.FMK, only increased the percentages of motile adherent cells, while treatment with LiCl, with or without Z-VAD.FMK, increased motility of non-adherent cells, whether or not they had been exposed to ethanol. Therefore, subsets, and not the entire population of cells, exhibited increased motility by inhibiting GSK-3β and/or global Caspases, and there was no significant increase in overall directional motility of ethanol-exposed neuronal cells, despite substantial increases in AAH protein.
Our current working hypothesis is that in ethanol-exposed neuronal cells, reduced signaling through the insulin/IGF-1 receptors [15, 35, 41, 45] leads to increased GSK-3β activation due to inhibition of PI3 kinase-Akt and/or increased levels of PTEN [41]. Neuronal motility is impaired in part, due to increased GSK-3β phosphorylation and subsequent Caspase degradation of AAH protein. In light of the incomplete rescue afforded by the LiCl + Z-VAD.FMK treatments with regard to neuronal motility, it is conceivable that in addition to protein stability, phosphorylation state also regulates AAH’s catalytic (hydroxylase) activity/function. Future studies will address the role of other potentially relevant kinases, i.e. PKC, PKA, and CKII, as mediators of AAH phosphorylation and stability, and the effects of AAH phosphorylation on its catalytic activity and function in relation to cell motility.
Acknowledgments
Supported by Grants AA02666, AA-02169, AA-11431, AA12908, and AA-16126 from the National Institutes of Health.
References
- 1.Acquaah-Mensah GK, Kehrer JP, Leslie SW (2002) In utero ethanol suppresses cerebellar activator protein-1 and nuclear factor-kappa B transcriptional activation in a rat fetal alcohol syndrome model. J Pharmacol Exp Ther 301:277–283 [DOI] [PubMed] [Google Scholar]
- 2.Aronson M, Hagberg B, Gillberg C (1997) Attention deficits and autistic spectrum problems in children exposed to alcohol during gestation: a follow-up study. Dev Med Child Neurol 39:583–587 [DOI] [PubMed] [Google Scholar]
- 3.Ausubel FM, Brent R, Kingston RE, Moore DD, Seidman JG, Smith JA, Struhl K (2002) Current protocols in molecular biology. Wiley, New York [Google Scholar]
- 4.Banerjee K, Mohr L, Wands JR, de la Monte SM (1998) Ethanol inhibition of insulin signaling in hepatocellular carcinoma cells. Alcohol Clin Exp Res 22:2093–2101 [PubMed] [Google Scholar]
- 5.Cantarini MC, de la Monte SM, Pang M, Tong M, D’Errico A, Trevisani F, Wands JR (2006) Aspartyl–asparagyl beta hydroxylase over-expression in human hepatoma is linked to activation of insulin-like growth factor and notch signaling mechanisms. Hepatology 44:446–457 [DOI] [PubMed] [Google Scholar]
- 6.Carter EA, Wands JR (1988) Ethanol-induced inhibition of liver cell function: I. Effect of ethanol on hormone stimulated hepatocyte DNA synthesis and the role of ethanol metabolism. Alcohol Clin Exp Res 12:555–562 [DOI] [PubMed] [Google Scholar]
- 7.de la Monte SM, Chen GJ, Rivera E, Wands JR (2003) Neuronal thread protein regulation and interaction with microtubule-associated proteins in SH-Sy5y neuronal cells. Cell Mol Life Sci 60:2679–2691 [DOI] [PMC free article] [PubMed] [Google Scholar]
- 8.de la Monte SM, Ganju N, Banerjee K, Brown NV, Luong T, Wands JR (2000) Partial rescue of ethanol-induced neuronal apoptosis by growth factor activation of phosphoinositol-3-kinase. Alcohol Clin Exp Res 24:716–726 [PubMed] [Google Scholar]
- 9.de la Monte SM, Ganju N, Wands JR (1999) Microtiter Immunocytochemical ELISA assay: a novel and highly sensitive method of quantifying immunoreactivity. Biotechniques 26:1073–1076 [DOI] [PubMed] [Google Scholar]
- 10.de la Monte SM, Lahousse SA, Carter J, Wands JR (2002) ATP luminescence-based motility-invasion assay. Biotechniques 33:98–100, 102, 104 passim [DOI] [PubMed] [Google Scholar]
- 11.de la Monte SM, Neely TR, Cannon J, Wands JR (2001) Ethanol impairs insulin-stimulated mitochondrial function in cerebellar granule neurons. Cell Mol Life Sci 58:1950–1960 [DOI] [PMC free article] [PubMed] [Google Scholar]
- 12.de la Monte SM, Tamaki S, Cantarini MC, Ince N, Wiedmann M, Carter JJ, Lahousse SA, Califano S, Maeda T, Ueno T, D’Errico A, Trevisani F, Wands JR (2006) Aspartyl-(asparaginyl)-beta-hydroxylase regulates hepatocellular carcinoma invasiveness. J Hepatol 44:971–983 [DOI] [PubMed] [Google Scholar]
- 13.de la Monte SM, Wands JR (2001) Mitochondrial DNA damage and impaired mitochondrial function contribute to apoptosis of insulin-stimulated ethanol-exposed neuronal cells. Alcohol Clin Exp Res 25:898–906 [PubMed] [Google Scholar]
- 14.de la Monte SM, Wands JR (2002) Chronic gestational exposure to ethanol impairs insulin-stimulated survival and mitochondrial function in cerebellar neurons. CMLS Cell Mol Life Sci 59:882–893 [DOI] [PMC free article] [PubMed] [Google Scholar]
- 15.de la Monte SM, Xu XJ, Wands JR (2005) Ethanol inhibits insulin expression and actions in the developing brain. Cell Mol Life Sci 62:1131–1145 [DOI] [PubMed] [Google Scholar]
- 16.Dinchuk JE, Focht RJ, Kelley JA, Henderson NL, Zolotarjova NI, Wynn R, NeV NT, Link J, Huber RM, Burn TC, Rupar MJ, Cunningham MR, Selling BH, Ma J, Stern AA, Hollis GF, Stein RB, Friedman PA (2002) Absence of post-translational aspartyl beta-hydroxylation of epidermal growth factor domains in mice leads to developmental defects and an increased incidence of intestinal neoplasia. J Biol Chem 277:12970–12977 [DOI] [PubMed] [Google Scholar]
- 17.Goodlett CR, Horn KH, Zhou FC (2005) Alcohol teratogenesis: mechanisms of damage and strategies for intervention. Exp Biol Med (Maywood) 230:394–406 [DOI] [PubMed] [Google Scholar]
- 18.Hausknecht KA, Acheson A, Farrar AM, Kieres AK, Shen RY, Richards JB, Sabol KE (2005) Prenatal alcohol exposure causes attention deficits in male rats. Behav Neurosci 119:302–310 [DOI] [PubMed] [Google Scholar]
- 19.Hu IC, Singh SP, Snyder AK (1995) Effects of ethanol on glucose transporter expression in cultured hippocampal neurons. Alcohol Clin Exp Res 19:1398–1402 [DOI] [PubMed] [Google Scholar]
- 20.Jia S, VanDusen WJ, Diehl RE, Kohl NE, Dixon RA, Elliston KO, Stern AM, Friedman PA (1992) cDNA cloning and expression of bovine aspartyl (asparaginyl) beta-hydroxylase. J Biol Chem 267:14322–14327 [PubMed] [Google Scholar]
- 21.Karl PI, Fisher SE (1993) Ethanol alters hormone production in cultured human placental trophoblasts. Alcohol Clin Exp Res 17:816–821 [DOI] [PubMed] [Google Scholar]
- 22.Lahousse SA, Carter JJ, Xu XJ, Wands JR, de la Monte SM (2006) Differential growth factor regulation of aspartyl-(asparaginyl)-beta-hydroxylase family genes in SH-Sy5y human neuroblastoma cells. BMC Cell Biol 7:41. [DOI] [PMC free article] [PubMed] [Google Scholar]
- 23.Lasky JL, Wu H (2005) Notch signaling, brain development, and human disease. Pediatr Res 57:104R–109R [DOI] [PubMed] [Google Scholar]
- 24.Lavaissiere L, Jia S, Nishiyama M, de la Monte S, Stern AM, Wands JR, Friedman PA (1996) Overexpression of human aspartyl(asparaginyl)beta-hydroxylase in hepatocellular carcinoma and cholangiocarcinoma. J Clin Invest 98:1313–1323 [DOI] [PMC free article] [PubMed] [Google Scholar]
- 25.Li L, Mao J, Sun L, Liu W, Wu D (2002) Second cysteine-rich domain of Dickkopf-2 activates canonical Wnt signaling pathway via LRP-6 independently of dishevelled. J Biol Chem 277:5977–5981 [DOI] [PubMed] [Google Scholar]
- 26.Li M, Linseman DA, Allen MP, Meintzer MK, Wang X, Laessig T, Wierman ME, Heidenreich KA (2001) Myocyte enhancer factor 2A and 2D undergo phosphorylation and caspase-mediated degradation during apoptosis of rat cerebellar granule neurons. J Neurosci 21:6544–6552 [DOI] [PMC free article] [PubMed] [Google Scholar]
- 27.Liesi P (1997) Ethanol-exposed central neurons fail to migrate and undergo apoptosis. J Neurosci Res 48:439–448 [DOI] [PubMed] [Google Scholar]
- 28.Maier SE, West JR (2001) Regional differences in cell loss associated with binge-like alcohol exposure during the first two trimesters equivalent in the rat. Alcohol 23:49–57 [DOI] [PubMed] [Google Scholar]
- 29.Minana R, Climent E, Barettino D, Segui JM, Renau-Piqueras J, Guerri C (2000) Alcohol exposure alters the expression pattern of neural cell adhesion molecules during brain development. J Neurochem 75:954–964 [DOI] [PubMed] [Google Scholar]
- 30.Ramachandran V, Perez A, Chen J, Senthil D, Schenker S, Henderson GI (2001) In utero ethanol exposure causes mitochondrial dysfunction, which can result in apoptotic cell death in fetal brain: a potential role for 4– hydroxynonenal. Alcohol Clin Exp Res 25:862–871 [PubMed] [Google Scholar]
- 31.Riley EP, McGee CL (2005) Fetal alcohol spectrum disorders: an overview with emphasis on changes in brain and behavior. Exp Biol Med (Maywood) 230:357–365 [DOI] [PubMed] [Google Scholar]
- 32.Sepe PS, Lahousse SA, Gemelli B, Chang H, Maeda T, Wands JR, de la Monte SM (2002) Role of the aspartyl-asparaginyl-beta-hydroxylase gene in neuroblastoma cell motility. Lab Invest 82:881–891 [DOI] [PubMed] [Google Scholar]
- 33.Sheu JC, Hsu CP, Yang CC, Yang SD (1998) Acute inductive effects on oncogenic proline-directed protein kinase FA/GSK-3 alpha in NIH 3T3 cells by ethanol and cadmium. Proc Natl Sci Counc Repub China B 22:68–75 [PubMed] [Google Scholar]
- 34.Singh SP, Gao Y, Kunapuli SP, Ravindra R (1999) Ethanol inhibits G-protein-mediated glucose uptake by C6 glioma cells. Neuro-report 10:595–599 [DOI] [PubMed] [Google Scholar]
- 35.Soscia SJ, Tong M, Xu XJ, Cohen AC, Chu J, Wands JR, de la Monte SM (2006) Chronic gestational exposure to ethanol causes insulin and IGF resistance and impairs acetylcholine homeostasis in the brain. Cell Mol Life Sci 63:2039–2056 [DOI] [PMC free article] [PubMed] [Google Scholar]
- 36.Swanson DJ, King MA, Walker DW, Heaton MB (1995) Chronic prenatal ethanol exposure alters the normal ontogeny of choline acetyltransferase activity in the rat septohippocampal system. Alcohol Clin Exp Res 19:1252–1260 [DOI] [PubMed] [Google Scholar]
- 37.Tateno M, Ukai W, Ozawa H, Yamamoto M, Toki S, Ikeda H, Saito T (2004) Ethanol inhibition of neural stem cell differentiation is reduced by neurotrophic factors. Alcohol Clin Exp Res 28:134S–138S [DOI] [PubMed] [Google Scholar]
- 38.The I, Murthy AE, Hannigan GE, Jacoby LB, Menon AG, Gusella JF, Bernards A (1993) Neurofibromatosis type 1 gene mutations in neuroblastoma. Nat Genet 3:2633–2642 [DOI] [PubMed] [Google Scholar]
- 39.van de Water B, Tijdens IB, Verbrugge A, Huigsloot M, Dihal AA, Stevens JL, Jaken S, Mulder GJ (2000) Cleavage of the actin-capping protein alpha -adducin at Asp-Asp-Ser-Asp633-Ala by caspase-3 is preceded by its phosphorylation on serine 726 in cisplatin-induced apoptosis of renal epithelial cells. J Biol Chem 275:25805–25813 [DOI] [PubMed] [Google Scholar]
- 40.Wang QP, VanDusen WJ, Petroski CJ, Garsky VM, Stern AM, Friedman PA (1991) Bovine liver aspartyl beta-hydroxylase. Purification and characterization. J Biol Chem 266:14004–14010 [PubMed] [Google Scholar]
- 41.Xu J, Yeon JE, Chang H, Tison G, Chen GJ, Wands J, de la Monte S (2003) Ethanol impairs insulin-stimulated neuronal survival in the developing brain: role of PTEN phosphatase. J Biol Chem 278:26929–26937 [DOI] [PubMed] [Google Scholar]
- 42.Yanni PA, Lindsley TA (2000) Ethanol inhibits development of dendrites and synapses in rat hippocampal pyramidal neuron cultures. Brain Res Dev Brain Res 120:233–243 [DOI] [PubMed] [Google Scholar]
- 43.Yoon K, Gaiano N (2005) Notch signaling in the mammalian central nervous system: insights from mouse mutants. Nat Neurosci 8:709–715 [DOI] [PubMed] [Google Scholar]
- 44.Yuan H, Mao J, Li L, Wu D (1999) Suppression of glycogen synthase kinase activity is not sufficient for leukemia enhancer factor-1 activation. J Biol Chem 274:30419–30423 [DOI] [PubMed] [Google Scholar]
- 45.Zhang FX, Rubin R, Rooney TA (1998) Ethanol induces apoptosis in cerebellar granule neurons by inhibiting insulin-like growth factor 1 signaling. J Neurochem 71:196–204 [DOI] [PubMed] [Google Scholar]