

Abstract
Background:
Continuous-flow ventricular assist devices (cfVADs) are implanted in patients with end-stage heart failure to assist with blood circulation. However, VAD implantation is associated with dangerous thrombotic complications. Our goal was to determine the impact of micron and sub-micron scale Ti6Al4V surface roughness on adherent platelet aggregate properties under clinically relevant shear rates.
Methods:
We used fluorescence microscopy to visualize platelets in real time as they adhered to Ti6Al4V coupons of varying degrees of roughness, including a smooth control, in microfluidic channels and quantified deposition using an image processing algorithm. We systematically characterized roughness using spatial frequencies to generalize results for more blood-biomaterial contact applications.
Results:
We observed that on the control and sub-micron rough surfaces, at 1000 s−1, platelets adhered uniformly on the surface. At 2000 s−1, we observed small and stably adherent platelet aggregates. At 5500 s−1, platelet aggregates were large, unstable and interconnected via fibrillar structures. On a surface with micron-scale roughness features, at all three shear rates, platelets deposited in the troughs of the roughened surface, and formed aggregates. Thrombus height at 2000 s−1 and 5500 s−1 was greatest on the roughest surface and lowest on the mirror-finished surface, as indicated by the mean fluorescence intensity.
Conclusions:
These results demonstrated that at high shear rates, thrombi form regardless of surface topography at the scales applied. At lower shear rates, micron-scale surface features cause thrombus formation, whereas submicron features result in innocuous platelet adhesion. These findings have implications for manufacturing costs and other considerations.
Keywords: thrombosis, embolism, surface roughness, platelets, adhesion, microfluidics, ventricular assist device, Ti6Al4V
Graphical Abstract
Our goal was to determine the impact of surface roughness on platelet aggregate properties under clinically relevant shear rates. We used fluorescence microscopy to quantify platelet adhesion on roughened Ti6Al4V surfaces in microfluidic channels and quantified deposition using an image processing algorithm. Our results demonstrated that at high shear rates, thrombi form regardless of surface topography at the scales applied, whereas at lower shear rates, micron-scale surface features cause thrombus formation, whereas submicron features result in innocuous platelet adhesion.
Introduction
Blood-contacting devices such as ventricular assist devices (VADs) are associated with thrombosis, i.e., blood clot formation, which results in complications such as device malfunction, invasive replacement surgeries, stroke, and death (1). The factors of Virchow’s triad have been interpreted in the context of blood-wetted artificial organs as: blood-surface contact, blood flow characteristics and biochemical factors impacting blood coagulability (2).
When blood contacts biomaterial surfaces, which in the case of VADs are often made of titanium alloys or polymers, plasma proteins adsorb to the surface, creating an adhesive layer for platelets i.e., thrombocytes to bind to with surface receptors. Therefore, implanted surfaces serve as a nidus for the formation of potentially dangerous thrombus, comprised mainly of platelets and a network of plasma proteins (3). Thrombi that are cleaved from the surface form emboli that flow downstream and potentially result in neuroembolic complications (4).
Platelets may exist in either resting or active states, the latter of which have higher protein binding affinities due to increased expression of surface receptors. Platelets bind to key proteins, namely fibrinogen and von Willebrand factor (vWf), which exist in globular conformations when freely flowing in blood. Shear rates as low as 50 s−1induce fibrinogen unfolding and expose binding sites for platelets (5). However, due to weak fibrinogen-platelet receptor bonds, at increasing shear rates, platelets rolling on fibrinogen-coated surfaces are unable to sustain stable adhesion (6). The number of platelets binding to fibrinogen markedly drops when shear rate exceeds 1000 s−1 (5). On the other hand, vWf is a multimeric protein that unfolds at shear rates above 1000 s−1, with the largest multimers elongating at 5000 s−1 (7). vWf forms stronger bonds than fibrinogen with platelets and has been reported to support stable bonds at shear rates above 5000 s−1 (5).
A review of the literature reveals several investigations to the effect of roughness, surface chemistry, and flow conditions on platelet adhesion (table 1), The first column from the right represents the percent change in platelet adhesion on a roughened surface in comparison with a smooth control, and the second and third rows describe the fluid flow conditions and test surface in each study respectively. Some studies showed that rough surface features on the nano- to micro-scale allow more platelets to adhere to crevices and help stabilize thrombi (8–14), whereas others observed that troughs of similar scale discourage platelets from adhering initially, thereby mitigating thrombosis (13,15–18). Some found that there was no difference in platelet adhesion between the smooth and rough surfaces studied (13,19). Overall, there is no clear pattern among surface roughness, shear rate, surface chemistry and platelet deposition. Also, there is no standardization to the measure of roughness; some studies report roughness in terms of arithmetic mean height (Ra) others use contact angle. While the former indicates feature size in a simplified manner, the latter can be misleading on surfaces with sub-micron scale features (20,21). Additionally, some studies were performed under static conditions, and therefore did not capture flow-induced protein interactions with both the surface and platelets (12,14,17,19). To the best knowledge of the authors, no prior study on this area has been performed of aggregate stability or embolization.
Table 1:
Consolidation of results from past studies that quantify adherent platelets on roughened surfaces
| Reference | Flow conditions | Surface Chemistry | Roughness Scale (μm) | Percent change |
|---|---|---|---|---|
| Sun et al. (16) | Static | Polyurethane | 0.04 | −100% |
| Zhou et al. (17) | Static | PDMS | 0.1–60 | −98% |
| Zingg et al. (13) | Flow cell | Glass | Unspecified | −79% |
| Pham et al. (18) | Flow cell | PDMS | 0.9–15 | −78% |
| Milner et al. (15) | Rotating disk system | Polyether (urethane urea) | 0.4–0.7 | −78% |
| Koh et al. (14) | Static | PLGA | 0.015–3 | −52% |
| Zingg et al. (13) | Static | Silane | Unspecified | 0% |
| Zingg et al. (13) | Static | Glass | Unspecified | 0% |
| Hasebe et al. (19) | Static | Diamond-like carbon | 0.004–0.1 | 0% |
| Linneweber et al. (10) | Artificial circulatory system | Ti6Al4V | 0.05–0.4 | 76% |
| Zingg et al. (13) | Flow cell | Silane | Unspecified | 84% |
| Schuster et al. (12) | Static | TiO2 coating on Ti6Al4V | 0.006–0.047 | 96% |
| Hecker et al. (8) | Artificial catheter | PVC | 1–2; 10–20 | 159% |
Accordingly, we sought to determine the impact of micron and sub-micron scale surface roughness of a titanium alloy on platelet adhesion under shear, using microfluidic devices. We deliberately roughened Ti6Al4V surfaces and systematically described their topographies using spatial frequencies and quantified platelet adhesion using an image processing algorithm.
Materials and Methods
• Blood analog preparation
Fresh whole blood was collected in Na-citrated tubes (0.109M Na citrate, BD Vacutainer, BD, NJ, USA) with informed consent from healthy donors between the ages of 18 to 65, who had refrained from taking any platelet-altering medications 14 days prior to collection, in accordance with Institutional Review Board guidelines (IRB #2003009497). Platelet-rich plasma (PRP) was collected by centrifuging whole blood at 500 x g for 10 minutes. Platelets were fluorescently labeled with quinacrine dihydrochloride, also known as mepacrine, (10 μM final concentration, Sigma Aldrich, St. Louis, MO, USA) to the PRP. Hemoglobin-depleted ghost red blood cells (RBCs) were produced by processing packed RBCs via hypotonic permeabilization of the cells using magnesium sulfate solution (4 mM in deionized water, pH of 4.9–5.1, osmolarity of 20–30 mOsm). Isotonicity was restored with phosphate buffered saline (PBS) and Tris buffer (1M) and the solution was left overnight at 4°C. After an hour of incubation at 37°C, the RBC suspension was centrifuged at 10000 x g for 30 minutes and washed with PBS two times at 10000 x g for 15 minutes. The supernatant was discarded and packed ghost RBCs were obtained (22). The fluorescently labeled PRP was then mixed with the RBC ghosts to produce a final hematocrit of 30% (figure 1a).
Figure 1:

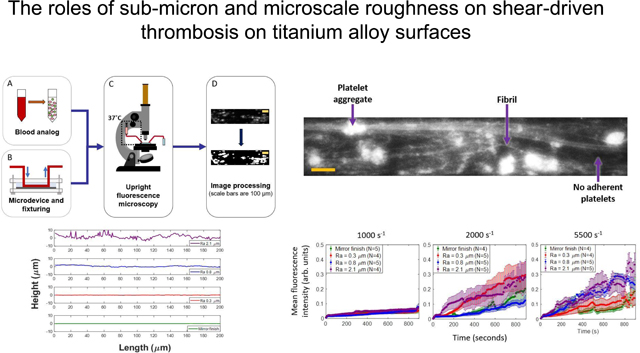
Schematic of methodology: (A) blood analog (green=mepacrine-labeled platelets, pink=hemoglobin-depleted red blood cells) (B) set-up of microfluidic chamber (C) image acquisition using upright fluorescent microscope (D) image post-processing using MATLAB
• Microfluidic device design and fabrication
Microfluidic channels were designed using KLayout computer-aided design (CAD) software. The channels had a width of 250 μm, height of 50 μm and length of 14 mm. The design was generated on a photosensitive chrome mask using a mask writer (DWL2000, Heidelberg Instruments, Heidelberg, Germany) and the design was developed and etched (HMP900, HamaTech AG, Sternenfels, Germany). SU-8 photoresist was used to coat a silicon substrate at the desired height of 50 μm and features were exposed using a contact aligner (ABM-USA Inc., CA, USA). Feature dimensions on the silicon master substrate were verified using a profilometer (Tencor P10, KLA Corporation, CA, USA). We poured a mixture of polydimethylsiloxane (PDMS) elastomer and curing agent (Sylgard 184, Dow Corning Corporation, MI, USA) on the silicon master and baked it for 2 hours at 60°C.
• Surface preparation and characterization
Polished Ti6Al4V surfaces were roughened to an arithmetic mean height (Ra) value of up to 0.8 μm using abrasive and sandblasting techniques with diamond or glass microparticles of sizes ranging from 2–50 μm in diameter. A highly rough surface profile with Ra of 2.1 μm was roughened by use of a belt sander - representative of an unpolished machined surface. The lay was unidirectional across the surfaces. A mirror finished surface was used as a negative control. Three-dimensional surface profiles were obtained using a laser scanning profilometer (VK-250, Keyence Corporation of America, IL, USA). A custom MATLAB program was written to calculate the Ra values as well as generate mean discrete Fourier transform (DFT) amplitude profiles. Grit sizes and their corresponding Ra values are listed in table 2. Representative topographical profiles perpendicular to the roughness lay and parallel to the direction of flow are shown in figure 2. Amplitude spectra were generated by calculating 1-dimensional Fourier transforms for over 600 surface height profiles parallel to the direction of flow, which were then averaged over all the profiles and displayed as the absolute value.
Table 2:
Grit size and corresponding Ra values of all test surfaces.
| Grit size | Ra (μm) |
|---|---|
| None | 0.03 ± 0.01 |
| 1200 | 0.3 ± 0.01 |
| 280 | 0.8 ± 0.09 |
| 120 | 2.1 ± 0.06 |
Figure 2:

Representative height profiles on all tested Ti6Al4V surfaces: Ra = 2.1 μm, Ra = 0.8 μm, Ra = 0.3 μm, Mirror finish (Ra 0.03 μm).
• Microfluidic Experiments
The PDMS microchannels were placed on top of the Ti6Al4V coupons and clamped between two sheets of polypropylene by screws on all four corners (figure 1b). The direction of lay was perpendicular to the flow direction. The roughest surface (Ra = 2.1 μm) necessitated additional sealing with a thin film of cured PDMS (8:1 ratio elastomer: curing agent) and baked at 60°C for 2 hours. The blood analog was introduced into the microfluidic channel from a 3 mL syringe (Becton, Dickinson and Company, NJ, USA) by a syringe pump (Chemyx, Inc., TX, USA). Flexible plastic tubing (Tygon, Saint-Gobain PPL Corporation, PA, USA) connected the syringe needle to the microchannel inlet and the outlet to a waste reservoir. The syringe and inlet tube contents were maintained at 37°C with the aid of heating pads and a syringe heater control unit (New Era Pump Systems, Inc., NY, USA). Wall shear rates of 1000 s−1, 2000 s−1 and 5500 s−1 were applied by setting the volumetric flow-rate to 6 μL/min, 12 μL/min and 34 μL/min respectively.
• Image acquisition
Platelet deposition on the Ti6Al4V surfaces was visualized in real time using an upright epifluorescence microscope as depicted in figure 1c (Olympus BX51WI, Olympus Corporation Shinjuku, Tokyo, Japan) with a 10x super long working distance objective (PlanFL, working distance 16 mm, numerical aperture 0.30; Olympus Corporation). Images were acquired every second for 15 minutes from the start of perfusion by use of a CCD camera (Retiga 1300, Q Imaging, BC, Canada). The images were acquired with Q-Capture Pro 7 software.
• Fluorescent image analysis and quantification
Adherent platelet aggregate properties over time were computed using a custom MATLAB program (MathWorks, Inc., Natick, MA, USA) that includes flat-field illumination correction, noise removal using pixel-wise low-pass temporal filtering, and binarization using a multiple Otsu thresholding method. Here, two optimal thresholds were identified using the intensity histogram of an entire frame with Otsu’s method (23), and the lower of two thresholds was used distinguish between platelets and background (figure 1d). From the binarized images, the properties of the platelet aggregates were obtained: individual aggregate areas, number of aggregates per frame and their mean intensity.
• Statistical analysis
Data from multiple trials (number of replicates specified in each corresponding figure) for each parameter was represented as the mean ± standard error of the mean.
Results
• Spatial frequency analysis of roughness profiles
Figure 3 depicts how the magnitude of the discrete Fourier transform (DFT) varies with spatial frequency on the surfaces of interest. The spatial frequency associated with a single platelet is illustrated by the dashed line. Overall, we observed similar general trends among the four test surfaces with an exponential decrease in DFT magnitude as the spatial frequency increased. The sub-micron surfaces exhibited similar DFT magnitudes above a spatial frequency of about 2 radians/μm. The conclusion of these results was that no characteristic size dominates the frequency spectrum, and the distribution is mostly a result of pink noise. Notably, at the length scale of a single platelet, the magnitude of variations increases monotonically with Ra; therefore, Ra is an appropriate stand-in for the amplitude of the roughness spectrum at platelet length scales.
Figure 3:

Magnitudes of discrete Fourier transforms of roughness profiles on all test surfaces. Vertical dashed line indicates nominal spatial frequency of platelet.
• Representative time traces of platelet adhesion
Figure 4 shows a typical frame of the video recording (at t = 600 seconds) with adherent platelet aggregates and fibrillar structures for Ra 0.8 μm at 5500 s−1. The intensity was interpreted as an indicator of the height of platelet aggregates. (Black regions were considered devoid of adherent platelets.)
Figure 4:

Representative frame of platelet adhesion on Ti6Al4V surface (t = 600 seconds, Ra 0.8 μm at 5500 s−1. Flow direction in micro-channels is from left to right and scale bar is 100 μm. Sample platelet aggregate, fibril and platelet-free regions are labeled with arrows.
Figure 5 shows representative images of platelet adhesion patterns at time points of 300, 600 and 900 seconds at three shear rates: 1000 s−1, 2000 s−1 and 5500 s−1. They are grouped into two horizontal panels according to surface roughness: Ra ≤ 0.8 μm and Ra = 2.1 μm. Deposition patterns for mirror finish, Ra 0.3 μm, and Ra 0.8 μm were observed to be similar. At 1000 s−1, there was uniform intensity across the frame that increased over time. At 2000 s−1, after an initial period of individual platelet adhesion, small and mostly stable aggregates were observed with fibrous structures up to about 1 mm in length. At 5500 s−1, we observed the formation and embolization of larger platelet aggregates beginning within 100 seconds of the perfusion duration. Fibrous mesh-like structures formed and enabled the entrapment of platelets and upstream embolized aggregates.
Figure 5:

Representative time traces of platelet adhesion on Ti6Al4V surfaces at shear rates of 1000 s−1, 2000 s−1 and 5500 s−1 (row-wise) at roughness levels of Ra ≤ 0.8 μm and Ra = 2.1 μm (column-wise). Flow direction in micro-channels is from left to right and scale bars are 200 μm.
The patterns on the 2.1 μm-Ra surface varied significantly from those of sub-micron and mirror roughness levels. Deposition of platelets in the crevices or troughs of the surface were clearly visible. In contrast to aggregate formation observed at Ra ≤ 0.8 μm, the aggregates on the Ra = 2.1 μm surface were unstable at all shear rates. At 1000 and 2000 s−1, aggregates formed or entered the field of view generally in the latter half of the perfusion time. At 5500 s−1, aggregates formed early in the perfusion period and embolized similarly to sub-micron roughness levels.
• Mean fluorescence intensity
Figure 6 shows the mean fluorescence intensity (MFI) evolution of adherent platelets and aggregates across each 15-minute perfusion on a scale of zero to one. At a shear rate of 1000 s−1, the intensity increased monotonically to about 0.1 at all roughness levels. The MFI throughout the duration were comparable on the mirror-finished, 0.3 μm and 0.8 μm surfaces, but were consistently greater on the 2.1-μm-Ra surface compared to sub-micron and mirror finishes. At 2000 s−1 and 5500 s−1, MFI increased by up to four times that of 1000 s−1. At 2000 s−1, during the first 200 seconds the rate of intensity increase was greatest on the Ra 2.1 μm surface, followed by Ra 0.3 μm and lowest on the Ra 0.8 μm and mirror-finished surfaces, which were both comparable in magnitude to each other. For the remainder of the perfusion duration, platelets on surfaces with Ra 2.1 μm and Ra 0.3 μm had comparable magnitudes to each other. At 5500 s−1, the rates of intensity increase were greater on the Ra 2.1 and 0.8 μm surfaces than those on the Ra 0.3 μm and mirror-finished surfaces. We observed fluctuations in mean intensity on all of the roughened surfaces at 5500 s−1, contrary to lower shear rates.
Figure 6:

Mean fluorescence intensities of adherent platelets at (a) 1000 s−1, (b) 2000 s−1 and (c) 5500 s−1 on all indicated roughened surfaces
• Mean aggregate area
At 2000 s−1, on all four test surfaces, the mean aggregate area increased over time (figure 7a). On the mirror-finished and Ra 0.8 μm surfaces, the increases were monotonic and comparable in magnitude to each other. In the Ra 2.1 μm case however, mean aggregate area followed a similar trend as the 0.3 and 0.8 μm cases up to about 800 seconds, after which the values began to fluctuate as denoted by the larger error bars. We found that the mean aggregate area of the Ra 0.3 μm sample was significantly greater than that of the other roughness levels starting around 600 seconds and plateaued at approximately 700 seconds.
Figure 7:

Mean aggregate areas of adherent platelet aggregates at (a) 2000 s−1 and (b) 5500 s−1.
At 5500 s−1, overall we observed that mean aggregate area increased with roughness level up to an Ra of 0.8 μm (figure 7b). The mean aggregate area on the Ra 0.8 μm surface increased at the greatest rate up to about 4000 μm2 with some fluctuation in comparison to the other surfaces. After about 700 seconds, the mean aggregate area at this roughness dropped to about 3000 μm2. On the Ra 0.3 μm surface, after 400 seconds the mean aggregate area at each time point fluctuated around 1000 μm2. The mean aggregate area on the Ra 2.1 μm surface was similar in magnitude to that on the 0.3 μm Ra surface, as well as the 2.1 μm values at 2000 s−1. On the mirror-finished surface, the mean area was significantly lower than on roughened surfaces from approximately 500 to 700 seconds, after which it was comparable in magnitude to aggregates on the 0.3 μm surface.
• Aggregate count
At 2000 s−1, on all surfaces, we observed an initial increase in the number of aggregates, followed by a plateau or lower rate of increase for the remainder of the perfusion time (figure 8a). On the mirror-finished surface, the mean number of aggregates across trials increased up to about 400 seconds, after which it plateaued around 150 aggregates per frame. Aggregates on the Ra 0.3 μm surface followed similar trends as the mirror-finished surface, with a decline in number during the last 200 seconds. When Ra was 0.8 and 2.1 μm respectively, the initial slopes were similar to each other up to about 500 seconds. During the remainder of the perfusion time, both plateaued at around 100 aggregates per frame. We must note that the values on Ra 0.3, 0.8 and 2.1 μm surfaces are encompassed within the error bars of the mirror-finished surface, which showed the most variability across the trials. From about 300–600 seconds, the number of aggregates on the Ra 0.3 μm surface was significantly greater than those of the 0.8-μm-Ra and 2.1-μm-Ra surfaces respectively.
Figure 8:

Number of adherent platelet aggregates at (a) 2000 s−1 and (b) 5500 s−1.
At 5500 s−1, on all surfaces up to an Ra of 0.8 μm had few adherent aggregates compared to values at 2000 s−1 at the same roughness magnitudes (figure 8b). Similar to 2000 s−1, we observed an initial increase in the number of aggregates followed by a plateau for the remainder of the perfusion time, although the initial increase duration was lower than that of the 2000 s−1 on the mirror-finished and Ra 0.8 μm surfaces. On the mirror-finished surface the number of aggregates increased for about 250 seconds and then plateaued at about 100 aggregates per frame on average. Up to about 200 seconds, the mean number of aggregates on the Ra 0.3 and 0.8 μm surfaces exhibited the same increasing trend as each other. The number of aggregates on the Ra 0.8 μm surface then increased at a greater rate than the 0.3 μm surface and proceeded to plateau at 50 aggregates within the region of interest at around 300 seconds. The number of aggregates for the 0.3-μm-Ra surface increased for about 600 seconds after which it plateaued at around 100 aggregates per frame, comparable to the mirror finished surface. The magnitudes and trend on the 2.1-μm-Ra surface were similar to each other at both shear rates.
Overall, from figures 7 and 8, we note that there are no trends among roughness level, mean aggregate area and number of aggregates respectively. However, we did observe that under all the conditions, the trend in number of aggregates consistently displayed an initial period of increase followed by a plateau. During the plateau period, the mean aggregate area continued to increase, suggesting that platelet aggregates were growing but not increasing in number.
Discussion
The goal of this work was to determine how sub-micron and microscale roughness features on Ti6Al4V surface impact shear-induced thrombosis, including platelet adhesion, aggregate formation, and embolization. Our results collectively present new information on various platelet and aggregate properties in the context of varying surface topographies and shear regimes. This study demonstrates how individual platelet and thrombus patterns distinctly vary on surfaces with different topographical features, specifically when surface Ra values vary from the sub-micron to micron range.
The functional link between roughness and thrombogenicity varies in the literature; these variations often appear as disagreements but could be a result of inconsistent and non-exhaustive reporting of roughness. Past studies have quantified surface topographies in terms of mean surface height characteristics such as Ra and centerline average (CLA) (8,10,12,19,24), which on its own can be lacking, or contact angle (16–18,25,26). As determined by (20), contact angle measurements on roughened surfaces do not necessarily reflect the interfacial energy of the surface, but rather are influenced by the topography itself and therefore need to be corrected using a ratio between the rough and smooth versions of the same material. Whether these approaches are uniformly used is unclear in several studies. In some cases in which periodic topographical structures were fabricated, roughness was described simply by the dimensions of features (9,11,14,15,27). This variation makes it difficult to assess the control of roughness amplitude and periodicity throughout.
In this study, expressing roughness characteristics as the magnitude of the DFT across various frequencies (figure 3) illustrates that the surface processing techniques created broadband roughness whose amplitude we could control and whose spectrum did not significantly vary. Even though the roughness spectra we generated were approximately the same for different Ra values, some variation can be observed; for example, the DFT magnitudes on surfaces with Ra values of 0.3 and 0.8 μm were almost equal at frequencies above 2 rad/μm. Although simpler surface parameters e.g., Ra and CLA are often used in practice to report surface properties, the observations we observed encourage the use of full profiles and roughness spectra when reporting roughness for these biomaterial studies (28).
In the presence of submicron features, the qualitative platelet adhesion patterns were complementary to findings in previous studies; low shear leads to uniform deposition and high shear leads to aggregation and fibril formation. At 1000 s−1, on all surfaces up to an Ra of 0.8 μm, we observed the formation of uniform layers of platelets that covered most of the surface (figure 5). This is consistent with the fact that at this shear range, fibrinogen adsorbs onto the surface and can stably engage platelets via the GPIIb/IIIa receptor (29). The lack of aggregate formation and embolization could be attributed to the low likelihood of strong vWF engagement at 1000 s−1 (30). At 2000 s−1 we observed a pattern of stable aggregates in random locations, with growth occurring in the distal region of the initial site of nucleation. Similar stable discoid aggregates were found by Nesbitt et al. in their in vivo mouse studies, downstream of an injury site at a shear rate of 1800 s−1 (31). They also found that these aggregates held tightly-packed platelets, consistent with our observation that mean fluorescence intensity increased over time in figure 6. At a shear rate of 5500 s−1, we observed fibrous structures connecting spherical aggregates, as shown in figure 5. This corroborates previous findings that pathological shear rates cause the formation of vWF fiber bundles that are greater than 20 μm in width (32). As neither fibrin nor vWF are fluorescently labeled in our experiments the fluorescent fibril structure is presumed due to vWF-bound platelets lining the elongated protein multimers (33).
In addition to the observed aggregation patterns, the embolization patterns at high shear are corroborated by prior work that describes it as a result of thrombus structure, permeability and hydrodynamic forces. Our observations of aggregates embolizing both into and out of the field of view at 5500 s−1 supported similar findings by Colace and Diamond of vWF and platelet-rich rolling fibrous aggregates (32). During our perfusions, fibrous structures often presented as web- or mesh-like bodies that entrapped non-adherent platelets or small aggregates. In these cases, the addition of cellular mass ruptured the mesh and released emboli. This aligns with the findings of Zheng et al. finding of vWF complex meshes that bind cells and obstruct flow in engineered microvessels (34).
Alternatively, work done by Xu et al shows that embolization occurs in a shear-dependent manner with a dependence on clot permeability (35). It has been well-established that thrombi have core and shell structures, the latter of which are more permeable than the former. Xu et al. found that at a minimum shear rate of 2000 s−1, hydrodynamic forces cause the shell to deform and translocate downstream, thereby creating elongated “filament-like” structures while the core remained stable (35). Although higher shear rates were not investigated in that work, they may similarly cause core translocation. The lengthy fibrous structures we observed in figure 5 at 5500 s−1 and at all three shear rates on the Ra 2.1 μm surface are consistent with tethered thrombus cores with deformed and elongated shell structures.
The present study builds on previous observations by identifying the differences among platelet adhesion patterns over a range of surface roughnesses and shear rates on titanium alloy surfaces. On the surfaces we studied, microscale surface features yielded distinctly different platelet adhesion patterns from sub-micron roughened surfaces. Specifically, we observed that at all shear rates, there were vertical “striped” platelet-rich regions parallel to the direction of lay (figure 5). Unlike the sub-micron and mirror-finished surfaces, the surface with an Ra of 2.1 μm contained features that were a few microns in height (figure 2a). These features may have created “pockets” that trapped platelets. Another key observation was the formation of platelet aggregates at 1000 s−1 unlike at lower roughness levels. This could be attributed to increased shear gradients close to the roughened surfaces driving thrombosis. Nesbitt et al. and Receveur et al. have both reported that shear gradients as opposed to constant shear rates promote thrombogenesis by activating platelets in the high shear region and having increased protein adsorption to support platelet aggregation in the subsequent low shear region (31,36). Another potential contributor is residence-time-induced platelet activation. Gester et al. found that increased space between micro-structures resulted in a longer contact time with greater surface area, which would increase platelet activation and ultimately, thrombus formation (37). The occurrence of a similar phenomenon on our roughened surface may have caused the activation and subsequent aggregation of platelets with an input shear rate of 1000 s−1.
By quantifying mean fluorescence intensity (MFI) of adherent platelets as a function of time, shear rate and surface roughness level, we elucidated three-dimensional aggregate growth trends. At 2000 and 5500 s−1, densely packed aggregates form and grow in height as seen through large, rapidly increasing MFI. In contrast, at 1000 s−1, platelet aggregates show minimal growth normal to the surface, as seen through low, slowly increasing MFI (38). Further, when growth normal to the surface is present (i.e., at the 2000/5500 s−1strain rates), the rate of MFI increase is highest at maximum roughness and lowest at mirror finish.
The mean area and number of aggregates illustrate the two-dimensional, mural patterns of aggregate nucleation and growth. As seen in figure 7, trends at all roughness levels and both shear rates showed an initial increase in number followed by a plateau. The increase is indicative of the nucleation of new aggregates, while the plateau indicates a growth period, as supported by the increase in mean area during this period (figure 8). The consistency with which these trends occurred at all roughness levels may suggest that surface features do not impact the likelihood and characteristics of aggregate nucleation and growth, but rather these could be impacted by shear rate. Similarly, our method of surface roughening modified the surface in the direction normal to flow, which corroborates the significant effects on MFI.
The key implication of these findings is to highlight the critical difference in platelet adhesion patterns between sub-micron and micro-scale Ra values and surface features. Micro-scale features can incite thrombosis even at low, physiological, shear rates. This is important to note in the context of VAD manufacturing because polishing surfaces is an expensive and time-consuming process. More specifically, the time required to polish surfaces with sub-micron Ra values is exponentially longer as Ra decreases (39). In addition, our literature review of past studies and DFT analysis highlight the importance of using more standardized and informative descriptions of surface topography when referring to cell adhesion and blood biocompatibility.
The main strength of this study was that our microfluidic system emulated various shear and surface conditions experienced by platelets in VADs which we measured temporally with fluorescence microscopy. In addition, we reported on a range of platelet adhesion properties that determined the nature of aggregate formation on Ti6Al4V surfaces in the context of roughness.
There were some limitations to the study design, which could be addressed in future work. In this work we visualized only platelets as they are the key cellular component in thrombosis and best represent the structural properties of thrombi; however, visualizing protein-surface interactions that drive platelet adhesion may elucidate mechanisms upstream of platelet adhesion. Additionally, we applied shear rates based on known optimal conditions for plasma protein activity; however, VAD shear rates far exceed these and induce hemolysis, thereby releasing prothrombotic agonist adenosine diphosphate (ADP) (40).
Findings from this study motivate further investigations of other roughened materials, the role of biochemical agonists such as ADP to represent hemolytic conditions, and in vivo tests with similar roughness scales to this study with increased focus on emboli.
Conclusion
This microfluidic study elucidated the effects of Ti6Al4V surface roughness on shear-induced thrombus formation and stability. There was a marked difference between sub-micron and micron scaled roughness with respect to deposition patterns, aggregate size, aggregate number, and embolization.
Acknowledgments:
This work was supported by the National Institute of Health/National Heart, Lung and Blood Institute, NIH R01 HL089456 and NIH R01 HL086918. This work was performed in part at the Cornell NanoScale Science and Technology Facility (CNF), a member of the National Nanotechnology Coordinated Infrastructure NNCI), which is supported by the National Science Foundation (Grant NNCI-2025233). This work made use of the Cornell Center for Materials Research Shared Facilities which are supported through the NSF MRSEC program (DMR-1719875).
References
- 1.Chiu WC, Slepian MJ, Bluestein D. Thrombus formation patterns in the HeartMate II ventricular assist device: clinical observations can be predicted by numerical simulations. ASAIO J [Internet]. 2014. Mar 1 [cited 2022 Jan 22];60(2):237–40. Available from: https://europepmc.org/articles/PMC3992262 [DOI] [PMC free article] [PubMed] [Google Scholar]
- 2.Glass CH, Christakis A, Fishbein GA, Watkins JC, Strickland KC, Mitchell RN, et al. Thrombus on the inflow cannula of the HeartWare HVAD: an update ☆. 2018. [cited 2022 Jan 22]; Available from: 10.1016/j.carpath.2018.09.002 [DOI] [PubMed]
- 3.Xu LC, Bauer JW, Siedlecki CA. Proteins, platelets, and blood coagulation at biomaterial interfaces. Colloids Surf B Biointerfaces [Internet]. 2014. [cited 2021 Nov 20];124:49–68. Available from: 10.1016/j.colsurfb.2014.09.040 [DOI] [PMC free article] [PubMed] [Google Scholar]
- 4.Chernysh IN, Nagaswami C, Kosolapova S, Peshkova AD, Cuker A, Cines DB, et al. The distinctive structure and composition of arterial and venous thrombi and pulmonary emboli. Scientific Reports 2020. 10:1 [Internet]. 2020 Mar 20 [cited 2022 Aug 11];10(1):1–12. Available from: https://www.nature.com/articles/s41598-020-59526-x [DOI] [PMC free article] [PubMed] [Google Scholar]
- 5.Casa LDC, Deaton DH, Ku DN. Role of high shear rate in thrombosis. J Vasc Surg [Internet]. 2015. Apr 1 [cited 2022 Oct 5];61(4):1068–80. Available from: https://www.sciencedirect.com/science/article/pii/S0741521415000221?via%3Dihub [DOI] [PubMed] [Google Scholar]
- 6.Lin Bs J, Sorrells Bs MG, Lam WA, Neeves Phd KB, Wolberg A. Physical forces regulating hemostasis and thrombosis: Vessels, cells, and molecules in illustrated review. Res Pract Thromb Haemost [Internet]. 2021. [cited 2022 Jan 28];5. Available from: 10.1002/rth2.12548 [DOI] [PMC free article] [PubMed]
- 7.Chen H, Fallah MA, Huck V, Angerer JI, Reininger AJ, Schneider SW, et al. Blood-clotting-inspired reversible polymer–colloid composite assembly in flow. Nature Communications 2012. 4:1 [Internet]. 2013 Jan 8 [cited 2021 Nov 21];4(1):1–7. Available from: https://www.nature.com/articles/ncomms2326 [DOI] [PubMed] [Google Scholar]
- 8.Hecker JF, Edwards R 0. Effects of roughness on the thrombogenicity of a plastic [Internet]. 1981. [cited 2022 Oct 5]. Available from: https://pubmed.ncbi.nlm.nih.gov/7348699/ [DOI] [PubMed]
- 9.Clauser J, Gester K, Roggenkamp J, Mager I, Maas J, Jansen S, et al. Micro-structuring of polycarbonate-urethane surfaces in order to reduce platelet activation and adhesion. J Biomater Sci Polym Ed [Internet]. 2014. Mar 24 [cited 2021 Sep 30];25(5):504–18. Available from: https://pubmed.ncbi.nlm.nih.gov/24484511/ [DOI] [PubMed] [Google Scholar]
- 10.Linneweber J, Dohmen PM, Kerzscher U, Affeld K, Nosé Y, Konertz W. The effect of surface roughness on activation of the coagulation system and platelet adhesion in rotary blood pumps. Artif Organs. 2007. May;31(5):345–51. [DOI] [PubMed] [Google Scholar]
- 11.Fujisawa N, Poole-Warren L, Woodard J, Bertram C, Schindhelm K. A novel textured surface for blood-contact. Biomaterials [Internet]. 1999. May [cited 2021 Sep 30];20(10):955–62. Available from: https://pubmed.ncbi.nlm.nih.gov/10353649/ [DOI] [PubMed] [Google Scholar]
- 12.Schuster JM, Vera ML, Laczeski ME, Rosenberger MR, Schvezov CE. Adhesion of blood platelets in TiO2 coatings. TMS 2015 144th Annual Meeting & Exhibition [Internet]. 2015 [cited 2021 Oct 3];653–60. Available from: https://link.springer.com/chapter/10.1007/978-3-319-48127-2_80 [Google Scholar]
- 13.Zingg W, Neumann AW, Strong AB, Hum OS, Absolom DR. Platelet adhesion to smooth and rough hydrophobia and hydrophilic surfaces under conditions of static exposure and laminar flow. Biomaterials. 1981. Jul 1;2(3):156–8. [DOI] [PubMed] [Google Scholar]
- 14.Koh LB, Rodriguez I, Venkatraman SS. The effect of topography of polymer surfaces on platelet adhesion. Biomaterials. 2010. Mar 1;31(7):1533–45. [DOI] [PubMed] [Google Scholar]
- 15.Milner KR, Snyder AJ, Siedlecki CA. Sub-micron texturing for reducing platelet adhesion to polyurethane biomaterials. 2005; Available from: www.interscience.wiley.com [DOI] [PubMed]
- 16.Sun T, Tan H, Han D, Fu Q, Jiang L, Sun T, et al. Biocompatible polymers No Platelet Can Adhere-Largely Improved Blood Compatibility on Nanostructured Superhydrophobic Surfaces. small [Internet]. 2005;1(10):959–63. Available from: www.small-journal.com [DOI] [PubMed] [Google Scholar]
- 17.Zhou M, Yang J, Ye X, Zheng A, Li G, Yang P, et al. Blood Platelet’s Behavior on Nanostructured Superhydrophobic Surface. 2008. [cited 2021 Oct 5]; Available from: www.scientific.net/JNanoR.2.129
- 18.Pham TT, Wiedemeier S, Maenz S, Gastrock G, Settmacher U, Jandt KD, et al. Hemodynamic aspects of reduced platelet adhesion on bioinspired microstructured surfaces. Colloids Surf B Biointerfaces. 2016. Sep 1;145:502–9. [DOI] [PubMed] [Google Scholar]
- 19.Hasebe T, Ishimaru T, Kamijo A, Yoshimoto Y, Yoshimura T, Yohena S, et al. Effects of surface roughness on anti-thrombogenicity of diamond-like carbon films. Diam Relat Mater. 2007. Apr 1;16(4–7 SPEC. ISS.):1343–8. [Google Scholar]
- 20.Wenzel RN, Schwartz AM, Perry JW. NEW BOOKS Surface Active Agents. 1949;
- 21.Meiron TS, Marmur A, Saguy IS. Contact angle measurement on rough surfaces. J Colloid Interface Sci. 2004. Jun 15;274(2):637–44. [DOI] [PubMed] [Google Scholar]
- 22.Jamiolkowski MA, Pedersen DD, Wu WT, Antaki JF, Wagner WR. Visualization and analysis of biomaterial-centered thrombus formation within a defined crevice under flow. Biomaterials. 2016. Jul 1;96:72–83. [DOI] [PMC free article] [PubMed] [Google Scholar]
- 23.Otsu N A Threshold Selection Method from Gray-Level Histograms. IEEE Trans Syst Man Cybern. 1979;9(1):62–6. [Google Scholar]
- 24.Chepurov AK, Mertsalova NN, Dubovich TI, Ifashkin G v., Chekanova VD Effect of roughness of polymer surfaces on thrombus formation. Biomedical Engineering 1978. 11:6 [Internet]. 1977 Nov 1 [cited 2021 Oct 3];11(6):312–5. Available from: https://link.springer.com/article/10.1007/BF00556592 [Google Scholar]
- 25.Ye X, liang Shao Y, Zhou M, Li J, Cai L. Research on micro-structure and hemo-compatibility of the artificial heart valve surface. Appl Surf Sci. 2009. Apr 15;255(13–14):6686–90. [Google Scholar]
- 26.Ye X, Wang Z, Zhang X, Zhou M, Cai L. Hemocompatibility research on the micro-structure surface of a bionic heart valve. 2014; [DOI] [PubMed]
- 27.Minelli C, Kikuta A, Yamamoto A. Blood interaction with nano-topography. Proceedings of the 2006 International Conference on Nanoscience and Nanotechnology, ICONN. 2006;263–6. [Google Scholar]
- 28.Richard Youngworth BN, Gallagher BB, Stamper BL, Youngworth RN. An overview of power spectral density (PSD) calculations. 10.1117/12618478 [Internet]. 2005. Aug 18 [cited 2022 May 11];5869:206–16. Available from: https://www.spiedigitallibrary.org/conference-proceedings-of-spie/5869/58690U/An-overview-of-power-spectral-density-PSD-calculations/10.1117/12.618478.full [DOI] [Google Scholar]
- 29.Poddar MK, Banerjee S. Molecular Aspects of Pathophysiology of Platelet Receptors. Platelets [Internet]. 2020. Jul 22 [cited 2022 May 9]; Available from: https://www.intechopen.com/chapters/72872
- 30.Zlobina KE, Guria GT. Platelet activation risk index as a prognostic thrombosis indicator. Scientific Reports 2016. 6:1 [Internet]. 2016 Jul 27 [cited 2022 May 9];6(1):1–6. Available from: https://www.nature.com/articles/srep30508 [DOI] [PMC free article] [PubMed] [Google Scholar]
- 31.Nesbitt WS, Westein E, Tovar-Lopez FJ, Tolouei E, Mitchell A, Fu J, et al. A shear gradient–dependent platelet aggregation mechanism drives thrombus formation. Nature Medicine 2009 15:6 [Internet]. 2009. May 24 [cited 2022 Apr 27];15(6):665–73. Available from: https://www.nature.com/articles/nm.1955 [DOI] [PubMed] [Google Scholar]
- 32.Colace T v., Diamond SL Direct observation of von Willebrand factor elongation and fiber formation on collagen during acute whole blood exposure to pathological flow. Arterioscler Thromb Vasc Biol [Internet]. 2013. Jan [cited 2022 Apr 27];33(1):105–13. Available from: https://pubmed.ncbi.nlm.nih.gov/23104847/ [DOI] [PMC free article] [PubMed] [Google Scholar]
- 33.de Ceunynck K, de Meyer SF, Vanhoorelbeke K. Unwinding the von Willebrand factor strings puzzle A nor-mal functional role of VWF strings in healthy persons or in other disease pa-thologies remains unclear. In this review, we discuss some of the puzzling charac-teristics of VWF strings, and we debate whether the properties of VWF strings in the absence of ADAMTS13 might be rel-evant for understanding (patho)physi-ologic mechanisms. (Blood. 2013;121(2): 270–277). 2013 [cited 2022 Apr 27]; Available from: http://ashpublications.org/blood/article-pdf/121/2/270/1363933/zh800213000270.pdf [DOI] [PubMed] [Google Scholar]
- 34.Zheng Y, Chen J, López JA. Flow-driven assembly of VWF fibres and webs in in vitro microvessels. Nature Communications 2015. 6:1 [Internet]. 2015 Jul 30 [cited 2022 Apr 27];6(1):1–11. Available from: https://www.nature.com/articles/ncomms8858 [DOI] [PMC free article] [PubMed] [Google Scholar]
- 35.Weisel JW, Alber M, Xu S, Xu Z, Kim O v, Litvinov RI. Model predictions of deformation, embolization and permeability of partially obstructive blood clots under variable shear flow. [DOI] [PMC free article] [PubMed]
- 36.Receveur N, Nechipurenko D, Knapp Y, Yakusheva A, Maurer E, Denis C v., et al. Shear rate gradients promote a bi-phasic thrombus formation on weak adhesive proteins, such as fibrinogen in a von Willebrand factor-dependent manner. Haematologica [Internet]. 2020. Oct 1 [cited 2022 May 12];105(10):2471. [DOI] [PMC free article] [PubMed] [Google Scholar]
- 37.Gester K, Birtel S, Clauser J, Steinseifer U, Sonntag SJ. Real-Time Visualization of Platelet Interaction With Micro Structured Surfaces. Artif Organs. 2016. Feb 1;40(2):201–7. [DOI] [PubMed] [Google Scholar]
- 38.Tolouei E, Butler CJ, Fouras A, Ryan K, Sheard GJ, Carberry J. Effect of hemodynamic forces on platelet aggregation geometry. Ann Biomed Eng [Internet]. 2011. May 4 [cited 2022 Jun 19];39(5):1403–13. Available from: https://link.springer.com/article/10.1007/s10439-010-0239-4 [DOI] [PubMed] [Google Scholar]
- 39.Colvin FH, Stanley FA. American Machinist Grinding Book: Modern Machines and Appliances, Methods and Results [Internet]. Creative Media Partners, LLC; 2018. Available from: https://books.google.com/books?id=1eiYvgEACAAJ [Google Scholar]
- 40.Koliopoulou A, McKellar SH, Rondina M, Selzman CH. Bleeding and thrombosis in chronic VAD therapy: focus on platelets. Curr Opin Cardiol [Internet]. 2016. [cited 2022 Jun 16];31(3):299. [DOI] [PMC free article] [PubMed] [Google Scholar]