

Abstract
Background:
Some phthalates are still widely used in food packaging, toys, and personal care products, and links to adverse health have motivated substitution with replacement chemicals. Few studies have examined patterns and predictors of phthalate replacement biomarkers in children.
Objective:
To examine associations of sociodemographic, dietary, and urine collection characteristics with urinary concentrations of biomarkers of select phthalates and their replacements in mid-childhood.
Methods:
We studied 830 children ages 6–10 years in 2007–2010 in a Boston-area cohort. We quantified urinary metabolites and summed their concentrations to calculate biomarkers of the concentrations of ten parent phthalates/replacements. We used linear regression to examine mutually adjusted associations of each predictor with each phthalate biomarker. We used logistic regression to examine predictors of 1,2-cyclohexane dicarboxylic acid, diisononyl ester (DINCH) biomarker detectability.
Results:
Predictor characteristics explained 25%−48% of urinary biomarker variability. Di-2-ethylhexyl terephthalate (DEHTP) biomarker was higher in females (18.7% [95% CI: 0.7, 39.9]), children who consumed more meat and dairy, and samples collected from later years. DINCH biomarker was more detectable in females (odds ratio [OR] 2.1 [95% CI: 1.5, 3.0]) and samples from later years.
Significance:
Populations of children with increased urinary concentrations of phthalate and replacement biomarkers can be targeted for future study of sources of exposure, and identifying dietary predictors of biomarkers will directly guide future interventions.
Impact Statement:
Our study uses data from a large cohort that is one of the first to measure DINCH, DEHTP, and metabolites of di-isononyl phthalate and di-isodecyl phthalate. Additionally, we evaluate predictors during mid-childhood when biomarkers might be highest. As the use of replacement phthalates increases, our study is one of the first to examine biomarker patterns and predictors among children.
Keywords: phthalates, children’s environmental health, endocrine disrupting chemicals
Introduction
Phthalates are synthetic chemicals used in a variety of consumer products, resulting in ubiquitous exposure across the lifespan. High molecular weight (HMW) phthalates, such as di-2-ethylhexyl phthalate (DEHP), have been used in polyvinyl chloride plastic applications, food packaging, and children’s toys. Low molecular weight (LMW) phthalates, such as diethyl phthalate (DEP), can be found in personal care products such as fragrances, lotions, and shampoo. As compared to adults, children have higher concentrations of almost all phthalate metabolites in their urine, the recommended body fluid for exposure monitoring.[1, 2] Growing evidence has demonstrated associations of higher urinary phthalate concentrations with adverse health outcomes in children.[3, 4] Identifying predictors of higher phthalate biomarker concentrations in children is important to target at risk groups and develop interventions to minimize exposures. Both commonly studied phthalates and those, far less studied, that have replaced them are of interest in this manuscript as they both may affect the health of children in this cohort.
Previous studies on predictors of phthalate biomarker concentrations in children have been limited by generally small sample sizes, a lack of ability to mutually adjust for multiple predictors (e.g., sociodemographic, diet, timing of urine collection characteristics), and limited consideration of emerging phthalate replacement chemicals. Furthermore, prior studies have often identified predictors of exposure to single phthalates rather than their mixture, but individuals are rarely exposed to single chemicals, and thus evaluating mixtures is key to a real-world setting. The primary objective of the present study was to extend the prior literature by examining associations of sociodemographic, dietary, and urine collection characteristics with 10 of the most prevalent phthalates/phthalate replacement biomarkers, individually and as a mixture, in a large cohort of children during mid-childhood.
Methods
Study population and design
Between 1999 and 2002, we recruited pregnant women to the longitudinal pre-birth cohort study Project Viva during their first prenatal visit to Atrius Harvard Vanguard Medical Associates, a multispecialty group practice in eastern Massachusetts.[5] Of 2,128 live singleton births, 1,116 children attended the mid-childhood visit between ages 6 and 10 years (mean, 7.8 years); 830 had phthalate and cyclohexane dicarboxylic acid, diisononyl ester (DINCH) metabolite concentrations quantified in urine in mid-childhood and were included in the present analysis. Those who were included in this analysis were less likely to be white/non-Hispanic or have an annual household income >$70,000 compared to children who attended the mid-childhood visit and did not have phthalates measured (Supplemental Table 1).
The institutional review boards of participating institutions approved Project Viva’s research protocol. Mothers provided written informed consent for their child’s participation. The involvement of the Centers for Disease Control and Prevention (CDC) laboratory did not constitute engagement in human subjects’ research.
Quantification of phthalate and DINCH metabolite concentrations
We collected a random spot urine sample from each participant in mid-childhood in 2007–2010. Samples were stored at −20 °C, then in 2020 were shipped frozen overnight to the National Center for Environmental Health at the CDC for analysis, where 17 phthalate metabolites corresponding to 10 parent compounds (9 phthalates and the replacement chemical DINCH) were quantified using online solid-phase extraction high-performance liquid chromatography-isotope dilution mass spectrometry as detailed.[6–8] Previous data suggest that phthalate metabolites remain stable after long-term storage (i.e., years) of urine at subfreezing temperatures.[9] For metabolite concentrations below the limit of detection (LOD) (Supplemental Table 2), we used the instrument reading values, which ranged from zero to the LOD to calculate biomarkers of the concentrations of the 10 parent compounds by summing the molar concentrations of their respective metabolites. However, some metabolites (e.g., mono-2-ethylhexyl phthalate (MEHP) and mono-n-butyl phthalate (MBP)) can be formed in the environment. Also, some metabolites are the breakdown products of more than one parent compound. Thus, we attributed the metabolite to the parent from which is it mostly derived as has been done previously[10] and refer to our calculated concentrations as biomarkers of the concentrations of the parent compounds. See Supplemental Table 2 for parent-metabolite groupings.
We decided a priori to include in our primary analyses any parent compound that had at least one metabolite with detectable concentrations in >60% of participants. The following 9 parent compounds met this threshold: DEP, di-n-butyl phthalate (DBP), di-iso-butyl phthalate (DiBP), butylbenzyl phthalate (BBzP), DEHP, di-n-octyl phthalate (DnOP), di-isononyl phthalate (DiNP), di-isodecyl phthalate (DiDP), and di-2-ethylhexyl terephthalate (DEHTP). We replaced concentrations of parent compound biomarkers equal to zero with the lowest instrument reading concentration, and we natural log-transformed biomarkers in our analyses due to skewed distributions. We dichotomized the biomarker of DINCH, whose two metabolites were detectable in <60% of samples, as detectable and non-detectable.
Potential predictors of phthalate and DINCH biomarker urinary concentrations
At enrollment in early pregnancy, we obtained information on maternal race/ethnicity and level of education. Mothers reported the child’s race/ethnicity at the early childhood research visit and the family’s annual income at the mid-childhood visit.
In mid-childhood, parents reported their child’s weekly dietary intake in 5 categories of 16 foods and food groups on a PrimeScreen questionnaire (a validated questionnaire).[11] We condensed some of the foods/food groups as follows: “citrus” and “other fruit” as “fruits”; “broccoli,” “carrots,” “lettuce,” and “other vegetables” as “vegetables”; “beef, pork, or lamb” and “processed meats” as “meat”; and “pasta” and “whole grains” as “pasta/whole grains.” We thus ultimately derived 10 food/food group categories from the PrimeScreen (Table 1). Parents also reported their child’s weekly consumption of fast food and restaurant food in 5 categories. We converted categorical responses for all dietary variables to servings per day by calculating numeric means corresponding to each category (e.g., 2–4 times/week was coded as 3 times/week or 0.43 servings/day). We dichotomized intake of each dietary variable into daily or greater versus less than daily because phthalates and DINCH have a relatively short (12–24 hour) biological half-life,[12] and we anticipated that we would be most likely to detect associations of food intake with biomarker concentrations for foods that children ate daily or greater. For fish, fried food, fast food, and restaurant food, which only a small proportion (<5%) of participants consumed daily or greater, we dichotomized intake as greater than weekly versus weekly or less.
Table 1.
Sociodemographic, dietary, and urine collection characteristics of Project Viva participants who had urinary phthalate and DINCH metabolite concentrations measured in mid-childhood.
| Overall (n = 830) | |
|---|---|
| Sociodemographic characteristics | Mean (SD) or n (%) |
| Age | 7.8 (0.8) |
| Female | 415 (50%) |
| Race/ethnicity | |
| Asian | 24 (2.9%) |
| Black | 153 (18%) |
| Hispanic | 41 (5%) |
| Other | 107 (13%) |
| White | 503 (61%) |
| Maternal education | |
| Less than college | 276 (33%) |
| > College Degree | 549 (67%) |
| Annual household income during mid-childhood | |
| ≤ $40,000 | 105 (13%) |
| $40,000 - $70,000 | 120 (15%) |
| > $70,000 | 560 (71%) |
| Dietary characteristics | |
| Daily or greater intake of: | |
| Veggies | 489 (61%) |
| Fruit | 495 (62%) |
| Baked goods | 95 (12%) |
| Eggs | 62 (8%) |
| Meat | 89 (11%) |
| Pasta/whole grains | 434 (54%) |
| Whole fat dairy | 342 (43%) |
| Low fat dairy | 528 (66%) |
| Greater than once per week intake of: | |
| Fish | 130 (16%) |
| Fried food | 107 (13%) |
| Fast food | 57 (7%) |
| Restaurant food | 46 (6%) |
| Urine collection characteristics | |
| Fasting time (hours) | 7.6 (6.1) |
| Time of urine collection | |
| Morning (6:00 am - 11:00 am) | 574 (70%) |
| Midday (11:00 am - 4:00 pm) | 212 (26%) |
| Evening (4:00 pm - 8:00 pm) | 38 (5%) |
| Year of urine collection | |
| 2007 | 78 (9%) |
| 2008 | 307 (37%) |
| 2009 | 293 (35%) |
| 2010 | 151 (18%) |
Abbreviation: SD, standard deviation
We obtained data on the urine sample analyzed for phthalate and DINCH metabolite concentrations, including duration of fast and time of day, which we categorized into morning (6:00 am to 10:59 am), midday (11:00 am to 3:59 pm), and afternoon (4:00 pm to 8:00 pm). We used a hand-held refractometer (ATAGO 4410) to measure specific gravity at room temperature.
Statistical analyses
We examined the distributions and Spearman correlations of the biomarkers of the parent compound concentrations in Project Viva. We compared the geometric mean and 25th, 50th, and 75th percentiles of the metabolite concentrations in Project Viva to those from the National Health and Nutrition Examination Survey (NHANES), a nationally representative survey of the U.S. population. To facilitate a direct comparison with the children in Project Viva, we combined the 2007–2008 and 2009–2010 NHANES survey cycles among children ages 7–10 years.[13]
In our primary analysis, we identified predictors of parent compounds rather than their metabolites because children are most likely exposed directly to the parent compound. We examined associations of each sociodemographic, dietary, and urine collection timing predictor with each natural log-transformed parent compound biomarker using separate linear regression models adjusted for urine specific gravity only. Next, we ran multivariable linear regression with all predictors in the same model to quantify the independent effect of each predictor and the overall explained variation (R2). For ease of interpretation, we exponentiated regression coefficients and reported results as a percent change (% change = [exp^(beta) – 1] × 100) in the parent compound biomarker per increment in predictor. We used multivariable logistic regression to examine the associations of each predictor with detectability of the DINCH biomarker. We substituted maternal race/ethnicity for the 10% of children who had missing race/ethnicity data. We present complete case analyses, as 93% (n=772) of participants had complete data on all potential predictors.
Sensitivity analyses
In sensitivity analyses, we used multivariable linear regression to examine the association of each predictor with concentrations of each metabolite/biomarker. We also explored predictors of the phthalate mixture profile by first describing clusters of children based on the biomarkers of their parent compound concentrations. To assign clusters, we used k-medoids (partitioning around medoids [PAM]), an unsupervised clustering algorithm that is similar to k-means for partitioning data into k clusters.[14] We chose k-medoids for its robustness in the context of outlier concentrations.[15] We natural log transformed, centered, and scaled specific gravity-adjusted parent compound biomarkers. We specific gravity-adjusted biomarkers by the formula: observed phthalate x [1.019–1)/(SG −1)], where 1.019 was the mean SG for females in the cohort and (sg-adjusted phthalate concentration = observed phthalate x [1.021–1)/(SG −1)], where 1.021 was the mean SG for males in the cohort.[16] We used average silhouette width and the elbow method to determine the optimal number of clusters. Next, we ran unadjusted and mutually adjusted multinomial logistic regression models to examine the association of each sociodemographic, dietary, or urine collection characteristic with cluster membership.
For all analyses, we used R (version 3.6.2; R Development Core Team).
Results
Population characteristics
Among the 830 children, the mean (standard deviation [SD]) age was 7.8 (0.8) years. Half of children were female, 61% were white, 67% had mothers who were college educated, and 71% lived in a household with an annual income of greater than $70,000. Table 1 describes dietary intake and timing of urine collection characteristics of the children in the cohort.
Phthalate metabolites and biomarkers of parent compounds
Median concentrations of most phthalate metabolites in Project Viva were similar to those among children of the same age and during the same years in NHANES. However, Project Viva participants had lower monoethyl phthalate (MEP; 24.2 ng/mL versus 45.2 ng/mL in NHANES) and higher monocarboxyoctyl phthalate (23.9 ng/mL versus 10.7 ng/mL in NHANES) (Supplemental Table 2). In Project Viva, we detected at least one metabolite of DEP, DiBP, DEHP, BBzP, DiNP, DnOP, and DiDP in ≥99% of children (Table 2). Concentrations of the biomarkers of the same parent phthalate were moderately correlated (Spearman’s rank correlation coefficients [rs]: 0.26–0.80; Figure 1).
Table 2.
Distribution of biomarkers of DINCH and phthalate concentrations in Project Viva participants in mid-childhood (age 6–10 years, 2007–2010, n = 830).
| Percentiles |
||||||
|---|---|---|---|---|---|---|
| Parent phthalatea | 5th | 25th | 50th | 75th | 95th | Geometric Mean |
| (nmol/L) | ||||||
| Low molecular weight | ||||||
| DEP | 20.6 | 59.7 | 124.6 | 307.6 | 1,673.7 | 147.1 |
| DBP | 24.4 | 68.4 | 134.7 | 250.8 | 563.3 | 125.1 |
| DiBP | 15.0 | 43.8 | 85.2 | 144.7 | 407.0 | 79.9 |
|
High molecular weight | ||||||
| DEHP | 61.7 | 152.6 | 301.6 | 621.3 | 1,780.6 | 314.7 |
| BBzP | 9.4 | 31.0 | 66.3 | 138.5 | 412.3 | 65.6 |
| DiNP | 19.8 | 51.9 | 97.0 | 198.6 | 762.6 | 106.2 |
| DnOP | 3.6 | 9.5 | 18.0 | 31.7 | 88.3 | 17.6 |
| DiDP | 2.7 | 6.5 | 11.3 | 19.6 | 59.5 | 12.0 |
| DEHTP | 0.6 | 2.3 | 5.9 | 13.4 | 44.3 | 5.8 |
|
Phthalate replacement | ||||||
| DINCH | 0.0 | 0.3 | 1.0 | 2.8 | 11.7 | 1.4 |
aParent phthalate concentrations are the molar sums of phthalate metabolite(s) measured in urine (Supplemental Table 2). Abbreviations: DEP, diethyl phthalate; DBP, di-n-butyl phthalate; DiBP, di-iso-butyl phthalate; DEHP, di-2-ethylhexyl phthalate; BBzP, benzylbutyl phthalate; DiNP, di-isononyl phthalate; DnOP, di-n-octyl phthalate; DiDP, di-isodecyl phthalate; DEHTP, di-2-ethylhexyl terephthalate; DINCH, 1,2-Cyclohexane dicarboxylic acid, diisononyl ester.
Figure 1.
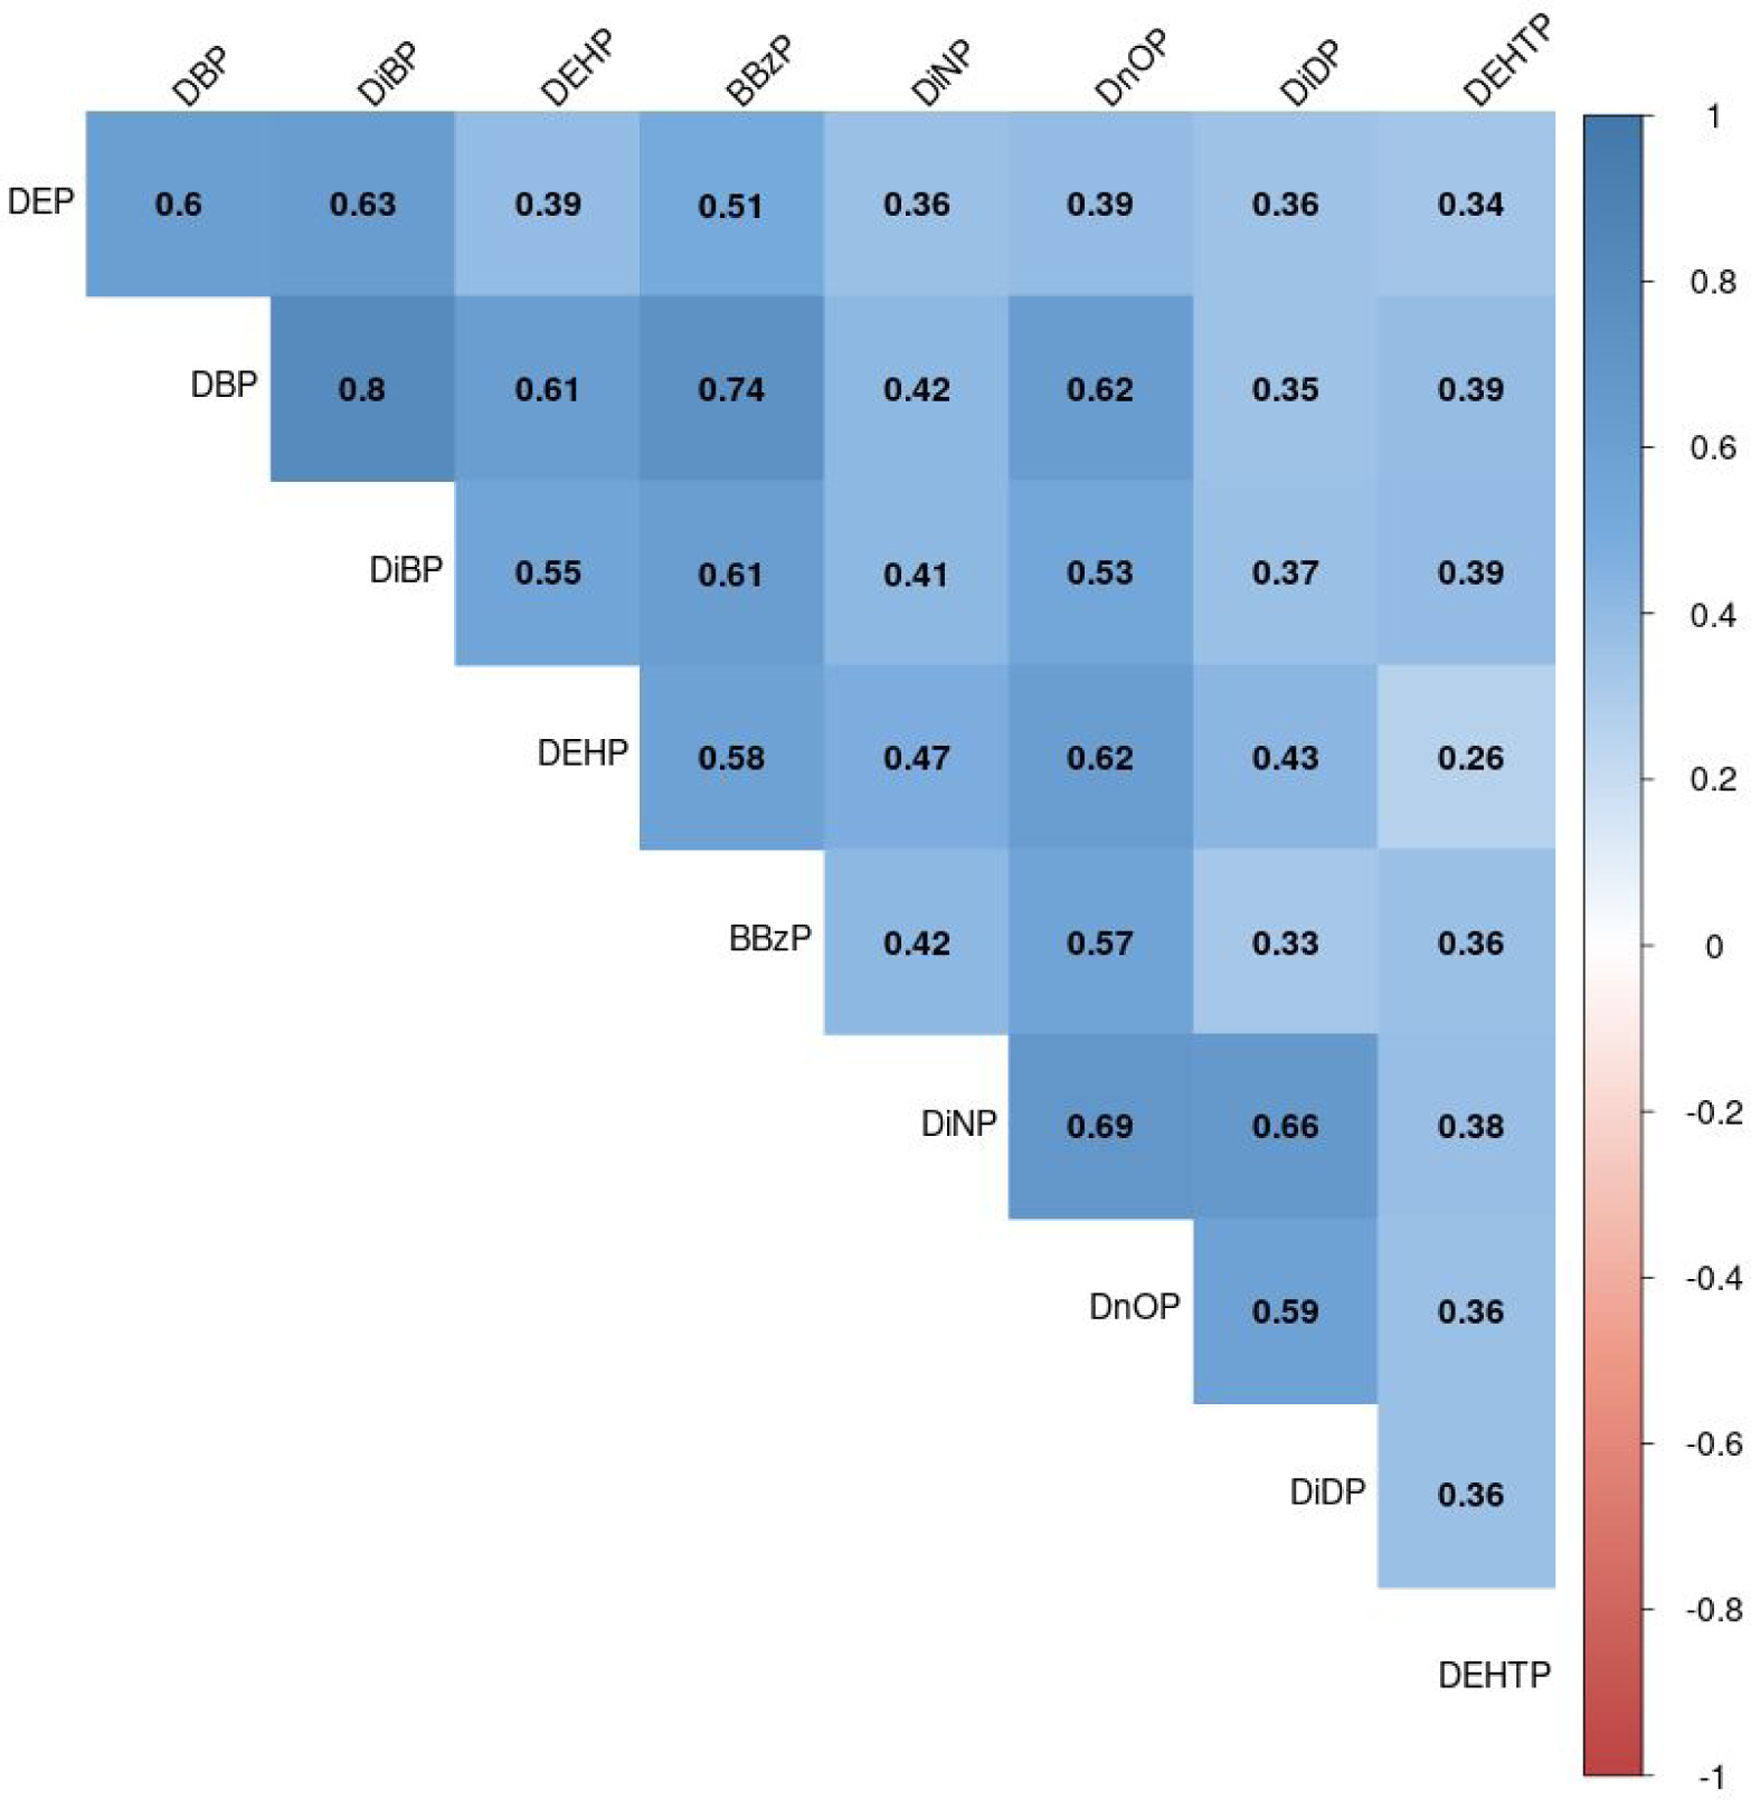
Spearman correlation coefficients of concentrations of biomarkers of parent phthalates in mid-childhood (age 6–10 years) in Project Viva (n = 830).
Abbreviations: DEP, diethyl phthalate; DBP, di-n-butyl phthalate; DiBP, di-iso-butyl phthalate; DEHP, di-2-ethylhexyl phthalate; BBzP, benzylbutyl phthalate; DiNP, di-isononyl phthalate; DnOP, di-n-octyl phthalate; DiDP, di-isodecyl phthalate; DEHTP, di-2-ethylhexyl terephthalate.
Predictors of the LMW phthalate biomarkers
We show individual associations of sociodemographic, dietary, and timing of urine collection characteristics with the biomarkers of each low molecular weight parent phthalate, adjusted for urine specific gravity only, in Supplemental Table 3. In models mutually adjusted for all predictors, we found that children who were female, Black, Hispanic, other race/ethnicity, had mothers with less than college education, or ate more whole fat dairy had higher biomarkers of several LMW phthalates. Specifically, compared to males, females had higher biomarkers of DEP, DBP, and higher DiBP biomarker (e.g., 38.3% [95% CI: 19.8%, 59.8%] higher for DEP). Compared to children who were white, those who were Black, Hispanic, or other/more than one race had higher DEP biomarker (e.g., 179.2% [95% CI: 122.0%, 251.0%] higher in Black children). Black and Hispanic children had higher DiBP biomarker, and Hispanic children had higher DBP biomarker. Children whose mothers had less than a college education or who lived in households with lower annual income had higher DEP biomarker (e.g., 24.1% [95% CI: 2.7%, 50.0%] higher for children whose mothers had less than a college education). Children who consumed whole fat dairy daily or greater had 12.2% (95% CI: 0.2%, 25.5%) higher DiBP biomarker. Children who consumed low fat dairy daily or greater had 11.6% (95% CI: −21.6%, −0.3%) lower DBP biomarker. Urine collection characteristics such as fasting status and time of day at sample collection were not associated with biomarkers of any of the low molecular weight phthalates. The DBP biomarker was lower in later sampling years (e.g., 21.0% [95% CI: −34.8%, −4.2%] lower in 2009 compared to 2007) (Table 3). Sociodemographic, dietary, and urine collection characteristics explained 46% (DiBP) to 48% (DBP) of the variance in low molecular weight phthalate biomarkers in mid-childhood (Table 3).
Table 3.
Mutually adjusted associations of sociodemographic, dietary, and urine collection characteristics with biomarkers of phthalate concentrations in mid-childhood (age 6–10 years) in Project Viva (n = 772). All models are also adjusted for urine specific gravity.
| Low molecular weight |
High molecular weight |
||||||||
|---|---|---|---|---|---|---|---|---|---|
| DEP | DBP | DiBP | DEHP | BBzP | DiNP | DnOP | DiDP | DEHTP | |
|
% change (95% CI) | |||||||||
| Sociodemographic characteristics | |||||||||
| Age (per year) | 12.3 (−0.9, 27.2) | −0.4 (−9.2, 9.3) | −5.0 (−13.6, 4.4) | −11.5 (−20.0, −2.1) | −1.2 (−12.1, 10.9) | 6.4 (−5.2, 19.4) | 1.1 (−8.8, 12.0) | −1.2 (−11.9, 10.8) | −11.5 (−23.2, 2.0) |
| Sex | |||||||||
| Female | 38.3 (19.8, 59.8) | 26.6 (13.8, 40.8) | 28.6 (15.3, 43.4) | 9.9 (−2.2, 23.5) | 0.1 (−12.4, 14.4) | 10.0 (−3.7, 25.7) | 7.9 (−4.2, 21.4) | 6.3 (−6.9, 21.3) | 18.7 (0.7, 39.9) |
| Male | Ref | Ref | Ref | Ref | Ref | Ref | Ref | Ref | Ref |
| Maternal Education | |||||||||
| Less than college | 24.1 (2.7, 50.0) | 5.2 (−8.6, 21.1) | 11.5 (−3.4, 28.7) | 12.5 (−3.5, 31.1) | 17.4 (−1.5, 40.0) | 18.7 (−0.4, 41.5) | 11.8 (−4.3, 30.7) | −3.6 (−18.9, 14.7) | −7.8 (−25.7, 14.4) |
| College | Ref | Ref | Ref | Ref | Ref | Ref | Ref | Ref | Ref |
| Race | |||||||||
| Black | 179.2 (122.0, 251.0) | 10.8 (−6.5, 31.3) | 26.5 (6.4, 50.4) | 1.6 (−15.6, 22.3) | 4.3 (−15.7, 28.9) | 1.9 (−17.6, 25.9) | −21.0 (−34.5, −4.7) | 19.1 (−3.4, 46.9) | 7.2 (−17.4, 39.1) |
| Hispanic | 71.2 (19.0, 146.2) | 35.7 (3.6, 77.6) | 39.6 (6.1, 83.8) | 5.2 (−21.6, 41.2) | 19.8 (−14.5, 67.8) | −22.3 (−44.5, 8.7) | −17.3 (−38.6, 11.5) | 2.4 (−26.6, 42.8) | 19.7 (−20.8, 81.0) |
| Asian | −4.6 (−38.0, 46.7) | 13.5 (−17.5, 56.2) | 30.2 (−6.0, 80.4) | −14.4 (−39.6, 21.3) | −4.8 (−36.2, 41.9) | −34.4 (−56.0, −2.3) | −32.9 (−52.9, − | −24.3 (−49.0, 12.3) | −20.1 (−51.1, 30.4) |
| Other or more than one race | 48.6 (18.1, 86.8) | 2.9 (−13.2, 22.0) | 8.1 (−9.1, 28.5) | −7.5 (−23.2, 11.3) | −3.9 (−22.3, 18.8) | −11.4 (−28.3, 9.5) | −3.9 (−20.4, 16.0) | 10.5 (−10.4, 36.3) | 1.6 (−21.7, 31.8) |
| White | Ref | Ref | Ref | Ref | Ref | Ref | Ref | Ref | Ref |
| Annual household income | |||||||||
| ≤ $40,000 | 54.3 (19.0, 100.0) | 11.0 (−8.4, 34.6) | 20.1 (−1.3, 46.1) | −2.9 (−21.3, 19.9) | 27.0 (−0.1, 61.6) | −16.0 (−33.9, 6.8) | −9.2 (−26.6, 12.4) | −4.2 (−24.5, 21.5) | 9.3 (−18.6, 46.8) |
| $40,000–70,000 | 31.6 (6.1, 63.3) | 3.3 (−12.0, 21.2) | 11.4 (−5.4, 31.1) | 13.3 (−4.9, 34.9) | 8.5 (−11.1, 32.5) | 4.1 (−14.7, 27.1) | 1.1 (−15.3, 20.6) | −5.9 (−22.8, 14.6) | −4.9 (−25.6, 21.5) |
| > $70,000 | Ref | Ref | Ref | Ref | Ref | Ref | Ref | Ref | Ref |
| Dietary intake | |||||||||
| ≥ Daily intake (reference is less than daily intake) of: | |||||||||
| Vegetables | 9.0 (−6.6, 27.4) | −5.3 (−15.6, 6.3) | −3.7 (−14.4, 8.3) | −4.1 (−15.4, 8.8) | −3.5 (−16.4, 11.5) | −14.2 (−25.7, −1.0) | −6.7 (−17.8, 6.0) | −0.9 (−14.0, 14.3) | −9.5 (−24.1, 8.0) |
| Fruits | 1.9 (−13.3, 19.7) | −4.8 (−15.5, 7.3) | −5.0 (−15.9, 7.3) | −7.8 (−19.1, 5.0) | −9.5 (−22.1, 5.1) | 3.6 (−10.7, 20.2) | 0.8 (−11.7, 15.0) | 8.5 (−6.3, 25.8) | −1.5 (−18.0, 18.4) |
| Baked goods | 1.2 (−19.5, 27.1) | 3.6 (−12.5, 22.7) | −2.8 (−18.2, 15.4) | 10.7 (−8.0, 33.1) | 23.3 (−0.2, 52.3) | 9.9 (−11.0, 35.7) | 10.2 (−8.6, 33.0) | 13.2 (−8.1, 39.5) | 2.3 (−21.1, 32.6) |
| Eggs | 11.7 (−15.9, 48.4) | −3.3 (−21.6, 19.4) | 6.0 (−14.4, 31.4) | 19.4 (−5.1, 50.2) | −1.0 (−23.9, 28.8) | −6.7 (−28.3, 21.3) | −9.0 (−27.9, 14.9) | 0.9 (−22.2, 30.9) | −29.6 (−49.1, −2.8) |
| Meat | −8.3 (−28.1, 16.9) | −8.7 (−23.8, 9.3) | −8.7 (−24.0, 9.8) | 4.6 (−14.1, 27.4) | 0.0 (−20.2, 25.3) | 7.6 (−14.1, 34.7) | −0.8 (−18.8, 21.2) | −4.9 (−23.9, 18.8) | 36.9 (3.8, 80.6) |
| Pasta/whole grains | −6.3 (−19.5, 9.1) | 5.0 (−6.2, 17.5) | 0.1 (−10.8, 12.3) | −3.3 (−14.5, 9.3) | 0.2 (−12.9, 15.4) | −14.0 (−25.3, −1.0) | 4.1 (−8.1, 18.0) | −5.0 (−17.4, 9.1) | 4.4 (−12.2, 24.1) |
| Whole fat dairy | 14.8 (−1.1, 33.2) | 8.4 (−2.9, 21.1) | 12.2 (0.2, 25.5) | 8.3 (−4.0, 22.3) | 18.1 (2.9, 35.6) | 2.7 (−10.5, 17.9) | 2.6 (−9.2, 15.9) | −7.6 (−19.4, 5.9) | 19.1 (0.5, 41.1) |
| Low fat dairy | −3.1 (−17.7, 14.0) | −11.6 (−21.6, −0.3) | −10.0 (−20.4, 1.8) | −12.0 (−22.9, 0.4) | 0.3 (−13.8, 16.6) | −12.8 (−25.0, 1.3) | −12.5 (−23.4, 0.0) | −15.8 (−27.4, −2.2) | −20.8 (−34.2, −4.7) |
| > Weekly (reference is weekly or less) intake of: | |||||||||
| Fish | 7.4 (−12.8, 32.3) | −7.2 (−20.5, 8.3) | −3.3 (−17.4, 13.2) | −10.3 (−24.2, 6.1) | −4.0 (−20.9, 16.4) | −2.3 (−19.4, 18.5) | −6.9 (−21.5, 10.5) | 0.3 (−17.1, 21.4) | 18.4 (−6.6, 50.1) |
| Fried foods | −3.6 (−23.0, 20.8) | 1.7 (−13.9, 20.2) | −0.8 (−16.4, 17.6) | −4.4 (−20.3, 14.8) | −1.5 (−20.1, 21.3) | 1.1 (−17.9, 24.6) | −1.6 (−18.2, 18.4) | 2.5 (−16.6, 26.0) | 0.1 (−22.5, 29.4) |
| Fast food | 34.0 (−0.5, 80.4) | 8.6 (−12.9, 35.4) | −4.3 (−23.5, 19.9) | 13.9 (−10.5, 44.9) | 18.6 (−10.0, 56.2) | 30.6 (−0.8, 72.0) | 31.0 (2.6, 67.3) | 23.0 (−6.3, 61.5) | 8.0 (−23.0, 51.5) |
| Restaurant food | 11.0 (−18.9, 51.9) | 4.9 (−16.8, 32.4) | 19.8 (−5.5, 51.9) | 15.7 (−10.3, 49.2) | −3.7 (−28.0, 28.8) | 29.8 (−2.9, 73.5) | 11.0 (−14.2, 43.6) | −8.4 (−31.3, 22.0) | 6.2 (−25.7, 51.7) |
| Urine collection characteristics | |||||||||
| Time since last meal (per hour) | 1.4 (0.0, 2.9) | 0.8 (−0.3, 1.9) | 0.6 (−0.5, 1.7) | −0.1 (−1.3, 1.0) | 0.8 (−0.5, 2.1) | −0.6 (−1.9, 0.7) | 0.1 (−1.1, 1.2) | −0.8 (−2.1, 0.5) | −0.6 (−2.2, 1.0) |
| Time of urine collection | |||||||||
| Morning (6a-11a) | Ref | Ref | Ref | Ref | Ref | Ref | Ref | Ref | Ref |
| Midday (11a-4p) | 1.3 (−16.5, 23.0) | −9.3 (−21.5, 4.7) | −6.6 (−19.3, 8.2) | 10.2 (−5.8, 29.0) | −11.0 (−25.7, 6.5) | 3.6 (−13.4, 24.0) | −11.3 (−24.3, 4.0) | −1.2 (−17.3, 17.9) | −0.7 (−20.3, 23.9) |
| Evening (4p-8p) | −13.4 (−40.1, 25.2) | 12.1 (−14.7, 47.2) | −12.0 (−33.4, 16.2) | 16.7 (−13.4, 57.2) | 19.3 (−15.2, 67.9) | −11.9 (−37.3, 23.8) | 21.7 (−10.0, 64.7) | −15.2 (−39.5, 18.8) | 42.2 (−6.4, 116.2) |
| Year of urine collection | |||||||||
| 2007 | Ref | Ref | Ref | Ref | Ref | Ref | Ref | Ref | Ref |
| 2008 | −0.1 (−22.5, 28.9) | −19.8 (−33.6, −3.2) | 5.3 (−13.1, 27.7) | −6.9 (−24.2, 14.4) | 5.1 (−17.0, 33.1) | 11.3 (−12.0, 40.8) | −18.6 (−33.9, 0.3) | 8.7 (−13.8, 37.2) | 14.4 (−14.3, 52.8) |
| 2009 | 5.5 (−18.6, 36.7) | −21.0 (−34.8, −4.2) | 17.6 (−3.3, 43.0) | −33.2 (−45.9, −17.7) | 6.9 (−16.0, 35.9) | 52.0 (19.6, 93.1) | −15.9 (−32.0, 4.0) | 18.3 (−6.7, 49.9) | 86.7 (39.0, 150.7) |
| 2010 | 4.3 (−25.9, 46.8) | −21.6 (−39.2, 1.0) | 11.4 (−14.0, 44.2) | −44.2 (−57.6, −26.4) | 5.0 (−23.5, 44.1) | 150.5 (82.7, 243.6) | −11.6 (−33.2, 17.0) | 30.1 (−4.8, 77.9) | 373.4 (220.9, 598.4) |
| Model R2 | 0.47 | 0.48 | 0.46 | 0.44 | 0.37 | 0.35 | 0.39 | 0.25 | 0.33 |
Abbreviations: CI, confidence interval; DEP, diethyl phthalate; DBP, di-n-butyl phthalate; DiBP, di-iso-butyl phthalate; DEHP, di-2-ethylhexyl phthalate; BBzP, benzylbutyl phthalate; DiNP, di-isononyl phthalate; DnOP, di-n-octyl phthalate; DiDP, di-isodecyl phthalate; DEHTP, di-2-ethylhexyl terephthalate.
Predictors of the HMW phthalate biomarkers
We show associations of sociodemographic, dietary, and urine collection characteristics with the biomarkers of each HMW parent phthalate, adjusted for specific gravity only, in Supplemental Table 3. In models mutually adjusted for all predictors, we found that children who were female, non-Hispanic white, younger, ate more fast food and whole fat dairy, or ate fewer vegetables or pasta/whole grains had higher biomarkers of select high molecular weight phthalates. Compared to males, females had 18.7% (95% CI: 0.7%, 39.9%) higher DEHTP biomarker. Compared to white children, Asian children had lower DiNP and DnOP biomarkers (e.g., 34.4% [95% CI: −56.0%, −2.3%] lower DiNP), and Black children had lower DnOP biomarker. Older children had lower DEHP biomarker (11.5% [95% CI: −20.0%, −2.1%] lower for each year of age). Children with greater fast-food intake had higher biomarkers of HMW phthalates, though this association reached statistical significance for the DnOP biomarker only (31.0% [95% CI: 2.6%, 67.3%] higher for children who ate fast food greater than weekly compared to weekly or less). Children who consumed whole fat dairy daily or greater had higher BBzP and DEHTP biomarkers (e.g., 18.1% [95% CI: 2.9%, 35.6%] higher BBzP for daily or greater compared to less than daily consumption), whereas children who consumed more low-fat dairy had lower DiDP and DEHTP biomarkers. Greater meat intake was associated with higher DEHTP biomarker, while greater egg intake was associated with lower DEHTP biomarker. Children who had daily or greater consumption of vegetables or pasta/whole grains had lower DiNP biomarker. Urine collection characteristics were not associated with the high molecular weight phthalate biomarkers. The DEHP biomarker was lower in later years of sampling (e.g., 44.2% [95% CI: −57.6%, −26.4%] lower in 2010 compared to 2007), while the DiNP and DEHTP biomarkers were higher in later years of sampling (e.g., 373.4% [95% CI: 220.9%, 598.4%] higher DEHTP in 2010 compared to 2007). Sociodemographic, dietary, and urine collection characteristics together explained 25% (DiDP) to 44% (DEHP) of the variability in high molecular weight phthalate biomarkers in mid-childhood (Table 3).
Predictors of DINCH biomarker detectability
We show associations of sociodemographic characteristics with detectability of the DINCH biomarker, adjusted for specific gravity only in Supplemental Table 4. In models mutually adjusted for all predictors, as compared to males, females had 2.1 times greater odds (95% CI: 1.48, 2.99) of having detectable DINCH biomarker. Children who ate pasta/whole grains daily or more had lower odds of having detectable DINCH biomarker (OR 0.68 [95% CI: 0.47, 0.98]). Children whose samples were collected in later years of sampling had greater odds of having detectable DINCH biomarker (e.g., OR 8.48 [95% CI: 3.59, 21.15] for 2010 as compared to 2007) (Table 4.)
Table 4.
Mutually adjusted associations of sociodemographic, dietary, and urine collection characteristics with odds of having detectable concentrations of the 1,2-Cyclohexane dicarboxylic acid, diisononyl ester (DINCH) biomarker in mid-childhood (age 6–10 years) in Project Viva (n = 772).
| Sociodemographic characteristics | Odds Ratio (95% CI) |
|---|---|
| Age (years) | 0.85 (0.64, 1.13) |
| Sex | |
| Female | 2.10 (1.48, 2.99) |
| Male | Ref |
| Race/ethnicity | |
| Black | 1.49 (0.88, 2.50) |
| Hispanic | 1.18 (0.52, 2.67) |
| Asian | 1.18 (0.40, 3.22) |
| Other | 0.93 (0.53, 1.61) |
| White | Ref |
| Maternal education | |
| Less than college | 1.18 (0.75, 1.85) |
| College | Ref |
| Annual household income | |
| ≤ $40,000 | 1.39 (0.77, 2.51) |
| $40,000-$70,000 | 1.04 (0.62, 1.73) |
| >$70,000 | Ref |
| Dietary intake | |
| ≥ Daily intake (reference is less than daily intake of): | |
| Vegetables | 0.98 (0.68, 1.41) |
| Fruits | 0.79 (0.54, 1.17) |
| Baked goods | 1.21 (0.70, 2.09) |
| Eggs | 1.29 (0.67, 2.45) |
| Meat | 0.77 (0.42, 1.40) |
| Pasta/whole grains | 0.68 (0.47, 0.98) |
| Whole fat dairy | 1.24 (0.87, 1.77) |
| Low fat dairy | 1.15 (0.79, 1.69) |
| >Weekly (reference is weekly or less) intake of: | |
| Fish | 0.88 (0.53, 1.43) |
| Fried foods | 1.26 (0.74, 2.12) |
| Fast food | 1.28 (0.63, 2.55) |
| Restaurant food | 0.53 (0.22, 1.18) |
| Urine collection characteristics | |
| Time since last meal (hours) | 1.00 (0.96, 1.03) |
| Time of urine collection | |
| Morning (6a-11a) | Ref |
| Midday (11a-4p) | 0.77 (0.49, 1.20) |
| Evening (4p-8p) | 0.72 (0.30, 1.67) |
| Year of urine collection | |
| 2007 | Ref |
| 2008 | 1.79 (0.89, 3.87) |
| 2009 | 4.89 (2.43, 10.55) |
| 2010 | 8.48 (3.59, 21.15) |
| Receiver Operating Characteristic (ROC) | 0.77 |
Sensitivity analyses
The pattern and directionality of associations of sociodemographic, timing of urine collection, and dietary characteristics with each metabolite concentration was similar to that of the associations of the characteristics with the biomarkers of the parent compounds (Supplemental Table 5).
In our analysis of predictors of the phthalate biomarker mixture profile, we found 3 clusters of participants with unique profiles of parent compound biomarkers. Participants in cluster 1 (n = 536) had low biomarkers of all parent compounds. Participants in cluster 2 (n = 252) had relatively higher biomarkers of all LMW and some HMW (DEHP, BBzP, DnOP) phthalates. Participants in cluster 3 (n = 42) had relatively high biomarkers of four HMW (DiNP, DnOP, DiDP, DEHTP) phthalates (Supplemental Figure 1). In adjusted models, children who ate fast food greater than (versus less than or equal to) weekly were more likely to belong to Cluster 3 compared to Cluster 1 (OR 3.75 [95% CI: 1.04, 13.51]). Children who had phthalate biomarkers measured in later sampling years were more likely to belong to Cluster 3 compared to Cluster 1, although confidence intervals crossed the null (e.g., OR 3.32 [95% CI: 0.54, 20.44] for 2010 versus 2007). Some sociodemographic characteristics were associated with cluster membership in unadjusted models but not mutually adjusted models. For example, older children were more likely to belong to Cluster 3 compared to Cluster 1 in unadjusted models (OR 1.70 [95% CI: 1.21, 2.39]) but associations were attenuated and null in adjusted models (OR 1.27 [95% CI: 0.76, 2.12]) (Supplemental Table 6).
Discussion
We conducted our analysis in a large cohort of children between 6–10 years of age. This age group is of particular interest because it encompasses a wider range of exposures in terms of personal care products and diet as compared to early childhood. We found that sociodemographic, dietary, and urine timing collection characteristics explained 25% to 48% of the variability in phthalate biomarkers. Children who were female, Black, Hispanic, other race/ethnicity, had less educated mothers, or ate more whole fat dairy had higher biomarkers of several LMW phthalates. Children who were younger, white, ate more fast food or whole fat dairy, or ate fewer vegetables or pasta/whole grains had higher biomarkers of select high molecular weight phthalates. The DINCH biomarker was more detectable among females.
Previous studies have identified similar sociodemographic variables to predict urinary phthalate biomarkers. For example, females in both NHANES and the Toddlers’ Exposure to semi-volatile organic contaminants in the Indoor Environment (TESIE) study had higher phthalate biomarkers as compared to males.[17, 18] In studies of young children (less than 6 years of age), Black children had higher biomarkers of several LMW phthalates, as compared to white children.[19]-[18] Finally, children with less educated mothers had higher concentrations of all measured phthalate biomarkers in the Health Outcomes and Measures of the Environment study as well as the Polish Mother and Child Cohort Study and higher concentrations of MEP (the major DEP metabolite) in the TESIE study.16,17,18 Identifying populations of children with higher phthalate and replacement biomarkers is important to inform future studies of exposure sources. For example, prior studies have found higher LMW phthalates in adolescents with frequent makeup, lotion, or moisturizer use.10 Higher phthalate exposure among Black individuals and females may relate to specific personal care product use.
Diet is thought to be a major source of phthalate exposure among children. Consistent with our findings, recent fast food consumption has been associated with higher biomarkers of high molecular weight (mono-3-carboxypropyl phthalate,[20] DEHP[21], and DiNP[22]) phthalates among children and adolescents. Also, greater intake of high fat dairy has been associated with a higher DEHP biomarker in multiple studies.[23, 24] A study conducted using NHANES data found that biomarkers of HMW phthalates were associated with higher poultry consumption, whereas MEP was associated with high vegetable consumption.[25, 26]. Additionally, children in the NHANES study who had a greater intake of dairy and starchy vegetables had higher HMW phthalate biomarkers.[25] Phthalate exposure may occur not only from the food products but as a result of the food preparation and packaging process, particularly in the case of foods packaged specifically for children. Another study reported that foods packaged for 3- to 10-year-old children had detectable levels of DEHP and DBP.[27] Additionally, a recent study using NHANES data found that dining out may be an important source of biologically relevant phthalate exposure among 6–19 year old U.S. children and adolescents.[25] Our study supports previous evidence that diet is a large contributor of phthalate exposure during mid-childhood and may be an avenue for effective intervention to minimize exposure to phthalates in early life.
Our study extends the existing literature by focusing on mid-childhood, a time when levels of most phthalates may be at their peak, based on data that children 6–11 years of age have higher concentrations of several urinary phthalate metabolites as compared to adolescents and adults[2, 17] and based on data that older children (age 6–7 years) have higher phthalate biomarkers than younger children (age 2–3 years).[18, 28] This may be in part due to children having higher intake of chemical exposures per body surface area; additionally, as diet becomes more varied with age, older children may be exposed to more foods that include phthalates than younger children.
As compared to prior studies, our study included not only commonly studied phthalates but also other chemicals such as DiNP, DiDP, DEHTP, and DINCH, which are not as well-studied. We found that predictors of these other chemicals were similar to those of the high molecular weight phthalates they may be replacing. Legislation in the United States (CPSIA 2008) restricts the use of several unique phthalates in children’s toys and child care products.[29] Consistent with existing legislation, changes in consumer preferences, and prior studies,5,[30],[31],[32],[33] we found lower DEHP, DEP, and DBP biomarkers and higher DiNP, DiDP, DEHTP, and DINCH biomarkers over time. It is necessary to study both phthalates and replacement chemicals concurrently in order to understand which are the most prevalent among children of middle aged, this is one of the first studies to have both concurrently in the same population.
Our study utilized a k-means clustering technique to better understand phthalate exposure profiles and predictors of exposure to a given profile. We identified 3 clusters of participants with unique profiles of phthalate biomarkers: (1) low biomarkers of all parent phthalates examined, (2) higher biomarkers of all LMW and some HMW (DEHP, BBzP, DnOP) phthalates, and (3) high biomarkers of four HMW (DiNP, DnOP, DiDP, DEHTP) phthalates. In general, predictors of the phthalate biomarker profile were in line with those we identified in linear regression models predicting single phthalate biomarkers. For example, children with greater intake of fast food and in whom biomarkers were measured in later sampling years were more likely to belong to the cluster with higher HMW phthalate biomarkers, including DiNP, DiDP, and DEHTP. Though previous studies have described biomarker phthalate profiles in children[34, 35] and examined the predictors of biomarker profiles of environmental chemicals among pregnant women,[10, 36, 37] to our knowledge this is the first study to identify predictors of phthalate biomarker profiles among children.
Although our findings are meaningful and extend the existing body of literature, several limitations should be addressed in future research. First, while we were able to identify populations (e.g., females) with higher urinary concentrations of phthalate and replacement biomarkers, individuals in these populations likely have higher exposures due to sources that we were unable to assess (e.g., personal care product use 10 or vinyl flooring 3,28). Because the biological half-life of phthalates and DINCH is less than 24 hours,[12] another limitation of our study was the use of a single spot urine sample. However, a single sample has been shown to be moderately predictive of phthalate exposure on the orders of months,[16, 38–42] likely due to recurrent exposure patterns, including in U.S. children of the same age as those in our study.[38] Future studies would benefit from examining predictors of repeated measures of phthalate and replacement biomarkers. Another potential limitation of our study is that urine was not collected at a standard time of day, and prior studies have indicated that phthalate biomarker concentrations may vary by time of day.[43] However, we found that time of day of urine collection was not a strong predictor of biomarker concentrations in our cohort and we accounted for this variable in analyses. Finally, we enrolled participants from a single U.S. region between 2007–2010, and our results may not be generalizable to children in other locations or at different times. Future studies should assess predictors of phthalates and replacement chemicals in more recent years.
Our data suggest that children in this U.S. cohort are exposed to a number of phthalates. Furthermore, we ascertained that sociodemographic, dietary, and urine collection characteristics explained 25% to 48% of the variability in phthalate biomarkers. Future studies could use these predictors in designing analyses to study the potential effects of phthalate-replacement chemicals on health outcomes. Also, identifying populations of children with higher urinary concentrations of phthalate and replacement biomarkers will inform future studies of exposure sources, and dietary predictors can be used as direct points of intervention to reduce the burden of exposure among the pediatric community
Supplementary Material
Funding
This work is supported by the National Institute of Environmental Health Science (R01ES030101) and the National Institutes of Health (R01HD034568, UH3OD023286).
Footnotes
Competing Financial Interests
The authors declare they have no actual or potential competing financial interests.
Disclaimer
The findings and conclusions in this report are those of the authors and do not necessarily represent the official position of the CDC. Use of trade names is for identification only and does not imply endorsement by the CDC, the Public Health Service, or the US Department of Health and Human Services.
Data Availability
Restrictions apply to the availability of some, or all data generated or analyzed during this study to preserve patient confidentiality or because they were used under license. The corresponding author will on request detail the restrictions and any conditions under which access to some data may be provided. Project Viva data sharing policies are further detailed at https://www.hms.harvard.edu/viva/protocol-policies.html.
References
- [1].Zota AR, Calafat AM, Woodruff TJ. Temporal trends in phthalate exposures: findings from the National Health and Nutrition Examination Survey, 2001–2010. Environ Health Perspect 2014;122:235–41. [DOI] [PMC free article] [PubMed] [Google Scholar]
- [2].Saravanabhavan G, Guay M, Langlois É, Giroux S, Murray J, Haines D. Biomonitoring of phthalate metabolites in the Canadian population through the Canadian Health Measures Survey (2007–2009). International Journal of Hygiene and Environmental Health 2013;216:652–61. [DOI] [PubMed] [Google Scholar]
- [3].Braun JM, Sathyanarayana S, Hauser R. Phthalate exposure and children’s health. Curr Opin Pediatr 2013;25:247–54. [DOI] [PMC free article] [PubMed] [Google Scholar]
- [4].Jurewicz J, Hanke W. Exposure to phthalates: reproductive outcome and children health. A review of epidemiological studies. Int J Occup Med Environ Health 2011;24:115–41. [DOI] [PubMed] [Google Scholar]
- [5].Oken E, Baccarelli AA, Gold DR, Kleinman KP, Litonjua AA, De Meo D, et al. Cohort profile: project viva. Int J Epidemiol 2015;44:37–48. [DOI] [PMC free article] [PubMed] [Google Scholar]
- [6].Silva MJ, Jia T, Samandar E, Preau JL, Calafat AM. Environmental exposure to the plasticizer 1,2-cyclohexane dicarboxylic acid, diisononyl ester (DINCH) in U.S. adults (2000–2012). Environ Res 2013;126:159–63. [DOI] [PMC free article] [PubMed] [Google Scholar]
- [7].Silva MJ, Wong LY, Samandar E, Preau JL, Jia LT, Calafat AM. Exposure to di-2-ethylhexyl terephthalate in the U.S. general population from the 2015–2016 National Health and Nutrition Examination Survey. Environ Int 2019;123:141–7. [DOI] [PMC free article] [PubMed] [Google Scholar]
- [8].Centers for Disease Control and Prevention. Laboratory Procedures Manual: Metabolites of phthalates and phthalate alternatives 2018.
- [9].Baird DD, Saldana TM, Nepomnaschy PA, Hoppin JA, Longnecker MP, Weinberg CR, et al. Within-person variability in urinary phthalate metabolite concentrations: measurements from specimens after long-term frozen storage. Journal of exposure science & environmental epidemiology 2010;20:169–75. [DOI] [PMC free article] [PubMed] [Google Scholar]
- [10].Kalloo G, Wellenius GA, McCandless L, Calafat AM, Sjodin A, Karagas M, et al. Profiles and Predictors of Environmental Chemical Mixture Exposure among Pregnant Women: The Health Outcomes and Measures of the Environment Study. Environ Sci Technol 2018;52:10104–13. [DOI] [PMC free article] [PubMed] [Google Scholar]
- [11].Rifas-Shiman SL, Willett WC, Lobb R, Kotch J, Dart C, Gillman MW. PrimeScreen, a brief dietary screening tool: reproducibility and comparability with both a longer food frequency questionnaire and biomarkers. Public Health Nutr 2001;4:249–54. [DOI] [PubMed] [Google Scholar]
- [12].Johns LE, Cooper GS, Galizia A, Meeker JD. Exposure assessment issues in epidemiology studies of phthalates. Environment international 2015;85:27–39. [DOI] [PMC free article] [PubMed] [Google Scholar]
- [13].Centers for Disease Control and Prevention (CDC). Fourth National Report on Human Exposure to Environmental Chemicals. Updated Tables, January 2017, Volume 1. Available: https://www.cdc.gov/exposurereport/pdf/FourthReport_UpdatedTables_Volume1_Jan2017.pdf. Atlanta, GA: Centers for Disease Control and Prevention; National Center for Environmental Health; Division of Laboratory Sciences. 2017. [Google Scholar]
- [14].Kaufman L, Rousseeuw PJ. Partitioning Around Medoids (Program PAM). Finding Groups in Data1990 p. 68–125.
- [15].Yao X, Steven Xu X, Yang Y, Zhu Z, Zhu Z, Tao F, et al. Stratification of population in NHANES 2009–2014 based on exposure pattern of lead, cadmium, mercury, and arsenic and their association with cardiovascular, renal and respiratory outcomes. Environment International 2021;149:106410. [DOI] [PubMed] [Google Scholar]
- [16].Hauser R, Meeker JD, Park S, Silva MJ, Calafat AM. Temporal variability of urinary phthalate metabolite levels in men of reproductive age. Environmental health perspectives 2004;112:1734–40. [DOI] [PMC free article] [PubMed] [Google Scholar]
- [17].Silva MJ, Barr DB, Reidy JA, Malek NA, Hodge CC, Caudill SP, et al. Urinary levels of seven phthalate metabolites in the U.S. population from the National Health and Nutrition Examination Survey (NHANES) 1999–2000. Environmental health perspectives 2004;112:331–8. [DOI] [PMC free article] [PubMed] [Google Scholar]
- [18].Hoffman K, Hammel SC, Phillips AL, Lorenzo AM, Chen A, Calafat AM, et al. Biomarkers of exposure to SVOCs in children and their demographic associations: The TESIE Study. Environment international 2018;119:26–36. [DOI] [PMC free article] [PubMed] [Google Scholar]
- [19].Watkins DJ, Eliot M, Sathyanarayana S, Calafat AM, Yolton K, Lanphear BP, et al. Variability and Predictors of Urinary Concentrations of Phthalate Metabolites during Early Childhood. Environmental Science & Technology 2014;48:8881–90. [DOI] [PMC free article] [PubMed] [Google Scholar]
- [20].Smith AR, Kogut KR, Parra K, Bradman A, Holland N, Harley KG. Dietary intake and household exposures as predictors of urinary concentrations of high molecular weight phthalates and bisphenol A in a cohort of adolescents. Journal of Exposure Science & Environmental Epidemiology 2021. [DOI] [PMC free article] [PubMed]
- [21].Zota AR, Phillips CA, Mitro SD. Recent Fast Food Consumption and Bisphenol A and Phthalates Exposures among the U.S. Population in NHANES, 2003–2010. Environ Health Perspect 2016;124:1521–8. [DOI] [PMC free article] [PubMed] [Google Scholar]
- [22].Zota AR, Phillips CA, Mitro SD. Recent Fast Food Consumption and Bisphenol A and Phthalates Exposures among the U.S. Population in NHANES, 2003–2010. Environmental health perspectives 2016;124:1521–8. [DOI] [PMC free article] [PubMed] [Google Scholar]
- [23].Serrano SE, Braun J, Trasande L, Dills R, Sathyanarayana S. Phthalates and diet: a review of the food monitoring and epidemiology data. Environ Health 2014;13:43. [DOI] [PMC free article] [PubMed] [Google Scholar]
- [24].García-Fabila MM, Chávez AA, Meza JCS, Montes LPB, García AR. Phthalates in the diet of Mexican children of school age. Risk analysis. Toxicol Rep 2020;7:1487–94. [DOI] [PMC free article] [PubMed] [Google Scholar]
- [25].Carwile JL, Seshasayee SM, Ahrens KA, Hauser R, Chavarro JE, Fleisch AF. Dietary correlates of urinary phthalate metabolite concentrations in 6–19 Year old children and adolescents. Environ Res 2022;204:112083. [DOI] [PMC free article] [PubMed] [Google Scholar]
- [26].Trasande L, Attina TM, Sathyanarayana S, Spanier AJ, Blustein J. Race/ethnicity-specific associations of urinary phthalates with childhood body mass in a nationally representative sample. Environ Health Perspect 2013;121:501–6. [DOI] [PMC free article] [PubMed] [Google Scholar]
- [27].Cirillo T, Fasano E, Castaldi E, Montuori P, Amodio Cocchieri R. Children’s exposure to Di(2-ethylhexyl)phthalate and dibutylphthalate plasticizers from school meals. J Agric Food Chem 2011;59:10532–8. [DOI] [PubMed] [Google Scholar]
- [28].Garí M, Koch HM, Pälmke C, Jankowska A, Wesołowska E, Hanke W, et al. Determinants of phthalate exposure and risk assessment in children from Poland. Environ Int 2019;127:742–53. [DOI] [PubMed] [Google Scholar]
- [29].Lioy PJ, Hauser R, Gennings C, Koch HM, Mirkes PE, Schwetz BA, et al. Assessment of phthalates/phthalate alternatives in children’s toys and childcare articles: Review of the report including conclusions and recommendation of the Chronic Hazard Advisory Panel of the Consumer Product Safety Commission. J Expo Sci Environ Epidemiol 2015;25:343–53. [DOI] [PubMed] [Google Scholar]
- [30].Hammel SC, Levasseur JL, Hoffman K, Phillips AL, Lorenzo AM, Calafat AM, et al. Children’s exposure to phthalates and non-phthalate plasticizers in the home: The TESIE study. Environment International 2019;132:105061. [DOI] [PMC free article] [PubMed] [Google Scholar]
- [31].Silva MJ, Wong L-Y, Samandar E, Preau JL, Calafat AM, Ye X. Exposure to di-2-ethylhexyl terephthalate in a convenience sample of U.S. adults from 2000 to 2016. Archives of Toxicology 2017;91:3287–91. [DOI] [PMC free article] [PubMed] [Google Scholar]
- [32].Silva MJ, Jia T, Samandar E, Preau JL, Calafat AM. Environmental exposure to the plasticizer 1,2-cyclohexane dicarboxylic acid, diisononyl ester (DINCH) in US adults (2000—2012). Environmental Research 2013;126:159–63. [DOI] [PMC free article] [PubMed] [Google Scholar]
- [33].Schwedler G, Conrad A, Rucic E, Koch HM, Leng G, Schulz C, et al. Hexamoll® DINCH and DPHP metabolites in urine of children and adolescents in Germany. Human biomonitoring results of the German Environmental Survey GerES V, 2014–2017. International Journal of Hygiene and Environmental Health 2020;229:113397. [DOI] [PubMed] [Google Scholar]
- [34].Schwedler G, Rucic E, Lange R, Conrad A, Koch HM, Pälmke C, et al. Phthalate metabolites in urine of children and adolescents in Germany. Human biomonitoring results of the German Environmental Survey GerES V, 2014–2017. International journal of hygiene and environmental health 2020;225:113444. [DOI] [PubMed] [Google Scholar]
- [35].Ketema RM, Ait Bamai Y, Miyashita C, Saito T, Kishi R, Ikeda-Araki A. Phthalates mixture on allergies and oxidative stress biomarkers among children: The Hokkaido study. Environment international 2022;160:107083. [DOI] [PubMed] [Google Scholar]
- [36].Lee WC, Fisher M, Davis K, Arbuckle TE, Sinha SK. Identification of chemical mixtures to which Canadian pregnant women are exposed: The MIREC Study. Environ Int 2017;99:321–30. [DOI] [PubMed] [Google Scholar]
- [37].Traoré T, Forhan A, Sirot V, Kadawathagedara M, Heude B, Hulin M, et al. To which mixtures are French pregnant women mainly exposed? A combination of the second French total diet study with the EDEN and ELFE cohort studies. Food Chem Toxicol 2018;111:310–28. [DOI] [PubMed] [Google Scholar]
- [38].Teitelbaum SL, Britton JA, Calafat AM, Ye X, Silva MJ, Reidy JA, et al. Temporal variability in urinary concentrations of phthalate metabolites, phytoestrogens and phenols among minority children in the United States. Environmental research 2008;106:257–69. [DOI] [PubMed] [Google Scholar]
- [39].Braun JM, Smith KW, Williams PL, Calafat AM, Berry K, Ehrlich S, et al. Variability of urinary phthalate metabolite and bisphenol A concentrations before and during pregnancy. Environmental health perspectives 2012;120:739–45. [DOI] [PMC free article] [PubMed] [Google Scholar]
- [40].Townsend MK, Franke AA, Li X, Hu FB, Eliassen AH. Within-person reproducibility of urinary bisphenol A and phthalate metabolites over a 1 to 3 year period among women in the Nurses’ Health Studies: a prospective cohort study. Environmental health : a global access science source 2013;12:80. [DOI] [PMC free article] [PubMed] [Google Scholar]
- [41].Wittassek M, Angerer J. Phthalates: metabolism and exposure. Int J Androl 2008;31:131–8. [DOI] [PubMed] [Google Scholar]
- [42].Koch HM, Schütze A, Pälmke C, Angerer J, Brüning T. Metabolism of the plasticizer and phthalate substitute diisononyl-cyclohexane-1,2-dicarboxylate (DINCH(®)) in humans after single oral doses. Archives of toxicology 2013;87:799–806. [DOI] [PubMed] [Google Scholar]
- [43].Frederiksen H, Kranich SK, Jørgensen N, Taboureau O, Petersen JH, Andersson AM. Temporal variability in urinary phthalate metabolite excretion based on spot, morning, and 24-h urine samples: considerations for epidemiological studies. Environmental science & technology 2013;47:958–67. [DOI] [PubMed] [Google Scholar]
Associated Data
This section collects any data citations, data availability statements, or supplementary materials included in this article.
Supplementary Materials
Data Availability Statement
Restrictions apply to the availability of some, or all data generated or analyzed during this study to preserve patient confidentiality or because they were used under license. The corresponding author will on request detail the restrictions and any conditions under which access to some data may be provided. Project Viva data sharing policies are further detailed at https://www.hms.harvard.edu/viva/protocol-policies.html.