

Abstract
This cohort study involves assessing causes of death among people experiencing homelessness in Boston from 2003 to 2018.
Homelessness is a growing public health concern in the US, with an estimated 580 445 people experiencing homelessness on any given night.1 Prior studies have documented mortality disparities with the general population2,3; however, temporal mortality trends among people experiencing homelessness remain understudied.
Methods
This cohort study included adults (aged ≥18 years) who had an in-person encounter at Boston Health Care for the Homeless Program (BHCHP) between January 1, 2003, and December 31, 2017. We used Match*Pro, version 1.6.3 (IMS Inc), to link the BHCHP cohort with Massachusetts death occurrence files spanning 2003 to 2018 using previously described methods.3,4 We used SAS version 9.4 (SAS Institute Inc) to conduct all data analyses from March 16, 2021, through May 12, 2022. The Mass General Brigham Human Research Committee Institutional Review Board approved this study with a waiver of informed consent because the study posed minimal risk to the individuals involved.
We used Poisson regression models to estimate annual age- and sex-standardized all-cause mortality rates in the BHCHP cohort and to compare the temporal trend in these rates with the all-cause mortality trend in the urban Northeast US. We repeated this procedure for the 6 leading causes of death observed in the BHCHP cohort (eTable in Supplement 1). Detailed methods are provided in the eMethods in Supplement 1.
Results
The cohort consisted of 60 092 adults experiencing homelessness, yielding 520 430 person-years of follow-up. The mean (SD) age at cohort entry was 40.4 (13.1) years, 63.4% were male, 26.5% Black, 17.9% Latinx, and 43.9% White.4 Race and ethnicity were patient self-reported at initial care enrollment.
Overall, 7130 individuals (11.9%) died during the study period, generating a crude mortality rate of 1370 deaths per 100 000 person-years. Between 2003 and 2018, the standardized all-cause mortality rate did not significantly change in the BHCHP cohort (0.16% annual growth; 95% CI, −0.36% to 0.68%; P = .54), whereas the all-cause mortality rate decreased 1.21% annually (95% CI, −1.25% to −1.17%; P < .001) in the urban Northeast population (P < .001 for interaction) (Figure 1).
Figure 1. All-Cause Mortality Rates in the Boston Health Care for the Homeless Program Cohort Compared With the Urban Northeast US Population From 2003 to 2018.

Annual age- and sex-standardized all-cause mortality rates in the Boston Health Care for the Homeless Program Cohort and the urban Northeast US population. Vertical bars represent 95% CIs.
aThe average annual percent change in the mortality rate is significantly different from 0 (P < .001). The average annual percent change between the 2 cohorts is significantly different (P < .001 for interaction).
Drug overdose (23.7%), cardiovascular disease (16.5%), cancer (15.2%), psychoactive substance use disorder (6.6%), liver disease (5.7%), and chronic lower respiratory disease (2.7%) were the 6 leading causes of death. Between 2003 and 2018, drug overdose mortality increased on average 9.35% annually (95% CI, 7.90%-10.79%; P < .001), compared with an average annual increase of 7.57% (95% CI, 7.34%-7.80%; P < .001) in the urban Northeast population (P = .02 for interaction) (Figure 2). Cardiovascular and cancer mortality decreased on average 2.92% annually (95% CI, −4.18% to −1.67%; P < .001) and 2.52% annually (95% CI, −3.94% to −1.10%; P < .001), respectively, at rates that did not differ significantly from the urban Northeast population. Liver disease mortality decreased on average 3.78% annually (95% CI, −6.33% to −1.23%; P = .004) and remained stable in the urban Northeast population (P = .004 for interaction). Chronic lower respiratory disease mortality increased on average 3.65% annually (95% CI, 0.63%-6.68%; P = .02) and decreased on average 0.65% annually (95% CI, −0.88% to −0.41%; P < .001) in the urban Northeast population (P = .006 for interaction).
Figure 2. Cause-Specific Mortality Rates in the Boston Health Care for the Homeless Cohort Compared With the Urban Northeast US Population From 2003 to 2018.
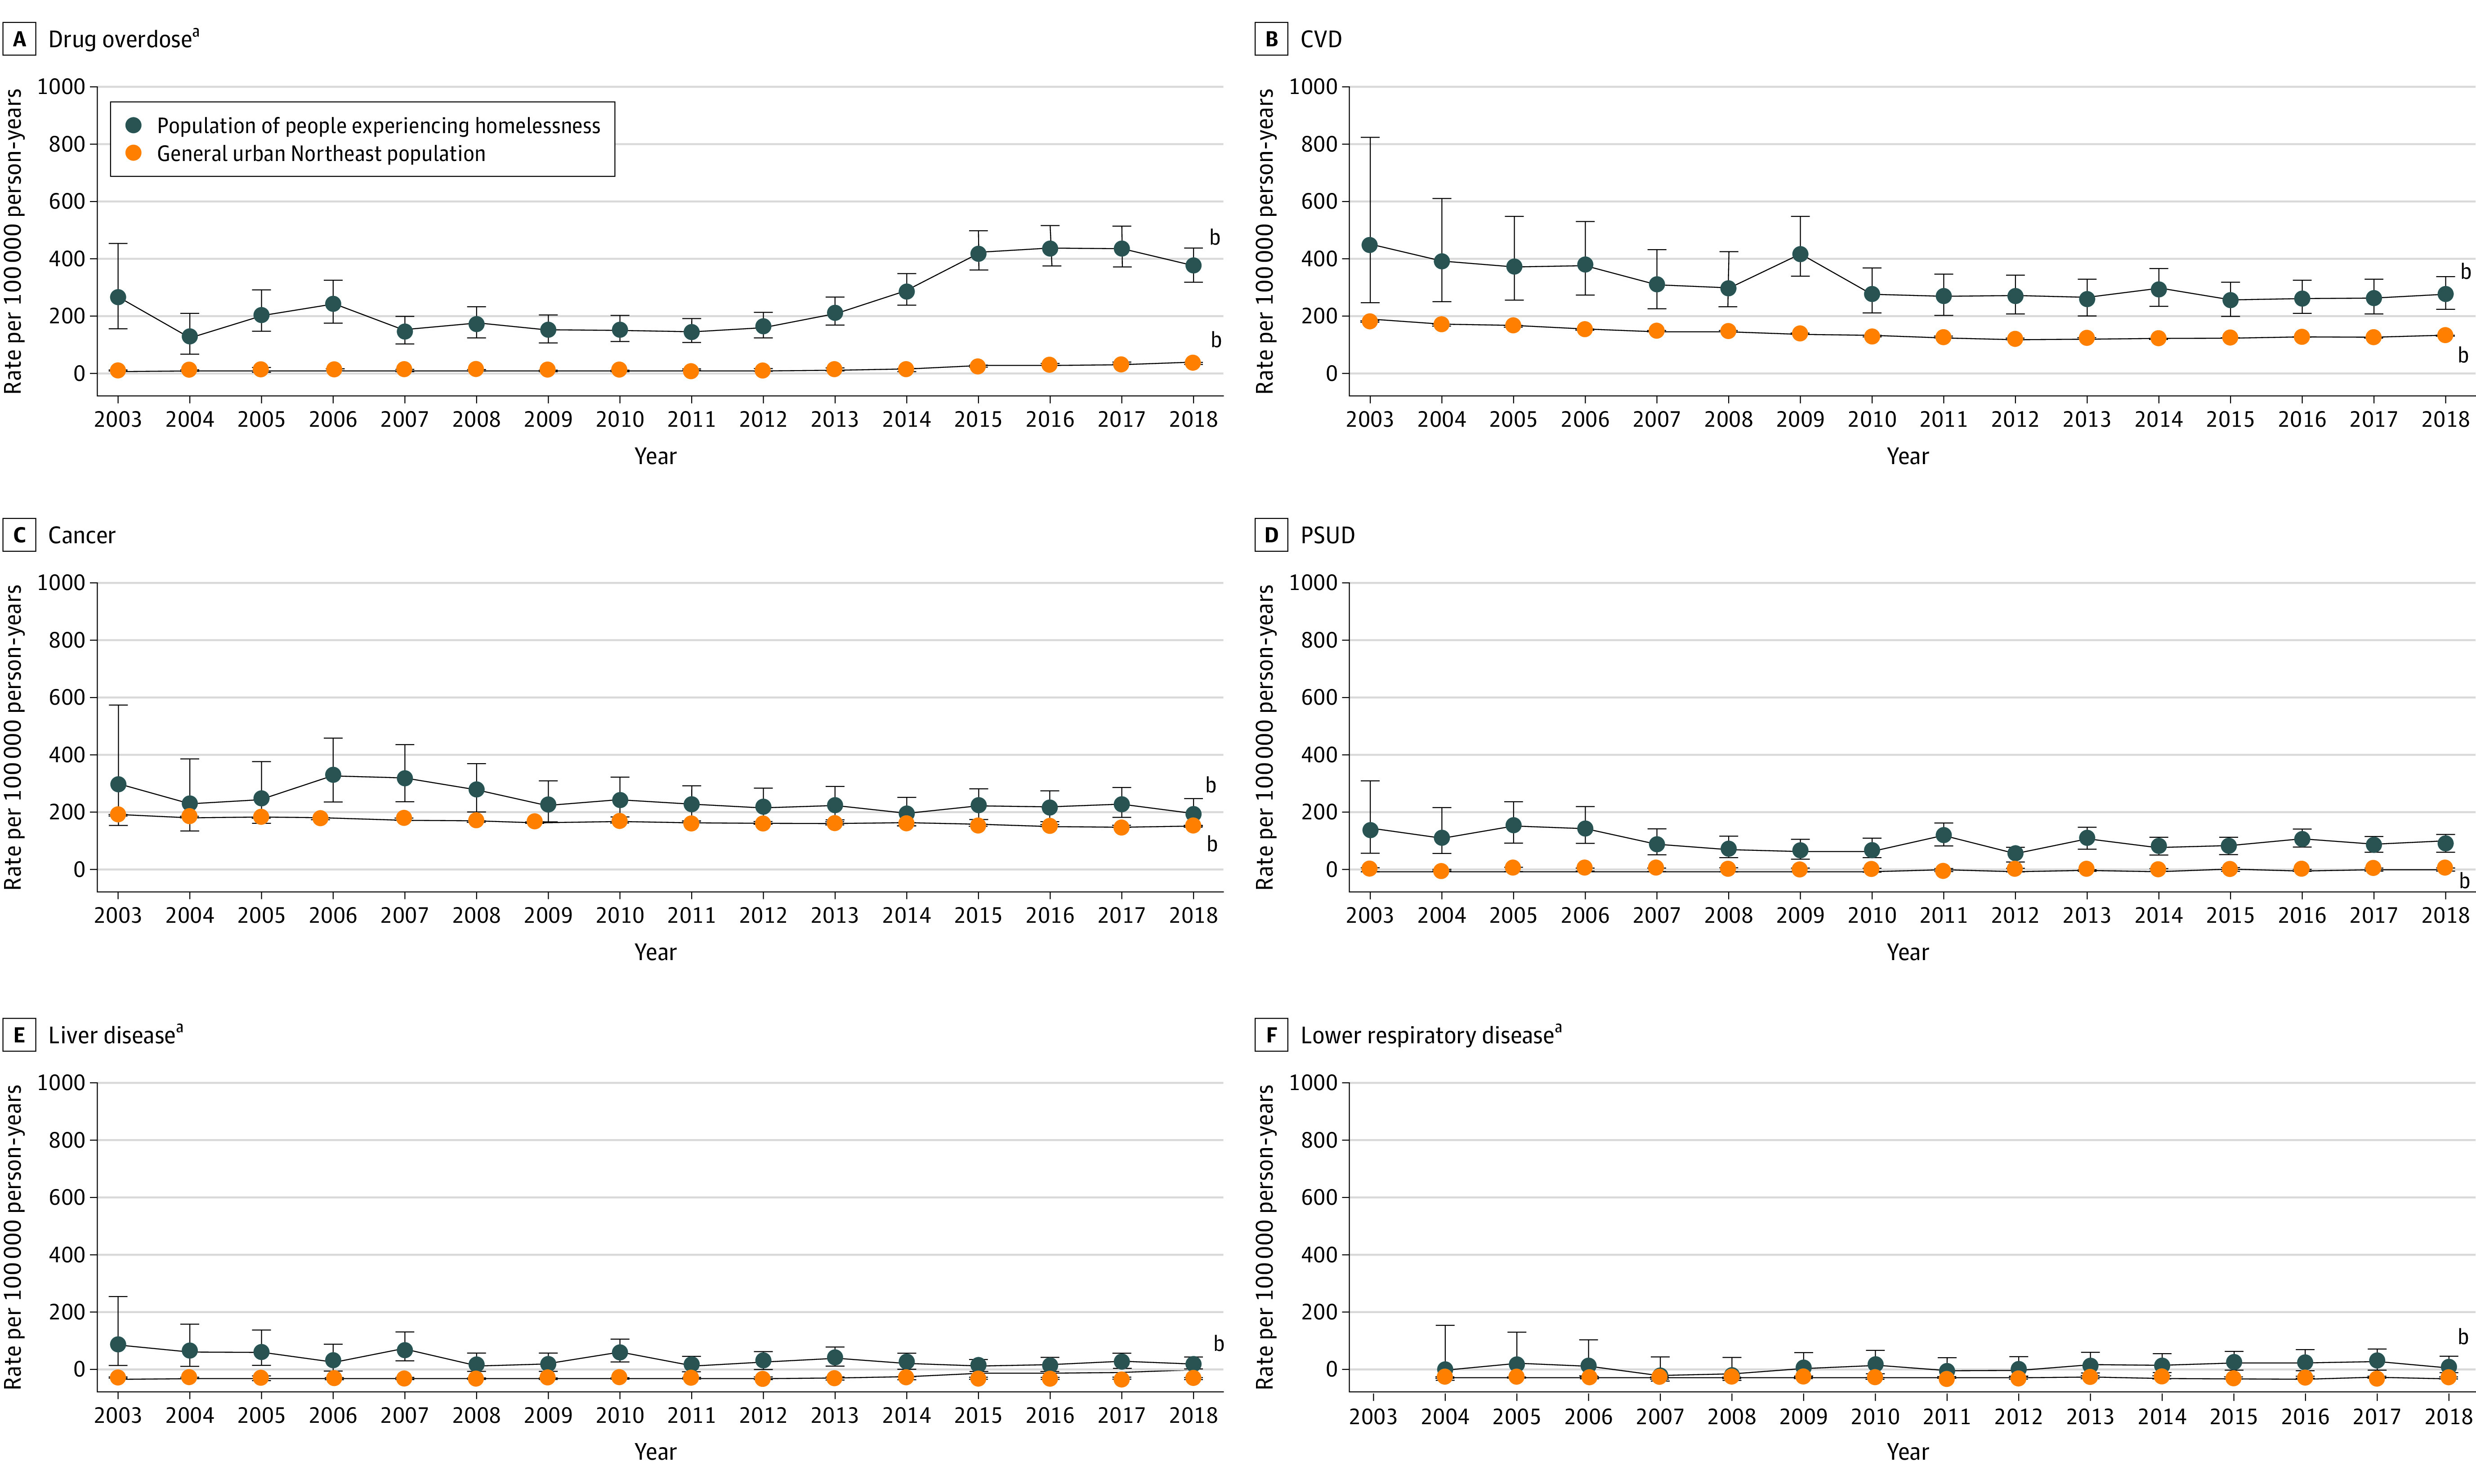
Annual age- and sex-standardized cause-specific mortality rates in the Boston Health Care for the Homeless Program Cohort and the urban Northeast US population. Vertical bars represent 95% CIs. CVD indicates cardiovascular disease; PSUD, psychoactive substance use disorders.
aThe average annual percent change between the 2 cohorts is significantly different (P < .05 for interaction).
bThe average annual percent change in the mortality rate is significantly different from 0 (P < .05 for interaction).
Discussion
In this study, the disparity in all-cause mortality between this large cohort of people experiencing homelessness and the general population widened over 16 years. Drug overdose mortality was a factor in this widening gap, illustrating that public health epidemics are often magnified among people experiencing homelessness.5 In addition, increases in chronic lower respiratory disease mortality underscore the need for measures to reduce the high prevalence of tobacco use among people experiencing homelessness.6 Temporal reductions in death from cardiovascular disease, liver disease, and cancer could reflect improvements in diagnostic and treatment strategies, although competing risk from increasing drug overdose mortality is another possible explanation. Although these specific trends may not be generalizable to homeless populations in other geographic locations, these findings highlight that policies tailored to meet the distinct needs of people experiencing homelessness are essential to reducing long-standing mortality disparities in this population.
eTable 1. International Classification of Diseases (ICD)-10 Codes for the Six Leading Causes of Death
eMethods. Additional Methodologic Details
Data Sharing Statement
References
- 1.Henry M, De Sousa T, Roddey C, et al. The 2020 Annual Homeless Assessment Report (AHAR) to Congress.; 2020. Accessed June 6, 2022. https://www.huduser.gov/portal/sites/default/files/pdf/2020-AHAR-Part-1.pdf.
- 2.Hwang SW, Orav EJ, O’Connell JJ, Lebow JM, Brennan TA. Causes of death in homeless adults in Boston. Ann Intern Med. 1997;126(8):625-628. doi: 10.7326/0003-4819-126-8-199704150-00007 [DOI] [PubMed] [Google Scholar]
- 3.Baggett TP, Hwang SW, O’Connell JJ, et al. Mortality among homeless adults in Boston: shifts in causes of death over a 15-year period. JAMA Intern Med. 2013;173(3):189-195. doi: 10.1001/jamainternmed.2013.1604 [DOI] [PMC free article] [PubMed] [Google Scholar]
- 4.Fine DR, Dickins KA, Adams LD, et al. Drug overdose mortality among people experiencing homelessness, 2003 to 2018. JAMA Netw Open. 2022;5(1):e2142676. doi: 10.1001/jamanetworkopen.2021.42676 [DOI] [PMC free article] [PubMed] [Google Scholar]
- 5.Fazel S, Geddes JR, Kushel M. The health of homeless people in high-income countries: descriptive epidemiology, health consequences, and clinical and policy recommendations. Lancet. 2014;384(9953):1529-1540. doi: 10.1016/S0140-6736(14)61132-6 [DOI] [PMC free article] [PubMed] [Google Scholar]
- 6.Baggett TP, Chang Y, Singer DE, et al. Tobacco-, alcohol-, and drug-attributable deaths and their contribution to mortality disparities in a cohort of homeless adults in Boston. Am J Public Health. 2015;105(6):1189-1197. doi: 10.2105/AJPH.2014.302248 [DOI] [PMC free article] [PubMed] [Google Scholar]
Associated Data
This section collects any data citations, data availability statements, or supplementary materials included in this article.
Supplementary Materials
eTable 1. International Classification of Diseases (ICD)-10 Codes for the Six Leading Causes of Death
eMethods. Additional Methodologic Details
Data Sharing Statement