

Abstract
Hypersynchronous neural activity is a characteristic feature of seizures. Although many Drosophila mutants of epilepsy-related genes display clear behavioral spasms and motor unit hyperexcitability, field potential measurements of aberrant hypersynchronous activity across brain regions during seizures have yet to be described. Here, we report a straightforward method to observe local field potentials (LFPs) from the Drosophila brain to monitor ensemble neural activity during seizures in behaving tethered flies. High frequency stimulation across the brain reliably triggers a stereotypic sequence of electroconvulsive seizure (ECS) spike discharges readily detectable in the dorsal longitudinal muscle (DLM) and coupled with behavioral spasms. During seizure episodes, the LFP signal displayed characteristic large-amplitude oscillations with a stereotypic temporal correlation to DLM flight muscle spiking. ECS-related LFP events were clearly distinct from rest- and flight-associated LFP patterns. We further characterized the LFP activity during different types of seizures originating from genetic and pharmacological manipulations. In the ‘bang-sensitive’ sodium channel mutant bangsenseless (bss), the LFP pattern was prolonged, and the temporal correlation between LFP oscillations and DLM discharges was altered. Following administration of the pro-convulsant GABAA blocker picrotoxin, we uncovered a qualitatively different LFP activity pattern, which consisted of a slow (1-Hz), repetitive, waveform, closely coupled with DLM bursting and behavioral spasms. Our approach to record brain LFPs presents an initial framework for electrophysiological analysis of the complex brain-wide activity patterns in the large collection of Drosophila excitability mutants.
Keywords: electroencephalogram, local field potential, synchronization, epilepsy, electroconvulsion, flight, dorsal longitudinal muscle
Introduction
Studies of the fruit fly Drosophila melanogaster have provided many invaluable insights into the genetic basis of nervous system function underlying behaviors (for review, see Sokolowski, 2001). Such neurogenetic analyses have helped to establish direct links from identified genetic mutations to alterations in nervous system physiology that lead to the behavior of interest. At the behavioral level, a variety of protocols ranging from relatively simple climbing assays (‘negative-geotaxis’) to more sophisticated video analysis of fly behavior have effectively identified and characterized specific abnormalities. In the same mutant flies, alterations in neuronal and synaptic physiology initially uncovered through analysis of peripheral neuromuscular junctions (Ikeda, Ozawa, & Hagiwara, 1976; Jan & Jan, 1976; Siddiqi & Benzer, 1976; Wu, Ganetzky, Jan, Jan, & Benzer, 1978), can provide clear readouts on the role of the genes in regulating membrane excitability and synaptic transmission. Recently, a growing number of studies have extended the cellular-level findings, first established in the peripheral nervous system, by studying central neuronal activity in vivo using patch-clamp recording from neuronal soma (Wilson, Turner, & Laurent, 2004; Worrell & Levine, 2008) and imaging with GCaMP or other genetically encoded fluorophores within individual or groups of identifiable neurons (Lemon et al., 2015; Streit, Fan, Masullo, & Baines, 2016; Wang, Wong, Flores, Vosshall, & Axel, 2003). In addition to these robust protocols established to study detailed behavioral and cellular physiological aspects, it is desirable to elucidate global features of ensemble neural activities across various brain regions during behavioral tasks or neurophysiological events.
Pioneered in humans and in other mammals nearly a century ago, electroencephalogram (EEG) techniques provide a readout of different waveforms associated with ensemble and aggregate neuronal activity in different brain regions (Berger, 1929 cited in Millett 2001, see also Adrian & Matthews 1934). EEG signals have found widespread application in revealing key characteristics of global ‘brain states’, such as wakefulness, non-REM and REM sleep (Britton et al., 2016), and have provided clear hallmarks of epileptiform and other pathophysiological forms of activity (Noachtar & Peters, 2009). In Drosophila, extracellular electrical recordings of activity across neuronal populations have yielded valuable information on sensory physiology, including: photoreceptors in the compound eye (via electroretinogram, Heisenberg 1971; Pak, 1975), olfactory receptor neurons in the antenna (via electroantennogram, Borst 1984; Ayyub, Paranjape, Rodrigues & Siddiqi, 1990; Alcorta, 1991), and mechanosensory transduction in the Johnston’s organ (Eberl, Hardy, & Kernan, 2000). A few studies have developed protocols for measuring local field potentials (LFPs) in the brain using glass microelectrodes (Ito, Bazhenov, Ong, Raman, & Stopfer, 2009; Nitz, Van Swinderen, Tononi, & Greenspan, 2002; Tanaka, Ito, & Stopfer, 2009) or multi-electrode arrays (Paulk, Zhou, Stratton, Liu, & van Swinderen, 2013), focusing on central sensory processing (Paulk, Kirszenblat, Zhou, & van Swinderen, 2015; van Swinderen, 2007), or differentiating between rest, activity and sleep states (van Alphen, Semenza, Yap, van Swinderen, & Allada, 2021; van Swinderen, 2006; Yap et al., 2017).
In this report, we describe an approach for observing LFP signals from an anatomically specified locus that is suitable for monitoring global electrical activity in the brain during seizures. We found the high-frequency stimulation protocol, that induces electroconvulsive seizures (ECS), produced a characteristic LFP activity pattern temporally correlated with the previously-described repertoire of flight muscle (DLM) motor unit discharges and behavioral spasms. Furthermore, LFP activities during rest or flight could be readily distinguished from the seizure-related LFP signals. In the hyperexcitable voltage-gated sodium (NaV) channel mutant bangsenseless (bss, (Ganetzky & Wu, 1982; Parker, Padilla, Du, Dong, & Tanouye, 2011), which displays a lower ECS threshold and extreme sensitivity to mechanical shock (Lee & Wu, 2002), we found clear temporal alterations in the ECS-associated LFP activity. We further contrasted ECS activity to proconvulsant-evoked spasms by characterizing the LFP activity, demonstrating a unique seizure pattern following injection of the GABAA blocker picrotoxin (PTX). There is a large collection of epileptic Drosophila mutants with well-characterized behavioral and electrophysiological phenotypes. Our study provides a first glimpse of a readily accessible brain-wide quantitative signal that can add a new dimension for distinguishing seizure sub-types.
Materials and Methods
Fly Stocks
The WT strain Canton-S (CS) and bang-sensitive mutant bangsenseless (bss) are part of the Wu Lab’s collection, and are described in Ganetzky & Wu (1982). All flies were reared at room temperature (~22 °C) on Frankel & Brosseau’s cornmeal media (1968, see also Kasuya et al., 2019). Flies aged four to seven days were used for recordings.
Electrophysiology
The tethered fly preparation employed has been described elsewhere (Engel & Wu, 1992; Iyengar & Wu, 2014). Briefly, flies were immobilized on ice, affixed to a tungsten pin with cyanoacrylate glue (Aaron Alpha Type-203TX), and allowed approximately 30 min to recover. Flies were given a polystyrene ball (~4 mm dia.) to hold and ‘walk’ on during rest periods. Flight activity was induced by gentle air-puffs (see Iyengar & Wu, 2014 for details).
Flight muscle spikes were monitored by an electrolytically sharpened tungsten electrode inserted into the top-most dorsal longitudinal muscle (DLM) fiber (#45a A. Miller, 1950). A similarly constructed tungsten electrode inserted into the dorsal abdomen served as the reference. Signals were picked up by an AC amplifier (gain: 100x, bandwidth: 1.0 Hz – 10 kHz, AM Systems Model 1800). Electroconvulsive stimulation was delivered following protocols from Lee & Wu (2002). Sharpened tungsten stimulation electrodes were inserted into each cornea (anode in right eye). An isolated pulse stimulator (AM systems Model 2100) generated a 2-s train of 80-V stimuli (0.1-ms duration) at 200 Hz to trigger the ECS discharge repertoire. The stimulation parameters approximately correspond to 1.5x threshold intensity based on previous work (Iyengar & Wu, 2014; Lee & Wu, 2006).
Field potentials were recorded through a low-resistance glass electrode (tip diameter: ~ 2 μm, resistance: < 1MΩ) pulled from filamented borosilicate glass tubing (1 mm OD, 0.58 mm ID, AM systems) with a Brown-Flamming type electrode puller (Sutter P87). These glass electrodes were filled with an adult hemolymph-like saline (108 mM NaCl, 5 mM KCl, 2 mM CaCl2, 8.2 mM MgCl2, 4 mM NaHCO3, 1 mM NaH2PO4, 10 mM sucrose, 5 mM trehalose, 5 mM HEPES, adjusted to pH 7.5 with NaOH, see Wang et al., 2003). The electrode insertion site was aimed at the center of the three orbital bristles (Figure 1B; see Ferris, 1950), and the electrode was advanced beyond the cuticle until a stable electrical signal was observed (~25–50 μm). During LFP recordings, the abdominal electrode and stimulation electrodes were held at isopotential to each other and served as reference. Field potentials were amplified by a Grass P15 amplifier (gain: 1000x, bandwidth: 0.1 Hz – 10 kHz).
Signal Processing and Statistics
For computer-assisted data analysis, DLM spikes and LFP signals were acquired by a USB 6212 data acquisition card (sampling rate: 20 kHz, National Instruments) controlled by a custom-written LabVIEW 2018 script (National Instruments). LFP waveforms were analyzed offline using MATLAB (r2019a) software, including the following procedures. To reduce stimulation-related artifacts, signals were passed through a zero-phase high-pass Butterworth filter (1.0 Hz cutoff, 80 dB attenuation at 0.5 Hz, implemented via the filtfilt function). To reduce 60 Hz-related line nose, the signal was then passed through notch filters centered at 60 Hz and the 120 Hz harmonic (± 3 Hz width, 80 dB attenuation). Short-time FFT spectrographs were constructed between 1 and 55 Hz (at 0.5 Hz intervals) using the spectrogram function (FFT window width: 1 s, 80% overlap with adjacent windows). Power spectral densities were calculated using the periodogram function (0.5 Hz frequency bin width). In Figure 2E, normalized power, PN, at a particular frequency, f, was defined as the fraction of power at a particular frequency within the total power across the 1–55 Hz band, i.e. PN (f) = P (f) / Σ P (f). All statistical analyses were conducted in MATLAB.
Pharmacology
The rapid, systemic drug injection protocol in the tethered fly preparation is described in Lee, Iyengar & Wu (2019) and was adapted from a dorsal vessel (DV) injection protocol for restrained flies (Howlett & Tanouye, 2013). We utilized a filamented glass electrode similar to the LFP recording electrodes described above, which was filled with solution of the drug of interest dissolved in adult hemolymph-like saline marked with blue #1 dye (16 mg/ml). To inject the solution, the electrode tip was broken and inserted into the DV (see Miller 1950). Positive air pressure, controlled manually through a syringe, pushed the solution (0.33 μL, see Lee et al., 2019) into the DV, and the circulatory system rapidly (~10 s) perfused the dyed drug solution.
The nicotinic acetylcholine receptor (nAChR) blocker mecamylamine and GABAA receptor blocker picrotoxin (PTX) were obtained from Sigma Aldrich (Cat#: M9020, P1675 respectively). The voltage-gated sodium channel blocker tetrodotoxin (TTX) was acquired from Cayman Chemical (Cat#: 14964). The concentrations of MEC and TTX were determined empirically to block giant-fiber transmission (1000 and 300 μM respectively). The PTX at the dosage of 100 μM caused a robust sequence of spasms described in Lee et al. (2019).
Results
LFP signals during rest, flight, and electroconvulsive seizure
To record field potentials from the brains of behaving flies, we adopted a tethered fly preparation (Figure 1A, see also Engel & Wu, 1992; Iyengar & Wu, 2014) originally developed to record spiking activity in a set of large indirect flight muscles, the dorsal longitudinal muscle (DLMs). During flight, the DLMs undergo isometric stretch-activated contractions at the wing-beat frequency (~200 Hz), with asynchronous spikes (~5 Hz) facilitating Ca2+ influx requisite for contraction (Dickinson & Tu, 1997; Gordon & Dickinson, 2006). Besides flight, several motor patterns drive DLM spiking, including escape (Tanouye & Wyman, 1980), grooming (Lee et al., 2019), courtship (Ewing, 1977), and seizure activity (Lee & Wu, 2002; Pavlidis & Tanouye, 1995). To measure brain field potentials in this preparation, we inserted a stubby, low-resistance (< 1 MΩ) glass electrode (“probe electrode”) filled with adult hemolymph-like saline (Wang et al., 2003) into the head at the recording site (Figure 1A). The three orbital bristles served as landmarks to guide electrode insertion (Figure 1B), and the electrode was advanced through the cuticle until we observed a stable potential in the brain (~ 25– 50 μm). It should be noted that the recorded signal is presumably a complex representation of the electrical activity with different major and minor contributions from various body parts between the probe and reference electrodes (tungsten electrodes inserted into each cornea and into the abdomen). Following conventional nomenclature (Buzsáki, Anastassiou, & Koch, 2012), we refer to the signals picked up in this configuration as local field potentials (LFP). In this preparation, it is straightforward to correlate the LFP with DLM spike patterns associated with different motor programs by using an additional tungsten electrode inserted into the muscle fiber.
Figure 1.
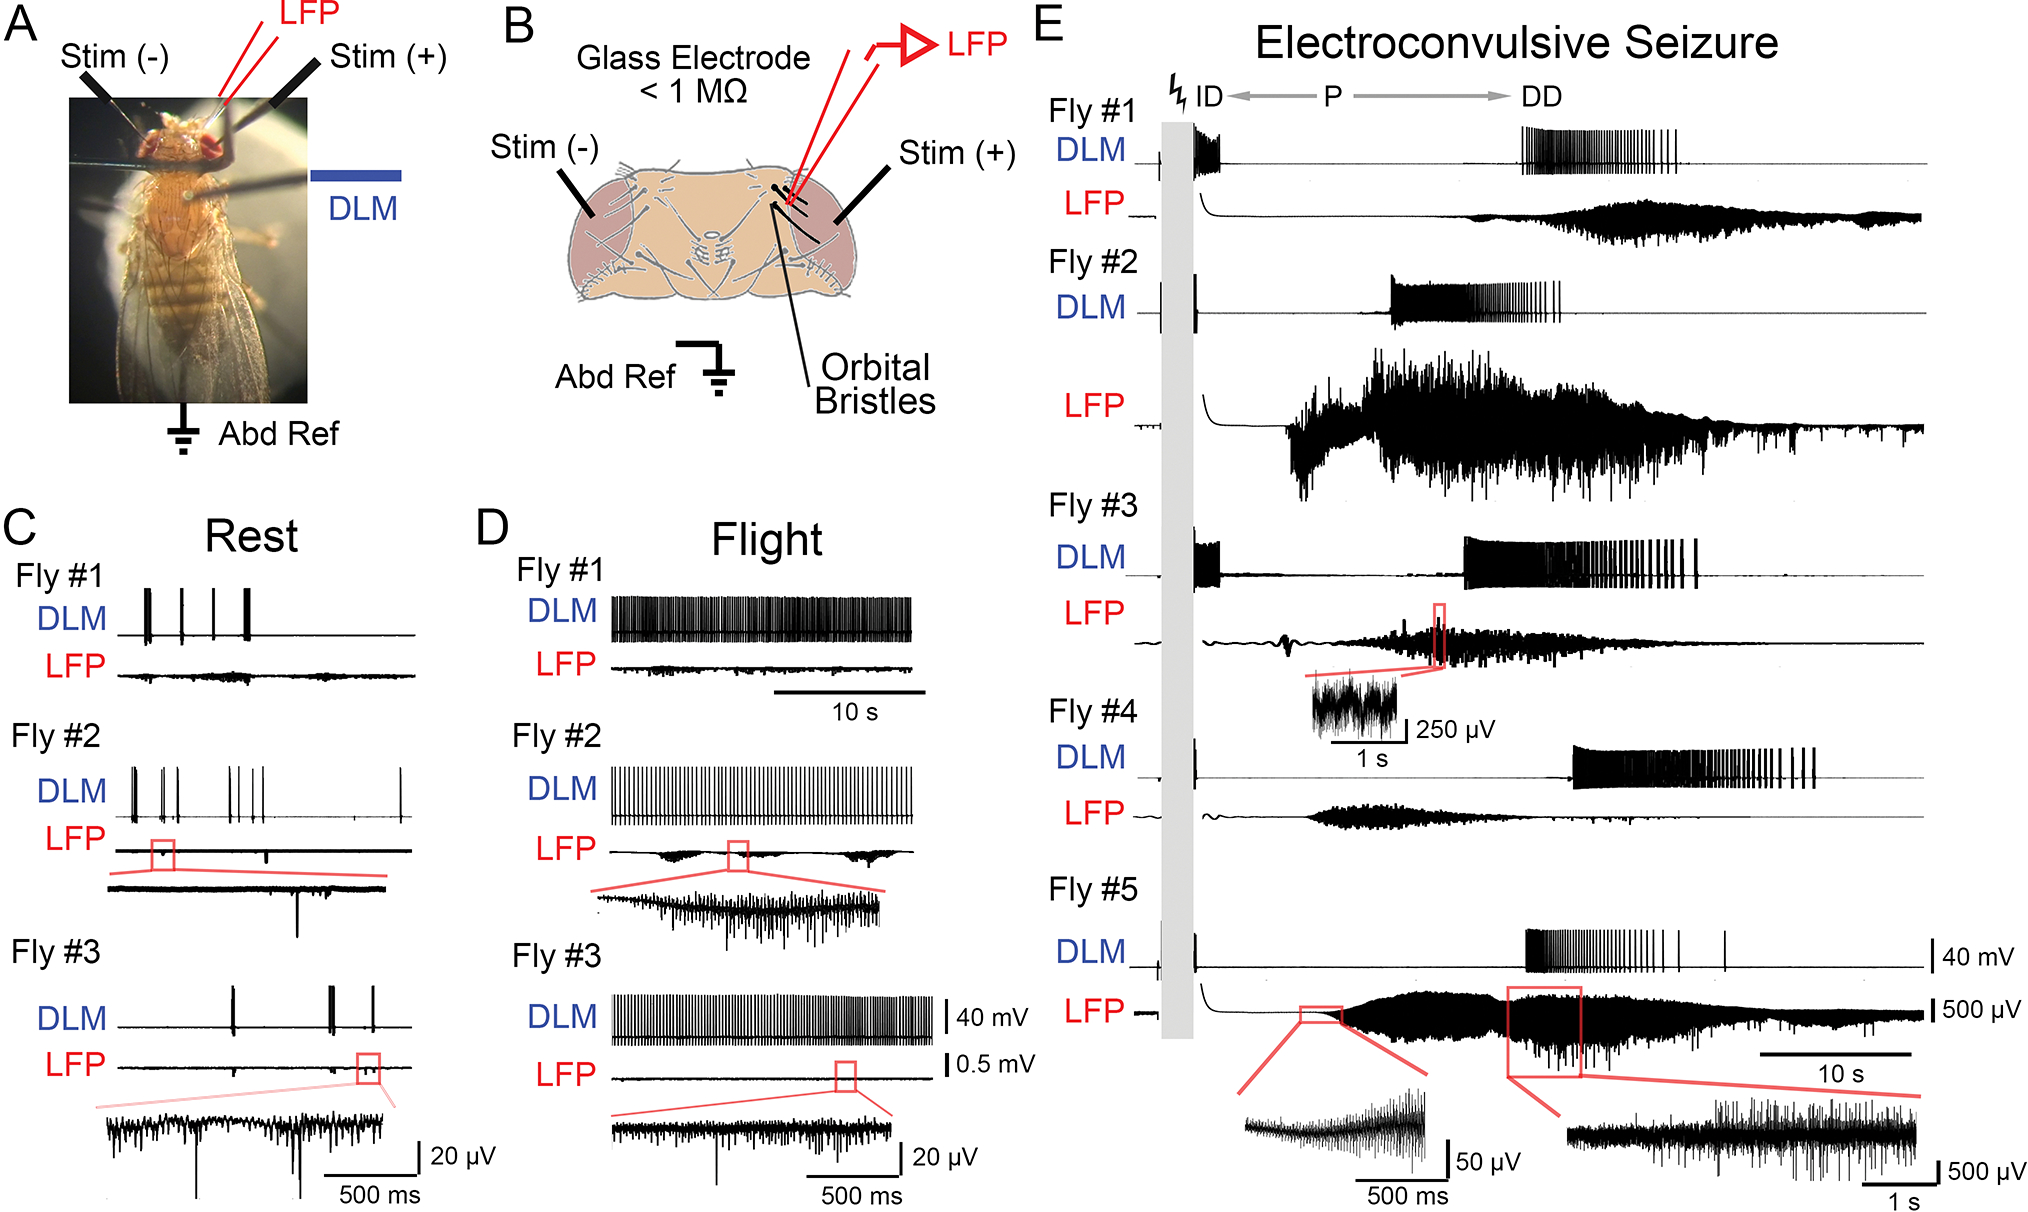
Local field potential measurements in the Drosophila brain during rest, flight and electroconvulsive seizures (ECS). (A) Photograph of the tethered fly preparation, with the fly holding a polystyrene ball. The glass microelectrode monitoring local field potential (LFP, red), the tungsten electrode for DLM recording (DLM, blue), isolated stimulation electrodes (Stim (+) and Stim (−), black) across the brain, and abdominal reference electrode (Abd Ref, black) are indicated. (B) Position of the LFP electrode insertion site between the three orbital bristles (bolded in black, drawing adapted from Ferris, 1950). During LFP recording, both stimulation electrodes are grounded as local current sinks. (C-D) Representative traces of DLM spiking and corresponding LFP activity from three flies resting on a polystyrene ball (C) and flying (D, after dropping the ball). DLM spikes during rest correspond with bouts of grooming activity. Portion of LFP trace from Fly #2 and #3 boxed in red are expanded below the respective traces. (E) DLM spiking and LFP activity during the ECS repertoire. High-frequency, high-intensity stimulation (grey bar, 80 V, 0.1-ms stimuli at 200 Hz for 2 s, see Methods) triggers a stereotypic ECS spike discharge pattern in DLM activity: an initial spike discharge (ID) followed by a paralysis period (P), a delayed spike discharge (DD), and eventual fly recovery. Traces of corresponding LFP activity are shown. For Fly #3 and #5, portions of the LFP trace are expanded below. Note the marked increase in LFP amplitude during ECS, compared to rest and flight.
We first observed LFP and DLM signals corresponding to two behavioral states: rest and flight. During rest periods, flies held onto or ‘walked’ on a polystyrene ball and periodically groomed themselves. DLM activity during these periods was quite sparse, with brief bouts of spiking closely corresponding with grooming-related wing depression events (c.f. Lee et al., 2019). The corresponding LFP activity was largely consistent with previous reports (Nitz et al., 2002), characterized by signals reaching 2–10 μV amplitude (RMS average, variable across flies presumably reflecting current density and electrode positioning) with superimposed sharp spike-like waves of variable size (Figure 1C). Notably, the LFP signal appeared to loosely correlate with grooming behaviors and related DLM spiking, with transient periods of increased LFP amplitude occasionally observed during periods of no DLM spiking.
A gentle air-puff would initiate a startle response during which the fly dropped the ball and displayed sustained flight (operationally defined to be > 30 s, Iyengar & Wu, 2014), while the DLM spiked rhythmically at ~5 Hz. During flight bouts, the LFP signal was qualitatively distinct from rest period signals, displaying an increased in amplitude (~30 μV RMS average) with more frequent bouts of prolonged spiking activity (Figure 1D). Thus, the LFP signal indeed provides clear indications for distinguishing brain state changes between rest and flight.
High-frequency (200 Hz) electrical stimulation across the brain triggers ECS discharges in flies (Pavlidis & Tanouye, 1995). As shown in Figure 1E, following a 2-s stimulation train, a distinct sequence of seizure activity consisting of behavioral spasms accompanied by DLM spike discharges are recruited: an initial discharge (ID), followed by a period of paralysis (P), a delayed discharge (DD), and eventual recovery (cf. Lee & Wu, 2002). Immediately following electroconvulsive stimulation, the LFP remained remarkably quiet for several seconds during the paralysis phase. As the ECS repertoire progressed, before DD onset, a general pattern emerged: the LFP signal grew by an order of magnitude or more (from ~5 μV to ~200 – 1,500 μV RMS) and these enhanced oscillations continued through the DD period. Following the DD initiation, we often observed prolonged bouts of sharp spiking events in the LFP of millivolt-magnitude (see enlarged traces, Figure 1E). Subsequently, the amplitude of the LFP signal gradually decreased, over several tens of seconds to reach baseline levels. The exact temporal correlation between the LFP oscillations and DD spiking may vary among different experiments, as the ECS-evoked DLM spiking parameters reflect thoracic ganglion driven activity (Lee & Wu, 2002) whereas the LFP events are confined to the head. Taken together, these observations provide a robust read-out of central hyper-excitability and hyper-synchronicity which give rise to these large amplitude extracellular field signals that accompany the behavioral and motor unit activity sequence recruited by electroconvulsive stimulation.
Frequency-domain characteristics of the LFP signal during rest, flight and the ECS discharge repertoire
To examine the frequency components that composed the LFP signal during the respective motor activities, we applied the Short-Time Fourier Transform (stFFT, over 1-s windows, see Methods) to construct spectrograms across a frequency range (1 – 55 Hz, representative spectrograms shown in Figure 2A–B). Across the population, we found the total LFP power over the frequency range during ECS discharges was considerably greater than the power during flight or rest (Figure 2C, median values of −32.1, −47.7 and −61.9 dB mV2 respectively). Consistent with previous reports (Nitz et al., 2002), we found the LFP signal during rest displayed increased power in the 1–10 Hz range compared to other frequencies (Figure 2D). Notably, this trend remained true during the flight and ECS discharge activities, in spite of the broad ‘up-shift’ in the power spectrum curve observed. When normalized to total power (Figure 2E, see Methods for computational details), the power spectrum curves during the three motor activities displayed similar inverse-frequency scaling (P ∝ 1/f n) as reported for brain field potentials from a wide range of species (Buzsáki et al., 2012). Linear regression of the log-transformed spectra indicated values of n ranging from 0.72 – 1.05 across the 1 – 55 Hz band width (Supplemental Figure 1).
Figure 2.
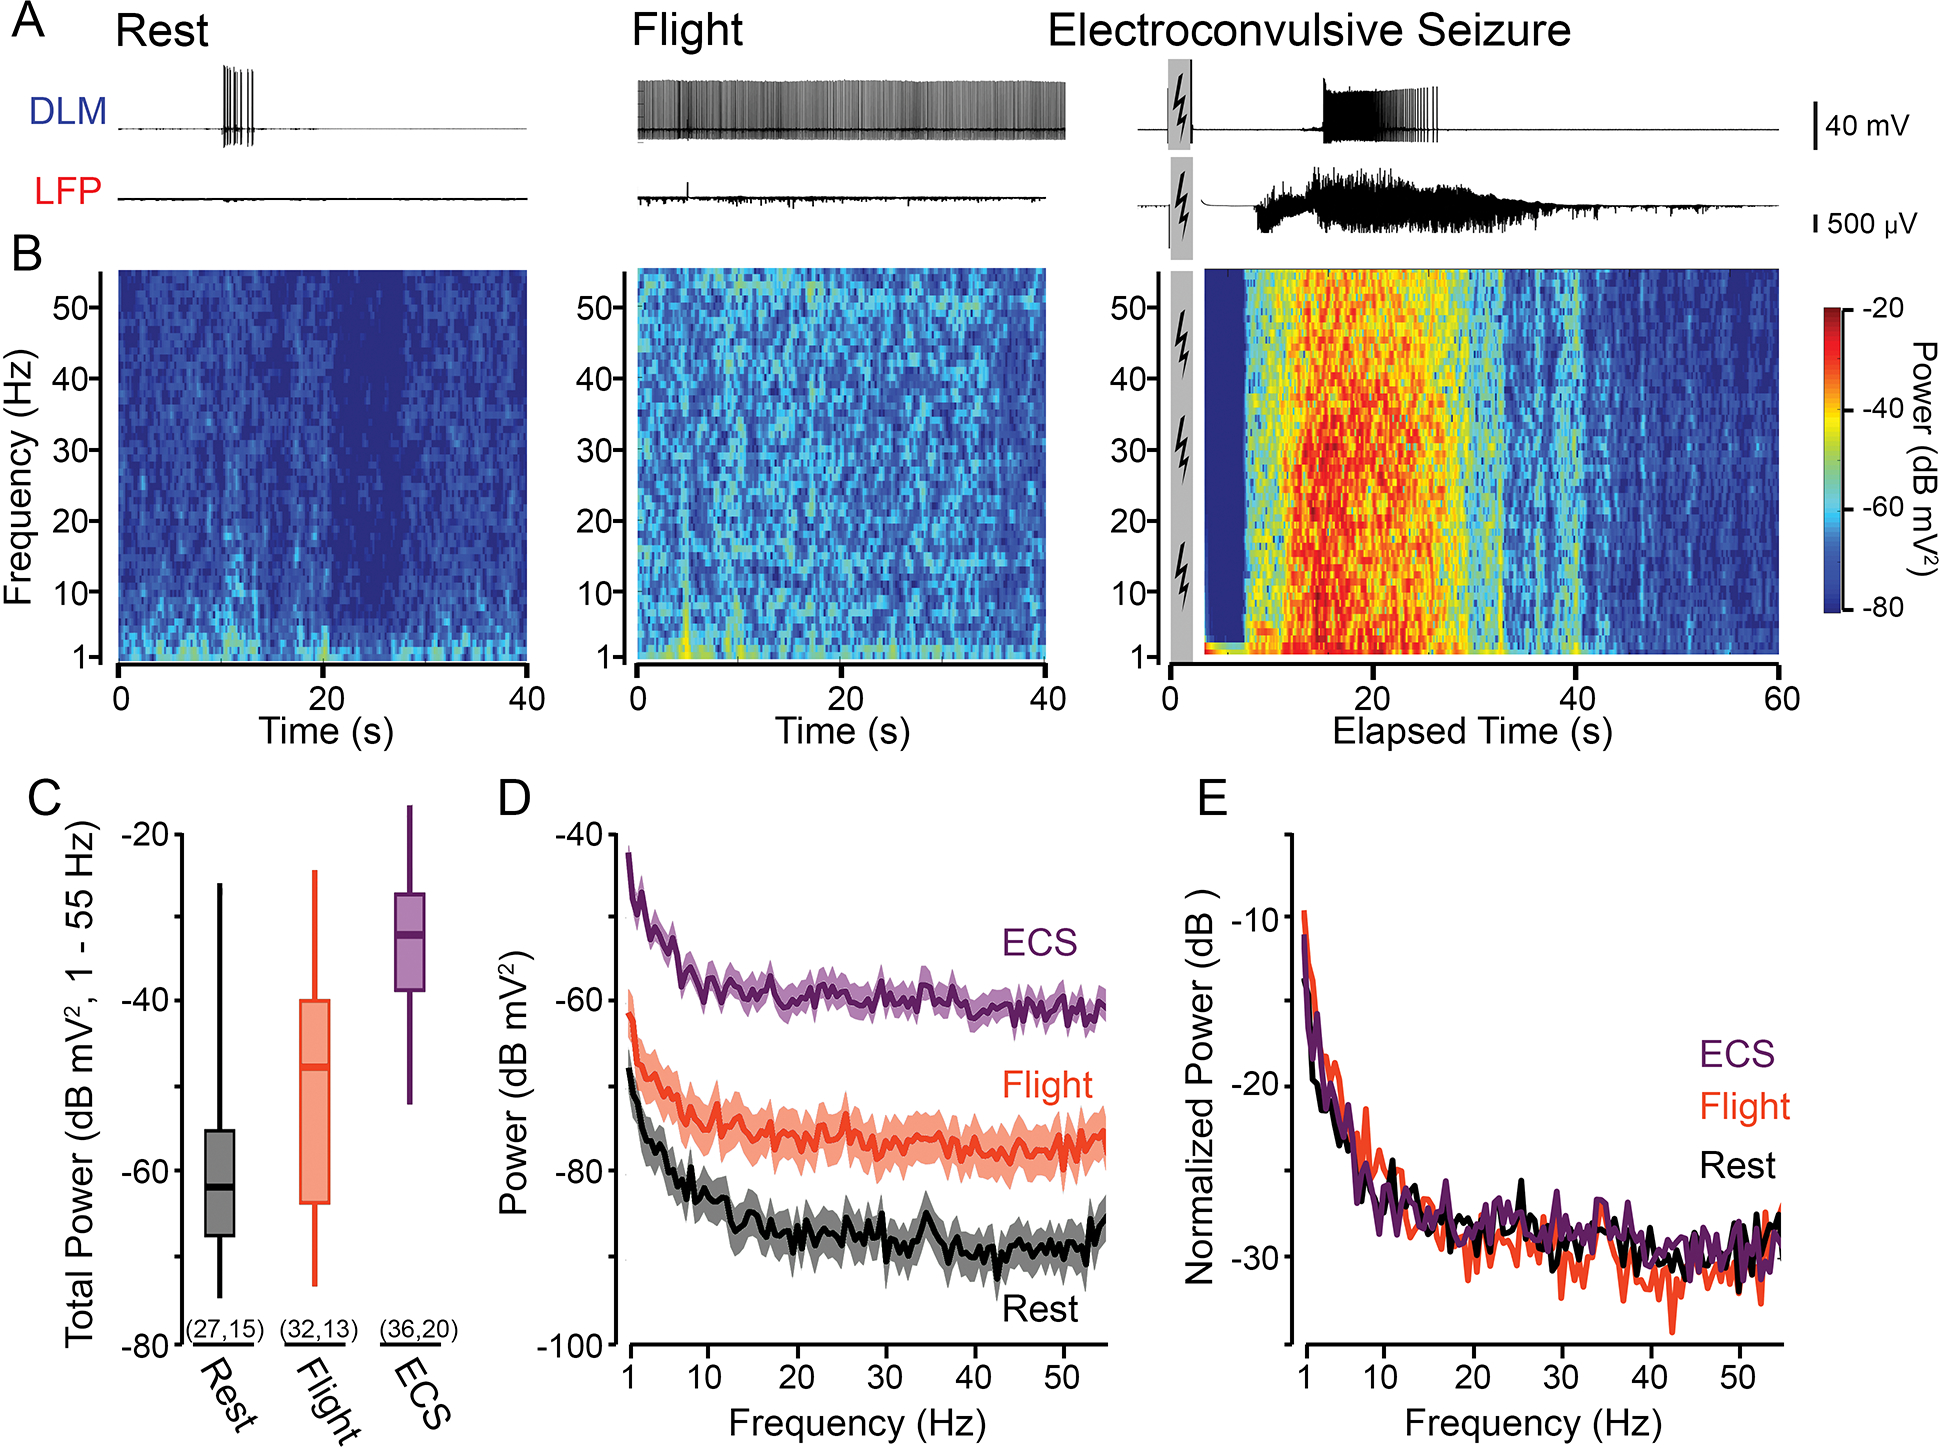
Frequency-domain characteristics of LFP activity related to different behavioral states. (A) Representative traces of DLM spiking (upper traces) and LFP activity (lower traces) during rest, flight and ECS. Grey box denotes the period of electroconvulsive stimulation (ECS trace corresponds to Fly #2 in Figure 1E). (B) Short-time FFT spectrograms corresponding to the LFP activity traces in (A). Window width = 1 s, 80 % overlap between adjacent windows; see Methods for further details. (C) Box plot of the total power in the 1 – 55 Hz range during the respective behavioral states. Boxes represent the 25th, 50th, and 75th percentiles; whiskers the 5th and 95th percentile. Sample sizes in parenthesis indicate the number of trials (left) and flies (right). (D) Averaged FFT spectrogram across all samples of LFP recordings shown in (C) for the respective behavioral states. Solid line indicates the average power across the frequency range; shaded region, SEM. (E) Normalized power, defined as the frequency-specific power divided by the total power (over the 1– 55 Hz range), for the respective behavioral states (see Methods).
Pharmacological manipulation of the LFP signal: effects of blocking NaV channels or cholinergic neurotransmission
The LFP signal we observed was likely a product dominated by brain field potentials, with some other bioelectric phenomena (e.g., heart beats) and system noise picked up between the recording and reference electrode. To identify the origins of LFP signals, we sought to determine how activity patterns were altered by blocking action potential propagation or synaptic transmission. Using a dorsal vessel (DV) drug injection technique (Howlett & Tanouye, 2013; Lee et al., 2019), we systemically applied the NaV channel blocker tetrodotoxin (TTX), or the nicotinic acetylcholine (ACh) receptor blocker mecamylamine (MEC). Within seconds of injection of TTX, we observed behavioral paralysis coupled with elimination of grooming or flight activity, and the failure of giant-fiber pathway, i.e. brain-stimulation failed to evoke single DLM spikes or ECS discharges. Remarkably, MEC injection led to a comparable effect. Following TTX or MEC administration, the LFP signals were decreased in power to a similar extent (Figure 3A). Both treatments abolished LFP spiking events (Figure 3A), and across the frequency range examined, the signal power was attenuated by ~ 20 dB (Figure 3B, note that the pre-injection spectra are comparable to the rest-associated spectra in Figure 2D). The results demonstrate that TTX-sensitive NaV channel-driven brain activities generate the predominant component of the LFP signal recorded. Notably, MEC blockade of nAChR also achieved a similar level of LFP attenuation. As in other insects, it is known that ACh is the primary excitatory neurotrasmitter in the Drosophila central nervous system (Salvaterra & Kitamoto, 2001). It is also known that synaptic potentials are more effectively picked-up by extracellular field potential recordings than Na+ action potentials (Lopes da Silva & Van Rotterdam, 2005). Our data provide an independent line of evidence for a major role of cholinergic system in maintaining the basal brain activity as monitored by our LFP protocol.
Figure 3.
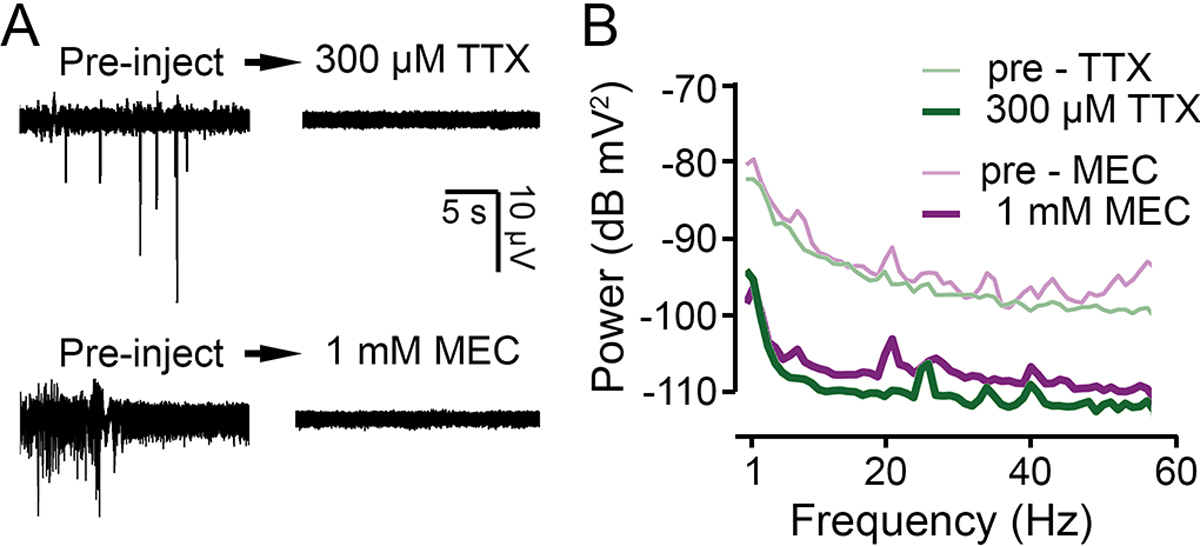
Pharmacological suppression of the LFP signal. (A) LFP traces before and after systemic application of the NaV channel blocker tetrodotoxin (TTX) and the nAChR blocker mecamylamine (MEC) via dorsal vessel injection. Robust effects were observed within seconds, and the traces shown represent the end-point state (achieved ~ 2 – 4 min). (B) Power spectra of the LFP signals (computed over a 120 s period) before (thin lines) and after injection (thick lines) of MEC (purple) and TTX (green).
LFP characteristics in bss, a ‘bang-sensitive’ mutant
As an initial exploration of the seizure-associated brain dynamics in hyperexcitable Drosophila mutants, we examined LFP oscillations during ECS discharges in the ‘bang-sensitive’ mutant allele bangsenseless (bss, Ganetzky & Wu, 1982), a gain-of-function allele of para (Parker et al., 2011), the sole NaV channel gene in Drosophila (Loughney et al., 1989). Upon mechanical shock (e.g. vortexing), bss mutants display a striking repertoire of paralysis and vigorous spasms (see Burg & Wu, 2012). With the ECS protocols, these mutants display a decreased threshold to evoke the DLM spike discharge (Pavlidis & Tanouye 1995) along with signficantly prolonged paralysis interval between the ID and DD (Lee & Wu, 2002). Using the same stimulation protocol for bss and the WT counterparts (see Methods), we monitored LFP activity during the ECS discharge sequence. Figure 4A shows LFP oscillations accompanied the DLM spike discharges in bss flies. Both bss and WT flies displayed similar oscillation frequency characteristics, consisting of a broad increase in power across the 1 – 55 Hz band, but over different timespans (cf. Figure 2B). The episodes of bss LFP oscillations were substantially longer than WT individuals (Figure 4C, 87.0 ± 18.4 vs 54.6 ± 5.4 s), corroborating timing differences in the DLM spiking repertoire described previously (Lee & Wu, 2002; 2006). Furthermore, we noted a qualitative distinction between bss mutants and WT counterparts in that the LFP signal largely waned prior to DD onset in bss mutants (Figure 4A), while in most WT individuals, the major LFP power overlapped with DD episodes, suggesting a modification of the coupling between circuits driving the LFP and DLM spiking.
Figure 4.
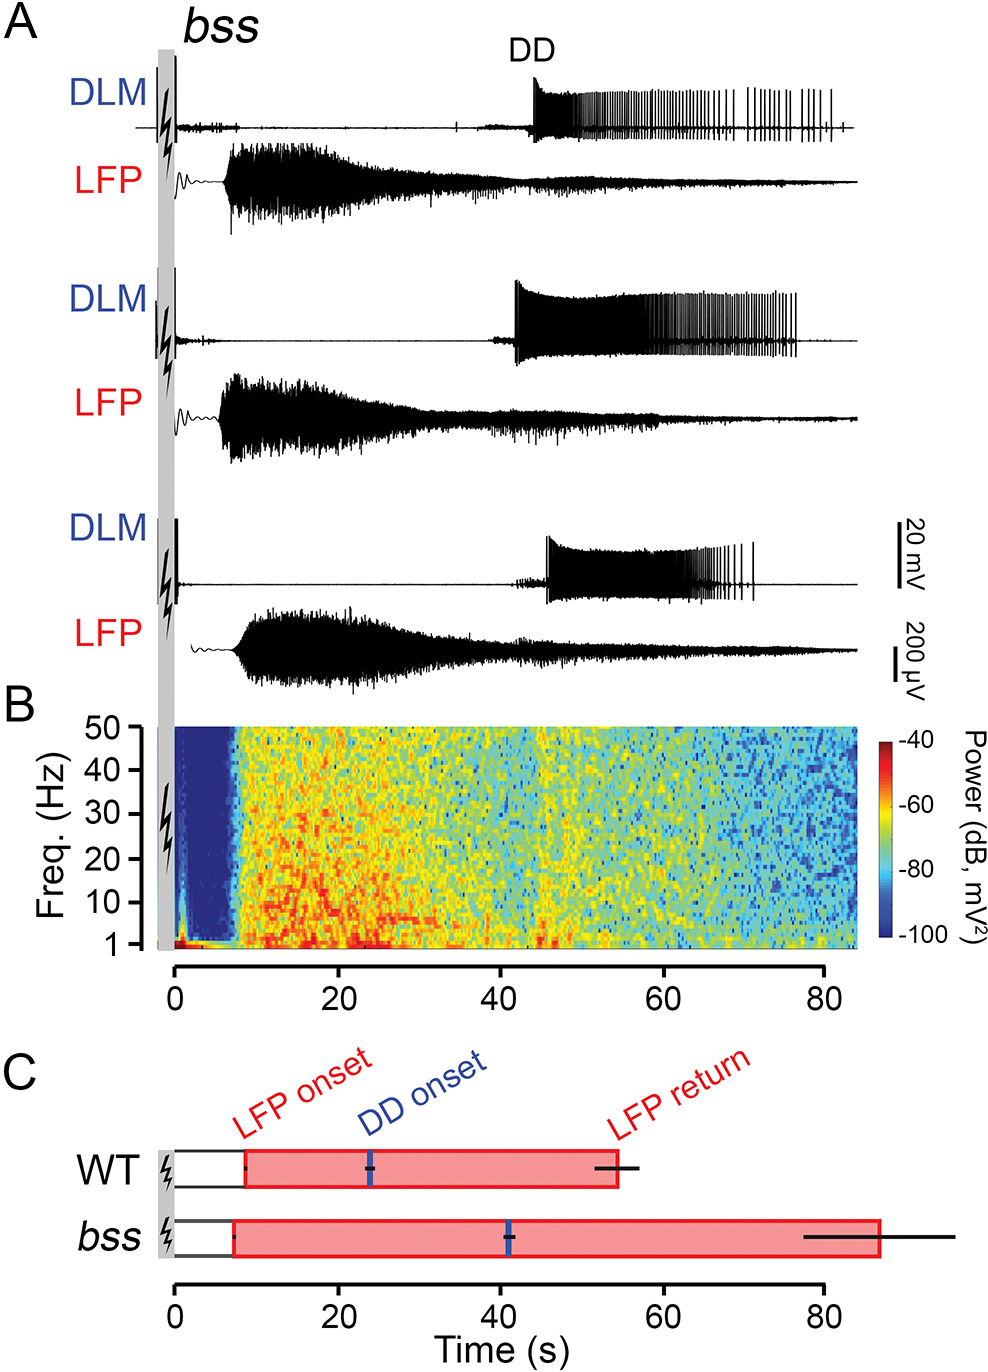
Modifications of the ECS repertoire in bss, a hyperexcitable, bang-sensitive mutant. (A) Representative traces of DLM spiking (upper traces) and corresponding LFP activity (lower traces) from three bss flies (ECS induction parameters same as Figure 1). (B) Power spectrogram corresponding to the LFP trace directly above in panel (A), constructed in the same manner as Figure 2B. (C) Bar graphs of LFP onset, LFP cessation (shaded pink bar) and DD onset (blue tick) in WT flies compared to bss mutants. Note the prolonged LFP signal and delayed DD onset compared to WT flies (cf. Figure 1C). Error bars indicate S.E.M, number of flies as indicated.
LFP oscillations associated with picrotoxin-induced convulsions
Administration of the GABAA receptor antagonist picrotoxin (PTX) via feeding or injection through the dorsal vessel (DV) triggers a pattern of convulsions and stereotyped DLM spike bursts qualitatively distinct from ECS discharge repertoire (Lee & Wu, 2002, Lee et al., 2019). Through monitoring the LFP signal, we identified brain activity patterns induced by PTX. Following DV injection, the LFP signal displayed a sequence of distinct types of oscillations. Within minutes, a stable activity pattern emerged, exhibiting rhythmic depolarization events that coincided with DLM spike bursts and behavioral spasms, which were different from both the rest (pre-injection) state and ECS discharges (Figure 5A vs Figure 2A). Characteristically, LFP activity spectrograms showed strong increases in power around 1 Hz, which corresponded to the DLM burst frequency, while power at higher frequencies remained largely unaltered (representative spectrograms shown in Figure 5B). Thus, the PTX-induced LFP activity reflects a high degree of synchronization correlation between brain activity (LFP waves), motor unit bursting and behavioral spasms. These observations further delineate the proposed distinctions between the modes of seizure activity associated with GABAA blockade and ECS (Lee et al. 2019).
Figure 5.
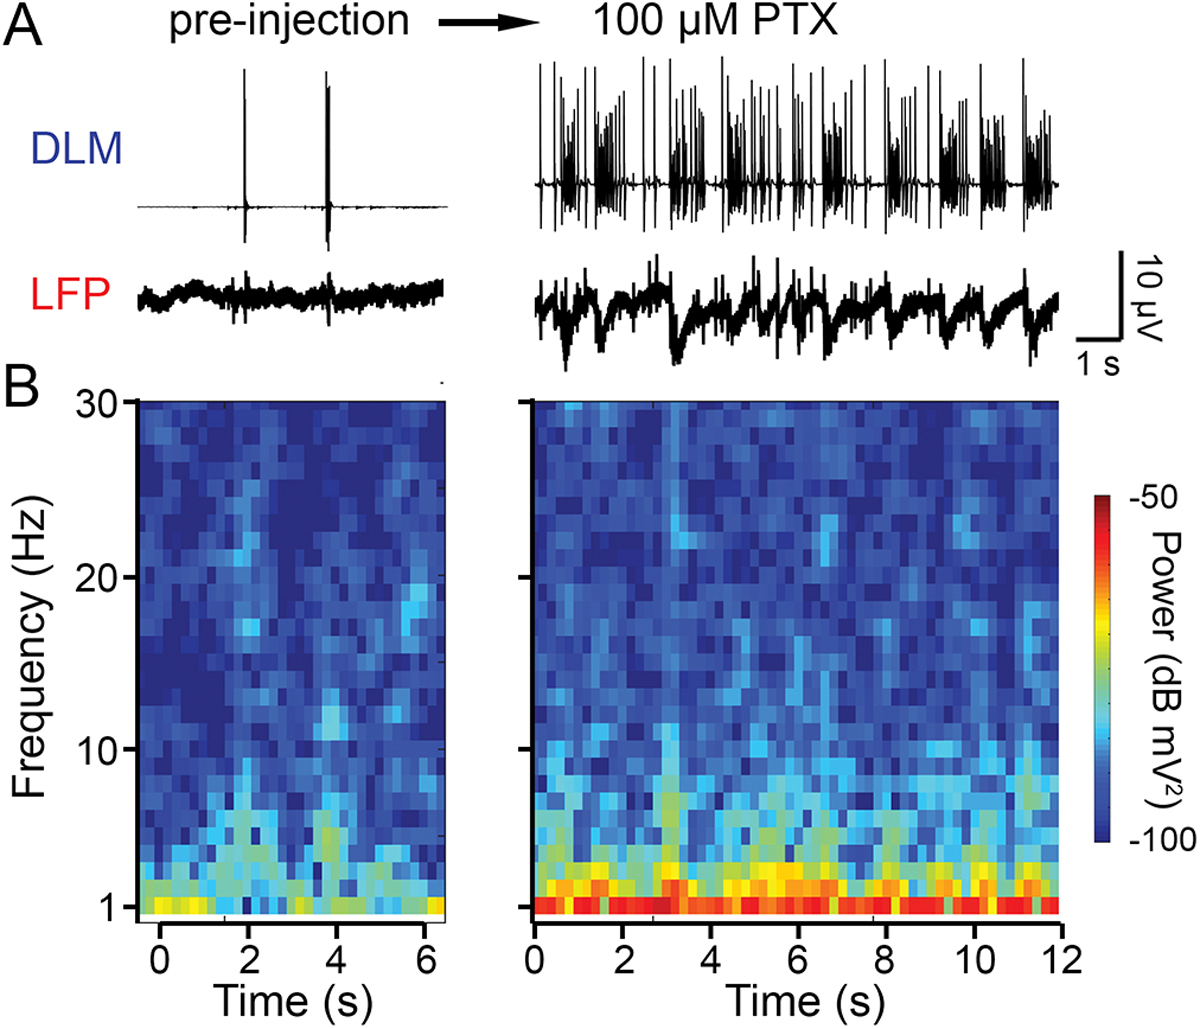
Correlated DLM bursts and LFP waves induced by application of picrotoxin (PTX), a GABAA receptor antagonist. (A) Traces of DLM spiking (upper), and LFP activity (lower) before and after dorsal vessel injection of PTX. The post-injection (~10 min) traces illustrate end-point DLM spike ‘bursting,’ up to ~100 Hz within bursts (cf. Lee et. al, 2019). (B) Short-time FFT spectrogram of the pre- and post-injection activity. Note the specific increase in low frequency power (about 1 Hz) corresponding to the frequency components of the LFP waves.
Discussion
Studies of field potential signals from the CNS of Drosophila and other insects have contributed to our understanding of olfactory processing (Tanaka et al., 2009; Wang, 2000), attention (Grabowska, Jeans, Steeves, & van Swinderen, 2020; van Swinderen, 2007), sleep-wake cycles (Raccuglia et al., 2019; Yap et al., 2017), as well as chill coma and spreading depression events across the nervous system (Robertson, Spong, & Srithiphaphirom, 2017; Spong, Rodríguez, & Robertson, 2016). In this report, we describe a straightforward technique for monitoring event-related LFP signals in the brain during seizure events in tethered behaving flies. Utilizing the orbital bristles (Ferris, 1950) as landmarks for electrode insertion, and a defined electrical stimulation-recording configuration (Figure 1A–B), we obtained reliable readouts of global brain signals. Using this approach, we differentiated LFP activity during rest from flight-associated patterns. Furthermore, we discovered aberrant yet reproduceable LFP waveforms accompanying the stereotypic ECS discharge (Figure 1E), and proconvulsant (PTX)-induced spasms (Figure 5).
Origins and properties of the LFP signal: Cellular- and systems-level mechanisms
Field potentials in the brain, arise through the combined current contributions from synaptic transmission and action potential generation as well as other cellular physiological processes (Busakzi et al., 2012). In vertebrate brain slice and in vivo preparations, excitatory post-synaptic currents are thought to be the major contributor to LFP signals, as their relatively slow time-course (> 10 ms) provides the opportunity for temporal overlap (i.e. synchronization) promoting larger field potential amplitudes (Lopes da Silva & Van Rotterdam, 2005). Additionally, currents associated with action potentials and sub-threshold activity in neurons are also recognized to contribute to LFP waveforms to some extent (Belluscio, Mizuseki, Schmidt, Kempter, & Buzsáki, 2012; Ray & Maunsell, 2011). Thus, an LFP signal (Figure 1) is a complex representation of electrical activity arising between the glass microelectrode and reference electrode(s) in this report.
Our pharmacological experiments indicate that action potential and synaptic transmission blockade similarly suppressed prominent but irregular spike waveforms and power in the Drosophila LFP signal (Figure 3). Indeed, previous examination of temperature-sensitive mutants of paralytic (encoding NaV channels) and shibire (encoding dynamin) found restrictive temperatures similarly blocked components of the LFP signal (Nitz et al., 2002). Although the specific contributions of action potential or synaptic transmission-associated currents in the Drosophila LFP remain to be resolved, these results demonstrate that their collective action represents a major component of the LFP signal.
Interestingly, across the three activity states studied, i.e. rest, flight and ECS discharges, the Drosophila LFP signal displayed a general inverse relation between frequency and spectral power, P ∝ 1/f n, with n ~ 1 (Figure 2D–E). This power scaling phenomenon is also observed across a wide array of vertebrate EEG and LFP recordings from in vivo and brain slice preparations under a variety of physiological conditions, albeit with n ~ 1 – 4 (K. J. Miller, Sorensen, Ojemann, & den Nijs, 2009; Milstein, Mormann, Fried, & Koch, 2009; Pritchard, 1992). Although the basis for the inverse power relation remains to be fully understood, the value of n is thought to reflect electrical filtering properties of brain tissue (Bédard & Destexhe, 2009) and the network organization of the nervous system (Buzsáki et al., 2012). The specific mechanisms giving rise to the power scaling relationship in our signal remain to be further investigated, given the differences in circuit organization between Drosophila and vertebrate brains.
The LFP signal readily separates brain activity associated with rest, flight and ECS discharges (Figures 1 and 2). At the baseline rest activity pattern, the LFP signal consisted of a ~ 10 μV (RMS amplitude) signal punctuated with sharp negative deflections (i.e., small spike waveforms, Figure 1C). During flight, the signal displayed a clear increase in RMS amplitude and in the rate of sharp spike waveforms (Figure 1D). Nevertheless, the most striking LFP signal emerged during seizure activity evoked by electroconvulsion (Figure 1E), with an approximate ten-fold increase in amplitude superimposed by large amplitude spike waveforms. PTX injection triggered a separate, but clear activity pattern consisting of ‘slow waves’ (~ 1 Hz) synchronized with behavioral spasms (Figure 5). Although these LFP activity modes are clear and robustly reproducible, the precise changes in circuit function driving these activity patterns remain to be elucidated. For example, the identified differences between the rest and flight-associated LFP could involve identified octopaminergic (Suver, Mamiya, & Dickinson, 2012; van Breugel, Suver, & Dickinson, 2014) or dopaminergic (Sadaf, Reddy, Sane, & Hasan, 2015) systems in the CNS that are known to modulate flight behavior (Brembs, Christiansen, Pflüger, & Duch, 2007). Further systematic manipulations of the microelectrode recording site or configurations coupled with transgenic manipulation of activity within specified neural circuits may provide important information regarding the specific neural circuits and/or brain regions in generating the flight- or seizure-specific alterations in LFP signals.
Monitoring aberrant brain activity through the LFP
In wild-type flies, seizures can be triggered by high-frequency, electroconvulsive, stimulation across the brain, known as ECS discharges (Lee & Wu, 2002; Pavlidis & Tanouye, 1995), or by pro-convulsant (e.g. PTX) application (Lee et al., 2019; Stilwell, Saraswati, Littleton, & Chouinard, 2006), much like seizure induction models in their vertebrate counterparts (Löscher & Schmidt, 1988; Woodbury & Davenport, 1952). Thus far, electrophysiological characterization of seizure activity in Drosophila has largely relied on the DLM motor unit as an faithful readout of seizure-associated activity (Ehaideb et al., 2014; Kuebler & Tanouye, 2000; Lee & Wu, 2002, 2006; Pavlidis & Tanouye, 1995). Following ECS induction, the fly undergoes the highly stereotypic motor sequence consisting of two bouts of DLM spike discharges with intervening paralysis (Figure 1E, see also Lee & Wu, 2002). Although the DLM is a widely utilized readout, previous studies have shown its action potential bursts are driven by its motor neuron (DLMn) and are temporally correlated with additional thoracic motor units (Pavlidis & Tanouye, 1995). Furthermore, these DLM discharges overlap with a phase of increased activity that could be picked up within the cervical connective or along the head-abdomen axis (Lee & Wu, 2002). The LFP recordings here provide an initial glimpse of the brain activity patterns accompanying ECS discharges.
Interestingly, during the ECS discharge sequence, the onset of LFP oscillations occurred during the paralysis phase and was distinct from ID or DD onset times (Figure 1E & Figure 4B). This temporal separation suggests distinct physiological processes driving brain and thoracic expression of seizure activity that drive DLM firing. In decapitated flies both ID and DD spike discharges can still be electrically triggered (Lee & Wu, 2002). Thus, while the DLM discharges represent thoracic circuit activity, the LFP signals reflect the physiological state in a different CNS region, i.e., brain-associated seizure activity in Drosophila. This ECS-associated LFP pattern consisted of a substantial increase in signal power (across a broad frequency spectrum) and the emergence of repetitive sharp spike waveforms (Figure 1 & 2). Notably, sharp spike events are characteristic of epileptiform activity from mammalian EEG waveforms (Niedermeyer, 2005) and from hippocampal and cortical slice LFPs (Prince & Tseng, 1993; Traynelis & Dingledine, 1988). It is possible that shared physiological mechanisms generate these LFP spike waveforms during ECS in Drosophila.
Notably, PTX injection produces a mode of hyperexcitability distinct from the ECS sequence, first inducing flight-like rhythmic (~10 Hz) DLM spiking that gradually evolves into a pattern of regular burst firing (peak frequency ~ 100 Hz), a hyper-active state lasting for hours (this report, and Lee et al., 2019). In contrast to DLM spikes, the PTX-associated LFP signal displayed a relatively slow (~1 Hz) negative waves that appeared to be phase-linked with the DLM bursts (Figure 5). Therefore, in this PTX-induced seizure, there appears to be a high degree of synchronization between brain and thoracic activity. Although the similarities and distinctions in physiological mechanisms underlying ECS discharges and PTX-induced seizures remain to be elucidated, both cases provide strong indications for central hyperexcitability and synchronization during seizure activity in Drosophila.
Hyperexcitable neural activities and behavioral phenotypes have been associated with a rich and growing collection of Drosophila mutants (Benzer, 1971; Burg & Wu, 2012; Ganetzky & Wu, 1982; Song & Tanouye, 2008). Certain mutants, such as the gain-of-function para allele Shudderer exhibit spontaneous seizures (Kaas et al., 2016). In other mutants, seizures can be induced by mechanical shock (e.g., bss, Ganetzky & Wu, 1982; slamdance, Zhang et al., 2002; Horne et al., 2017), high temperature (e.g., seizure, Jackson, Wilson, Strichartz, & Hall, 1984; Titus, Warmke & Ganetzky, 1997; down and out, Fergestad et al., 2010; zydeco, Melom & Littleton 2013) or by nutritional deficiencies (e.g. sugarlethal, Chi et al., 2019). Indeed, many identified mammalian epilepsy-associated genes (Frankel, 2009; Noebels, 2015) have homologs in Drosophila with mutant alleles displaying clear modifications of circuit-level excitability and/or seizure-like behaviors. There is a growing collection of Drosophila transgenic and/or knock-in lines carrying human epilepsy-associated mutations (e.g., paraGEFS, Sun et al., 2012; paraDS, Schutte et al., 2014; Dube3a, Hope, Ledoux & Reiter, 2017). Importantly, in several classes of excitability mutants, seizure phenotypes can be suppressed by established antiepileptic drugs (e.g. valproate in bss, Keubler and Tanouye, 2002) or by emerging therapeutic strategies (e.g. milk-whey dietary supplement in Shudderer, Kasuya et al., 2019). Notably the LFP signal provides a promising approach to study antiepileptic drug action in the Drosophila brain.
Although a systematic analysis across seizure-prone Drosophila mutants is beyond the scope of this report, initial distinctions (Figure 4) uncovered between the bang-sensitive paralytic allele, bss and WT flies highlights the potential power of the new LFP approach in refined neurogenetic analysis of epileptic categories and potential modifications of seizure phenotypes in the CNS of Drosophila.
Supplementary Material
Acknowledgments
We dedicate this article in commemoration of Prof. Marla Sokolowski’s unique contributions to the development of behavioral genetics. We also acknowledge the long-running and spirited collaboration between the and Wu labs. We thank Toshi Kitamoto, and members of the Wu Lab, particularly Tristan O’Harrow and Atsushi Ueda, for their helpful discussions over the course of this project. This work was supported by NIH grants (NS111122, AG051513) to CFW, and an Iowa Neuroscience Institute fellowship to AI.
References
- Adrian ED, & Matthews BHC (1934). The interpretation of potential waves in the cortex. J. Physiol, 81(4), 440–471. [DOI] [PMC free article] [PubMed] [Google Scholar]
- Alcorta E (1991). Characterization of the electroantennogram in Drosophila melanogaster and its use for identifying olfactory capture and transduction mutants. J. Neurophysiol, 65(3), 702–714. [DOI] [PubMed] [Google Scholar]
- Ayyub C, Paranjape J, Rodrigues V, & Siddiqi O (1990). Genetics of olfactory behavior in Drosophila melanogaster. J. Neurogenet, 6(4), 243–262. [DOI] [PubMed] [Google Scholar]
- Bédard C, & Destexhe A (2009). Macroscopic Models of Local Field Potentials and the Apparent 1/f Noise in Brain Activity. Biophys. J, 96(7), 2589–2603. [DOI] [PMC free article] [PubMed] [Google Scholar]
- Belluscio MA, Mizuseki K, Schmidt R, Kempter R, & Buzsáki G (2012). Cross-Frequency Phase–Phase Coupling between Theta and Gamma Oscillations in the Hippocampus. J. Neurosci, 32(2), 423–435. [DOI] [PMC free article] [PubMed] [Google Scholar]
- Benzer S (1971). From the gene to behavior. J. Am. Med. Assoc, 218(7), 1015–1022. [PubMed] [Google Scholar]
- Borst A (1984). Identification of different chemoreceptors by electroantennogram-recording. J. Insect Physiol, 30(6), 507–510. [Google Scholar]
- Brembs B, Christiansen F, Pflüger HJ, & Duch C (2007). Flight Initiation and Maintenance Deficits in Flies with Genetically Altered Biogenic Amine Levels. J. Neurosci, 27(41), 11122–11131. [DOI] [PMC free article] [PubMed] [Google Scholar]
- Britton JW, Frey LC, Hopp JL, Korb P, Koubeissi MZ, Lievens WE, . . . St. Louis EK (2016). Electroencephalography (EEG): An Introductory Text and Atlas of Normal and Abnormal Findings in Adults, Children, and Infants. In: American Epilepsy Society, Chicago. [PubMed] [Google Scholar]
- Burg MG, & Wu CF (2012). Mechanical and temperature stressor-induced seizure-and-paralysis behaviors in Drosophila bang-sensitive mutants. J. Neurogenet, 26(2), 189–197. [DOI] [PMC free article] [PubMed] [Google Scholar]
- Buzsáki G, Anastassiou CA, & Koch C (2012). The origin of extracellular fields and currents—EEG, ECoG, LFP and spikes. Nat. Rev. Neurosci, 13(6), 407–420. [DOI] [PMC free article] [PubMed] [Google Scholar]
- Chi W, Iyengar AS, Albersen M, Bosma M, Verhoeven-Duif NM, Wu C-F, & Zhuang X (2019). Pyridox (am) ine 5’-phosphate oxidase deficiency induces seizures in Drosophila melanogaster. Hum. Mol. Genet, 28(18), 3126–3136. [DOI] [PMC free article] [PubMed] [Google Scholar]
- Dickinson MH, & Tu MS (1997). The function of dipteran flight muscle. Comp. Biochem. Physiol. A, 116(3), 223–238. [Google Scholar]
- Eberl DF, Hardy RW, & Kernan MJ (2000). Genetically similar transduction mechanisms for touch and hearing in Drosophila. J. Neurosci, 20(16), 5981–5988. [DOI] [PMC free article] [PubMed] [Google Scholar]
- Ehaideb SN, Iyengar A, Ueda A, Iacobucci GJ, Cranston C, Bassuk AG, . . . Wu C-F (2014). Prickle modulates microtubule polarity and axonal transport to ameliorate seizures in flies. Proc. Natl. Acad. Sci. USA, 111(30), 11187–11192. [DOI] [PMC free article] [PubMed] [Google Scholar]
- Engel JE, & Wu C-F (1992). Interactions of membrane excitability mutations affecting potassium and sodium currents in the flight and giant fiber escape systems of Drosophila. J. Comp. Physiol., A, 171(1), 93–104. [DOI] [PubMed] [Google Scholar]
- Ewing AW (1977). The neuromuscular basis of courtship song in Drosophila: the role of the indirect flight muscles. J. Comp. Physiol, 119(3), 249–265. [Google Scholar]
- Fergestad T, Sale H, Bostwick B, Schaffer A, Ho L, Robertson GA, & Ganetzky B (2010). A Drosophilabehavioral mutant, down and out (dao), is defective in an essential regulator of Erg potassium channels. Proc. Natl. Acad. Sci. USA, 107(12), 5617–5621. [DOI] [PMC free article] [PubMed] [Google Scholar]
- Ferris G (1950). External morphology of the adult. In Demeric M (Ed.), Biology of Drosophila (Facsimile Edition, 1994 ed., pp. 369–419): Cold Spring Harbor Press. [Google Scholar]
- Frankel A, & Brousseau G (1968). Drosophila medium that does not require dried yeast. Drosophila Information Service, 43, 184. [Google Scholar]
- Frankel WN (2009). Genetics of complex neurological disease: challenges and opportunities for modeling epilepsy in mice and rats. Trends Genet, 25(8), 361–367. [DOI] [PMC free article] [PubMed] [Google Scholar]
- Ganetzky B, & Wu CF (1982). Indirect Suppression Involving Behavioral Mutants with Altered Nerve Excitability in Drosophila melanogaster. Genetics, 100(4), 597–614. [DOI] [PMC free article] [PubMed] [Google Scholar]
- Gordon S, & Dickinson MH (2006). Role of calcium in the regulation of mechanical power in insect flight. Proc. Natl. Acad. Sci. U. S. A, 103(11), 4311–4315. [DOI] [PMC free article] [PubMed] [Google Scholar]
- Grabowska MJ, Jeans R, Steeves J, & van Swinderen B (2020). Oscillations in the central brain of Drosophila are phase locked to attended visual features. Proc. Natl. Acad. Sci. USA, 117(47), 29925–29936. [DOI] [PMC free article] [PubMed] [Google Scholar]
- Heisenberg M (1971). Separation of receptor and lamina potentials in the electroretinogram of normal and mutant Drosophila. J. Exp. Biol, 55(1), 85–100. [DOI] [PubMed] [Google Scholar]
- Hope KA, LeDoux MS, & Reiter LT (2017). Glial overexpression of Dube3a causes seizures and synaptic impairments in Drosophila concomitant with down regulation of the Na+/K+ pump ATPα. Neurobiol. Dis, 108, 238–248. [DOI] [PMC free article] [PubMed] [Google Scholar]
- Howlett IC, & Tanouye MA (2013). Seizure-sensitivity in Drosophila is ameliorated by dorsal vessel injection of the antiepileptic drug valproate. J. Neurogenet, 27(4), 143–150. [DOI] [PubMed] [Google Scholar]
- Ikeda K, Ozawa S, & Hagiwara S (1976). Synaptic transmission reversibly conditioned by single-gene mutation in Drosophila melanogaster. Nature, 259(5543), 489–491. doi: 10.1038/259489a0 [DOI] [PubMed] [Google Scholar]
- Ito I, Bazhenov M, Ong RC-Y, Raman B, & Stopfer M (2009). Frequency transitions in odor-evoked neural oscillations. Neuron, 64(5), 692–706. [DOI] [PMC free article] [PubMed] [Google Scholar]
- Iyengar A, & Wu C-F (2014). Flight and seizure motor patterns in Drosophila mutants: simultaneous acoustic and electrophysiological recordings of wing beats and flight muscle activity. J. Neurogenet, 28(3–4), 316–328. [DOI] [PMC free article] [PubMed] [Google Scholar]
- Jackson FR, Wilson SD, Strichartz GR, & Hall LM (1984). Two types of mutants affecting voltage-sensitive sodium channels in Drosophila melanogaster. Nature, 308(5955), 189–191. [DOI] [PubMed] [Google Scholar]
- Jan LY, & Jan YN (1976). Properties of the larval neuromuscular junction in Drosophila melanogaster. J. Physiol, 262(1), 189–214. [DOI] [PMC free article] [PubMed] [Google Scholar]
- Kaas GA, Kasuya J, Lansdon P, Ueda A, Iyengar A, Wu C-F, & Kitamoto T (2016). Lithium-responsive seizure-like hyperexcitability is caused by a mutation in the Drosophila voltage-gated sodium channel gene paralytic. Eneuro, 3(5). [DOI] [PMC free article] [PubMed] [Google Scholar]
- Kasuya J, Iyengar A, Chen H-L, Lansdon P, Wu C-F, & Kitamoto T (2019). Milk-whey diet substantially suppresses seizure-like phenotypes of paraShu, a Drosophila voltage-gated sodium channel mutant. J. Neurogenet, 33(3), 164–178. [DOI] [PMC free article] [PubMed] [Google Scholar]
- Kuebler D, & Tanouye MA (2000). Modifications of seizure susceptibility in Drosophila. J. Neurophysiol, 83(2), 998–1009. [DOI] [PubMed] [Google Scholar]
- Kuebler D, & Tanouye MA (2002). Anticonvulsant valproate reduces seizure-susceptibility in mutant Drosophila. Brain Res. 958(2), 36–42. [DOI] [PubMed] [Google Scholar]
- Lee J, Iyengar A, & Wu C-F (2019). Distinctions among electroconvulsion-and proconvulsant-induced seizure discharges and native motor patterns during flight and grooming: Quantitative spike pattern analysis in Drosophila flight muscles. J. Neurogenet, 33(2), 125–142. [DOI] [PMC free article] [PubMed] [Google Scholar]
- Lee J, & Wu C-F (2002). Electroconvulsive seizure behavior in Drosophila: analysis of the physiological repertoire underlying a stereotyped action pattern in bang-sensitive mutants. J. Neurosci, 22(24), 11065–11079. [DOI] [PMC free article] [PubMed] [Google Scholar]
- Lee J, & Wu C-F (2006). Genetic modifications of seizure susceptibility and expression by altered excitability in Drosophila Na+ and K+ channel mutants. J. Neurophysiol, 96(5), 2465–2478. [DOI] [PubMed] [Google Scholar]
- Lemon WC, Pulver SR, Höckendorf B, McDole K, Branson K, Freeman J, & Keller PJ (2015). Whole-central nervous system functional imaging in larval Drosophila. Nat. Comm, 6(1), 1–16. [DOI] [PMC free article] [PubMed] [Google Scholar]
- Lopes da Silva F, & Van Rotterdam A (2005). Biophysical Aspects of EEG and Magnetoencephalogram Generation. In Niedermeyer E. L. d. S., F. (Ed.), Electroencephalography: Basic principles, clinical applications and related fields (5th ed., pp. 107–126). Philadelphia: Lippincott Williams & Wilkins. [Google Scholar]
- Löscher W, & Schmidt D (1988). Which animal models should be used in the search for new antiepileptic drugs? A proposal based on experimental and clinical considerations. Epilepsy Res, 2(3), 145–181. [DOI] [PubMed] [Google Scholar]
- Melom JE, & Littleton JT (2013). Mutation of a NCKX Eliminates Glial Microdomain Calcium Oscillations and Enhances Seizure Susceptibility. J. Neurosci, 33(3), 1169–1178. doi: 10.1523/jneurosci.3920-12.2013 [DOI] [PMC free article] [PubMed] [Google Scholar]
- Miller A (1950). The internal anatomy and histology of the imago of Drosophila melanogaster. In Demeric M (Ed.), The Biology of Drosophila (pp. 421–534). New York: John Wiley and Sons. [Google Scholar]
- Miller KJ, Sorensen LB, Ojemann JG, & den Nijs M (2009). Power-Law Scaling in the Brain Surface Electric Potential. PLoS Comput. Biol, 5(12), e1000609. [DOI] [PMC free article] [PubMed] [Google Scholar]
- Millett D (2001). Hans Berger: From psychic energy to the EEG. Perspect. Biol. Med, 44(4), 522–542. [DOI] [PubMed] [Google Scholar]
- Milstein J, Mormann F, Fried I, & Koch C (2009). Neuronal Shot Noise and Brownian 1/f2 Behavior in the Local Field Potential. PLoS One, 4(2), e4338. [DOI] [PMC free article] [PubMed] [Google Scholar]
- Niedermeyer E (2005). Abnormal EEG Patterns: Epileptic and Paroxysmal. In Niedermeyer E & Lopes Da Silva F (Eds.), Electroencephalography: Basic Principles, Clinical Applications and Related Fields (5th ed., pp. 255–280). Philadelphia, PA: Lippincott Williams & Williams. [Google Scholar]
- Nitz DA, Van Swinderen B, Tononi G, & Greenspan RJ (2002). Electrophysiological correlates of rest and activity in Drosophila melanogaster. Curr. Biol, 12(22), 1934–1940. [DOI] [PubMed] [Google Scholar]
- Noachtar S, & Peters AS (2009). Semiology of epileptic seizures: a critical review. Epilepsy Behav, 15(1), 2–9. [DOI] [PubMed] [Google Scholar]
- Noebels J (2015). Pathway-driven discovery of epilepsy genes. Nat. Neurosci, 18(3), 344–350. doi: 10.1038/nn.3933 [DOI] [PMC free article] [PubMed] [Google Scholar]
- Pak W (1975). Mutations affecting the vision of Drosophila melanogaster. In King R (Ed.), Handbook of Genetics (Vol. 3, pp. 703–733). New York, NY: Plenum Publishing. [Google Scholar]
- Parker L, Padilla M, Du Y, Dong K, & Tanouye MA (2011). Drosophila as a model for epilepsy: bss is a gain-of-function mutation in the para sodium channel gene that leads to seizures. Genetics, 187(2), 523–534. [DOI] [PMC free article] [PubMed] [Google Scholar]
- Paulk AC, Kirszenblat L, Zhou Y, & van Swinderen B (2015). Closed-loop behavioral control increases coherence in the fly brain. J. Neurosci, 35(28), 10304–10315. [DOI] [PMC free article] [PubMed] [Google Scholar]
- Paulk AC, Zhou Y, Stratton P, Liu L, & van Swinderen B (2013). Multichannel brain recordings in behaving Drosophila reveal oscillatory activity and local coherence in response to sensory stimulation and circuit activation. J. Neurophysiol, 110(7), 1703–1721. [DOI] [PMC free article] [PubMed] [Google Scholar]
- Pavlidis P, & Tanouye MA (1995). Seizures and failures in the giant fiber pathway of Drosophila bang-sensitive paralytic mutants. J. Neurosci, 15(8), 5810–5819. [DOI] [PMC free article] [PubMed] [Google Scholar]
- Prince DA, & Tseng GF (1993). Epileptogenesis in chronically injured cortex: in vitro studies. J. Neurophysiol, 69(4), 1276–1291. [DOI] [PubMed] [Google Scholar]
- Pritchard WS (1992). The Brain in Fractal Time: 1/F-Like Power Spectrum Scaling of the Human Electroencephalogram. Int. J. Neurosci, 66(1–2), 119–129. [DOI] [PubMed] [Google Scholar]
- Raccuglia D, Huang S, Ender A, Heim M-M, Laber D, Suárez-Grimalt R, . . . Owald D (2019). Network-specific synchronization of electrical slow-wave oscillations regulates sleep drive in Drosophila. Curr. Biol, 29(21), 3611–3621. e3613. [DOI] [PubMed] [Google Scholar]
- Ray S, & Maunsell JHR (2011). Different Origins of Gamma Rhythm and High-Gamma Activity in Macaque Visual Cortex. PLoS Biol, 9(4), e1000610. [DOI] [PMC free article] [PubMed] [Google Scholar]
- Robertson RM, Spong KE, & Srithiphaphirom P (2017). Chill coma in the locust, Locusta migratoria, is initiated by spreading depolarization in the central nervous system. Sci. Rep, 7(1), 1–12. [DOI] [PMC free article] [PubMed] [Google Scholar]
- Sadaf S, Reddy OV, Sane SP, & Hasan G (2015). Neural control of wing coordination in flies. Curr. Biol, 25(1), 80–86. [DOI] [PubMed] [Google Scholar]
- Schutte RJ, Schutte SS, Algara J, Barragan EV, Gilligan J, Staber C, . . . O’Dowd DK (2014). Knock-in model of Dravet syndrome reveals a constitutive and conditional reduction in sodium current. J. Neurophysiol, 112(4), 903–912. [DOI] [PMC free article] [PubMed] [Google Scholar]
- Siddiqi O, & Benzer S (1976). Neurophysiological defects in temperature-sensitive paralytic mutants of Drosophila melanogaster. Proc. Natl. Acad. Sci. USA, 73(9), 3253–3257. doi: 10.1073/pnas.73.9.3253 [DOI] [PMC free article] [PubMed] [Google Scholar]
- Song J, & Tanouye MA (2008). From bench to drug: human seizure modeling using Drosophila. Prog. Neurobiol, 84(2), 182–191. [DOI] [PMC free article] [PubMed] [Google Scholar]
- Spong KE, Rodríguez EC, & Robertson RM (2016). Spreading depolarization in the brain of Drosophila is induced by inhibition of the Na+/K+-ATPase and mitigated by a decrease in activity of protein kinase G. In: American Physiological Society; Bethesda, MD. [DOI] [PMC free article] [PubMed] [Google Scholar]
- Stilwell GE, Saraswati S, Littleton JT, & Chouinard SW (2006). Development of a Drosophila seizure model for in vivo high-throughput drug screening. Eur. J. Neurosci, 24(8), 2211–2222. [DOI] [PubMed] [Google Scholar]
- Streit AK, Fan YN, Masullo L, & Baines RA (2016). Calcium imaging of neuronal activity in Drosophila can identify anticonvulsive compounds. PLoS One, 11(2), e0148461. [DOI] [PMC free article] [PubMed] [Google Scholar]
- Sun L, Gilligan J, Staber C, Schutte RJ, Nguyen V, O’Dowd DK, & Reenan R (2012). A Knock-In Model of Human Epilepsy in Drosophila Reveals a Novel Cellular Mechanism Associated with Heat-Induced Seizure. J. Neurosci, 32(41), 14145–14155. doi: 10.1523/jneurosci.2932-12.2012 [DOI] [PMC free article] [PubMed] [Google Scholar]
- Suver MP, Mamiya A, & Dickinson MH (2012). Octopamine neurons mediate flight-induced modulation of visual processing in Drosophila. Curr. Biol, 22(24), 2294–2302. [DOI] [PubMed] [Google Scholar]
- Tanaka NK, Ito K, & Stopfer M (2009). Odor-evoked neural oscillations in Drosophila are mediated by widely branching interneurons. J. Neurosci, 29(26), 8595–8603. [DOI] [PMC free article] [PubMed] [Google Scholar]
- Tanouye MA, & Wyman RJ (1980). Motor outputs of giant nerve fiber in Drosophila. J. Neurophysiol, 44(2), 405–421. [DOI] [PubMed] [Google Scholar]
- Titus SA, Warmke JW, & Ganetzky B (1997). The Drosophila erg K+ Channel Polypeptide Is Encoded by the Seizure Locus. J. Neurosci, 17(3), 875–881. doi: 10.1523/jneurosci.17-03-00875.1997 [DOI] [PMC free article] [PubMed] [Google Scholar]
- Traynelis SF, & Dingledine R (1988). Potassium-induced spontaneous electrographic seizures in the rat hippocampal slice. J. Neurophysiol, 59(1), 259–276. doi: 10.1152/jn.1988.59.1.259 [DOI] [PubMed] [Google Scholar]
- van Alphen B, Semenza ER, Yap M, van Swinderen B, & Allada R (2021). A deep sleep stage in Drosophila with a functional role in waste clearance. Science advances, 7(4), eabc2999. [DOI] [PMC free article] [PubMed] [Google Scholar]
- van Breugel F, Suver MP, & Dickinson MH (2014). Octopaminergic modulation of the visual flight speed regulator of Drosophila. J. Exp. Biol, 217(10), 1737–1744. [DOI] [PubMed] [Google Scholar]
- van Swinderen B (2006). A succession of anesthetic endpoints in the Drosophila brain. J. Neurobiol, 66(11), 1195–1211. [DOI] [PubMed] [Google Scholar]
- van Swinderen B (2007). Attention-like processes in Drosophila require short-term memory genes. Science, 315(5818), 1590–1593. [DOI] [PubMed] [Google Scholar]
- Wang JW (2000). Odor-induced oscillatory activity in Drosophila CNS. Biol. Bull, 199(2), 170–171. [DOI] [PubMed] [Google Scholar]
- Wang JW, Wong AM, Flores J, Vosshall LB, & Axel R (2003). Two-photon calcium imaging reveals an odor-evoked map of activity in the fly brain. Cell, 112(2), 271–282. [DOI] [PubMed] [Google Scholar]
- Wilson RI, Turner GC, & Laurent G (2004). Transformation of olfactory representations in the Drosophila antennal lobe. Science, 303(5656), 366–370. [DOI] [PubMed] [Google Scholar]
- Woodbury LA, & Davenport VD (1952). Design and use of a new electroshock seizure apparatus, and analysis of factors altering seizure threshold and pattern. Archives internationales de pharmacodynamie et de therapie, 92(1), 97–107. [PubMed] [Google Scholar]
- Worrell JW, & Levine RB (2008). Characterization of Voltage-Dependent Ca2+ Currents in Identified Drosophila Motoneurons In Situ. J. Neurophysiol, 100(2), 868–878. [DOI] [PMC free article] [PubMed] [Google Scholar]
- Wu CF, Ganetzky B, Jan LY, Jan YN, & Benzer S (1978). A Drosophila mutant with a temperature-sensitive block in nerve conduction. Proc. Natl. Acad. Sci. USA, 75(8), 4047–4051. [DOI] [PMC free article] [PubMed] [Google Scholar]
- Yap MH, Grabowska MJ, Rohrscheib C, Jeans R, Troup M, Paulk AC, . . . Van Swinderen B (2017). Oscillatory brain activity in spontaneous and induced sleep stages in flies. Nat. Comm, 8(1), 1–15. [DOI] [PMC free article] [PubMed] [Google Scholar]
Associated Data
This section collects any data citations, data availability statements, or supplementary materials included in this article.