

Abstract
Background and Aim:
Chronic ethanol consumption impairs liver regeneration due, in part, to inhibition of insulin signaling. This study characterizes the mechanisms and consequences of ethanol-impaired insulin signaling in relation to oxidative injury and altered gene expression.
Methods:
Long-Evans rats were fed for 8 weeks with isocaloric liquid diets containing 0% (control) or 37% ethanol (caloric content). Livers were used to examine histopathology, indices of oxidative stress, gene expression required for insulin and insulin-like growth factor (IGF) signaling, insulin-responsive gene expression, i.e. glyceraldehydes-3-phosphate dehydrogenase (GAPDH) and aspartyl-asparaginyl-β-hydroxylase (AAH), and competitive equilibrium binding to the insulin, IGF-I, and IGF-II receptors.
Results:
Chronic ethanol exposure caused liver injury with increased hepatocellular steatosis, inflammation, apoptosis, and increased immunoreactivity for activated caspase-3, 8-hydroxy-2′-deoxyguanosine, and 4-hydroxy-2,3-nonenol. These effects were associated with increased expression of IGF-I receptor, IGF-II, and IGF-II receptor, and expression of IGF-I, AAH, and GAPDH, which mediate energy metabolism and cell motility/remodeling, and reduced binding to the insulin receptor.
Conclusions:
Chronic ethanol-induced liver injury causes insulin resistance with inhibition of insulin-responsive genes needed for metabolism, remodeling, and regeneration. In contrast, the IGF-I and IGF-II signaling mechanisms remain relatively preserved, suggesting that insulin-regulated hepatic functions may be selectively vulnerable to the toxic effects of ethanol.
Keywords: alcoholic liver disease, apoptosis, aspartyl-asparaginyl-β-hydroxylase, DNA damage, insulin resistance, oxidative stress, receptor binding
Introduction
Chronic ethanol-induced injury impairs liver regeneration1–4 and inhibits insulin signaling that mediates DNA synthesis in hepatocytes.5–10 Insulin transmits pro-growth signals by activating its receptor tyrosine kinase, which then phosphorylates the insulin receptor substrate type 1 (IRS-1). Tyrosyl phosphorylated IRS-1 transmits downstream signals through Erk MAPK and phosphatidylinositol-3-kinase (PI3 Kinase), resulting in increased mitogenesis, cell survival, gene expression, energy metabolism, glucose utilization, and motility, all of which are needed for liver regeneration and remodeling.11–18 Ethanol inhibits insulin signaling in hepatocytes by reducing the tyrosine phosphorylation of the insulin receptor and activation of its intrinsic tyrosine kinase.6–9,19 Therefore, ethanol mediates its adverse effects on insulin-signaling at a proximal point in the cascade, impairing both Erk MAPK and PI3 kinase signaling. Correspondingly, chronic alcohol exposure causes hepatocellular injury, DNA damage, apoptosis, and mitochondrial dysfunction.19–21
The finding that ethanol inhibits insulin-stimulated growth and survival signaling in liver by reducing the insulin receptor tyrosine kinase activation suggests that chronic ethanol exposure causes hepatic insulin resistance.22–27 Although the mechanism is not entirely understood, there is some evidence that ethanol-induced hepatic insulin resistance is mediated by impaired binding to the insulin receptor.27 However, the effects of ethanol on insulin-like growth factor (IGF) signaling, and insulin/IGF-responsive gene expression needed for liver remodeling and energy metabolism have not been investigated. To this end, the present study was designed in part to examine the effects of chronic ethanol feeding on downstream targets of insulin and IGF signaling that mediate energy metabolism and liver remodeling, i.e. aspartyl-(asparaginyl)-β-hydroxylase (AAH) and glyceraldehydes-3-phosphate dehydrogenase (GAPDH).
AAH is an alpha-ketoglutarate dependent enzyme that hydroxylates aspartyl and asparaginyl residues present in epidermal growth factor (EGF)-like domains of proteins such as Notch and Jagged, which have known roles in regulating cell motility.28–32 In this regard, previous experiments using antisense and/or siRNA targeting the AAH mRNA, or over-expressing AAH by transfection, demonstrated that AAH plays an important role in cell motility.33–37 In addition, experiments demonstrated that AAH gene expression is regulated by insulin and IGF signaling through IRS-dependent pathways with increased activation of Erk MAPK and/or PI3 kinase-Akt.35–37 In addition, GAPDH is an important insulin-responsive gene38 that regulates energy metabolism.
In the present study, we utilized an in vivo model of chronic ethanol-induced liver injury to determine the degree to which ethanol impairs upstream mediators of insulin signaling, including expression of endogenous growth factors and their receptors, insulin receptor binding, and expression of downstream genes needed for energy metabolism, tissue remodeling, and cell motility. Correspondingly, we measured GAPDH and AAH expression because these genes are insulin responsive and have roles in regulating energy metabolism and cell motility, respectively.33–38 We also measured the expression levels of IGF polypeptides and their receptors, and equilibrium binding to receptors to determine the degree to which ethanol inhibition of insulin signaling in the liver is selective.
Materials and methods
Chronic ethanol feeding model
Adult male Long-Evans rats were pair-fed ethanol-containing (n = 12) or isocaloric control (n = 13) liquid diets (BioServ, Frenchtown, NJ, USA) for 8 weeks. During the first, second, and third weeks of adaptation prior to beginning the experiment, ethanol comprised 11.8%, 23.6%, and 37% of the calorie content of the feedings. Thereafter, the ethanol-fed rats were maintained on the 37% ethanol-containing diet.19 This protocol produced serum ethanol levels of ~50 mM, which is generally lower than that found in blood of chronic alcoholics visiting the emergency ward.39 Rats were monitored daily to ensure adequate nutritional intake and maintenance of body weight. Chow-fed control rats were simultaneously studied. At the end of the feeding period, the rats were sacrificed by i.p. injection of 120 mg/kg sodium pentobarbital, and liver tissues were snap-frozen in a dry ice/methanol bath for later protein and RNA studies, or they were immersion fixed in Histochoice (Amresco, Solon, OH, USA) for histological studies. This protocol was approved by the Institutional Animal Care and Use Committee at the Lifespan-Rhode Island Hospital and conforms to guidelines established by the National Institutes of Health.
In situ assays for oxidative stress
Paraffin-embedded histological sections were stained with hematoxylin–eosin, and adjacent sections were immunostained to detect 8-hydroxy-2′-deoxyguanosine (8-OHdG), or 4-hydroxy-2,3-nonenol (HNE) as indices of DNA damage and lipid peroxidation/oxidative stress, respectively. Tissue sections were immunostained with 0.5–1 μg/mL of primary antibody as previously described,19 except that immunoreactivity was detected with horseradish peroxidase (HRP)–conjugated polymer-tagged secondary antibodies (Abcam, Cambridge, MA, USA) and diaminobenzidine as the chromogen.
Quantitative reverse transcriptase–polymerase chain reaction (qRT-PCR) assays
This approach was used to measure gene expression because it permits simultaneous analysis of multiple samples and in general, the results correspond well with assays of steady state protein expression, including Western blot analysis and ELISAs. Other advantages of utilizing qRT-PCR are: (i) the small amplicon size permits more accurate assessment of gene expression in models of chronic oxidative stress and tissue injury, (ii) the use of gene-specific primers eliminates problems associated with cross-reactivity of antibodies with related molecules, and (iii) the method is highly sensitive and levels of gene expression can be reliably quantified. Total RNA isolated from liver was reverse transcribed and used to measure gene expression by qRT-PCR amplification as previously described19 and using the gene specific primer pairs (See Supplementary Table 1). Relative mRNA abundance was calculated from the ng ratios of specific mRNA to 18S rRNA measured in the same samples.19 Inter-group statistical comparisons were made using the calculated mRNA/18S ratios. Control studies included qRT-PCR analysis of: (i) template-free reactions, (ii) RNA that had not been reverse transcribed, (iii) RNA samples that were pretreated with DNAse I, (iv) samples treated with RNAse A prior to reverse transcriptase reaction, and (v) genomic DNA. The specificity of the amplified products was verified by direct nucleic acid sequencing.
Receptor binding assays
Equilibrium binding studies were used to determine if insulin signaling was impaired by ethanol due to reduced ligand-receptor binding.40 Fresh frozen liver tissue (~100 mg) was homogenized in 5 volumes of NP-40 lysis buffer (50 mM Tris-HCl, pH 7.5, 1% NP-40, 150 mM NaCl, 1 mM EDTA, 2 mM EGTA) containing protease (1 mM PMSF, 0.1 mM TPCK, 1 μg/mL aprotinin, 1 μg/mL pepstatin A, 0.5 μg/mL leupeptin, 1 mM NaF, 1 mM Na4P2O7) and phosphatase (2 mM Na3VO4) inhibitors. Protein concentration was determined using the bicinchoninic acid (BCA) assay (Pierce, Rockford, IL, USA). To measure total binding, duplicate samples were incubated in 100 μL reactions containing binding buffer (100 mM HEPES, pH 8.0, 118 mM NaCl, 1.2 mM MgSO4, 8.8 mM dextrose, 5 mM KCl, 1% bovine serum albumin) and 100 nCi/mL of [125I] (2000 Ci/mmol; 50 pM) insulin, IGF-I, or IGF-II. To measure non-specific binding, replicate samples were identically prepared but with the addition of 0.1 μM unlabeled (cold) ligand. After overnight incubation at 4°C, membrane proteins were precipitated and radioactivity present in the supernatants (unbound) and pellets (bound ligand) was measured in an LKB CompuGamma CS Gamma counter (Turku, Finland). Specific binding was calculated by subtracting the fmol of non-specific binding, i.e. amount bound in the presence of cold ligand, from the total fmol bound (absence of unlabeled competitive ligand).40 The results were analyzed using GraphPad Prism 4 software (GraphPad Software, San Diego, CA, USA).
Protein studies
Protein expression was examined by Western blot analysis or enzyme-linked immunosorbant assay (ELISA). Western blot analysis was used to measure AAH, GAPDH, and the p85 subunit of PI3 kinase (negative control) protein expression as previously described.19,40 Immunoreactivity was detected with horseradish peroxidase–conjugated secondary antibody, enhanced chemiluminescence reagents (ECL; Pierce, Rockford, IL, USA), and the Kodak Digital Science Imaging Station (NEN Life Sciences, Boston, MA, USA). Direct protein ELISAs were used to measure immunoreactivity corresponding to HNE, activated Caspase 3, β–actin, AAH, GAPDH, and the p85 subunit of PI3 kinase. ELISAs were performed in 96-well opaque polystyrene plates (Nunc, Rochester, NY, USA), and immunoreactivity was detected with HRP-conjugated secondary antibody (1:10000; Pierce), and either ECL reagents (Pierce) or Amplex Red soluble fluorophore (Molecular Probes, Eugene, OR, USA) as previously described.41 Amplex Red fluorescence was measured (Ex 530/Em 590) in a SpectraMax M5 microplate reader (Molecular Devices, Sunnyvale, CA, USA). Luminescence was measured in a TopCount machine (Packard Instrument Company, Meriden, CT, USA). Binding specificity was determined from parallel negative control incubations with non-relevant antibodies, the primary or secondary antibody omitted, or the protein samples omitted. The calculated ratios of HNE/β-actin and activated Caspase 3/β-actin fluorescence were used to assess relative levels of immunoreactivity.
DNA ELISAs were used to measure 8-OHdG immunoreactivity.42 Total DNA was extracted with Qiaquik DNA spin columns (Qiagen, Valencia, CA, USA) according to the manufacturer’s protocol. DNA was quantified and its purity assessed from the absorbances measured at 260 and 280 nm. Duplicate samples of DNA (10 ng/100 μL phosphate-buffered saline [PBS]) were placed into individual wells in 96-well Universal DNA Bind plates (Corning Inc., Big Flats, NY, USA) and allowed to adsorb to the bottom surfaces overnight at 4°C. DNA was cross-linked by UV irradiation according to the manufacturer’s protocol. After blocking with 2% BSA in PBS, the samples were incubated with 0.1 μg/mL monoclonal anti8-OHdG (Abcam, Cambridge, MA, USA) for 1 h at room temperature, followed by HRP-conjugated secondary antibody as described above. Immunoreactivity was detected with Amplex Red soluble fluorophore, and fluorescence (Ex 530/Em 590) was read in a SpectraMax M5 microplate reader (Molecular Devices). Then, to correct for differences in the amounts of DNA adsorbed to the well surfaces, bound DNA was labeled with H33342, and fluorescence was measured (Ex 360/Em 460) in the SpectraMax M5. The calculated ratio of Amplex Red/H33342 fluorescence in corresponding wells was used as the index of 8OHdG immunoreactivity.
Source of reagents
Human recombinant [125I]-Insulin, IGF-I, and IGF-II were purchased from Amersham Biosciences (Boston, MA, USA). Unlabeled human insulin, recombinant IGF-I, and recombinant IGF-II were obtained from Bachem (Torrance, CA, USA). QuantiTect SYBR Green PCR Mix was obtained from (Qiagen). Monoclonal antibodies to 8-OHdG, HNE, GAPDH, β-actin, and activated Caspase 3 were purchased from Chemicon (Tecumsula, CA, USA). The A85G6 mouse monoclonal antibody to AAH was generated in our laboratory with purified recombinant protein. Reagents for immunohistochemical staining were purchased from Abcam Corp or Vector Laboratories (Burlingame, CA, USA). All other fine chemicals were purchased from either CalBiochem (Carlsbad, CA, USA) or Sigma-Aldrich (St. Louis, MO, USA).
Statistical analysis
Data depicted in the graphs represent the mean ± SEM for each group. Inter-group comparisons were made using Student’s t-tests. Statistical analyses were performed using the Number Cruncher Statistical System (Dr Jerry L. Hintze, Kaysville, UT, USA) or GraphPad Prism 4 software (GraphPad Software). The computer software–generated significant P-values are indicated over the graphs.
Results
Increased lipid peroxidation products and DNA damage in livers from ethanol-fed rats
Histological sections of liver revealed microvesicular lipid accumulation in hepatocytes of ethanol-fed (n = 13) relative to control (n = 12) rats (Fig. 1a,b) as previously described.19 In addition to steatosis, the ethanol-exposed livers had multiple foci of intralobular lymphomononuclear cell inflammation, as well as scattered foci of apoptosis or necrosis (data not shown).19 Adjacent histological sections were immunostained to detect oxidative stress and DNA damage using monoclonal antibodies to HNE and 8-OHdG, respectively (Fig. 1c–f). HNE reflects cellular accumulation of lipid peroxidation by-products, which are potent sources of oxidative stress and can lead to increased DNA damage. 8-OHdG immunoreactivity reflects DNA incorporation of abnormal guanine deoxynucleotides into damaged DNA. For the most part, 8-OHdG gets incorporated into mitochondrial DNA due to its greater susceptibility to oxidative damage compared with genomic DNA. Immunohistochemical staining demonstrated increased immunoreactivity corresponding to both HNE and 8-OHdG in livers of ethanol-exposed relative to control rats (Fig. 1c–f). The increased 8-OHdG immunoreactivity was mainly localized in the cytoplasm (Fig. 1f), suggesting mitochondrial as opposed to nuclear DNA incorporation. ELISA studies (n = 12 per group) confirmed that chronic ethanol exposure significantly increased the levels of HNE (Fig. 2a) and 8-OHdG (Fig. 2b) immunoreactivities in liver, and also showed that these abnormalities were associated with increased activation of caspase 3 (Fig. 2c) as previously reported19 (Fig. 2). In contrast, the chronic ethanol feeding did not significantly impair the expression of β-actin (Fig. 2d). Together, these results demonstrate that chronic ethanol feeding promotes hepatocellular injury with increased oxidative stress, DNA (mitochondrial) damage, and caspase activation.
Figure 1.

Histopathology of chronic ethanol-induced liver injury. Adult Long-Evans rats were fed for 8 weeks with isocaloric liquid diets containing 0% (n = 12) (a,c,e) or 37% (n = 13) (b,d,f) ethanol by caloric content. Paraffin-embedded sections of liver were stained with hematoxylin–eosin (a,b). Note the disordered hepatic architecture with loss of chord organization and increased steatosis (inset) in the ethanol-exposed liver. Adjacent sections were immunostained to detect 4-hydroxy-2,3-nonenol (HNE) (c,d) or 8-hydroxy-2′-deoxyguanosine (8-OHdG) (e,f). Immunoreactivity was revealed with polymer-tagged horseradish peroxidase (HRP)-conjugated secondary antibody, and DAB as the chromogen (brown precipitate) (Magnification: 450×).
Figure 2.

Increased oxidative stress, DNA damage, and caspase 3 activation in ethanol-exposed livers. (a) 4-hydroxy-2,3-nonenol (HNE), (c) activated caspase 3, and (d) β-actin immunoreactivities were measured by direct protein ELISA. (b) 8-hydroxy-2′-deoxyguanosine (8-OHdG) levels were measured by DNA ELISA. Immunoreactivity was detected with horseradish peroxidase (HRP)–conjugated secondary antibody and Amplex Red fluorescence (Ex530 nm/Em590 nm) and quantified in an M5 machine. Graphs depict the mean ± SEM calculated HNE or activated Caspase 3 to β-actin ratios, or 8-OHdG/total DNA (H33342 fluorescence: Ex 360 nm/Em 460 nm) measured in control (n = 12) and ethanol-exposed (n = 12) livers. Significant P-values are shown over the bars. RFU, relative fluorescent units.
Effects of ethanol on insulin and IGF-I, and IGF-II receptor expression
Previous studies have shown that chronic ethanol exposure inhibits insulin signaling through IRS-1.6–9,19 To further characterize potential mechanisms by which ethanol impairs signaling through IRS-1, qRT-PCR assays were used to measure mRNA levels of insulin, IGF-I, IGF-II, their corresponding receptors, and IRS-1, IRS-2, and IRS-4 in liver tissue. IGF-II and IGF-II receptor mRNA levels were measured because, in addition to signaling through its own receptor, IGF-II can signal through the insulin or IGF-I receptor and promote cross-talk signaling through IRS-1.18 IRS-1, IRS-2, and IRS-4 mRNA levels were measured because reductions in these molecules could also impair insulin and IGF-mediated signaling.
qRT-PCR detected mRNA transcripts corresponding to insulin, IGF-I and IGF-II polypeptides, and insulin, IGF-I, and IGF-II receptors in control (n = 8) and ethanol-exposed (n = 8) livers (Fig. 3). In control livers, IGF-I mRNA was more abundantly expressed than insulin and IGF-II. In ethanol-exposed livers, IGF-I and IGF-II mRNA transcripts were similarly abundant and both were higher than insulin. With regard to the receptors, in control livers, insulin receptor mRNA transcripts were most abundant, followed by IGF-II receptor, and then IGF-I receptors. In ethanol-exposed livers, IGF-II receptors were most abundant followed by insulin receptors and then IGF-I receptors. Insulin and insulin receptor mRNA transcripts were similarly abundant in control and ethanol-exposed livers (Fig. 3a,d). IGF-I mRNA expression was significantly reduced in ethanol-exposed relative to control livers (Fig. 3b), while IGF-I receptor mRNA was significantly increased in the ethanol-exposed relative to control livers (Fig. 3e). IGF-II and IGF-II receptor mRNA levels were also significantly higher in the ethanol-exposed relative to control livers (Fig. 3c,f). In contrast to the effects of ethanol on the mRNA levels of IGF-I and IGF-II and corresponding receptors, ethanol exposure had no significant effect on the mean levels of IRS-1, IRS-2, or IRS-4 mRNA (Fig. 4).
Figure 3.
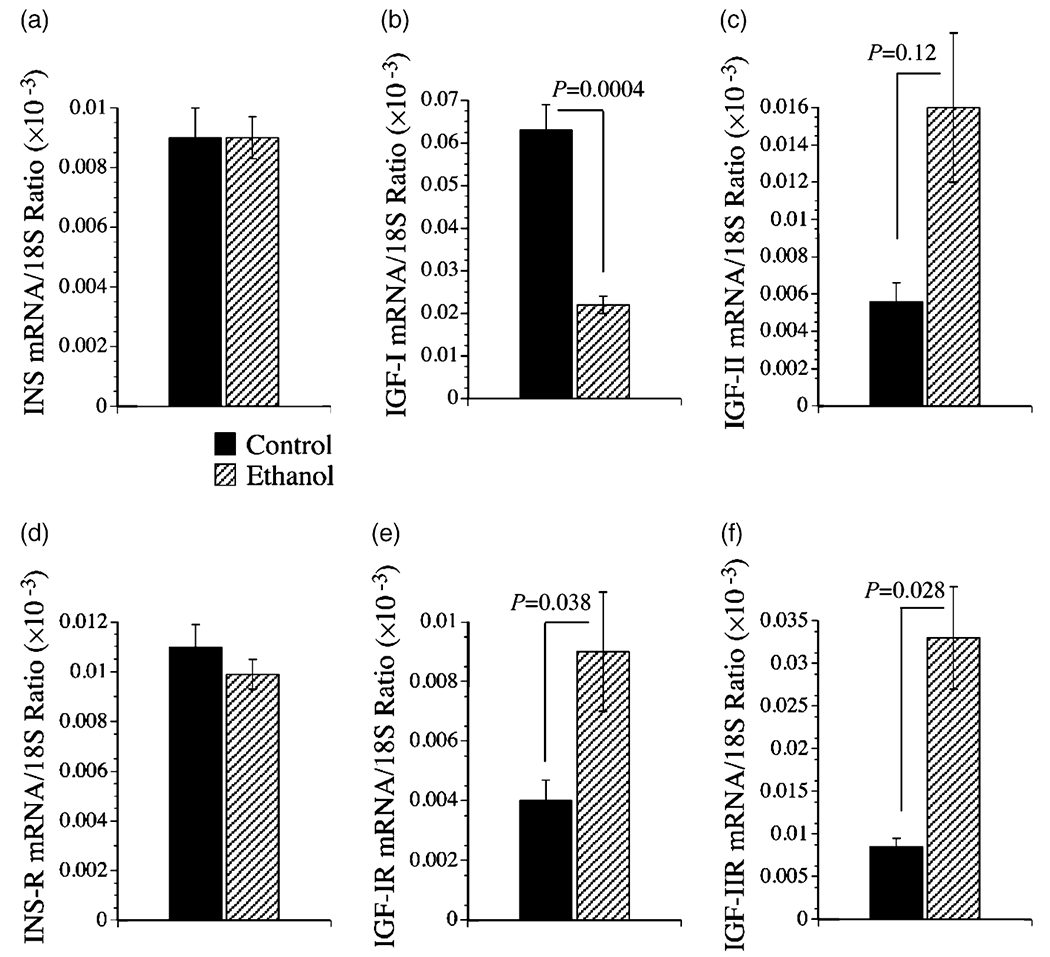
Effects of chronic ethanol feeding on hepatic mRNA expression of (a) insulin (INS), (b) insulin-like growth factor, type I (IGF-I) and (c) IGF-II (d) insulin receptor (R), and (e) IGF-I receptor and (f) IGF-II receptor as demonstrated using quantitative reverse transcriptase–polymerase chain reaction (qRT-PCR). RNA extracted from livers of adult control (n = 8) and ethanol-fed (n = 8) Long-Evans rats was reverse transcribed using random primers. The mRNA levels were measured using gene specific primers, and the values were normalized to 18S rRNA. Graphs depict the mean ± SEM of results. Data were analyzed statistically using Student’s t-tests. Significant P-values are indicated over the graphs.
Figure 4.

Effects of chronic ethanol feeding on hepatic mRNA expression of (a) insulin receptor substrate (IRS) type 1, (b) IRS-2, (c) IRS-4, and (d) AAH mRNA as demonstrated using quantitative reverse transcriptase–polymerase chain reaction (qRT-PCR). RNA extracted from liver tissue of adult control (n = 8) and ethanol-fed (n = 8) Long-Evans rats was reverse transcribed using random primers. The cDNA templates were subjected to qRT-PCR using gene-specific primers. The calculated ng quantities of cDNA detected in the reactions were normalized to 18S rRNA. Graphs depict the mean ± SEM of results. Data were analyzed statistically using Student’s t-tests. Significant P-values are indicated over the graphs.
Ethanol impairs insulin and IGF receptor binding
Effective ligand binding is critical to the signaling cascade, and many of the downstream effects of impaired insulin signaling that have been reported in ethanol-exposed livers and HCC cells, including reduced cell survival, could be mediated by inhibition of insulin binding to its receptors. Given the ethanol-mediated alterations in IGF-I and IGF-II receptor expression, and the fact that signaling through IGF-I or IGF-II activates IRS pathways either directly or via cross-talk, it was of interest to measure IGF-I and IGF-II receptor binding as well. Equilibrium binding assays, performed by incubating control (n = 8) or ethanol-exposed (n = 8) liver membrane protein extracts with [125I]-labeled insulin, IGF-I, or IGF-II as tracer, in the presence or absence of excess cold ligand, demonstrated that in control livers, IGF-II receptor binding (fmol/mg) was highest, followed by IGF-I, and then insulin (Fig. 5). Chronic ethanol feeding significantly reduced the mean levels of insulin receptor binding (Fig. 5a), but did not significantly reduce IGF-I (Fig. 5b) or IGF-II (Fig. 5c) receptor binding.
Figure 5.

Effects of chronic ethanol feeding on insulin and insulin-like growth factor receptor binding in the liver. Equilibrium binding to membrane proteins was assayed using [125I]-labeled insulin, IGF-I, or IGF-II, in the presence or absence of excess unlabeled ligand. Membrane bound tracer was precipitated and radioactivity present in the supernatant fractions (containing unbound ligand) and the pellets (containing bound ligand) were measured in a gamma counter. Specific binding (fmol/mg) was calculated using the GraphPad Prism 4 software. Graphs depict the mean ± SEM of results (n = 8 per group) obtained for the (a) insulin, (b) IGF-I, and (c) IGF-II specific binding. Data were analyzed statistically using Student’s t-tests. Significant P-values are indicated over the bar graphs.
Ethanol-associated impairments in downstream gene expression
To examine the effects of chronic ethanol exposure on downstream target genes of insulin and IGF signaling, AAH and GAPDH expression were examined by Western blot analysis (n = 6 per group) and ELISA (n = 12 per group) (Fig. 6). In addition, AAH mRNA was measured by qRT-PCR (n = 8 per group; Fig. 4d), and p85 protein (subunit of PI3 kinase) was examined by Western blot analysis (n = 6 per group; Fig. 6a,d) as a negative control. Western blot analysis detected the expected size proteins corresponding to AAH, GAPDH, and p85, and relatively higher levels of AAH and GAPDH protein in control relative to ethanol-exposed livers, as demonstrated in example results shown in Fig. 6a. The qRT-PCR analysis also demonstrated significantly higher levels of AAH mRNA in livers of control versus ethanol-fed rats (Fig. 4d). ELISAs demonstrated significantly higher levels of AAH and GAPDH immunoreactivity in control relative to ethanol-exposed livers (Fig. 6b,c), and similar levels of p85 protein in control and ethanol-exposed livers (Fig. 6d), corresponding with results obtained by Western blot analysis.
Figure 6.

Chronic ethanol feeding inhibits insulin-responsive gene expression in the liver. Adult Long-Evans rats were fed with isocaloric control or ethanol-containing liquid diets for 8 weeks. Liver protein homogenates were used to measure AAH (A85G6 antibody), glyceraldehydes-3-phosphate dehydrogenase (GAPDH), and the p85 subunit of PI3 kinase (loading control) protein expression by (a) Western blot analysis (n = 6 per group) or (b–d) ELISA (n = 12 per group). In panel a, positions of molecular weight standards are shown at the left, and representative results are shown. (b) AAH, (c) GAPDH, and (d) p85-PI3 kinase protein levels were also measured direct by ELISA using HRP-conjugated secondary antibody and ECL reagents. Luminescence (relative light units; RLU) was measured in a Top Count machine. Graphs depict the mean ± SEM of results. Inter-group statistical comparisons were made using Student’s t-tests. Significant P-values are indicated over the bar graphs. Con, control; EtOH ethanol.
Discussion
We investigated the in vivo effects of ethanol on insulin and IRS-1–mediated growth and survival signaling, and evaluated the potential roles of increased oxidative stress and DNA damage as mediators of ethanol-impaired liver regeneration. This study extends the field of knowledge because the analyses were performed with otherwise normal livers, whereas previous reports have mainly examined ethanol’s adverse effects in cultured hepatocytes, transformed hepatic cell lines, rats subjected to partial hepatectomy, or transgenic mice that over-expressed IRS-1 in the liver. This study is also an extension of our previous work demonstrating that Long-Evans rats could be used to generate a robust model of ethanol-induced liver injury with evidence of chronic inflammation, apoptosis, prominent hepatocellular steatosis, and caspase-3 activation after 6–8 weeks of chronic ethanol feeding.19 We linked these histopathological abnormalities to impairments in survival signaling due to inhibition of PI3 kinase and increased activation of PTEN.19
Hepatotoxic effects of ethanol in the adult liver
In human chronic alcoholics, liver injury is characterized by hepatocellular steatosis, lymphomononuclear cell inflammation, on-going hepatocellular necrosis, apoptosis, and drop-out, and disorganization of the lobular architectures. With persistent injury, fibrosis increases and eventually evolves to cirrhosis, and finally to end-stage liver disease.43 As observed in humans, Long-Evans rats that were chronically fed ethanol developed liver disease characterized by micro- and macrosteatosis, hepatocellular unrest, focal lobular inflammation, and scattered hepatocellular apoptosis/necrosis. However, we did not detect increased fibrosis or regenerative nodule formation within the time frame of this study. Nonetheless, the ongoing hepatocellular injury was associated with increased DNA damage, lipid peroxidation, and Caspase activation, consistent with earlier reports in experimental models.19,44–46 Although the magnitudes of the intergroup differences in the mean levels of HNE and activated Caspae 3 were relatively small, they were nonetheless reproducible. Conceivably, over time, small constitutive ethanol-associated increases in oxidative stress and DNA damage could have cumulative effects on various liver functions as well as hepatocellular suvival. Potential mechanisms of ethanol-mediated DNA damage, lipid peroxidation, and impaired insulin signaling include acetaldehyde-induced protein and DNA adduct formation44–46 and mitochondrial dysfunction.47–49
Effects of ethanol on the expression of genes required for insulin and IGF signaling
The qRT-PCR studies demonstrated that the genes required for insulin and IGF signaling are expressed in both control and ethanol-exposed livers. Since ethanol feeding did not alter insulin polypeptide or insulin receptor expression, the ethanol-mediated impairments in hepatic insulin signaling would have to be attributed to factors other than local availability of the ligand and/or receptor. In contrast, the ethanol-associated reductions in IGF-I expression could have contributed to impairments in IGF-I-mediated signaling, although the associated increased expression of IGF-I receptor could reflect a compensatory response capable of masking this effect of ethanol in liver. The significantly increased expression of IGF-II and IGF-II receptors in ethanol-exposed livers is of interest because enhanced IGF-II signaling is a consistent feature in human hepatocellular carcinomas.35 In this regard, IGF-II stimulates cell growth and survival by: (i) interacting with its own receptor, (ii) activating PI3 kinase-Akt via G-coupled protein signaling,50 and (iii) binding to insulin and IGF-I receptors, and thereby activating growth and survival signaling through IRS-dependent mechanisms.51,52 Therefore, the mechanism by which chronic ethanol exposure serves as a cofactor in the pathogenesis of hepatocellular carcinoma53 may involve up-regulated signaling through IGF-II and its receptor.
Ethanol impairs insulin receptor binding
Effective ligand binding is critical for intracellular signaling, and many of the previously reported downstream adverse effects of ethanol on insulin signaling, including reduced cell survival, could be mediated by impaired insulin binding to its receptor. Equilibrium binding assays demonstrated that chronic ethanol exposure significantly impaired binding to the insulin receptor, but did not significantly alter binding the IGF-I or IGF-II receptors, despite their increased levels of gene expression. This result corresponds with our previous findings of impaired insulin responsiveness and intracellular signaling in ethanol-treated hepatocyte cultures and in livers of ethanol-fed rodents.6–9,54 Together, these findings suggest that chronic ethanol exposure causes hepatic insulin resistance mediated by impaired binding to the insulin receptor.
Impaired binding to the insulin receptor could account for the significant reductions in insulin-responsive gene expression observed in the livers of ethanol-fed rats. These results correspond with previous findings of ethanol-mediated brain and hepatic insulin resistance in experimental models of chronic ethanol exposure.22,26,27,40,55–59 In addition, ethanol can have broad inhibitory effects on insulin signaling, as evidenced by the finding of whole-body insulin resistance in chronic ethanol-exposed humans and experimental animals.60–63 Although the levels of IRS-1, 2, and 4 mRNA transcripts were not significantly altered, and therefore the molecular machinery required to transmit signals downstream from the insulin receptor remained intact following chronic ethanol exposure, impaired binding to the insulin receptor would significantly reduce activation of the insulin receptor tyrosine kinase, which is needed to tyrosyl phosphorylate IRS and propagate the signaling cascade. Correspondingly, in our previous study, we demonstrated reduced levels of IRS-1-associated PI3 kinase activity in livers of chronic ethanol-fed Long-Evans rats.19 Together, the findings provide further evidence that ethanol-associated impairments in insulin responsiveness and downstream signaling are mediated at the receptor level, i.e. the most proximal point in the signal transduction cascade.
Consequences of ethanol-impaired insulin signaling in relation to liver function
To begin to examine the consequences of ethanol impaired insulin signaling, we measured the expression of two insulin-responsive genes, GAPDH, which regulates energy metabolism, and AAH, which has a demonstrated role in regulating cell motility33,35–37 needed for liver remodeling and regeneration after injury. The qRT-PCR, Western blot, and/or ELISA studies demonstrated significantly reduced GAPDH and AAH expression in ethanol-exposed livers. Reduced levels of GAPDH expression could lead to impaired energy metabolism and promote oxidative stress, and thereby contribute to DNA damage. The role of impaired AAH expression in the context of chronic ethanol exposure is not entirely clear. However, given the demonstrated role of AAH in relation to cell motility,33,35–37 and the fact that cell motility is required for tissue remodeling after injury, the markedly disordered lobular architecture observed herein in the ethanol-exposed livers may have been partly due to significantly reduced levels of AAH expression and attendant limited capacity for remodeling.
Together, the results suggest that chronic ethanol consumption causes hepatic insulin resistance associated with hepatic steatosis, reduced expression of insulin-responsive genes, and increased lipid peroxidation and DNA damage. Ethanol-induced liver injury appears to be mediated by at least two mechanisms: (i) insulin resistance, which is mainly effectuated by impaired insulin receptor binding, and (ii) increased oxidative stress caused by DNA damage and lipid peroxidation. The latter could be attributed to the combined effects of injury caused by ethanol’s toxic metabolites, e.g. acetaldehyde, impaired energy metabolism due to inhibition of insulin signaling, and mitochondrial dysfunction caused by direct mitochondrial DNA damage and lipid peroxidation. These results suggest that human chronic alcoholic liver disease may be treatable with peroxisome proliferator-activated receptor (PPAR) agonists which, in addition to functioning as insulin sensitizer agents, also have significant antioxidant/anti-inflammatory properties that could help reduce DNA damage and lipid peroxidation, and thereby better enable chronically injured hepatocytes to regenerate, repair, and function.
Table 1.
Primer pairs for quantitative RT-PCR
| Primer | Direction | Sequence (5′→3′) | Position (mRNA) | Amplicon size (bp) |
|---|---|---|---|---|
| 18S rRNA | For | GGA CAC GGA CAG GAT TGA CA | 1278 | 50 |
| 18S rRNA | Rev | ACC CAC GGA ATC GAG AAA GA | 1327 | |
| Insulin | For | TTC TAC ACA CCC AAG TCC CGT C | 145 | 135 |
| Insulin | Rev | ATC CAC AAT GCC ACG CTT CTG C | 279 | |
| Insulin receptor | For | TGA CAA TGA GGA ATG TGG GGA C | 875 | 129 |
| Insulin receptor | Rev | GGG CAA ACT TTC TGA CAA TGA CTG | 1003 | |
| IGF-I | For | GAC CAA GGG GCT TTT ACT TCA AC | 65 | 127 |
| IGF-I | Rev | TTT GTA GGC TTC AGC GGA GCA C | 191 | |
| IGF-I receptor | For | GAA GTC TGC GGT GGT GAT AAA GG | 2138 | 113 |
| IGF-I receptor | Rev | TCT GGG CAC AAA GAT GGA GTT G | 2250 | |
| IGF-II | For | CCA AGA AGA AAG GAA GGG GAC C | 763 | 95 |
| IGF-II | Rev | GGC GGC TAT TGT TGT TCA CAG C | 857 | |
| IGF-II receptor | For | TTG CTA TTG ACC TTA GTC CCT TGG | 1066 | 91 |
| IGF-II receptor | Rev | AGA GTG AGA CCT TTG TGT CCC CAC | 1156 | |
| IRS-1 | For | GAT ACC GAT GGC TTC TCA GAC G | 604 | 134 |
| IRS-1 | Rev | TCG TTC TCA TAA TAC TCC AGG CG | 737 | |
| IRS-2 | For | CAA CAT TGA CTT TGG TGA AGG GG | 255 | 109 |
| IRS-2 | Rev | TGA AGC AGG ACT ACT GGC TGA GAG | 363 | |
| IRS-4 | For | ACC TGA AGA TAA GGG GTC GTC TGC | 2409 | 132 |
| IRS-4 | Rev | TGT GTG GGG TTT AGT GGT CTG G | 2540 | |
| AAH | For | TGC CTG CTC GTC TTG TTT GTG | 1650 | 256 |
| AAH | Rev | ATC CGT TCT GTA ACC CGT TGG | 1906 |
AAH, aspartyl-(asparaginyl)-β-hydroxylase; IGF, insulin-like growth factor; IRS, insulin receptor substrate; RT-PCR, reverse transcriptase polymerase chain reaction.
Acknowledgment
Research was supported by AA02666, AA02169, AA11431, AA12908, and AA-16126 grants from the National Institutes of Health.
References
- 1.Duguay L, Coutu D, Hetu C, Joly JG. Inhibition of liver regeneration by chronic alcohol administration. Gut 1982; 23: 8–13. [DOI] [PMC free article] [PubMed] [Google Scholar]
- 2.Wands JR, Carter EA, Bucher NL, Isselbacher KJ. Inhibition of hepatic regeneration in rats by acute and chronic ethanol intoxication. Gastroenterology 1979; 77: 528–31. [PubMed] [Google Scholar]
- 3.Diehl AM, Thorgeirsson SS, Steer CJ. Ethanol inhibits liver regeneration in rats without reducing transcripts of key protooncogenes. Gastroenterology 1990; 99: 1105–12. [DOI] [PubMed] [Google Scholar]
- 4.Wands JR, Carter EA, Bucher NL, Isselbacher KJ. Effect of acute and chronic ethanol intoxication on hepatic regeneration. Adv. Exp. Med. Biol 1980; 132: 663–70. [DOI] [PubMed] [Google Scholar]
- 5.Carter EA, Wands JR. Ethanol inhibits hormone stimulated hepatocyte DNA synthesis. Biochem. Biophys. Res. Commun 1985; 128: 767–74. [DOI] [PubMed] [Google Scholar]
- 6.Sasaki Y, Wands JR. Ethanol impairs insulin receptor substrate-1 mediated signal transduction during rat liver regeneration. Biochem. Biophys. Res. Commun 1994; 199: 403–9. [DOI] [PubMed] [Google Scholar]
- 7.Sasaki Y, Hayashi N, Ito T, Fusamoto H, Kamada T, Wands JR. Influence of ethanol on insulin receptor substrate-1-mediated signal transduction during rat liver regeneration. Alcohol Alcohol. 1994; 1: 99–106. [PubMed] [Google Scholar]
- 8.Banerjee K, Mohr L, Wands JR, de la Monte SM. Ethanol inhibition of insulin signaling in hepatocellular carcinoma cells. Alcohol. Clin. Exp. Res 1998; 22: 2093–101. [PubMed] [Google Scholar]
- 9.Mohr L, Tanaka S, Wands JR. Ethanol inhibits hepatocyte proliferation in insulin receptor substrate 1 transgenic mice. Gastroenterology 1998; 115: 1558–65. [DOI] [PubMed] [Google Scholar]
- 10.Li W, Liu X, Yanoff M. Phosphatidylcholine hydrolysis and DNA synthesis in cultured retinal capillary pericytes. Microvasc. Res 1995; 49: 350–63. [DOI] [PubMed] [Google Scholar]
- 11.Roberts RA, James NH, Cosulich SC. The role of protein kinase B and mitogen-activated protein kinase in epidermal growth factor and tumor necrosis factor alpha-mediated rat hepatocyte survival and apoptosis. Hepatology 2000; 31: 420–7. [DOI] [PubMed] [Google Scholar]
- 12.Rust C, Bauchmuller K, Fickert P, Fuchsbichler A, Beuers U. Phosphatidylinositol 3-kinase-dependent signaling modulates taurochenodeoxycholic acid-induced liver injury and cholestasis in perfused rat livers. Am. J. Physiol. Gastrointest. Liver Physiol 2005; 289: G88–94. [DOI] [PubMed] [Google Scholar]
- 13.Valverde AM, Fabregat I, Burks DJ, White MF, Benito M. IRS-2 mediates the antiapoptotic effect of insulin in neonatal hepatocytes. Hepatology 2004; 40: 1285–94. [DOI] [PubMed] [Google Scholar]
- 14.Michl P, Downward J. Mechanisms of disease: PI3K/AKT signaling in gastrointestinal cancers. Z. Gastroenterol 2005; 43: 1133–9. [DOI] [PubMed] [Google Scholar]
- 15.Li XL, Man K, Ng KT, Sun CK, Lo CM, Fan ST. The influence of phosphatidylinositol 3-kinase/Akt pathway on the ischemic injury during rat liver graft preservation. Am. J. Transplant 2005; 5: 1264–75. [DOI] [PubMed] [Google Scholar]
- 16.Chang L, Chiang SH, Saltiel AR. Insulin signaling and the regulation of glucose transport. Mol. Med 2004; 10: 65–71. [DOI] [PMC free article] [PubMed] [Google Scholar]
- 17.Giovannone B, Scaldaferri ML, Federici M et al. Insulin receptor substrate (IRS) transduction system: distinct and overlapping signaling potential. Diabetes Metab. Res. Rev 2000; 16: 434–41. [DOI] [PubMed] [Google Scholar]
- 18.de la Monte S, Wands J. Review of insulin and insulin-like growth factor expression, signaling, and malfunction in the central nervous system: relevance to Alzheimer’s disease. J. Alzheimers Dis 2005; 7: 45–61. [DOI] [PubMed] [Google Scholar]
- 19.Yeon JE, Califano S, Xu J, Wands JR, De La Monte SM. Potential role of PTEN phosphatase in ethanol-impaired survival signaling in the liver. Hepatology 2003; 38: 703–14. [DOI] [PubMed] [Google Scholar]
- 20.Carmiel-Haggai M, Cederbaum AI, Nieto N. Binge ethanol exposure increases liver injury in obese rats. Gastroenterology 2003; 125: 1818–33. [DOI] [PubMed] [Google Scholar]
- 21.McVicker BL, Tuma DJ, Kubik JL, Tuma PL, Casey CA. Ethanol-induced apoptosis in polarized hepatic cells possibly through regulation of the Fas pathway. Alcohol. Clin. Exp. Res 2006; 30: 1906–15. [DOI] [PubMed] [Google Scholar]
- 22.Yao XH, Chen L, Nyomba BL. Adult rats prenatally exposed to ethanol have increased gluconeogenesis and impaired insulin response of hepatic gluconeogenic genes. J. Appl. Physiol 2006; 100: 642–8. [DOI] [PubMed] [Google Scholar]
- 23.Sadri P, Legare DJ, Takayama S, Lautt WW. Increased incidence of hepatic insulin-sensitizing substance (HISS) -dependent insulin resistance in female rats prenatally exposed to ethanol. Can. J. Physiol. Pharmacol 2005; 83: 383–7. [DOI] [PubMed] [Google Scholar]
- 24.Tomita K, Azuma T, Kitamura N et al. Pioglitazone prevents alcohol-induced fatty liver in rats through up-regulation of c-Met. Gastroenterology 2004; 126: 873–85. [DOI] [PubMed] [Google Scholar]
- 25.Enomoto N, Takei Y, Hirose M et al. Prevention of ethanol-induced liver injury in rats by an agonist of peroxisome proliferator-activated receptor-gamma, pioglitazone. J. Pharmacol. Exp. Ther 2003; 306: 846–54. [DOI] [PubMed] [Google Scholar]
- 26.Onishi Y, Honda M, Ogihara T et al. Ethanol feeding induces insulin resistance with enhanced PI 3-kinase activation. Biochem. Biophys. Res. Commun 2003; 303: 788–94. [DOI] [PubMed] [Google Scholar]
- 27.Patel BC, D’Arville C, Iwahashi M, Simon FR. Impairment of hepatic insulin receptors during chronic ethanol administration. Am. J. Physiol 1991; 261 (2 Pt 1): G199–205. [DOI] [PubMed] [Google Scholar]
- 28.Doroquez DB, Rebay I. Signal integration during development: mechanisms of EGFR and Notch pathway function and cross-talk. Crit. Rev. Biochem. Mol. Biol 2006; 41: 339–85. [DOI] [PubMed] [Google Scholar]
- 29.Wilson A, Radtke F. Multiple functions of Notch signaling in self-renewing organs and cancer. FEBS Lett. 2006; 580: 2860–8. [DOI] [PubMed] [Google Scholar]
- 30.de La Coste A, Freitas AA. Notch signaling: distinct ligands induce specific signals during lymphocyte development and maturation. Immunol. Lett 2006; 102: 1–9. [DOI] [PubMed] [Google Scholar]
- 31.Cornell RA, Eisen JS. Notch in the pathway: the roles of Notch signaling in neural crest development. Semin. Cell Dev. Biol 2005; 16: 663–72. [DOI] [PubMed] [Google Scholar]
- 32.Lasky JL, Wu H. Notch signaling, brain development, and human disease. Pediatr. Res 2005; 57 (5 Pt 2): 104R–109R. [DOI] [PubMed] [Google Scholar]
- 33.Sepe PS, Lahousse SA, Gemelli B et al. Role of the aspartyl-asparaginyl-beta-hydroxylase gene in neuroblastoma cell motility. Lab. Invest 2002; 82: 881–91. [DOI] [PubMed] [Google Scholar]
- 34.Maeda T, Sepe P, Lahousse S et al. Antisense oligodeoxynucleotides directed against aspartyl (asparaginyl) beta-hydroxylase suppress migration of cholangiocarcinoma cells. J. Hepatol 2003; 38: 615–22. [DOI] [PubMed] [Google Scholar]
- 35.Cantarini MC, de la Monte SM, Pang M et al. Aspartyl-asparagyl beta hydroxylase over-expression in human hepatoma is linked to activation of insulin-like growth factor and notch signaling mechanisms. Hepatology 2006; 44: 446–57. [DOI] [PubMed] [Google Scholar]
- 36.de la Monte SM, Tamaki S, Cantarini MC et al. Aspartyl-(asparaginyl) -beta-hydroxylase regulates hepatocellular carcinoma invasiveness. J. Hepatol 2006; 44: 971–83. [DOI] [PubMed] [Google Scholar]
- 37.Lahousse SA, Carter JJ, Xu JX, Wands JR, de la Monte SM. Differential growth factor regulation of aspartyl-(asparaginyl)-b-hydroxylase family genes in SH-Sy5y human neuroblastoma cells. BMC Cell Biol. 2006; 7: 41. [DOI] [PMC free article] [PubMed] [Google Scholar]
- 38.Alexander BM, Dugast I, Ercolani L, Kong XF, Giere L, Nasrin N. Multiple insulin-responsive elements regulate transcription of the GAPDH gene. Adv. Enzyme Regul 1992; 32: 149–59. [DOI] [PubMed] [Google Scholar]
- 39.Urso T, Gavaler JS, Van TD. Blood ethanol levels in sober alcohol users seen in an emergency room. Life Sci. 1981; 28: 1053–6. [DOI] [PubMed] [Google Scholar]
- 40.Soscia SJ, Tong M, Xu XJ et al. Chronic gestational exposure to ethanol causes insulin and IGF resistance and impairs acetylcholine homeostasis in the brain. Cell Mol. Life Sci 2006; 63: 2039–56. [DOI] [PMC free article] [PubMed] [Google Scholar]
- 41.Cohen AC, Tong M, Wands JR, de la Monte SM. Insulin and Insulin-Like Growth Factor Resistance With Neurodegeneration in an Adult Chronic Ethanol Exposure Model. Alcohol. Clin. Exp. Res 2007; 31: 1–16. [DOI] [PubMed] [Google Scholar]
- 42.Kikuchi A, Takeda A, Onodera H et al. Systemic increase of oxidative nucleic acid damage in Parkinson’s disease and multiple system atrophy. Neurobiol. Dis 2002; 9: 244–8. [DOI] [PubMed] [Google Scholar]
- 43.Mendez-Sanchez N, Almeda-Valdes P, Uribe M. Alcoholic liver disease. An update. Ann. Hepatol 2005; 4: 32–42. [PubMed] [Google Scholar]
- 44.Kim H, Oh E, Im H et al. Oxidative damages in the DNA, lipids, and proteins of rats exposed to isofluranes and alcohols. Toxicology 2006; 220: 169–78. [DOI] [PubMed] [Google Scholar]
- 45.Jaeschke H, Gores GJ, Cederbaum AI, Hinson JA, Pessayre D, Lemasters JJ. Mechanisms of hepatotoxicity. Toxicol. Sci 2002; 65: 166–76. [DOI] [PubMed] [Google Scholar]
- 46.Brooks PJ. DNA damage, DNA repair, and alcohol toxicity – a review. Alcohol. Clin. Exp. Res 1997; 21: 1073–82. [PubMed] [Google Scholar]
- 47.Waldhauser KM, Torok M, Ha HR et al. Hepatocellular toxicity and pharmacological effect of amiodarone and amiodarone derivatives. J. Pharmacol. Exp. Ther 2006; 319: 1413–23. [DOI] [PubMed] [Google Scholar]
- 48.Bardag-Gorce F, French BA, Dedes J, Li J, French SW. Gene expression patterns of the liver in response to alcohol: in vivo and in vitro models compared. Exp. Mol. Pathol 2006; 80: 241–51. [DOI] [PubMed] [Google Scholar]
- 49.Dey A, Cederbaum AI. Alcohol and oxidative liver injury. Hepatology 2006; 43 (2 Suppl. 1): S63–74. [DOI] [PubMed] [Google Scholar]
- 50.Patel TB. Single transmembrane spanning heterotrimeric g protein-coupled receptors and their signaling cascades. Pharmacol. Rev 2004; 56: 371–85. [DOI] [PubMed] [Google Scholar]
- 51.Herr F, Liang OD, Herrero J et al. Possible angiogenic roles of insulin-like growth factor II and its receptors in uterine vascular adaptation to pregnancy. J. Clin. Endocrinol. Metab 2003; 88: 4811–17. [DOI] [PubMed] [Google Scholar]
- 52.Zygmunt M, McKinnon T, Herr F, Lala PK, Han VK. HCG increases trophoblast migration in vitro via the insulin-like growth factor-II/mannose-6 phosphate receptor. Mol. Hum. Reprod 2005; 11: 261–7. [DOI] [PubMed] [Google Scholar]
- 53.Fattovich G, Stroffolini T, Zagni I, Donato F. Hepatocellular carcinoma in cirrhosis: incidence and risk factors. Gastroenterology 2004; 127 (5 Suppl. 1): S35–50. [DOI] [PubMed] [Google Scholar]
- 54.Jamal Z, Martin A, Gomez-Munoz A et al. Phosphatidate phosphohydrolases in liver, heart and adipose tissue of the JCR : LA corpulent rat and the lean genotypes: implications for glycerolipid synthesis and signal transduction. Int. J. Obes. Relat. Metab. Disord 1992; 16: 789–99. [PubMed] [Google Scholar]
- 55.Xu J, Yeon JE, Chang H et al. Ethanol impairs insulin-stimulated neuronal survival in the developing brain: role of PTEN phosphatase. J. Biol. Chem 2003; 278: 26929–37. [DOI] [PubMed] [Google Scholar]
- 56.de la Monte SM, Xu XJ, Wands JR. Ethanol inhibits insulin expression and actions in the developing brain. Cell Mol. Life Sci 2005; 62: 1131–45. [DOI] [PubMed] [Google Scholar]
- 57.Chen L, Zhang T, Nyomba BL. Insulin resistance of gluconeogenic pathways in neonatal rats after prenatal ethanol exposure. Am. J. Physiol. Regul. Integr. Comp. Physiol 2004; 286: R554–9. [DOI] [PubMed] [Google Scholar]
- 58.Flanagan DE, Pratt E, Murphy J et al. Alcohol consumption alters insulin secretion and cardiac autonomic activity. Eur. J. Clin. Invest 2002; 32: 187–92. [DOI] [PubMed] [Google Scholar]
- 59.Minuk GY, Meyers AF, Legare DJ, Sadri P, Lautt WW. Fetal exposure to alcohol results in adult insulin resistance in the rat. Proc. West. Pharmacol. Soc 1998; 41: 39–40. [PubMed] [Google Scholar]
- 60.Chen L, Nyomba BL. Whole body insulin resistance in rat offspring of mothers consuming alcohol during pregnancy or lactation: comparing prenatal and postnatal exposure. J. Appl. Physiol 2004; 96: 167–72. [DOI] [PubMed] [Google Scholar]
- 61.Moriya S, Yokoyama H, Hirose H, Ishii H, Saito I. Correlation between insulin resistance and gamma-glutamyl transpeptidase sensitivity in light drinkers. Alcohol. Clin. Exp. Res 2003; 27 (8 Suppl.): S52–7. [DOI] [PubMed] [Google Scholar]
- 62.Kornhuber HH, Backhaus B, Kornhuber AW, Kornhuber J. [The main cause of diabetes (type II): ‘normal’ alcohol drinking]. Versicherungsmedizin 1990; 42: 134–42. (In German) [PubMed] [Google Scholar]
- 63.Yokoyama H, Moriya S, Homma Y, Ogawa T. Association between gamma-glutamyl transpeptidase activity and status of disorders constituting insulin resistance syndrome. Alcohol. Clin. Exp. Res 2003; 27 (8 Suppl.): S22–5. [DOI] [PubMed] [Google Scholar]