Abstract
A highly sensitive and uniform surface-enhanced Raman scattering (SERS) substrate is the guarantee for reliable quantitative analysis. Herein, a three-dimensional TiO2–Ag SERS substrate was prepared by growing a TiO2 nanorods (NRs) array on a TiO2 compact layer (c-TiO2), followed by modification with Ag nanoparticles (AgNPs). The synergy between the c-TiO2, semiconductor TiO2 NRs and the plasmonic AgNPs collaboratively endowed it with high sensitivity, in which c-TiO2 effectively blocked the recombination of electrons and holes, and the charge transfer enhancement contributed 10-fold improvement over that without the c-TiO2 substrate. Besides the high sensitivity, the TiO2–Ag hybrid array SERS substrate also showed quantitative and multi-component detecting capability. The limit of detection (LOD) for crystal violet (CV) was determined to be 10−9 M even with a portable Raman instrument. The TiO2–Ag composite structure was extended to detect organic pesticides (thiram, triazophos and fonofos), and the LODs for thiram, triazophos and fonofos were measured to be 10−7 M, 10−7 M and 10−6 M, respectively. In addition, the realistic simulation detecting pesticide residues for a real sample of dendrobium was demonstrated. The sensitive, quantitative and multiplex analysis of the TiO2–Ag hybrid array substrate indicated its great potential in the rapid detection of pesticide residues in real samples.
A 3D TiO2–Ag array SERS substrate for rapid quantitative and multiplex analysis of pesticide residues for real samples.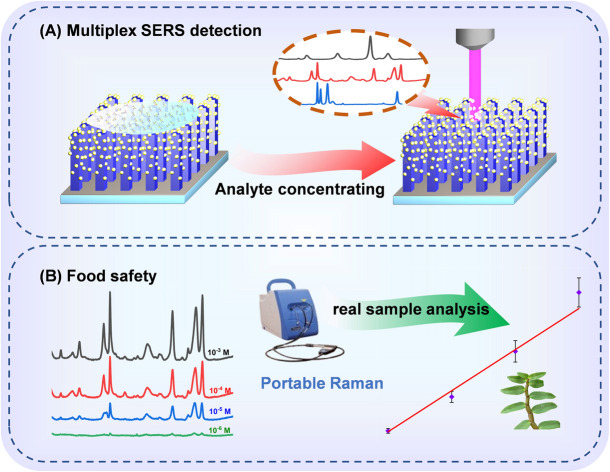
1. Introduction
Pesticides are widely adopted in the field of modern agriculture to promote plant yield; however, the abuse of the pesticides has aroused environmental and human health issues.1,2 Traditional pesticide residue analysis technology includes supercritical fluid chromatography (SFC), spectrophotometry, gas chromatography-mass spectrometry (GC-MS), and liquid chromatography-mass spectrometry (LC-MS), etc3–5. These methods are laboratory-based operations, time-consuming, and requiring complicated pretreatments, which is not suitable for rapid field analysis. On the other hand, traditional rapid detection methods, such as fluorescence, immunoassay, enzyme inhibition sensor and near infrared (NIR) spectroscopy have low accuracy or a narrow application range.6–9 Nowadays, SERS technology has become one of the important and reliable detection technologies for trace substances because of its advantages of fast, sensitive and fingerprint features.10,11 Food safety can be ensured using SERS analysis by rapid screening and monitoring of potential hazards.12–14
The enormous SERS enhancement can be attributed to the (i) electromagnetic enhancement mechanism (EM), which provides a 106–1012 enhancement of Raman signals for molecules because of the localized-surface plasmonic resonance effect, and the (ii) chemical enhancement mechanism (CM) which offers 10–100 times enhancement based on charge transfer between absorbed molecules and the metal surface.15–18 Because “hot spots” can occur at the sharp tips and vertices of noble metal nanostructures or in the gaps between nanoparticles, various noble metal nanostructures (such as Ag and Au) are extensively investigated and employed as highly-sensitive SERS substrates.19,20 Recently, semiconductor nanomaterials such as TiO2, ZnO and SnSe2 have been explored and used as efficient SERS substrates.21,22 Due to the semiconductor's advantages of high chemical inertness, lower cost, nontoxicity, photostability and good molecular selectivity, they have attracted extensive attention of researchers at home and abroad. The SERS enhancement principle in semiconductor materials is mainly the CM, also called the charge transfer enhancement.23 However, the enhancement factor (EF) of semiconductor materials (103–105) is still much lower than that of noble metal nanoparticles.23 Encouragingly, semiconductor-noble metal nanocomposites can achieve synergistic enhancement of noble metals and semiconductor materials, and have been implemented in ultra-sensitive chemical and biological sensing.24–29 For example, Wang and coauthors prepared a TiO2 nanosheet arrays deposited with Ag nanoparticles (AgNPs) as reusable SERS substrate for the analysis of chlorpyrifos with a low detection limit of 0.5 µM;30 Sarma's group reported Ag/ZnO heterostructure for SERS sensitive detection of biomimetic hydroxyapatite.31 Though great progress has been made, a higher sensitive and uniform semiconductor-noble metal hybrid SERS substrate with periodic array to fulfill quantitative and multiplex analysis are highly needed for portable and rapid detections.
Additionally, a reasonable designed phase interface structure of the semiconductor SERS substrate can efficiently separate electrons and holes and decrease the recombination rate,32 and therefore improve the CM enhancement of the semiconductor. For example, semiconductor heterojunction has proved to be a promising SERS substrate to enhance charge transfer enhancement.33 Interestingly, TiO2 compact layer (c-TiO2) has been employed in solar cells for blocking the reverse recombination of electrons and holes, and thus promote the solar cell efficiency.34–36 Inspired by this idea, c-TiO2 can be introduced into the semiconductor heterojunction SERS substrate simply by spin-coating c-TiO2 layer on a FTO glass, followed by growing TiO2 nanorods array to form the interface structure. Moreover, c-TiO2 can not only enhance charge transfer efficiency but also make TiO2 nanorods firmly grow on the substrate.37 However, little research on the compact layer for the fabrication of SERS hybrid substrate has been carried.
Because the laser focus of the Raman instrument is a three-dimensional (3D) spot in space, even if there are a lot of “hotspots” on the one-dimensional (1D) substrate and the two-dimensional (2D) substrate, the enhancement effect is limited due to the laser cannot be fully utilized.38 Raman enhancement of 1D and 2D substrates request the laser to be focused precisely on the surface. More recently, researchers have moved to the study of 3D SERS substrates to overcome the limitation, and high SERS detection sensitivity has achieved.39–41 For example, 3D Au-decorated chitosan nanocomposite and size-tunable gold aerogels have been reported as 3D SERS substrates for highly sensitive detection of trace 10−8 M 4-MBA and 10−9 M R6G.42,43 However, the larger defects in the 3D SERS structure may not have an ideal reproducible Raman signal. Therefore, 3D SERS substrate with high sensitivity and reproducibility can be realized by fabricating an ordered array structure with superior spatial uniformity.44,45 Besides, semiconductor nanomaterials are prone to be prepared as ordered array structures compared with metal nanomaterials, therefore, it is an alternative to modify the semiconductor array structure with metal nanoparticles.46
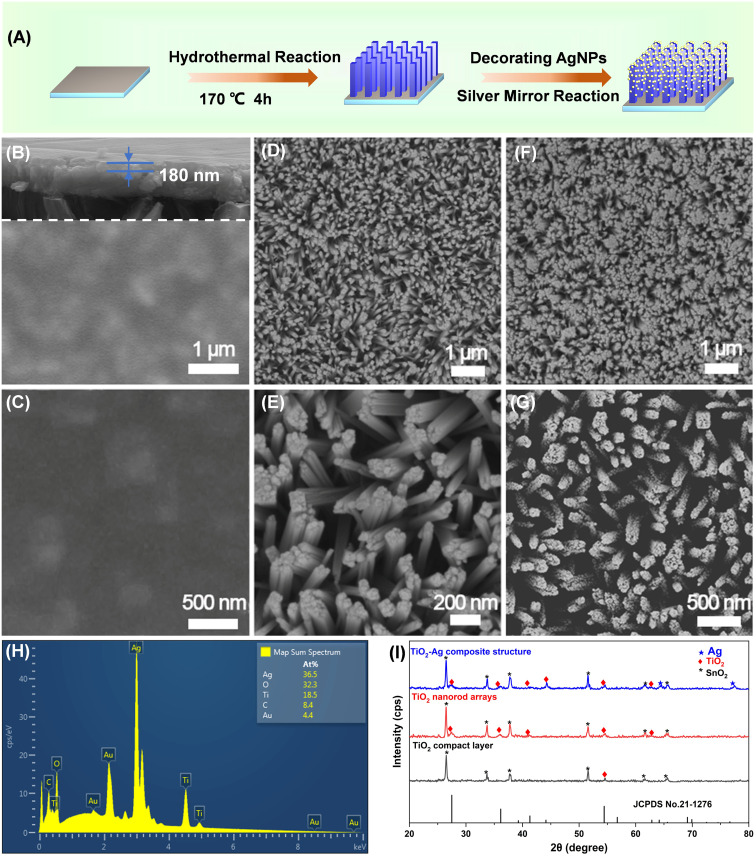
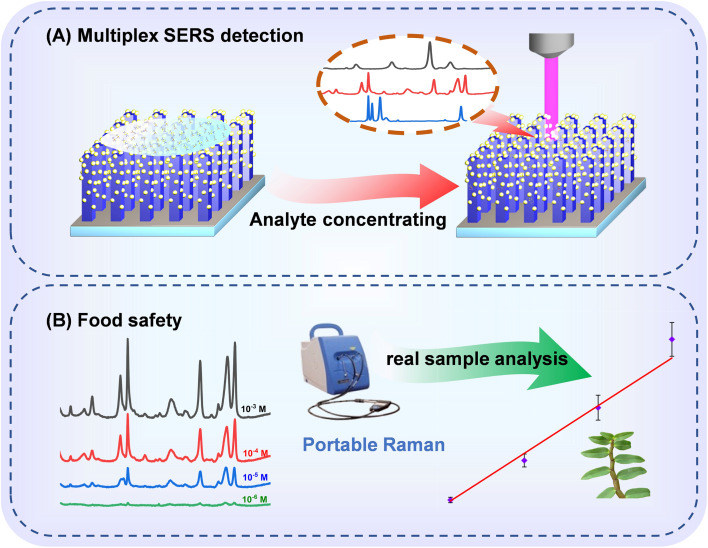
In this study, TiO2/AgNPs semiconductor–metal hybrid SERS substrate was synthesized by growing of TiO2 nanorod arrays on the TiO2 compact layer, followed by depositing plasmonic AgNPs on the 3D nanorods space. The schematic illustration of the synthetic process is displayed in Fig. 2A. The morphology and the phase structure of the samples were characterized by SEM, XRD, EDS. The as-prepared TiO2–Ag composite generates abundant SERS “hotspots” in 3D space, meanwhile fully harnesses the metal's EM mechanism and the semiconductor's CM mechanism. In addition, the c-TiO2 successfully blocks the recombination of electrons and holes, increasing the electron concentration on the surface of the metal, thereby enhancing localized-surface plasmon resonance. As a result, a high detection sensitivity was achieved, and the substrate realized high-sensitive detection of thiram, triazophos and fonofos even with a portable Raman instrument. Furthermore, quantitative and multicomponent detections of the pesticides were also demonstrated as shown in Fig. 1A. The practical application of the TiO2–Ag substrate for the detection of pesticide residues on real sample of dendrobium is displayed in Fig. 1B.
Fig. 2. (A) Schematic illustration of the preparation of TiO2–Ag composite; SEM images of (B and C) TiO2 compact layer, (D and E) TiO2 nanorod arrays, and (F, G) TiO2–Ag composite; (H) EDS spectrum of TiO2–Ag composite; (I) XRD patterns of TiO2 compact layer, TiO2 nanorod arrays and TiO2–Ag composite.
Fig. 1. Diagram of the detecting process and quantitative analysis of pesticides on dendrobium leaves.
2. Experiment
2.1. Spin-coating of TiO2 compact layer (c-TiO2)
The c-TiO2 was prepared on the surface of fluorine-doped tin oxide (FTO) glass by the hydrolysis-pyrolysis.35 Briefly, 0.23 M tetra-butyl titanate (98.0% purity) and 0.013 M HCl were mixed in isopropanol (99.5% purity), and the mixed solution was spin-coated on the cleaned FTO glass at a certain speed for 60 s, then annealed at 500 °C for 30 min. The thickness of c-TiO2 was tuned by changing the spinning speed and the spinning cycles.
2.2. Preparation of TiO2 nanorods (NRs) arrays
TiO2 NRs arrays were synthesized on TiO2 compact layer by the controllable hydrothermal method.47 30 mL of a mixture of DIW and HCl was poured into a stainless-steel autoclave lined with Teflon. After 390 µL of tetra-butyl titanate was dissolved, a piece of c-TiO2 on FTO glass (20 mm × 30 mm) was tilted down against the inner wall of the liner. The reaction temperature was maintained at 170 °C for 2–6 hours. The obtained sample was cooled down to room temperature and washed with water. Finally, it was annealed at 450 °C for 2 h in air.
2.3. Deposition of AgNPs on TiO2 nanorods
A simple silver mirror reaction was used to deposit AgNPs on TiO2 nanorods arrays.48 The TiO2 nanorods substrate (5 mm × 5 mm) was dipped in a reaction solution of 0.2 M Tollens and 0.3 M glucose solution at a volume ratio of 2 : 1 for 90 s. Then the substrate was washed with deionized water. Dense AgNPs decorated TiO2 nanorods array can be obtained by repeating the above steps for several cycles.
2.4. Characterization
A rotating-anode X-ray diffractometer (XRD, DX-2700B) was used to measure the phase and the composition of the samples. The specific morphology of the samples was characterized by a scanning electron microscopy (SEM, ZEISS). The SERS substrates were immersed in 400 µL of different analytes for 2 h. Raman measurements were conducted with a portable Raman instrument (i-Raman plus, B & W Tek Inc, USA). During SERS measurements, a 785 nm laser source, a 20× objective microscope and the integration time of 3 s were selected.
2.5. Simulating detection of pesticide
40 µL pesticide solution of different concentrations was sprayed on 1 cm2 leaves, and the leaves were dried naturally to simulate the pesticide spraying scene. Before SERS detection, 20 µL of water–ethanol solution was dropped on the leaf, then the TiO2–Ag composite substrate was covered on the leaf for 1 min to absorb the pesticide molecules.
3. Results and discussion
3.1. Morphology and composition analysis
Fig. 2B and C show the SEM images of c-TiO2. It can be found from the crack (Fig. 2B) that TiO2 layer was successfully coated on the FTO glass surface. Fig. S1† exhibits cross-sectional SEM images of TiO2 compact layers by spin-coating for 1–5 cycles, and the thickness was tuned from 60 nm to 300 nm. The evenly distributed TiO2 compact layer facilitates the subsequent growth of TiO2 nanorod arrays. Fig. 2D and E display the SEM images of TiO2 nanorod, indicating large-area uniform vertical TiO2 nanorods arrays with rod diameter of ∼90 nm. The shape of the nanorods with tetragonal crystal structures are approximately quadrangle which conforms to the expected growth habit. The SEM images of TiO2 nanorods prepared by different hydrothermal reaction time are shown in Fig. S2,† which suggests that the diameter of TiO2 nanorods increases continuously with reaction times. And the TiO2 nanorods with appropriate diameter and spacing for further deposition of AgNPs were prepared under the optimal hydrothermal time. Fig. 2F and G are the SEM images of the TiO2–Ag composite. It can be observed that AgNPs are uniformly deposited on the top and side of the TiO2 nanorod in a 3D space distribution, which provides dense “hotspots” for the SERS enhancement of TiO2–Ag composite. Fig. S3† shows the locally enlarged view of the TiO2–Ag composite structure. It can be seen that the diameter of Ag nanoparticles is about 20 nm, and there are about 300 Ag nanoparticles on a TiO2 nanorod.
The composition of the substrate was initially characterized by EDS. The successful deposition of AgNPs on TiO2 nanorods arrays can be demonstrated by the presence of Ag, Ti and O (Fig. 2H), and the number of O atoms is about twice of Ti. In order to obtain higher quality SEM images, gold plating was carried out during the test, and Au atoms in EDS spectra were derived from this step. In addition, the crystal structure of the samples was examined by XRD (Fig. 2I). Because the c-TiO2 is amorphous or low crystallinity, there is no apparent characteristic peak of TiO2. The diffraction peaks of TiO2 nanorod arrays were observed at 27.5°, 36.1°, 41.3°, 54.4° and 62.8°, which can be easily indexed to the (110), (101), (111), (211) and (002) crystal planes of rutile TiO2 (JCPDS no. 21-1276). Other peaks can be assigned to FTO glass (JCPDS no. 46-1088). In the diffraction pattern of TiO2 nanorods, the diffraction intensity of (101) is relatively enhanced. The obvious peak of (101) indicates that rutile crystals grow parallel to the TiO2 compact layer along the (101) plane.49 The diffraction peaks of Ag nanocrystalline can be seen in the XRD patterns of the TiO2–Ag, and the diffraction peaks at 64.4° and 77.5° can be indexed to the (220) and (311) crystal planes of Ag (JCPDS no. 04-0783), respectively.
3.2. TiO2 compact layer induced SERS enhancement
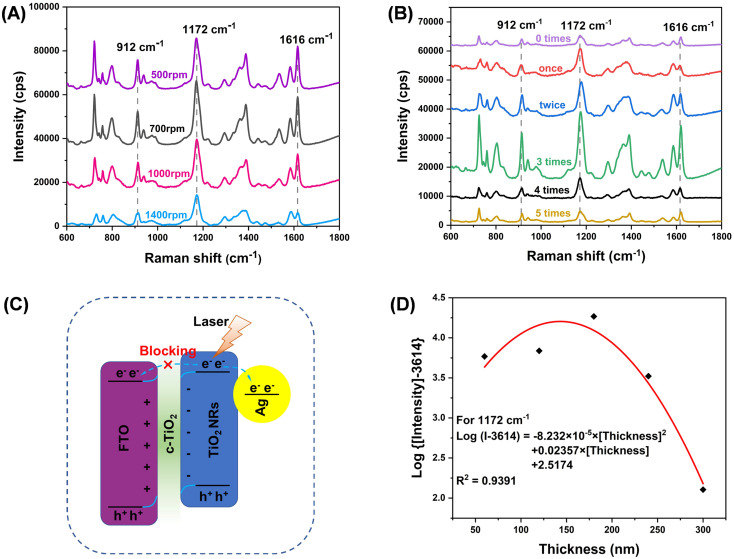
In this work, it is observed that the thickness of c-TiO2 is crucial to the SERS performance in the TiO2–Ag composite. The SERS measurements in Fig. 3A suggest that TiO2 compact layer prepared at spinning speed of 700 rpm generates the maximal SERS enhancement. Fig. 3B indicates that spin-coating of 3 cycles for TiO2 compact layer (thickness of ∼180 nm) in TiO2–Ag composite produces the highest SERS activity. By comparation, it can be seen that the TiO2–Ag composite structure with c-TiO2 has noticeable SERS enhancement effect. This is because the c-TiO2 blocks the recombination and avoids the electrons migrating to the conductive substrate, and therefore increases the charge concentration on the metal surface and then enhances the localized-surface plasmonic resonance, thus improving the SERS response. Fig. 3C shows the energy level diagram depicting the role of TiO2 compact layer. In general, when a TiO2 nanocrystal absorbs the necessary laser energy, it creates electron–hole pairs on the surface of TiO2. Electrons will be transferred from the conduction band (CB) of TiO2 to the surface of AgNPs, which increases the surface electron density of AgNPs and thus enhances the CM enhancement. Since the CB energy of FTO coating (F-doped tin oxide) is slightly lower than TiO2, it is also possible for electrons to transfer to CB of FTO. The TiO2 compact layer blocks electron migration to the FTO and therefore more electrons may be transferred to the surface of the AgNPs. Nevertheless, a thicker c-TiO2 (over 180 nm) may act as a semiconductor and can not inhibit the recombination; therefore, the TiO2–Ag composite with thicker TiO2 coatings leads to the decrease of the SERS performance. To show the effect of c-TiO2 more intuitively, we quantified the additional Raman enhancement as a function of thickness. The observations suggest that a proper thickness of c-TiO2 plays an important role in enhancing SERS performance of TiO2–Ag composite.
Fig. 3. The influences of (A) spinning speeds and (B) spin-coating cycles for the preparation of TiO2 compact layer in the TiO2–Ag composite; (C) the energy level diagram depicting the charge concentration in Ag nanoparticles; (D) the quantitative relationship exists between the additional Raman enhancement generated and the thickness of the TiO2 compact layer.
3.3. Optimization of the SERS performance of the TiO2–Ag composite
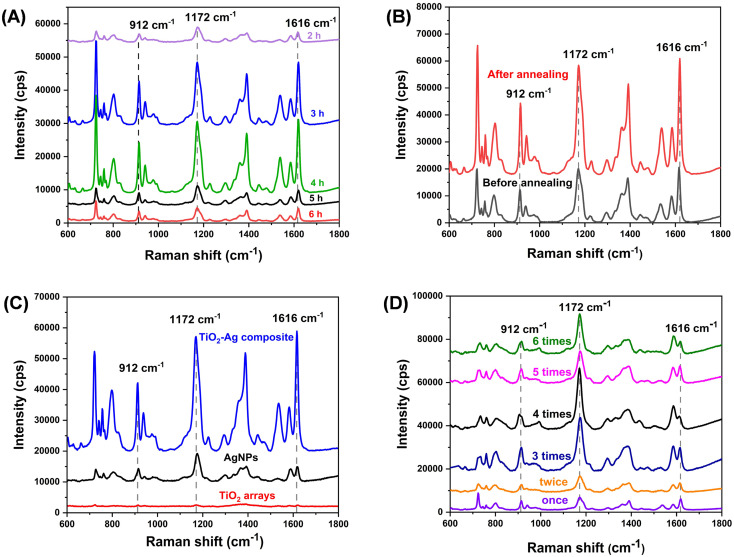
The 3D space structure of TiO2 nanorods array also greatly impacts the SERS performance of TiO2–Ag composite. It was optimized by changing the acidity and the reaction times during the preparation process of TiO2 nanorods. Fig. S2† shows the SEM images of nanorods array prepared at different acidity. It is concluded that higher acidity is beneficial to produce uniform TiO2 nanorods and for further loading of Ag nanoparticles. Besides, TiO2 nanorod arrays fabricated by hydrothermal reaction time of 4 h (Fig. 4A) possesses the highest SERS activity. In addition, the crystallinity of TiO2 nanorod has a positive effect on the improvement of SERS property. The calcined sample exhibits two-fold stronger than that of freshly prepared sample (Fig. 4B). It may be because the high crystallinity of TiO2 has fewer lattice defects, which is more conducive to electron conduction to the metal surface and therefore improves the SERS activity.50 Subsequently, the EM mechanism of plasmonic AgNPs on the TiO2–Ag composite was demonstrated (Fig. 4C). We compared the SERS responses of 3D TiO2–Ag composite, AgNPs and TiO2 NRs. As we expected, the 3D TiO2–Ag composite showed the highest SERS enhancement which can be ascribed to the EM enhancement of AgNPs and the CM enhancement of TiO2 NRs. Moreover, different density of AgNPs on the TiO2 nanorods 3D space was optimized by varying silver-plating cycles from 1 to 6. Accordingly, the composite structure prepared by 4 cycles possesses the highest SERS activity (Fig. 4D). The density of AgNPs will increase with the silver-plating cycles, which leads to the increase of “hotspots” numbers in space, and therefore improves the SERS performance. However, when the number of AgNPs is too dense, the adjacent “hotspots” will merge with each other, and thus decrease the SERS performance. Based on the results of the above work, we believe that the excellent SERS performance of TiO2–Ag composite structure was not caused by a structure alone, but the result of the synergistic effect of TiO2 compact layer, TiO2 nanorods and Ag nanoparticles.
Fig. 4. SERS spectra of (A) TiO2–Ag composite prepared at hydrothermal time (2–6 h) for TiO2 nanorod arrays; (B) TiO2–Ag composite in which TiO2 nanorod calcinated before and after in air; (C) TiO2–Ag composite, AgNPs and TiO2 nanorod; (D) TiO2–Ag composite for different silver-plating cycles.
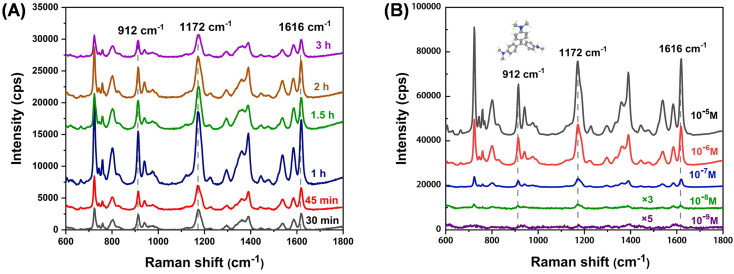
Fig. 5 shows the SERS spectra of TiO2–Ag composite immersed in CV (10−6 M) solution for different times. A quick adsorption equilibrium will approach within 1 h, indicating the potential for rapid on-site monitoring. Then, the detection sensitivity was evaluated by immersing the substate into different concentrations of CV as shown in Fig. 5B. An extremely low concentration of 10−9 M CV characteristic peak can still be discerned even on a portable Raman instrument, suggesting the SERS substrate has high sensitivity. Additionally, the SERS signal uniformity was investigated by collecting 20 random points to evaluate the feasibility of the substrate in practical quantitative analysis. Fig. S4A† shows 20 SERS spectra obtained from the TiO2–Ag composite, and the relative standard deviations (RSD) of peak intensities were calculated for three main characteristic peaks (912 cm−1, 1172 cm−1 and 1616 cm−1). The RSD values of the peaks were calculated as 8.1%, 8.5% and 9.1%, respectively (Fig. S4B, C and D†), indicating the superior signal reproducibility which is due to the uniform and ordered array structure of the substrate. Moreover, the long-term stability of the substrate was also explored by comparing the freshly prepared substrate with the sample stored for 30 days. Fig. S5† shows the Raman intensity of the 1172 cm−1 peak is decreased by about 20%, demonstrating the good long-term stability.
Fig. 5. (A) SERS spectra of TiO2–Ag composite immersed in CV (10−6 M) solution for different times; (B) SERS spectra of CV with different concentrations absorbed on TiO2–Ag composite.
3.4. The sensitivity and applications of the SERS substrate
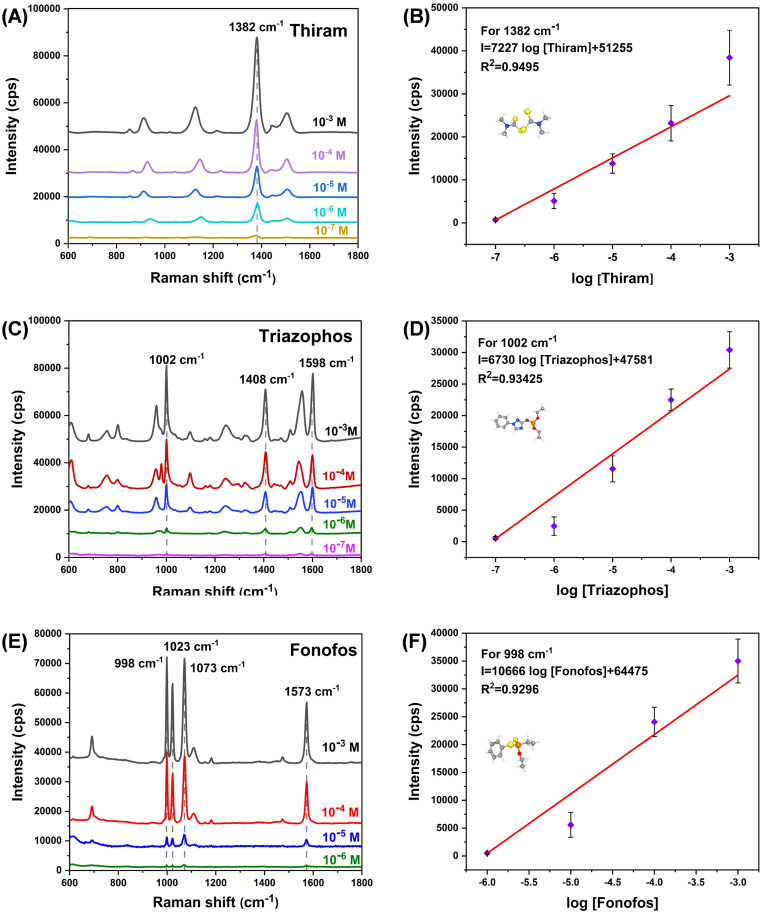
We performed SERS detections for pesticides (thiram, triazophos and fonofos) to demonstrate that the SERS substrate was sensitive and applicable. Our SERS substrate also showed superior detection ability at low concentrations when applied to pesticide assays. At low concentration of 10−7 M, the characteristic peaks of thiram and triazophos still appeared at the corresponding Raman shifts (Fig. 6A–D). In the range of 10−3-10−7 M, the Raman intensity of 1382 cm−1 had a good linear relationship with the logarithm of the thiram concentration (R2 = 0.9495). Similarly, triazophos also had a good linear correlation (R2 = 0.93425). For fonofos solution with concentration of 10−6 M, distinctive Raman peaks can be observed (Fig. 6E and F). The different detection capabilities for the SERS substrate possibly originate from the different adsorption states of various substances on the substrate surface. These results suggest that the TiO2–Ag composite has the potential for the qualitative detection of pesticide residues.
Fig. 6. SERS spectra of (A) thiram; (C) triazophos; (E) fonofos absorbed on TiO2–Ag composite structure, and corresponding linearity of the Raman intensity with respect to the logarithm of the concentration (B), (D), (F).
In actual agricultural production, many pesticides are simultaneously used, leading to multiple pesticide residues on the surface of a plant. Therefore, it is of great significance for practical application whether the SERS substrate can accurately distinguish multiple pesticide components. Accordingly, we designed two-component systems which are composed of thiram, triazophos and fonofos to demonstrate the potential multicomponent detection capability. In Fig. 7A, the peaks at 1408 cm−1 and 1598 cm−1 can be classified as triazophos characteristic peaks; whereas peaks at 998 cm−1, 1023 cm−1, 1073 cm−1 and 1573 cm−1 can be classified as fonofos characteristic peaks. Fig. 7B and C show the fonofos–thiram system and thiram–triazophos system, these two-component pesticide peaks could be distinguished clearly by our SERS substrate due to the narrow peaks and the fingerprint trait of SERS. The results indicate that the TiO2–Ag composite is promising to be developed and applied in the analysis of multicomponent pesticides.
Fig. 7. SERS spectra of two-component detection of pesticides (A) triazophos–fonofos, (B) thiram–fonofos, and (C) thiram–triazophos. The concentration for each component is 10−6 M.
3.5. Simulating detection of pesticide on dendrobium leaves
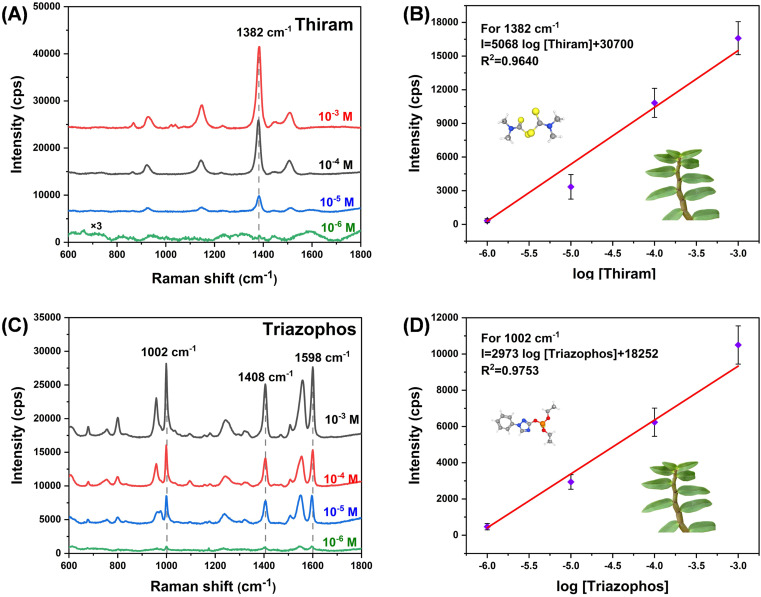
In order to further understand the possibility of the SERS substrate in practical applications, we selected dendrobium as a model for the realistic simulating detection (Fig. 8). Spraying simulations of thiram and triazophos were implemented on the leaves of dendrobium and the trace-level analysis was conducted. A low concentration of 10−6 M for thiram and triazophos can be detected, and the Raman intensity showed a good linear relationship with the logarithmic concentration of pesticide (Fig. 8B and D). This indicates the potential application of the TiO2–Ag composite SERS substrate in the realistic analytical scenes.
Fig. 8. SERS spectra of the different concentrations of (A) thiram and (C) triazophos on dendrobium leaves by using TiO2–Ag composite substrate, and (B), (D) the corresponding linearity of the Raman intensity with the logarithm concentration.
4. Conclusions
In conclusion, a 3D TiO2–Ag composite substrate was prepared by a successive spin-coating, hydrothermal reaction and silver mirror reaction. TiO2 compact layer was firstly spin-coated on the FTO substrate to block the recombination of electrons and holes, and further increase the electron concentration on the surface of metal, thereby enhancing localized surface plasmon resonance. And the c-TiO2 can induce additional CM enhancement of one-order of magnitude. The synergetic SERS enhancement make it superior detecting sensitivity for CV, triazophos, triazophos and fonofos even with a portable Raman instrument, and the LOD are determined to be 10−9 M, 10−7 M, 10−7 M and 10−6 M, respectively. Moreover, quantitative and multi-component detections are also demonstrated. The simulation detection proves the feasibility for practical application. This hybrid substrate may have broad application prospects in rapid and portable screening and monitoring of pesticide residues on food surfaces.
Conflicts of interest
The authors declare that they have no known competing financial interests or personal relationships that could have appeared to influence the work reported in this paper.
Supplementary Material
Acknowledgments
This work was financially supported by the National Natural Science Foundation of China (62275072), Key Research and Development Projects of Anhui Province (202004g01020016, 202104g01020009), the 111 Project “New Materials and Technology for Clean Energy” (B18018), and the Natural Science Foundation of Anhui Province (2208085MB35).
Electronic supplementary information (ESI) available. See DOI: https://doi.org/10.1039/d3ra00094j
References
- Yang J. Song G. Zhou L. Wang X. You L. Li J. Highly sensitively detecting tetramethylthiuram disulfide based on synergistic contribution of metal and semiconductor in stable Ag/TiO2 core-shell SERS substrates. Appl. Surf. Sci. 2021;539:147744. [Google Scholar]
- Wang T. Wang S. Cheng Z. Wei J. Yang L. Zhong Z. Hu H. Wang Y. Zhou B. Li P. Emerging core–shell nanostructures for surface-enhanced Raman scattering (SERS) detection of pesticide residues. Chem. Eng. J. 2021;424:130323. [Google Scholar]
- Deng H. Ji Y. Tang S. Yang F. Tang G. Shi H. Lee H. K. Application of Chiral and Achiral Supercritical Fluid Chromatography in Pesticide Analysis: A Review. J. Chromatogr. A. 2020;1634:461684. doi: 10.1016/j.chroma.2020.461684. [DOI] [PubMed] [Google Scholar]
- Loganathan C. Gowthaman N. S. K. Abraham John S. Chain-like 2-amino-4-thiazoleacetic acid tethered AuNPs as colorimetric and spectrophotometric probe for organophosphate pesticide in water and fruit samples. Microchem. J. 2021;168:106495. [Google Scholar]
- Dutta A. Hingmire S. Banerjee K. Multiresidue Analysis of Pesticides in Moringa Pods by GC-MS/MS and LC-MS/MS. J. AOAC Int. 2020;103:1486–1497. doi: 10.1093/jaoacint/qsaa053. [DOI] [PubMed] [Google Scholar]
- Li Y. Hao Z. Cao H. Wei S. Jiao T. Wang M. Study on annealed graphene oxide nano-sheets for improving the surface enhanced fluorescence of silver nanoparticles. Opt. Laser Technol. 2023;160:109054. [Google Scholar]
- Sun Z. Tian L. Guo M. Xu X. Li Q. Weng H. A double-film screening card for rapid detection of organophosphate and carbamate pesticide residues by one step in vegetables and fruits. Food Control. 2017;81:23–29. [Google Scholar]
- Jiang S. Sun J. Xin Z. Mao H. Wu X. Li Q. Visualizing distribution of pesticide residues in mulberry leaves using NIR hyperspectral imaging. J. Food Process Eng. 2017;40:e12510. [Google Scholar]
- Acaroz U. Dietrich R. Knauer M. Märtlbauer E. Development of a Generic Enzyme-Immunoassay for the Detection of Fluoro(quinolone)-Residues in Foodstuffs Based on a Highly Sensitive Monoclonal Antibody. Food Anal. Methods. 2020;13:780–792. [Google Scholar]
- Ding S.-Y. Yi J. Li J.-F. Ren B. Wu D.-Y. Panneerselvam R. Tian Z.-Q. Nanostructure-based plasmon-enhanced Raman spectroscopy for surface analysis of materials. Nat. Rev. Mater. 2016;1:16021. [Google Scholar]
- Xu F. Shang W. Xuan M. Ma G. Ben Z. Layered filter paper-silver nanoparticle-ZIF-8 composite for efficient multi-mode enrichment and sensitive SERS detection of thiram. Chemosphere. 2022;288:132635. doi: 10.1016/j.chemosphere.2021.132635. [DOI] [PubMed] [Google Scholar]
- Wang K. Sun D.-W. Pu H. Wei Q. Surface-enhanced Raman scattering of core-shell [email protected] nanoparticles aggregates for rapid detection of difenoconazole in grapes. Talanta. 2018;191:449–456. doi: 10.1016/j.talanta.2018.08.005. [DOI] [PubMed] [Google Scholar]
- Hongki K. Ba Thong T. Kyung Ho K. Jeong M. Hyunju K. Kwanghyeon J. Rashida A. Jinyoung J. Eun-Kyung L. Juyeon J. Ho-Suk C. Hyun Gyu P. Oh Seok K. Ilsun Y. Taejoon K. Au@ZIF-8 SERS paper for food spoilage detection. Biosens. Bioelectron. 2021;179:113063. doi: 10.1016/j.bios.2021.113063. [DOI] [PubMed] [Google Scholar]
- Guo J. Zeng F. Guo J. Ma X. Preparation and application of microfluidic SERS substrate: Challenges and future perspectives. J. Mater. Sci. Technol. 2020;37:96–103. [Google Scholar]
- Sharma B. Frontiera R. R. Henry A.-I. Ringe E. Van Duyne R. P. SERS: Materials, applications, and the future. Mater. Today. 2012;15:16–25. [Google Scholar]
- Zheng X. Yan X. Ma J. Yao X. Zhang J. Wang L. Unidirectional/Bidirectional Electron Transfer at the Au/TiO2 Interface Operando Tracked by SERS Spectra from Au and TiO2. ACS Appl. Mater. Interfaces. 2021;13:16498–16506. doi: 10.1021/acsami.1c02540. [DOI] [PubMed] [Google Scholar]
- Lin S. Lin X. Han S. He L. Zhao H. Zhang J. Hasi W. Wang L. Width and length dependent SERS performance of core-shell Au@Ag nanorod self-assembled monolayers. J. Alloys Compd. 2019;805:318–326. [Google Scholar]
- Wu J. Feng Y. Zhang L. Wu W. Nanocellulose-based Surface-enhanced Raman spectroscopy sensor for highly sensitive detection of TNT. Carbohydr. Polym. 2020;248:116766. doi: 10.1016/j.carbpol.2020.116766. [DOI] [PubMed] [Google Scholar]
- Guo J. Zhang M. Yin Z. Ding C. Chen P. Gan W. Yu H. Sun Z. Construction of black phosphorus nanosheets and Ag nanoparticles co-sensitized TiO2 nanorod arrays as high-performance SERS substrate and photocatalyst. Appl. Surf. Sci. 2022;592:153265. [Google Scholar]
- Yang H. Li J. Rao Y. Yang L. Xue Y. Zhang Y. Yang Z. Li J. Ultrasensitive multiplex SERS immunoassay based on porous Au–Ag alloy nanoparticle–amplified Raman signal probe and encoded photonic crystal beads. Microchim. Acta. 2022;190:13. doi: 10.1007/s00604-022-05539-4. [DOI] [PubMed] [Google Scholar]
- Yang L. Peng Y. Yang Y. Liu J. Li Z. Ma Y. Zhang Z. Wei Y. Li S. Huang Z. Long N. V. Green and Sensitive Flexible Semiconductor SERS Substrates: Hydrogenated Black TiO2 Nanowires. ACS Appl. Nano Mater. 2018;1:4516–4527. [Google Scholar]
- Fularz A. Almohammed S. Rice J. H. Oxygen Incorporation-Induced SERS Enhancement in Silver Nanoparticle-Decorated ZnO Nanowires. ACS Appl. Nano Mater. 2020;3:1666–1673. [Google Scholar]
- Wang X. Guo L. SERS Activity of Semiconductors: Crystalline and Amorphous Nanomaterials. Angew. Chem., Int. Ed. 2020;59:4231–4239. doi: 10.1002/anie.201913375. [DOI] [PubMed] [Google Scholar]
- Liu Y. Ma H. Han X. X. Zhao B. Metal–semiconductor heterostructures for surface-enhanced Raman scattering: synergistic contribution of plasmons and charge transfer. Mater. Horiz. 2020;8:370–382. doi: 10.1039/d0mh01356k. [DOI] [PubMed] [Google Scholar]
- Zhao Z. He H. Zhu Y. Wang X. Shen Y. Xie A. An ordered fish scale-like Co-TiO2/GO inverse opal photonic crystal as the multifunctional SERS substrate. J. Alloys Compd. 2021;858:158356. [Google Scholar]
- Xu Y. Zhang D. Lin J. Wu X. Xu X. Akakuru O. U. Zhang H. Zhang Z. Xie Y. Wu A. Shao G. Ultrahigh SERS activity of the TiO2@Ag nanostructure leveraged for accurately detecting CTCs in peripheral blood. Biomater. Sci. 2022;10:1812–1820. doi: 10.1039/d1bm01821c. [DOI] [PubMed] [Google Scholar]
- Zhang M. Chen T. Liu Y. Zhang J. Sun H. Yang J. Zhu J. Liu J. Wu Y. Plasmonic 3D Semiconductor–Metal Nanopore Arrays for Reliable Surface-Enhanced Raman Scattering Detection and In-Site Catalytic Reaction Monitoring. ACS Sens. 2018;3:2446–2454. doi: 10.1021/acssensors.8b01023. [DOI] [PubMed] [Google Scholar]
- Musumeci A. Gosztola D. Schiller T. Dimitrijevic N. M. Mujica V. Martin D. Rajh T. SERS of Semiconducting Nanoparticles (TiO2 Hybrid Composites) J. Am. Chem. Soc. 2009;131:6040–6041. doi: 10.1021/ja808277u. [DOI] [PubMed] [Google Scholar]
- Li J. Lu M. Tan Z. Xu Y. Zhang Y. Hu X. Yang Z. One-step solvothermal preparation of silver-ZnO hybrid nanorods for use in enzymatic and direct electron-transfer based biosensing of glucose. Microchim. Acta. 2016;183:1705–1712. [Google Scholar]
- Wang Y. Li M. Wang D. Han C. Li J. Wu C. Xu K. Fabrication of highly uniform Ag nanoparticle-TiO2 nanosheets array hybrid as reusable SERS substrates. Colloid Interface Sci. Commun. 2020;39:100324. [Google Scholar]
- Rajkumar P. Sarma B. K. Ag/ZnO heterostructure fabricated on AZO platform for SERS based sensitive detection of biomimetic hydroxyapatite. Appl. Surf. Sci. 2020;509:144798. [Google Scholar]
- Zhang M. Sun H. Chen X. Yang J. Shi L. Chen T. Bao Z. Liu J. Wu Y. Highly Efficient Photoinduced Enhanced Raman Spectroscopy (PIERS) from Plasmonic Nanoparticles Decorated 3D Semiconductor Arrays for Ultrasensitive, Portable, and Recyclable Detection of Organic Pollutants. ACS Sens. 2019;4:1670–1681. doi: 10.1021/acssensors.9b00562. [DOI] [PubMed] [Google Scholar]
- Xie S. Lai K. Gu C. Jiang T. Zhou L. Zheng X. Shen X. Han J. Zhou J. Fine fabrication of TiO2/MoOx nano-heterojunctions and investigating on the improved charge transfer for SERS application. Mater. Today Nano. 2022;18:100179. [Google Scholar]
- Veiga E. T. Fernandes S. L. Graeff C. F. d. O. Polo A. S. Compact TiO2 blocking-layer prepared by LbL for perovskite solar cells. Sol. Energy. 2021;214:510–516. [Google Scholar]
- Zhang J. Shi C. Chen J. Wang Y. Li M. Preparation of ultra-thin and high-quality WO3 compact layers and comparision of WO3 and TiO2 compact layer thickness in planar perovskite solar cells. J. Solid State Chem. 2016;238:223–228. [Google Scholar]
- Deng X. Wang Y. Chen Y. Cui Z. Shi C. Yttrium-doped TiO2 compact layers for efficient perovskite solar cells. J. Solid State Chem. 2019;275:206–209. [Google Scholar]
- Deng Y. Ma Z. Ren F. Wang G. Volinsky A. A. Enhanced morphology and photoelectric properties of one-dimensional TiO2 nanorod array films. Chem. Phys. Lett. 2019;724:42–49. [Google Scholar]
- Strozyk M. S. de Aberasturi D. J. Gregory J. V. Brust M. Lahann J. Liz-Marzán L. M. Spatial Analysis of Metal–PLGA Hybrid Microstructures Using 3D SERS Imaging. Adv. Funct. Mater. 2017;27:1701626. [Google Scholar]
- Yeh Y.-J. Liu C.-Y. Chu J. P. Chiang W.-H. Tung K.-L. Plasmonic Au loaded semiconductor-engineered large-scale metallic nanostructure arrays for SERS application. Surf. Coat. Technol. 2022;436:128285. [Google Scholar]
- Lo Faro M. J. D'Andrea C. Leonardi A. A. Morganti D. Irrera A. Fazio B. Fractal Silver Dendrites as 3D SERS Platform for Highly Sensitive Detection of Biomolecules in Hydration Conditions. Nanomaterials. 2019;9:1630. doi: 10.3390/nano9111630. [DOI] [PMC free article] [PubMed] [Google Scholar]
- Fu B.-B. Tian X.-D. Song J.-J. Wen B.-Y. Zhang Y.-J. Fang P.-P. Li J.-F. Self-Calibration 3D Hybrid SERS Substrate and Its Application in Quantitative Analysis. Anal. Chem. 2022;94:9578–9585. doi: 10.1021/acs.analchem.2c00436. [DOI] [PubMed] [Google Scholar]
- Guo J. Ding C. Gan W. Chen P. Zhang M. Sun Z. Fabrication of black phosphorous quantum dots and Ag nanoparticles co-sensitized TiO2 nanorod arrays as powerful SERS substrate. J. Alloys Compd. 2022;918:165621. [Google Scholar]
- Fu F. Yang B. Hu X. Tang H. Zhang Y. Xu X. Zhang Y. Touhid S. S. B. Liu X. Zhu Y. Zhou J. Yao J. Biomimetic synthesis of 3D Au-decorated chitosan nanocomposite for sensitive and reliable SERS detection. Chem. Eng. J. 2020;392:123693. [Google Scholar]
- Shi C. Qin L. Wu S. Kang S.-Z. Li X. Highly sensitive SERS detection and photocatalytic degradation of 4-aminothiophenol by a cost-effective cobalt metal–organic framework-based sandwich-like sheet. Chem. Eng. J. 2021;422:129970. [Google Scholar]
- Wu J. Zhang L. Huang F. Ji X. Dai H. Wu W. Surface enhanced Raman scattering substrate for the detection of explosives: Construction strategy and dimensional effect. J. Hazard. Mater. 2019;387:121714. doi: 10.1016/j.jhazmat.2019.121714. [DOI] [PubMed] [Google Scholar]
- Li J. Li W. Rao Y. Shi F. Yu S. Yang H. Min L. Yang Z. Synthesis of highly ordered AgNPs-coated silica photonic crystal beads for sensitive and reproducible 3D SERS substrates. Chin. Chem. Lett. 2021;32:150–153. [Google Scholar]
- Kim H. S. Lee J. W. Yantara N. Boix P. P. Kulkarni S. A. Mhaisalkar S. Gratzel M. Park N. G. High efficiency solid-state sensitized solar cell-based on submicrometer rutile TiO2 nanorod and CH3NH3PbI3 perovskite sensitizer. Nano Lett. 2013;13:2412–2417. doi: 10.1021/nl400286w. [DOI] [PubMed] [Google Scholar]
- Ye C. Zhu Z. Li X. Zhou H. Zhang M. Yan L. Chen Z. Huang Y. Wu Y. ZIF-8 derived TiO2/ZnO heterostructure decorated with AgNPs as SERS sensor for sensitive identification of trace pesticides. J. Alloys Compd. 2022;901:163675. [Google Scholar]
- Anxin J. Qingqiang C. Shuang L. Hengshuai L. Linlin X. Yue T. Hui M. Mengya Z. Xiangdong L. Ming C. Aligned TiO2 nanorod arrays decorated with closely interconnected Au/Ag nanoparticles: Near-infrared SERS active sensor for monitoring of antibiotic molecules in water. Sens. Actuators, B. 2021;350:130848. [Google Scholar]
- Li J. Zhang S. Yang J. Zheng X. Improved SERS sensitivity of TiO2 nanorod films by annealing in vacuum. Vacuum. 2021;194:110579. [Google Scholar]
Associated Data
This section collects any data citations, data availability statements, or supplementary materials included in this article.


