

Abstract
Background/objectives:
Women are ubiquitously exposed to endocrine disruptors, including phthalates. Ovarian follicles undergoing folliculogenesis (indirectly measured by ovarian volume) produce anti-Müllerian hormone (AMH) and estradiol (E2). We evaluated associations of phthalates with ovarian volume to assess whether this explained prior positive associations of phthalates with AMH and E2.
Methods:
Women ages 45–54 years (n = 614) had transvaginal ultrasounds of right/left ovaries to calculate mean ovarian volume. Women provided up-to-four urine and blood samples for quantifying AMH (first serum sample), E2 (all serum samples), and nine phthalate metabolites (from pooled urine, representing six parent phthalates). Multivariable linear or logistic regression models (for individual phthalate biomarkers), as well as weighted quantile sum (WQS) regression (for mixture analyses) evaluated associations of phthalate biomarkers with ovarian volume. Using cross-sectional mediation analysis, we assessed whether associations of phthalates with ovarian volume partially explained those of phthalates with AMH or E2.
Results:
Most women were non-Hispanic White (68%) and pre-menopausal (67%) with higher urinary phthalate metabolite concentrations than U.S. women. In single-pollutant models, 10% increases in mono(3-earboxypropyl) phthalate (MCPP) and monobenzyl phthalate (MBzP) were associated with 0.44% (95% CI: −0.02%, 0.91%) and 0.62% (95% CI: 0.02%, 1.23%) larger ovarian volumes, respectively. As a cumulative mixture, 10% increases in the phthalate mixture were associated with 2.89% larger ovarian volume (95%CI: 0.27, 5.59) with MCPP (35%) and MBzP (41%) identified as major contributors. Higher ovarian volume due to a 10% increase in MBzP (indirect effect OR: 1.004; 95% CI: 1.00, 1.01) explained 16% of the positive association between MBzP and higher AMH, whereas higher ovarian volume due to a 10% increase in MCPP (indirect effect %Δ: 0.11; 95% CI: −0.01, 0.22) explained 23% of the positive association between MCPP and E2.
Conclusion:
In this cross-sectional study, phthalates were associated with increased ovarian volume, with implications for midlife hormone production.
Keywords: Phthalates, Anti-Müllerian hormone, Estradiol, Ovarian volume, Midlife
1. Introduction
Menopause is the conclusion of menstruation and is a hormonally sensitive period accompanied by physiological changes resulting from the decline in ovarian follicle count and cessation of follicle growth (folliculogenesis) (Burger et al., 2002). Perimenopause, which is the transition into menopause, may take years (Harlow et al., 2012), and is characterized by fluctuations in sex hormone production (Monteleone et al., 2018). Ovarian follicles produce hormones such as estradiol (E2) and anti-Müllerian hormone (AMH), and levels of these hormones begin to decrease substantially during the menopausal transition. Due to these hormonal shifts, women undergoing the menopausal transition normally experience hot flashes and weight gain (National Institute on Aging, 2021), and are at an increased risk for developing cardiovascular disease and obesity (Gadde et al., 2018; Jensen et al., 2014; Kodoth et al., 2022). The cessation of folliculogenesis - and therefore the onset of the transition into menopause - may also be marked by decreased ovarian volume (Tepper et al., 1995) because follicle number is positively associated with ovarian volume (Flaws et al., 2001; Kelsey and Wallace, 2012). This has been supported by prior studies, which have observed that women nearing the end of the reproductive window have smaller ovarian volume compared to younger women (Oppermann et al., 2003). Despite the critical role of the menopausal transition in women’s lives, few studies have evaluated potential lifestyle or environmental factors that may impact ovarian parameters in women nearing menopause.
Phthalates are ubiquitous environmental contaminants known to disrupt hormonally-mediated processes. Over 99 % of U.S. women have measurable levels of at least one phthalate metabolite in their urine, which are used as biomarkers for approximating exposure to phthalates (Long et al., 2021). Women of all ages tend to have higher concentrations of select phthalate metabolites than men of the same age (Silva et al., 2004), ostensibly because women are more likely to use cosmetics and personal care products (Caporossi et al., 2021). Phthalates serve as plasticizers in products like PVC pipes, medical tubing, and food contact materials to make them more durable, and as solvents in personal care products and perfumes to stabilize fragrances (Al-Saleh and Elkhatib, 2016; Wang and Qian, 2021). Although phthalates have short half-lives in the body (Hoppin et al., 2002), humans are ubiquitously exposed to these chemicals, which is concerning because phthalates are a class of endocrine disrupting chemicals (Schaedlich et al., 2018). Phthalates target the reproductive system in females (Dalgaard et al., 2003; Rattan et al., 2017), such that exposure to these chemicals has been associated with impaired fertility, decreased rates of conceiving and maintaining a pregnancy, and higher rates of miscarriage in rodent models (Laws et al., 2021; Rattan et al., 2018; Zhou et al., 2017) and human epidemiologic studies (Al-Saleh et al., 2019; Laws et al., 2021; Messerlian et al., 2016a; Messerlian et al., 2016b; Toft et al., 2012). Numerous human epidemiologic studies have also shown that phthalates are associated with uterine fibroids (Pacyga et al., 2022; Weuve et al., 2010), endometriosis (Upson et al., 2013; Weuve et al., 2010), and premature ovarian failure (Cao et al., 2020; Panagiotou et al., 2021). However, relatively few studies have evaluated the impact of phthalate exposure for women’s health at the end of reproduction and during the menopausal transition.
One potential mechanism by which phthalates cause reproductive toxicity is by directly targeting the ovary. In mice, di(2-ethylhexyl) phthalate (DEHP) decreased total follicle count and increased the number of ovarian cysts (Brehm et al., 2018). Furthermore, in utero phthalate exposure in rats caused poor oocyte health (Meltzer et al., 2015) in female offspring. In women, phthalates have been associated with earlier age at menopause (Grindler et al., 2015; Neff et al., 2022) and premature ovarian insufficiency (Neff et al., 2022; Ozel et al., 2019). Evidence also indicates that the potential morphological changes in response to phthalates may translate directly to disruptions in ovarian hormone production. Studies in rats have demonstrated that DEHP exposure suppresses E2 levels and causes anovulation at certain doses (Davis et al., 1994), and epidemiologic studies in reproductive age women suggest that certain phthalates are associated with lower sex steroid hormones (Long et al., 2021; Sacha et al., 2021). Unexpectedly, our recent study in midlife women demonstrated that certain urinary phthalate metabolites were positively associated with both AMH and E2 (Chiang et al., 2021). Given that so little is understood about the potential implications of phthalate exposure in women approaching menopause, the first objective of this follow-up study was to evaluate associations of phthalate biomarkers (individually and as a mixture) with ovarian volume, as a marker of folliculogenesis that could potentially explain the positive associations of phthalates with AMH/E2 observed in our prior study. To evaluate this more formally, our second objective was to test whether associations of phthalates with ovarian volume partially explained (mediated) associations of phthalates biomarkers with both AMH and E2.
2. Materials and methods
2.1. Recruitment of women into the Midlife Women’s Health Study (MWHS)
MWHS is a longitudinal, population-based cohort study designed to evaluate risk factors for hot flashes in pre- and peri-menopausal women from Baltimore, MD and the surrounding areas. The MWHS cohort has been extensively described elsewhere (Pacyga et al., 2022; Ryva et al., 2022; Ziv-Gal et al., 2017). Briefly, women were recruited from 2006 to 2015 and were eligible to participate if they were between the ages of 45 and 54, had an intact uterus and ovaries, were not currently pregnant, were not undergoing cancer treatment, were not taking hormonal medications or supplements, and were not postmenopausal. Menopause status was defined as follows using the STRAW + 10 criteria (Harlow et al., 2012): women were premenopausal if they experienced their last menstrual period within the past three months and reported ≥ 11 periods within the past year; women were perimenopausal if they experienced their last menstrual period within the past year but not within the past three months, or experienced their last menstrual period within the past three months and experienced ≤ 10 periods within the past year; and women were postmenopausal if they had not experienced a menstrual period within the past year. All eligible women who participated in the study provided written informed consent using procedures approved by the Institutional Review Boards of the University of Illinois Urbana-Champaign and Johns Hopkins University. Study participants were followed for several years (Ziv-Gal et al., 2017), but the current study focuses on data from year one of the study. Thus, the current cross-sectional study included a subset of 614 women who had complete information on menopause status, urinary phthalate metabolite concentrations, urinary specific gravity, ovarian volume (extreme ovarian volumes were excluded), serum AMH or E2 concentrations, and relevant covariates in study year one.
2.2. Measurement and reporting of covariates
At the first study visit, women completed a questionnaire to provide information on relevant sociodemographic, lifestyle, and health characteristics, including age, race/ethnicity, annual household income, marital status, alcohol intake, smoking status, weight at age 18, oral contraceptive use, and number of live births. Specifically, women reported their race or ethnicity by selecting one of the following options: Caucasian/White, African American/Black, Hispanic, Asian, or other. Alcohol consumption was determined from the “yes” or “no” response to the question “In the last 12 months have you had at least 12 drinks of any kind of alcoholic beverage?” (Pacyga et al., 2022). To ascertain smoking status, women answered “yes” or “no” to the question “Have you ever smoked cigarettes?”. Women reported whether they had ever used oral contraceptives and if they answered “yes”, they also reported how long they had taken oral contraceptive pills. Women reported their marital status as “single”, “married or living with partner”, “widowed”, or “divorced or separated”. To ascertain depression status, women completed the self-administered Center for Epidemiologic Studies-Depression (CES-D) questionnaire (Radloff, 1977), which is comprised of 20 questions asking how women felt during the past week. At an initial clinic visit, trained researchers measured midlife height (in inches) and weight (in pounds) without shoes, which was used to calculate midlife body mass index (BMI, in kg/m2). BMI at age 18 (kg/m2) was calculated using the self-reported weight at age 18 and the measured height at midlife. We calculated change in BMI since age 18 as the difference between midlife BMI and BMI at age 18.
2.3. Assessment of serum E2 and AMH concentrations
Measurement and quantification of midlife hormones is described elsewhere (Chiang et al., 2021; Ziv-Gal et al., 2017). Briefly, participants provided one fasting blood sample at the initial clinic visit and one additional sample at each of the three additional weekly clinic visits. Therefore, participants provided up to four fasting blood samples over four consecutive weeks to approximately capture each week of one menstrual cycle. All clinic visits occurred in the morning to minimize fluctuation in hormones (Bao et al., 2003; Vermeulen, 1976). Serum aliquots (stored at −20 °C) from all four clinic visits were used to measure concentrations of E2 in duplicate using DRG® enzyme-linked immunosorbent assay (ELISA) kits according to the manufacturer’s instructions. Serum aliquots from each woman’s first clinic visit were sent to the University of Virginia Center for Research in Reproduction Ligand Assay and Analysis Core for quantification of AMH concentrations using ELISA. All quality assurance/quality control protocols were described previously (Chiang et al., 2021; Ziv-Gal et al., 2017). The limits of detection (LOD) for E2 and AMH were 9.714 pg/mL and 0.2 ng/mL, respectively (Chiang et al., 2021; Pacyga et al., 2020). Values < LOD were assigned the LOD for that hormone.
2.4. Assessment of ovarian volume
Measurement and reporting of ovarian volume in MWHS has been previously reported (Gallicchio et al., 2016). Briefly, a trained physician performed one transvaginal ultrasound to determine the dimensions of each ovary. The left and right ovarian volumes were calculated using the formula for an ellipsoid: length x height x width x 0.526 for each ovary (Sharara and McClamrock, 1999; Syrop et al., 1995). For each participant, mean ovarian volume was calculated from the left and right ovary measurements for all primary statistical analyses. A total of 69 and 100 women had data available on only the left or right ovary, respectively. For these women, mean ovarian volume represents the volume of the available ovary. Ovaries with a volume greater than 30 cm3 (n = 1) were excluded from the analytic sample, along with ovaries with cysts (a follicle with any measurement greater than 3 cm; n = 31) or those that were smaller than 0.005 cm3 (n = 1).
2.5. Assessment of urinary phthalate metabolite concentrations
Women provided a spot urine sample at the first and each of the three additional weekly clinic visits (corresponding to timepoints for blood collection). Most women provided between 2 and 4 urine samples total, and these samples were physically pooled for quantification of concentrations (in ng/mL) of monobutyl phthalate (MBP), monoisobutyl phthalate (MiBP), monobenzyl phthalate (MBzP), mono-(3-carboxypropyl) phthalate (MCPP), monoethyl phthalate (MEP), mono-(2-ethyl-5-carboxypentyl) phthalate (MECPP), mono-2-ethylhexyl phthalate (MEHP), mono(2-ethyl-5-hydroxyhexyl) phthalate (MEHHP), and mono-(2-ethyl-5-oxohexyl) phthalate (MEOHP). These analyses were completed at the Roy J. Carver Biotechnology Metabolomics Center at the University of Illinois Urbana-Champaign using isotope dilution high-performance liquid chromatography negative-ion electrospray ionization-tandem mass spectrometry with analysis methods that were adapted from the Center for Disease Control and Prevention (Silva et al., 2007; Warner et al., 2020). All quality assurance/quality control protocols were documented elsewhere (Ryva et al., 2022; Warner et al., 2020). Almost all women had all phthalate metabolite concentration≥ LOD, except for two women who had MEP concentrations < LOD, which we assigned a value of LOD/√2. To account for urine dilution, phthalate metabolite concentrations were specific gravity-adjusted (median specific gravity of the analytic sample = 1.018) using previously published methods (Meeker et al., 2009; Pacyga et al., 2020; Pacyga et al., 2022). We molar summed concentrations of MEHP, MEHHP, MECPP, and MEHHP to approximate exposure to DEHP (∑DEHP; in nmol/mL), while non-molar-converted concentrations (in ng/mL) of metabolites MBP, MiBP, MBzP, MCPP, and MEP were used to approximate exposure to parents dibutyl phthalate, diisobutyl phthalate, benzyl butyl phthalate (BBzP), dioctyl phthalate (DOP), and diethyl phthalate, respectively.
2.6. Statistical analysis
We selected covariates using a directed acyclic graph (DAG, (VanderWeele and Robins, 2007)) generated using our data and a priori from relevant literature (Chiang et al., 2021; Messerlian et al., 2016a; Oppermann et al., 2003; Park et al., 2021). We reviewed splines to ascertain appropriate forms of our covariates. We assessed correlations between all covariates to look for potential multicollinearities, but all covariates were only weakly-to-moderately correlated (r < 0.4, data not shown). Final covariate-adjusted models included age, change in BMI since age 18, race/ethnicity, oral contraceptive use, parity, smoking history, alcohol use, income, marital status, and depressive symptoms (CES-D score). Age and change in BMI since age 18 were operationalized as continuous variables, while operationalization of categorical variables along with corresponding reference groups are indicated in Table 1. All sociodemographic characteristics are reported as n (%) or median (25th, 75th percentiles). The distributions of phthalate biomarker concentrations are reported as median (25th, 75th percentiles).
Table 1.
Characteristics of the MWHS analytic sample (n = 614).
| Characteristic | n (%) |
|---|---|
|
| |
| Race/ethnicity* | |
| Other | 23 (3.7) |
| Non-Hispanic Black | 184 (30.0) |
| Non-Hispanic White (ref) | 407 (66.3) |
| Employment | |
| Unemployed | 118 (19.2) |
| Employed | 496 (80.8) |
| Educationa | |
| High school or technical school | 80 (13.0) |
| College graduate or higher | 532 (86.6) |
| Annual household income* | |
| < $50,000 | 134 (21.8) |
| $50,000 to < $149,000 | 356 (58.0) |
| ≥ $150,000 (ref) | 124 (20.2) |
| Marital status* | |
| Single | 111 (18.1) |
| Married/Living with Partner (ref) | 401 (65.3) |
| Widowed/divorced/separated | 102 (16.6) |
| Alcohol use* | |
| No (ref) | 212 (34.5) |
| Yes | 402 (65.5) |
| Ever smoked* | |
| Yes | 273 (44.5) |
| No (ref) | 341 (55.5) |
| Menopause status* | |
| Pre-menopausal | 410 (66.8) |
| Peri-menopausal | 204 (33.2) |
| Depression symptoms* | |
| CESD < 16, less symptoms (ref) | 492 (80.1) |
| CESD ≥ 16, more symptoms | 122 (19.9) |
| Oral contraceptive use* | |
| Never/<1 year (ref) | 173 (28.2) |
| 1–10 years | 311 (50.6) |
| greater than 10 years | 130 (21.2) |
| Reproductive history* | |
| Never pregnant (ref) | 69 (11.2) |
| No live births | 60 (9.8) |
| 1 live birth | 115 (18.7) |
| 2 + live births | 370 (60.3) |
| Median (25th, 75th) | |
| Age* | 48.0 (46.0, 50.0) |
| Change in BMI since age 18, (kg/m2)* | 5.4 (2.6, 10.3) |
| Mean ovarian volume (cm3) | 4.4 (2.7, 6.4) |
| Right ovarian volume (cm3) | 4.0 (2.4, 6.4) |
| Left ovarian volume (cm3) | 4.1 (2.4, 6.7) |
BMI, body mass index; CESD, Center for Epidemiological Studies-Depression.
Missing n = 2.
Indicates covariates included in adjusted models.
2.6.1. Single-pollutant analyses
For our first objective, we specified multivariable linear regression models to evaluate single-pollutant associations of six urinary phthalate biomarker concentrations (MBP, MiBP, MBzP, MCPP, MEP, and ∑DEHP) with ovarian volume. Phthalate biomarker concentrations and ovarian volume were natural log-transformed due to having right-skewed distributions. Because prior studies suggest that there may be a dominant ovary (Fukuda et al., 2000; Jarrett et al., 2019; Korsholm et al., 2017), we performed secondary linear regression analyses to examine associations of phthalate biomarkers separately with right and left ovarian volume (Supplemental Table 1). We back-transformed the resulting β-estimates and 95 % confidence intervals (CIs) using the equation [(1.10β −1) * 100] to interpret our findings as the percent change (%Δ) in ovarian volume for every 10 % increase in phthalate biomarker concentration.
We also confirmed that phthalate biomarkers were associated with AMH and E2 as we have previously reported, but in this slightly different sample of MWHS women (Supplemental Tables 2 and 3). Phthalate biomarkers remained natural-log transformed. As 54 % of women had AMH concentrations < LOD, we categorized AMH as a binary variable (≥ LOD versus < LOD), which was used in all analyses. Because E2 concentrations were measured in multiple samples per participant across the menstrual cycle, the geometric mean of E2 was calculated, and the natural log of the geometric mean was used in all analyses. The resulting β-estimates and 95 % CIs from evaluating the association between phthalate biomarkers and E2 were back-transformed using the equation [(1.10β −1) * 100] to interpret the results as the %Δ in E2 for every 10 % increase in phthalate biomarker concentration. The resulting odds ratios (ORs) and 95 % CIs from logistic regression models evaluating associations between phthalate biomarkers and AMH were back-transformed using the equation [eln(OR*ln(1.10)] to interpret the results as the odds of having AMH concentrations ≥ LOD compared to < LOD for every 10 % increase in phthalate biomarker concentration.
2.6.2. Mixtures analyses
To further understand the associations between phthalate biomarkers and ovarian volume, as well as between phthalate biomarkers and AMH or E2, we employed Weighted Quantile Sum (WQS) regression with the repeated holdout approach (Carrico et al., 2015; Czarnota et al., 2015; Tanner et al., 2019). A major strength of WQS regression is that it can evaluate the joint association of several highly correlated chemicals with an outcome of interest by compiling chemical concentrations, which are transformed into quantiles, into a single, unidirectional weighted index that is then regressed on the outcome via multiple linear or logistic regression (Carrico et al., 2015; Cowell et al., 2020; Czarnota et al., 2015). For our analyses, we included concentrations of all six phthalate biomarkers in the mixture (∑EHP, MCPP, MBzP, MiBP, MBP, and MEP) and converted the concentrations into deciles. Ovarian volume and E2 were ln-transformed, whereas AMH was categorized as described in section 2.6.1. The distributions of results were generated using 100 iterations (repeated holdouts) with 100 bootstrap replications, such that data were randomly split into 40 % training and 60 % validation datasets within each iteration (Cowell et al., 2020; Tanner et al., 2019). We obtained the cumulative associations of the phthalate biomarker mixture with ovarian volume, E2, and AMH, as well as the weights of each biomarker representing their relative importance in the mixture to each cumulative association. Phthalate biomarkers with mean weights above 0.167 (1/6, where 6 is the number of biomarkers included in the mixture) were identified as meaningful contributors to cumulative associations. WQS only evaluates associations of the mixture index with an outcome of interest one direction at a time. Therefore, based on our single-pollutant findings, we hypothesized that the phthalate biomarker mixture would be positively associated with ovarian volume, AMH, and E2, and we specified WQS models in the positive direction (WQSpositive). However, as a control, we also explored and reported findings from negatively constrained WQS models (WQSnegative). For models evaluating associations of the phthalate biomarker mixture with ovarian volume and E2, the resulting β-estimates and 95 % CIs were back-transformed using the equation [(eβ −1) * 100] to interpret the results as the percent change in ovarian volume or E2 if all biomarkers in the mixture increased by 10 %. From models evaluating associations of the mixture with higher vs lower AMH, the resulting ORs and 95 % CIs represent the odds of having AMH concentrations ≥ LOD compared to < LOD if all biomarkers in the mixture increased by 10 %.
2.6.3. Primary mediation analyses
To determine whether ovarian volume mediated or partially explained associations between individual phthalate biomarkers with AMH/E2, we conducted a formal mediation analysis (Richiardi et al., 2013; Valeri and Vanderweele, 2013). Phthalate biomarkers, ovarian volume, and E2 were ln-transformed, whereas AMH was categorized as described in section 2.6.1. Using this method, we evaluated the total association between individual phthalate biomarkers and E2 or AMH, the natural direct effect (how much the total relationship is explained by the direct association phthalate biomarker → AMH/E2), and the natural indirect effect (how much the total relationship is explained by the indirect association phthalate biomarker → ovarian volume → AMH/E2). For consistent interpretation of single pollutant and mixtures analyses (described in sections 2.6.1 and 2.6.2), ORs and 95 % CIs from mediation models evaluating the role of ovarian volume in associations of MCPP or MBzP with AMH were back-transformed using the equation [eln(OR)*ln(1.10)]; while β-estimates and 95 % CIs from models evaluating the role of ovarian volume in associations of MCPP or MBzP with E2 were back-transformed using the equation [(eβ – 1) * 100]. We also calculated the percentage mediated, which represents the proportion of the total association between phthalate biomarkers and AMH/E2 that was explained by ovarian volume.
Methods are currently being developed for conducting mediation analyses using mixtures. Thus, to examine whether ovarian volume mediated associations of the phthalate biomarker mixture with AMH and E2, we additionally adjusted previously described WQS models (section 2.6.2) for ovarian volume. We then qualitatively compared the resulting effect estimates and corresponding 95 % CIs from these models to those where ovarian volume was not included.
All single pollutant analyses were conducted in SAS 9.4 (SAS Institute Inc, Cary, NC, USA) using PROC GLM for linear regression analyses, PROC LOGISTIC for logistic regression analyses, and PROC CAUSALMED for mediation analyses. WQS regression analyses were conducted in R version 4.2.0 (R Foundation for Statistical Computing, Vienna, Austria) using the gWQS: Generalized Weighted Quantile Sum Regression package (Ranzetti, 2021). Based on recommendations from the American Statistical Association, in place of using P-values to identify statistically significant results, we evaluated the direction, strength, and precision of effect estimates to identify potentially meaningful findings (Wasserstein and Lazar, 2016). We did not adjust for multiple comparisons (Rothman, 1990).
3. Results
3.1. Characteristics of the analytic sample
Characteristics of the analytic sample can be found in Table 1. Briefly, most women were non-Hispanic White (66 %), and at study entry, they were married or living with a partner (65 %) and premenopausal (67 %). The median average ovarian volume was 4.4 cm3 (25th, 75th percentile: 2.7, 6.4) (Table 1). The median (25th, 75th percentile) age was 48 years (46, 50), and change in BMI since age 18 was 5.4 kg/m2 (2.6, 10.3). Distributions and LODs of all phthalate metabolite concentrations are presented in Table 2. Over 99 % of women had concentrations of all urinary phthalate metabolites ≥ LOD (Table 2). Urinary phthalate biomarker concentrations in MWHS were higher than in women from the National Health and Nutrition Examination Survey (NHANES) cycles 2005 – 2016 (data not shown) (Haggerty et al., 2021).
Table 2.
Distribution of phthalate biomarker concentrations (n = 614).
| Parents | Metabolites | LOD (ng/niL) | % ≥ LOD | Median (25th, 75th percentile) |
|---|---|---|---|---|
| DEHP | MEHP | 0.20 | 100.0 | 4.94 (3.11, 8.66) |
| MEHHP | 0.05 | 100.0 | 34.66 (22.57, 53.31) | |
| MEOHP | 0.05 | 100.0 | 11.95 (8.36, 21.19) | |
| MECPP | 0.10 | 100.0 | 26.75 (17.92, 45.95) | |
| DOP | MCPP | 0.02 | 100.0 | 2.71 (1.53, 5.72) |
| BBzP | MBzP | 0.01 | 100.0 | 9.58 (6.03, 15.84) |
| DEP | MEP | 0.01 | 99.7 | 94.37 (50.50, 198.67) |
| DBP | MBP | 0.02 | 100.0 | 20.70 (14.82, 30.86) |
| DiBP | MiBP | 0.05 | 100.0 | 16.92 (11.33, 25.20) |
BBzP, benzyl butyl phthalate; DBP, dibutyl phthalate; DEHP, di(2-ethylhexyl) phthalate; DEP, diethyl phthalate; DOP, dioctyl phthalate; DiBP, diisobutyl phthalate; LOD, limit of detection; MBP, monobutyl phthalate; MBzP, monobenzyl phthalate; MCPP, mono(3-carboxypropyl) phthalate; MEP, monoethyl phthalate; MECPP, mono(2-ethyl-5-carboxypentyl); MEHP, mono-(2-ethylhexyl) phthalate; MEHHP, mono(2-ethyl-5-hydroxyhexyl) phthalate; MEOHP, mono(2-ethyl-5-oxohexyl) phthalate; MiBP, monoisobutyl phthalate.
3.2. Single-pollutant and mixture associations of phthalate biomarker concentrations with ovarian volume
Overall, in single-pollutant analyses, we observed that only MCPP and MBzP were meaningfully associated with ovarian volume (Table 3). Specifically, 10 % increases in MCPP and MBzP concentrations were associated with 0.44 % (95 % CI: −0.02 %, 0.91 %) and 0.62 % (95 % CI: 0.02 %, 1.23 %) larger ovarian volume, respectively. When all phthalate biomarkers were included in a mixture, we observed that the mixture was also positively associated with ovarian volume (Table 3). Specifically, 10 % increases in concentrations of all biomarkers were associated with 2.89 % (95 % CI: 0.27 %, 5.59 %) larger ovarian volume. Consistent with single-pollutant models, the most notable biomarker contributors to this association were MBzP (41 %), and MCPP (35 %) (Fig. 1). In secondary analyses evaluating associations separately in the left or right ovaries, we observed that some associations appeared to be side-specific (Supplemental Table 1).
Table 3.
Associations between phthalate biomarker concentrations and ovarian volume (n = 614).
| Phthalate | %Δ (95 % CI) |
|---|---|
| ∑DEHP | 0.22 (−0.45, 0.89) |
| MCPP | −0.44 (−0.02, 0.91) |
| MBzP | 0.62 (0.02, 1.23) |
| MEP | −0.09 (−0.52, 0.35) |
| MBP | −0.23 (−0.98, 0.52) |
| MiBP | −0.49 (−1.23, 0.26) |
| WQSNegative | 0.14 (−1.99, 2.33) |
| WQSPositive | 2.89 (0.27, 5.59) |
Data are presented as the % change (%Δ) in ovarian volume for every 10% increase in phthalate biomarker concentration or every 10% increase in WQS index. All models accounted for race/ethnicity, income, marital status, smoking status, age, oral contraceptive use, change in BMI since age 18, alcohol use, depression symptoms, and reproductive history. WQSNegative and WQSPositive represent findings from WQS regression models with repeated holdouts that were negatively and positively constrained, respectively. CI, confidence interval; ∑DEHP, sum of di(2-ethylhexyl) phthalate metabolites; MBP, monobutyl phthalate; MBzP, monobenzyl phthalate; MCPP, mono(3-carboxypropyl) phthalate; MEP, monoethyl phthalate; MiBP, monoisobutyl phthalate; WQS, Weighted Quantile Sum. Bold indicates meaningful results.
Fig. 1. Relative importance of phthalate biomarkers in associations between the biomarker mixture and ovarian volume.
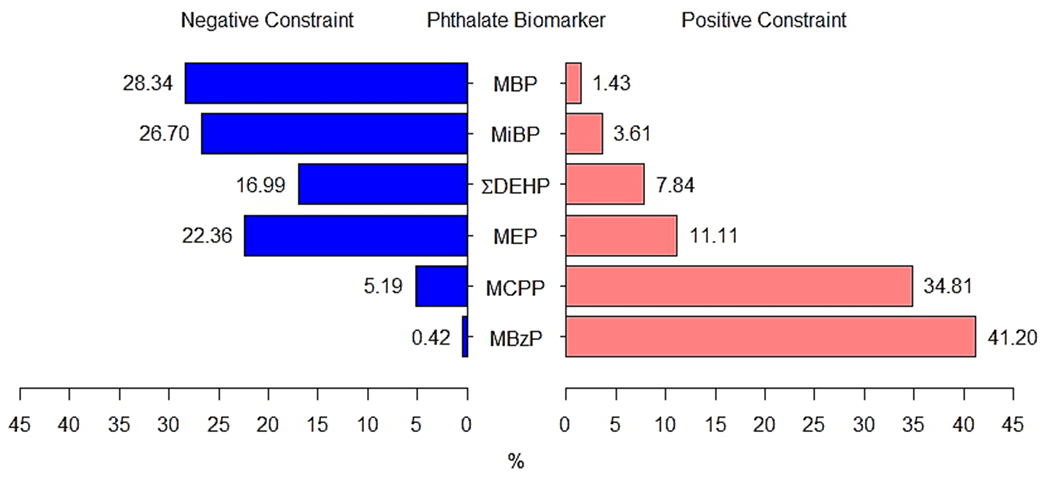
The length of the blue (left) and pink (right) bars represent the relative weights (as percentages) of each biomarker, which were generated from negatively- (blue) and positively (pink)-constrained WQS regression models with repeated holdouts. Weights above 16.7% were identified as notable contributors to meaningful cumulative associations. Models accounted for race/ethnicity, income, marital status, smoking status, age, oral contraceptive use, change in BMI since age 18, alcohol use, depression symptoms, and reproductive history. ∑DEHP, sum of di(2-ethylhexyl) phthalate metabolites; MBP, monobutyl phthalate; MBzP, monobenzyl phthalate; MCPP, mono(3-carboxypropyl) phthalate; MEP, monoethyl phthalate; MiBP, monoisobutyl phthalate; WQS, Weighted Quantile Sum regression.
3.3. Single-pollutant and mixture associations of phthalate biomarker concentrations with AMH and E2
Associations of individual phthalate biomarkers with AMH and E2 in 718 MWHS women were previously published (Chiang et al., 2021), but are reported in Supplemental Tables 2 and 3 for the current analytic sample including a subset of 614 women who also had available ovarian volume data. Overall, we confirmed previously published associations, but also identified additional ones in the current analytic sample. Briefly, women had 1.02 to 1.04 times the odds of having AMH concentration ≥ LOD than ≥ LOD with 10 % increases in MCPP (OR: 1.02; 95 % CI: 1.00, 1.03), MBzP (OR: 1.03; 95 % CI: 1.01, 1.05), or MBP (OR: 1.04; 95 % CI: 1.01, 1.07) (Supplemental Table 2). Similarly, women had 0.68 % to 0.89 % higher E2 concentrations with 10 % increases in ∑DEHP (%Δ: 0.68; 95 % CI: 0.04, 1.33), MCPP (%Δ: 0.46; 95 % CI: 0.01, 0.91), MBP (%Δ: 0.87; 95 % CI: 0.14, 1.60), or MiBP (%Δ: 0.89; 95 % CI: 0.17, 1.62) (Supplemental Table 3). The phthalate biomarker mixture was also positively associated with AMH and E2. Women had 1.14 (95 % CI: 1.03, 1.26) times the odds of having AMH concentrations ≥ LOD than < LOD with 10 % increases in all biomarkers in the mixture (Supplemental Table 2). Consistent with single-pollutant findings, the most prominent biomarker contributors to this positive association were MCPP (28 %), MBzP (23 %), and MBP (20 %) (Supplemental Fig. 1). Additionally, women had 3.29 % (95 % CI: 1.06 %, 5.58 %) higher E2 concentrations with 10 % increases in concentrations of all biomarkers in the mixture (Supplemental Table 3), and consistent with single pollutant findings, the most notable biomarker contributors to this positive cumulative association were MCPP (25 %), MiBP (25 %), and DEHP (19 %) (Supplemental Fig. 2).
3.4. Associations of phthalate biomarker concentrations with AMH and E2 mediated by ovarian volume
Because only MCPP and MBzP were associated with ovarian volume and either AMH or E2, we evaluated whether ovarian volume partially explained associations of MCPP or MBzP with AMH or E2. Overall, we observed that 16 % of the total positive association between MBzP and AMH (total effect OR: 1.03; 95 % CI: 1.00, 1.05) was explained by the association of MBzP with larger ovarian volume (indirect effect OR: 1.004; 95 % CI: 1.00,1.01) (Fig. 2; Supplemental Table 4). Additionally, 23 % of the total positive association between MCPP and E2 (total effect %Δ: 0.45; 95 % CI: 0.01, 0.90) was explained by the association of MCPP with larger ovarian volume (indirect effect %Δ: 0.11; 95 % CI: −0.01, 0.22) (Fig. 2; Supplemental Table 4). When evaluating whether ovarian volume could potentially mediate relationships of the phthalate biomarker mixture with AMH or E2 (Supplemental Table 5), the positive association of the biomarker mixture with AMH (OR: 1.14; 95 % CI: 1.03, 1.26) remained approximately the same after ovarian volume was included in the model (OR: 1.13; 95 % CI: 1.02, 1.24) indicating that larger ovarian volume did not explain this association. However, the previously observed positive association of the biomarker mixture with E2 (%Δ: 3.29; 95 % CI: 1.06, 5.58) was slightly attenuated after accounting for ovarian volume (%Δ: 3.06; 95 % CI: 0.89, 5.26), suggesting that larger ovarian volume may partially explain this relationship.
Fig. 2. Associations of MCPP and MBzP with AMH and E2 mediated by ovarian volume.
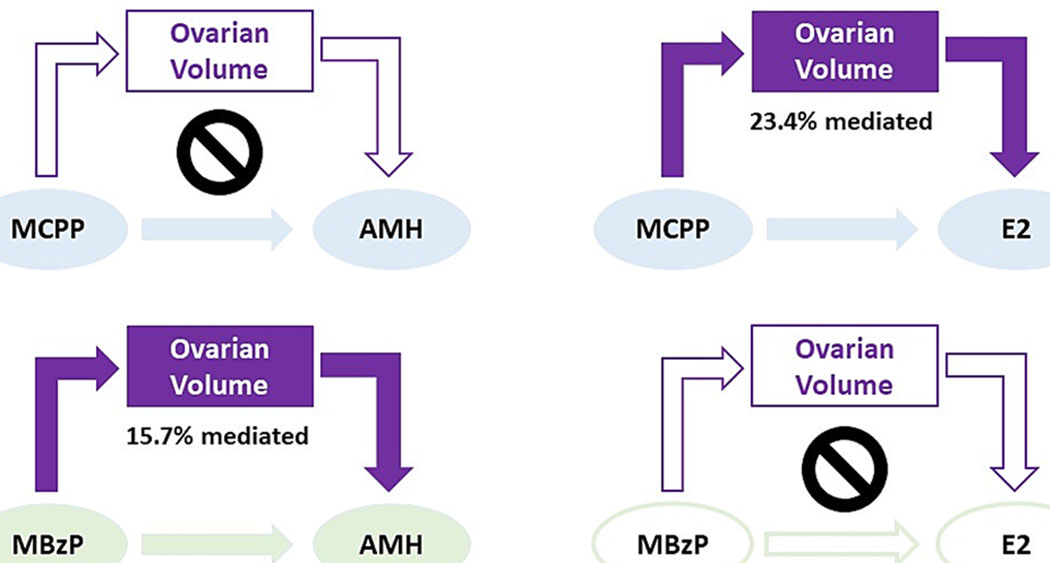
Shaded arrows/shapes indicate meaningful associations for the direct effects (MCPP or MBzP → AMH or E2) and indirect effects (MCPP or MBzP → ovarian volume → AMH or E2), whereas unshaded arrows/shapes indicate null findings. Percentage mediated indicates the proportion of the total relationship that is explained by the indirect effect; crossed circle indicated no meaningful percentage mediated. Formal mediation analysis evaluated the total, natural direct, and natural indirect effects accounting for race/ethnicity, income, marital status, smoking status, age, oral contraceptive use, change in BMI since age 18, alcohol use, depression symptoms, and reproductive history. AMH, anti-Müllerian hormone; E2, estradiol; MBzP, monobenzyl phthalate; MCPP, mono(3-carboxypropyl) phthalate.
4. Discussion
4.1. Summary of findings
Our study conducted in a sample of pre- and peri-menopausal women demonstrated that phthalate biomarkers (primarily MCPP and MBzP) were positively associated with ovarian volume. We also observed that these relationships with ovarian volume partly explained positive associations of MCPP with E2 and MBzP with AMH. One possible explanation for the observed findings is that phthalate exposure may accelerate folliculogenesis, which has implications for hormone production and the natural progression of menopause. Overall, our findings indicate that substantially more research is needed to better understand the effects of phthalates on the health of women beyond their reproductive years.
4.2. Phthalates, individually and as a mixture, were associated with larger ovarian volume
To our knowledge, this is the first observational study to evaluate associations between phthalate biomarkers and ovarian volume in midlife women and to consider mixtures of phthalates. Although single chemical analyses are important for understanding the potential impact of each individual phthalate, humans are exposed to multitudes of chemicals depending on the products they use and environment in which they live (Meeker and Ferguson, 2014; Warner et al., 2019). Several studies conducted using human cells (Cavalca et al., 2022; Tian et al., 2022), rats (Sellinger et al., 2021), and mice (Gill et al., 2021) have reported that exposure to phthalate mixtures adversely impacts female reproductive health, likely because the cumulative effects of phthalates may be greater than exposure to a single phthalate (Howdeshell et al., 2017). In our study in both single-pollutant and mixtures analyses, phthalates were associated with larger ovarian volume, and MCPP and MBzP were the most prominent contributors. Although substantially more data are needed to understand our findings, it is possible that phthalates, particularly parent compounds DOP and BBzP, may need to be investigated as potentially interfering with the natural onset of menopause. As women age, ovarian volume declines and levels of AMH and E2 rapidly decline due to the exponential decline in follicle number (Faddy et al., 1992). An enlarged ovary and elevated AMH or E2 levels at the end of the reproductive window may signal that the remaining follicles are activated and undergoing folliculogenesis (Baumgarten, 2018), thereby rapidly depleting the remaining ovarian reserve. This burst of follicle growth could contribute to a larger ovary and higher levels of AMH and E2 in pre- and peri-menopausal women, which could ultimately result in an earlier onset of menopause. However, positive associations between phthalates and ovarian volume are contrary to prior experimental evidence demonstrating that phthalates decrease antral follicle growth and increase oocyte fragmentation in rodents and cell culture (Fletcher et al., 2022; Hannon and Flaws, 2015; Panagiotou et al., 2021). Life stage and species differences may play an important role in translating these in vivo experimental studies, which were generally conducted in young mice or neonatal ovaries over a short period of time, whereas midlife women have been exposed to phthalates chronically and their ovaries may differentially respond to phthalates. Several observational studies evaluating associations between phthalates and ovarian volume in reproductive-age women undergoing in vitro fertilization (IVF) are also inconsistent with our findings. For example, in one study, ∑DEHP was inversely associated with antral follicle count (Messerlian et al., 2016a). In another, fewer total, mature, and fertilized oocytes were observed with increasing tertiles of urinary MBP and MiBP concentrations (Machtinger et al., 2018). It is difficult to compare our results to the available studies in younger women, who tend to have larger ovaries than older women (Lass and Brinsden, 1999; Pavlik et al., 2000). Additionally, reproductive-age women experiencing infertility are likely to receive hormone therapy (Coussa et al., 2020), may suffer from underlying hormonal irregularities (Luciano et al., 2013), or have other physiological abnormalities (Abrao et al., 2013), and thus may be differentially susceptible to phthalate exposure compared to midlife women. Due to the paucity of experimental evidence and human epidemiologic studies, the exact biological mechanism driving our observed associations is unknown, and studies will be needed to understand how phthalate exposure may impact gynecologic health of midlife women.
4.3. Increased ovarian volume partially explains positive associations of phthalates with AMH and E2
Given our findings that phthalates are associated with ovarian volume in midlife, it is important to consider the potential implications of our findings for hormone production. As previously discussed, a study utilizing a larger sample of MWHS participants observed that phthalate biomarkers (including MCPP and MBzP) were positively associated with several hormones in midlife women, including E2 and AMH (Chiang et al., 2021). Ovarian volume may play a crucial role in associations of phthalates with AMH and E2 because growing follicles (potentially represented by ovarian volume) produce these hormones. In the current study, we confirmed our prior findings that certain phthalates, including MCPP and MBzP, were positively associated with E2 and AMH concentrations in midlife women, suggesting that there was increased synthesis of these hormones in response to MCPP and MBzP. Because these findings are generally not in agreement with those of prior experimental studies reporting inverse associations of phthalates with sex-steroid hormones (Hannon et al., 2015; Meling et al., 2020; Tran et al., 2018), we were interested in understanding the potential physiologic drivers of our results. Additionally, because MCPP and MBzP were also positively associated with ovarian volume, we considered whether this relationship could partly explain our previously observed positive associations of these phthalate metabolites with E2 and AMH. Our findings supported our hypothesis, as we observed that ovarian volume partly mediated the associations between MCPP and E2, as well as between MBzP and AMH. As discussed above, although the direction of these associations does not align with prior studies in reproductive-age women or rodents, our findings may be unique to women nearing or undergoing the menopausal transition. Unlike younger women and most other mammals, women approaching the end of the reproductive lifespan experience an exponential decline in E2 (Randolph et al., 2011), which is linked to numerous physiological changes. Additionally, because ovarian volume only partly mediated associations of phthalates with AMH and E2 (16–23 %), larger ovaries that did not necessarily contribute to elevated hormones (folliculogenesis) could also indicate greater ovarian reserve. While this is generally considered to be positive in reproductive-aged women, larger ovarian reserve in women nearing the end of their reproductive span could indicate irregular cycling or the potential for delayed menopause. Therefore, more studies are needed in midlife women to better define the response of this transitioning population to environmental contaminants, including phthalates.
4.4. Limitations and strengths
This study has several limitations, but also notable strengths. One limitation of our study is that we used ovarian volume as a proxy for ovarian follicle count, and therefore may limit comparability of our findings to others. Yet, many women in the study consented to a transvaginal ultrasound, and studies have shown that ovarian volume is highly correlated with antral follicle count (an indicator of ovarian function) (Ben-Haroush et al., 2012; Erdem et al., 2002; Giacobbe et al., 2004), as well as a good proxy for the number of follicles (the ovarian reserve), especially when follicle counts are not available or easily accessible (Kelsey and Wallace, 2012; Wallace and Kelsey, 2004). Additionally, we measured and evaluated AMH concentrations, which is also an excellent marker of ovarian function and equivalent to antral follicle count in predicting ovarian responsiveness to stimulation by gonadotropins (Practice Committee of the American Society for Reproductive, 2020). Second, our analyses were conducted using cross-sectional data and therefore we cannot determine temporality or infer causality of results because urine samples for phthalate metabolite concentrations, serum samples for AMH or E2 levels, and ovarian volume were measured/collected concurrently. Additionally, this may result in potential bias in observed estimates, particularly for those from mediation analyses, which are meant to be conducted using longitudinal data (Maxwell and Cole, 2007; Mitchell and Maxwell, 2013; O’Laughlin et al., 2018; Shrout, 2011). However, limited data are available in midlife women, and our findings provide a biologically plausible mechanism by which phthalates impact hormone production in midlife women. Third, hormonal fluctuation in pre- and peri-menopausal women is a pertinent limitation of this study because women in our sample were approaching menopause, a time when their hormones, particularly estrogens, are in flux. However, the study collected up to four blood samples to better approximate E2 levels across the menstrual cycle. Fourth, as is the nature of observational studies, there is potential for residual confounding. The current study did not collect data about menstrual cycle length or phase of the menstrual cycle at the time of ovarian volume measurement nor could we discern this information using available hormone data since these women are likely not cycling regularly and not all women provided all four blood samples. To our knowledge, these factors are unlikely to directly confound our associations, but future studies need to elucidate whether phthalates are up or downstream of these endpoints. Additionally, we did not collect data regarding polycystic ovarian syndrome, which may need to be considered in future studies as contributing to our observed associations between phthalates, ovarian volume, and AMH/E2. However, we selected our covariates from the literature and using a DAG. Fifth, in our secondary analysis, we considered differences in associations by ovary side (left vs right). Unfortunately, we did not have data regarding the presence of a corpus luteum, or information on which ovary contained the dominant follicle. Therefore, although our side-specific analysis suggests that there is reason to consider side differences, future studies should consider phenotyping sidedness more accurately to better understand if ovarian dominance has a role in susceptibility to phthalate exposure. Lastly, one limitation of WQS regression is that the approach assumes all chemicals in the mixture are associated with the outcome in the same direction. However, MCPP and MBzP were the strongest contributors to positive cumulative mixtures associations, which was consistent with single-pollutant findings, which is one reason we selected this approach.
5. Conclusion
To our knowledge, this is the first study to evaluate associations between phthalate biomarkers and ovarian volume, and the potential mediating role of ovarian volume in the relationship between phthalate biomarkers and AMH or E2. In our sample of non-Hispanic White and Black midlife women, we observed positive associations between select individual phthalate biomarkers and ovarian volume, which we confirmed using WQS regression, a powerful statistical mixtures approach. Finally, ovarian volume appeared to partially explain associations between individual phthalate biomarkers and ovarian hormones, which has critical implications for women’s health during the transition into menopause. Because our findings are generally inconsistent with the current literature in younger women and in experimental models of other life stages, additional prospective studies in midlife populations are needed to corroborate our findings and further elucidate the potential mediating effect of ovarian volume in the relationship between phthalates and AMH or E2.
Supplementary Material
Funding sources:
This project was supported by the USDA National Institute of Food and Agriculture and Michigan AgBioResearch (R.S.S.), a NIEHS R01 grant ES026956 (J.A.F.), and a NIEHS T32 grant ES007255 (M.E.C.).
Abbreviations:
- AMH
anti-Müllerian hormone
- BBzP
benzyl butyl phthalate
- BMI
body mass index
- CES-D
Center for Epidemiologic Studies-Depression
- CI
confidence interval
- DAG
directed acyclic graph
- DBP
dibutyl phthalate
- DEHP
di(2-ethylhexyl) phthalate
- DEP
diethyl phthalate
- DiBP
diisobutyl phthalate
- DNOP
di-n-octylphthalate
- DOP
dioctyl phthalate
- E2
Estradiol
- IVF
In vitro fertilization
- LOD
limit of detection
- MBP
mono-n-butyl phthalate
- MBzP
monobenzyl phthalate
- MCPP
mono(3-earboxypropyl) phthalate
- MECPP
mono(2-ethyl-5-earboxypentyl) phthalate
- MEHP
mono(2-ethylhexyl) phthalate
- MEHHP
mono(2-ethyl-5-hydroxyhexyl) phthalate
- MEOHP
mono(2-ethyl-5-oxohexyl) phthalate
- MEP
monoethyl phthalate
- MiBP
mono-isobutyl phthalate
- ∑DEHP
sum of di(2-ethylhexyl) phthalate metabolites
- MWHS
Midlife Women’s Health Study
- STRAW+10
Stages of Reproductive Ageing Workshop + 10
- WQS
Weighted Quantile Sum
Footnotes
Statement of ethics: Authors have no conflicts of interest to disclose.
CRediT authorship contribution statement
Maria E. Cinzori: Formal analysis, Data curation, Visualization, Writing – original draft, Writing – review & editing. Diana C. Pacyga: Data curation, Validation, Writing – original draft, Writing – review & editing. Elnur Babayev: Conceptualization, Writing – review & editing. Francesca E. Duncan: Conceptualization, Writing – review & editing. Zhong Li: Methodology, Validation, Writing – review & editing. Paige L. Williams: Methodology, Writing – review & editing. Jodi A. Flaws: Conceptualization, Funding acquisition, Methodology, Supervision, Writing – review & editing. Rita S. Strakovsky: Conceptualization, Funding acquisition, Methodology, Validation, Formal analysis, Investigation, Resources, Writing – review & editing, Visualization, Supervision.
Declaration of Competing Interest
The authors declare that they have no known competing financial interests or personal relationships that could have appeared to influence the work reported in this paper.
Appendix A. Supplementary material
Supplementary data to this article can be found online at https://doi.org/10.1016/j.envint.2023.107771.
Data availability
The authors do not have permission to share data.
References
- Abrao MS, et al. 2013. Anatomical causes of female infertility and their management. Int. J. Gynaecol. Obstet 123 (Suppl 2), S18–S24. [DOI] [PubMed] [Google Scholar]
- Al-Saleh I, et al. 2019. Couples exposure to phthalates and its influence on in vitro fertilization outcomes. Chemosphere 226, 597–606. [DOI] [PubMed] [Google Scholar]
- Al-Saleh I, Elkhatib R, 2016. Screening of phthalate esters in 47 branded perfumes. Environ. Sci. Pollut. Res. Int 23, 455–468. [DOI] [PubMed] [Google Scholar]
- Bao AM, et al. 2003. Diurnal rhythm of free estradiol during the menstrual cycle. Eur. J. Endocrinol 148, 227–232. [DOI] [PubMed] [Google Scholar]
- Baumgarten a S C, C S., 2018. Granulosa Cells. In: Skinner MK (Ed.), Encyclopedia of Reproduction, (Second Edition). Academic Press, pp. 8–13. [Google Scholar]
- Ben-Haroush A, et al. 2012. Correlations between antral follicle count and ultrasonographic ovarian parameters and clinical variables and outcomes in IVF cycles. Gynecol. Endocrinol 28, 432–435. [DOI] [PubMed] [Google Scholar]
- Brehm E, et al. 2018. Prenatal Exposure to Di(2-Ethylhexyl) Phthalate Causes Long-Term Transgenerational Effects on Female Reproduction in Mice. Endocrinology 159, 795–809. [DOI] [PMC free article] [PubMed] [Google Scholar]
- Burger HG, et al. 2002. Hormonal changes in the menopause transition. Recent Prog. Horm. Res 57, 257–275. [DOI] [PubMed] [Google Scholar]
- Cao M, et al. 2020. Urinary levels of phthalate metabolites in women associated with risk of premature ovarian failure and reproductive hormones. Chemosphere 242, 125206. [DOI] [PubMed] [Google Scholar]
- Caporossi L, et al. 2021. Female Reproductive Health and Exposure to Phthalates and Bisphenol A: A Cross Sectional Study. Toxics. 9. [DOI] [PMC free article] [PubMed] [Google Scholar]
- Carrico C, et al. 2015. Characterization of Weighted Quantile Sum Regression for Highly Correlated Data in a Risk Analysis Setting. J. Agric. Biol. Environ. Stat 20, 100–120. [DOI] [PMC free article] [PubMed] [Google Scholar]
- Cavalca AMB, et al. 2022. Effects of a phthalate metabolite mixture on both normal and tumoral human prostate cells. Environ. Toxicol 37, 2566–2578. [DOI] [PubMed] [Google Scholar]
- Chiang C, et al. 2021. Urinary phthalate metabolite concentrations and serum hormone levels in pre- and perimenopausal women from the Midlife Women’s Health Study. Environ. Int 156, 106633. [DOI] [PMC free article] [PubMed] [Google Scholar]
- Coussa A, et al. 2020. Impact of contraception and IVF hormones on metabolic, endocrine, and inflammatory status. J. Assist. Reprod. Genet 37, 1267–1272. [DOI] [PMC free article] [PubMed] [Google Scholar]
- Cowell W, et al. 2020. Prenatal toxic metal mixture exposure and newborn telomere length: Modification by maternal antioxidant intake. Environ Res. 190, 110009. [DOI] [PMC free article] [PubMed] [Google Scholar]
- Czarnota J, et al. 2015. Analysis of Environmental Chemical Mixtures and Non-Hodgkin Lymphoma Risk in the NCI-SEER NHL Study. Environ Health Perspect. 123, 965–970. [DOI] [PMC free article] [PubMed] [Google Scholar]
- Dalgaard M, et al. 2003. Di(2-ethylhexyl) adipate (DEHA) induced developmental toxicity but not antiandrogenic effects in pre- and postnatally exposed Wistar rats. Reprod Toxicol. 17, 163–170. [DOI] [PubMed] [Google Scholar]
- Davis BJ, et al. 1994. Di-(2-ethylhexyl) phthalate suppresses estradiol and ovulation in cycling rats. Toxicol Appl Pharmacol. 128, 216–223. [DOI] [PubMed] [Google Scholar]
- Erdem A, et al. 2002. Age-related changes in ovarian volume, antral follicle counts and basal FSH in women with normal reproductive health. J Reprod Med. 47, 835–839. [PubMed] [Google Scholar]
- Faddy MJ, et al. 1992. Accelerated disappearance of ovarian follicles in mid-life: implications for forecasting menopause. Hum Reprod. 7, 1342–1346. [DOI] [PubMed] [Google Scholar]
- Flaws JA, et al. 2001. Ovarian volume and antral follicle counts as indicators of menopausal status. Menopause 8, 175–180. [DOI] [PubMed] [Google Scholar]
- Fletcher EJ, et al. 2022. Effects of Phthalate Mixtures on Ovarian Folliculogenesis and Steroidogenesis. Toxics. 10. [DOI] [PMC free article] [PubMed] [Google Scholar]
- Fukuda M, et al. 2000. Right-sided ovulation favours pregnancy more than left-sided ovulation. Hum Reprod. 15, 1921–1926. [DOI] [PubMed] [Google Scholar]
- Gadde KM, et al. 2018. Obesity: Pathophysiology and Management. J Am Coll Cardiol. 71, 69–84. [DOI] [PMC free article] [PubMed] [Google Scholar]
- Gallicchio L, et al. 2016. The Associations Between Body Mass Index, Smoking, and Alcohol Intake with Ovarian Volume in Midlife Women. J Womens Health (Larchmt). 25, 409–415. [DOI] [PMC free article] [PubMed] [Google Scholar]
- Giacobbe M, et al. 2004. The usefulness of ovarian volume, antral follicle count and age as predictors of menopausal status. Climacteric 7, 255–260. [DOI] [PubMed] [Google Scholar]
- Gill S, et al. 2021. Prenatal exposure to an environmentally relevant phthalate mixture alters ovarian steroidogenesis and folliculogenesis in the F1 generation of adult female mice. Reprod Toxicol. 106, 25–31. [DOI] [PMC free article] [PubMed] [Google Scholar]
- Grindler NM, et al. 2015. Persistent organic pollutants and early menopause in U.S. women. PLoS One 10, e0116057. [DOI] [PMC free article] [PubMed] [Google Scholar]
- Haggerty DK, et al. 2021. Phthalate exposures and one-year change in body mass index across the menopausal transition. Environ Res. 194, 110598. [DOI] [PMC free article] [PubMed] [Google Scholar]
- Hannon PR, et al. 2015. Mono(2-ethylhexyl) phthalate accelerates early folliculogenesis and inhibits steroidogenesis in cultured mouse whole ovaries and antral follicles. Biol Reprod. 92, 120. [DOI] [PMC free article] [PubMed] [Google Scholar]
- Hannon PR, Flaws JA, 2015. The effects of phthalates on the ovary. Front Endocrinol (Lausanne). 6, 8. [DOI] [PMC free article] [PubMed] [Google Scholar]
- Harlow SD, et al. 2012. Executive summary of the Stages of Reproductive Aging Workshop + 10: addressing the unfinished agenda of staging reproductive aging. Menopause 19, 387–395. [DOI] [PMC free article] [PubMed] [Google Scholar]
- Hoppin JA, et al. 2002. Reproducibility of urinary phthalate metabolites in first morning urine samples. Environ Health Perspect. 110, 515–518. [DOI] [PMC free article] [PubMed] [Google Scholar]
- Howdeshell KL, et al. 2017. Cumulative effects of antiandrogenic chemical mixtures and their relevance to human health risk assessment. Int J Hyg Environ Health. 220, 179–188. [DOI] [PMC free article] [PubMed] [Google Scholar]
- Jarrett BY, et al. 2019. Impact of right-left differences in ovarian morphology on the ultrasound diagnosis of polycystic ovary syndrome. Fertil Steril. 112, 939–946. [DOI] [PMC free article] [PubMed] [Google Scholar]
- Jensen MD, et al. 2014. 2013 AHA/ACC/TOS guideline for the management of overweight and obesity in adults: a report of the American College of Cardiology/ American Heart Association Task Force on Practice Guidelines and The Obesity Society. J Am Coll Cardiol. 63, 2985–3023. [DOI] [PubMed] [Google Scholar]
- Kelsey TW, Wallace WH, 2012. Ovarian volume correlates strongly with the number of nongrowing follicles in the human ovary. Obstet Gynecol Int. 2012, 305025. [DOI] [PMC free article] [PubMed] [Google Scholar]
- Kodoth V, et al. 2022. Adverse Changes in Body Composition During the Menopausal Transition and Relation to Cardiovascular Risk: A Contemporary Review. Womens Health Rep (New Rochelle). 3, 573–581. [DOI] [PMC free article] [PubMed] [Google Scholar]
- Korsholm AS, et al. 2017. Left-right differences in ovarian volume and antral follicle count in 1423 women of reproductive age. Gynecol Endocrinol. 33, 320–323. [DOI] [PubMed] [Google Scholar]
- Lass A, Brinsden P, 1999. The role of ovarian volume in reproductive medicine. Hum Reprod Update. 5, 256–266. [DOI] [PubMed] [Google Scholar]
- Laws MJ, et al. 2021. Endocrine disrupting chemicals and reproductive disorders in women, men, and animal models. Adv Pharmacol. 92, 151–190. [DOI] [PMC free article] [PubMed] [Google Scholar]
- Long SE, et al. 2021. Urinary phthalate metabolites and alternatives and serum sex steroid hormones among pre- and postmenopausal women from NHANES, 2013–16. Sci Total Environ. 769, 144560. [DOI] [PMC free article] [PubMed] [Google Scholar]
- Luciano AA, et al. 2013. Management of female infertility from hormonal causes. Int J Gynaecol Obstet. 123 (Suppl 2), S9–S. [DOI] [PubMed] [Google Scholar]
- Machtinger R, et al. 2018. Urinary concentrations of biomarkers of phthalates and phthalate alternatives and IVF outcomes. Environ Int. 111, 23–31. [DOI] [PMC free article] [PubMed] [Google Scholar]
- Maxwell SE, Cole DA, 2007. Bias in cross-sectional analyses of longitudinal mediation. Psychol Methods. 12, 23–44. [DOI] [PubMed] [Google Scholar]
- Meeker JD, et al. 2009. Urinary phthalate metabolites in relation to preterm birth in Mexico city. Environ Health Perspect. 117, 1587–1592. [DOI] [PMC free article] [PubMed] [Google Scholar]
- Meeker JD, Ferguson KK, 2014. Urinary phthalate metabolites are associated with decreased serum testosterone in men, women, and children from NHANES 2011–2012. J Clin Endocrinol Metab. 99, 4346–4352. [DOI] [PMC free article] [PubMed] [Google Scholar]
- Meling DD, et al. 2020. The effects of a phthalate metabolite mixture on antral follicle growth and sex steroid synthesis in mice. Toxicol Appl Pharmacol. 388, 114875. [DOI] [PMC free article] [PubMed] [Google Scholar]
- Meltzer D, et al. 2015. In utero exposure to the endocrine disruptor di(2-ethylhexyl) phthalate targets ovarian theca cells and steroidogenesis in the adult female rat. Reprod Toxicol. 51, 47–56. [DOI] [PubMed] [Google Scholar]
- Messerlian C, et al. 2016a. Urinary phthalate metabolites and ovarian reserve among women seeking infertility care. Hum Reprod. 31, 75–83. [DOI] [PMC free article] [PubMed] [Google Scholar]
- Messerlian C, et al. 2016b. Urinary Concentrations of Phthalate Metabolites and Pregnancy Loss Among Women Conceiving with Medically Assisted Reproduction. Epidemiology 27, 879–888. [DOI] [PMC free article] [PubMed] [Google Scholar]
- Mitchell MA, Maxwell SE, 2013. A Comparison of the Cross-Sectional and Sequential Designs when Assessing Longitudinal Mediation. Multivariate Behav Res. 48, 301–339. [DOI] [PubMed] [Google Scholar]
- Monteleone P, et al. 2018. Symptoms of menopause - global prevalence, physiology and implications. Nat Rev Endocrinol. 14, 199–215. [DOI] [PubMed] [Google Scholar]
- National Institute on Aging, N. I. o. H., What Is Menopause? , Vol. 2022, 2021. [Google Scholar]
- Neff AM, et al. 2022. The Effects of Environmental Contaminant Exposure on Reproductive Aging and the Menopause Transition. Curr Environ Health Rep 9, 53–79. [DOI] [PMC free article] [PubMed] [Google Scholar]
- O’Laughlin KD, et al. 2018. Cross-Sectional Analysis of Longitudinal Mediation Processes. Multivariate Behav Res. 53, 375–402. [DOI] [PubMed] [Google Scholar]
- Oppermann K, et al. 2003. Ovarian volume in pre- and perimenopausal women: a population-based study. Menopause 10, 209–213. [DOI] [PubMed] [Google Scholar]
- Ozel S, et al. 2019. Serum levels of phthalates and bisphenol-A in patients with primary ovarian insufficiency. Gynecol Endocrinol. 35, 364–367. [DOI] [PubMed] [Google Scholar]
- Pacyga DC, et al. 2020. Associations of Pregnancy History with BMI and Weight Gain in 45–54-Year-Old Women. Curr Dev Nutr. 4, nzz139. [DOI] [PMC free article] [PubMed] [Google Scholar]
- Pacyga DC, et al. 2022. Midlife Urinary Phthalate Metabolite Concentrations and Prior Uterine Fibroid Diagnosis. Int J Environ Res Public Health. 19. [DOI] [PMC free article] [PubMed] [Google Scholar]
- Panagiotou EM, et al. 2021. Phthalates, ovarian function and fertility in adulthood. Best Pract Res Clin Endocrinol Metab. 35, 101552. [DOI] [PubMed] [Google Scholar]
- Park SY, et al. 2021. The Association of Ovarian Reserve with Exposure to Bisphenol A and Phthalate in Reproductive-aged Women. J Korean Med Sci. 36, e1. [DOI] [PMC free article] [PubMed] [Google Scholar]
- Pavlik EJ, et al. 2000. Ovarian volume related to age. Gynecol Oncol. 77, 410–412. [DOI] [PubMed] [Google Scholar]
- Practice Committee of the American Society for Reproductive, M., 2020. Testing and interpreting measures of ovarian reserve: a committee opinion. Fertil Steril. 114, 1151–1157. [DOI] [PubMed] [Google Scholar]
- Radloff LS, 1977. The CES-D Scale: A Self-Report Depression Scale for Research in the General Population. Appl. Psychol. Meas 1, 385–401. [Google Scholar]
- Randolph JF Jr, et al. 2011. Change in follicle-stimulating hormone and estradiol across the menopausal transition: effect of age at the final menstrual period. J Clin Endocrinol Metab. 96, 746–754. [DOI] [PMC free article] [PubMed] [Google Scholar]
- Ranzetti SC,P; Just AC; Bello G; Gennings C, gWQS: Generalized Weighted Quantile Sum Regression. 2021, pp. R package version 3.0.4. https://CRAN.R-project.org/package=gWQS. [Google Scholar]
- Rattan S, et al. 2017. Exposure to endocrine disruptors during adulthood: consequences for female fertility. J Endocrinol. 233, R109–R129. [DOI] [PMC free article] [PubMed] [Google Scholar]
- Rattan S, et al. 2018. Di(2-Ethylhexyl) Phthalate Exposure During Prenatal Development Causes Adverse Transgenerational Effects on Female Fertility in Mice. Toxicol Sci. 163, 420–429. [DOI] [PMC free article] [PubMed] [Google Scholar]
- Richiardi L, et al. 2013. Mediation analysis in epidemiology: methods, interpretation and bias. Int J Epidemiol. 42, 1511–1519. [DOI] [PubMed] [Google Scholar]
- Rothman KJ, 1990. No adjustments are needed for multiple comparisons. Epidemiology 1, 43–46. [PubMed] [Google Scholar]
- Ryva BA, et al. 2022. Determinants of urinary phthalate biomarker concentrations in pre- and perimenopausal women with consideration of race. Environ Res. 214, 114056. [DOI] [PubMed] [Google Scholar]
- Sacha CR, et al. 2021. Urinary phthalate metabolite concentrations are negatively associated with follicular fluid anti-mullerian hormone concentrations in women undergoing fertility treatment. Environ Int. 157, 106809. [DOI] [PMC free article] [PubMed] [Google Scholar]
- Schaedlich K, et al. 2018. DEHP deregulates adipokine levels and impairs fatty acid storage in human SGBS-adipocytes. Sci Rep. 8, 3447. [DOI] [PMC free article] [PubMed] [Google Scholar]
- Sellinger EP, et al. 2021. Perinatal phthalate exposure increases developmental apoptosis in the rat medial prefrontal cortex. Neurotoxicology 87, 167–173. [DOI] [PMC free article] [PubMed] [Google Scholar]
- Sharara FI, McClamrock HD, 1999. The effect of aging on ovarian volume measurements in infertile women. Obstet Gynecol. 94, 57–60. [DOI] [PubMed] [Google Scholar]
- Shrout PE, 2011. Commentary: Mediation Analysis, Causal Process, and Cross-Sectional Data. Multivariate Behav Res. 46, 852–860. [DOI] [PubMed] [Google Scholar]
- Silva MJ, et al. 2004. Urinary levels of seven phthalate metabolites in the U.S. population from the National Health and Nutrition Examination Survey (NHANES) 1999–2000. Environ Health Perspect. 112, 331–338. [DOI] [PMC free article] [PubMed] [Google Scholar]
- Silva MJ, et al. 2007. Quantification of 22 phthalate metabolites in human urine. J Chromatogr B Analyt Technol Biomed Life Sci. 860, 106–112. [DOI] [PubMed] [Google Scholar]
- Syrop CH, et al. 1995. Ovarian volume: a novel outcome predictor for assisted reproduction. Fertil Steril. 64, 1167–1171. [DOI] [PubMed] [Google Scholar]
- Tanner EM, et al. 2019. Repeated holdout validation for weighted quantile sum regression. MethodsX. 6, 2855–2860. [DOI] [PMC free article] [PubMed] [Google Scholar]
- Tepper R, et al. 1995. Ovarian volume in postmenopausal women–suggestions to an ovarian size nomogram for menopausal age. Acta Obstet Gynecol Scand. 74, 208–211. [DOI] [PubMed] [Google Scholar]
- Tian M, et al. 2022. Associations of environmental phthalate exposure with male steroid hormone synthesis and metabolism: An integrated epidemiology and toxicology study. J Hazard Mater. 436, 129213. [DOI] [PubMed] [Google Scholar]
- Toft G, et al. 2012. Association between pregnancy loss and urinary phthalate levels around the time of conception. Environ Health Perspect. 120, 458–463. [DOI] [PMC free article] [PubMed] [Google Scholar]
- Tran DN, et al. 2018. Depletion of follicles accelerated by combined exposure to phthalates and 4-vinylcyclohexene diepoxide, leading to premature ovarian failure in rats. Reprod Toxicol. 80, 60–67. [DOI] [PubMed] [Google Scholar]
- Upson K, et al. 2013. Phthalates and risk of endometriosis. Environ Res. 126, 91–97. [DOI] [PMC free article] [PubMed] [Google Scholar]
- Valeri L, Vanderweele TJ, 2013. Mediation analysis allowing for exposure-mediator interactions and causal interpretation: theoretical assumptions and implementation with SAS and SPSS macros. Psychol Methods. 18, 137–150. [DOI] [PMC free article] [PubMed] [Google Scholar]
- VanderWeele TJ, Robins JM, 2007. Directed acyclic graphs, sufficient causes, and the properties of conditioning on a common effect. Am J Epidemiol. 166, 1096–1104. [DOI] [PubMed] [Google Scholar]
- Vermeulen A, 1976. The hormonal activity of the postmenopausal ovary. J Clin Endocrinol Metab. 42, 247–253. [DOI] [PubMed] [Google Scholar]
- Wallace WH, Kelsey TW, 2004. Ovarian reserve and reproductive age may be determined from measurement of ovarian volume by transvaginal sonography. Hum Reprod. 19, 1612–1617. [DOI] [PubMed] [Google Scholar]
- Wang Y, Qian H, 2021. Phthalates and Their Impacts on Human Health. Healthcare (Basel). 9. [DOI] [PMC free article] [PubMed] [Google Scholar]
- Warner GR, et al. 2019. Ovarian Metabolism of an Environmentally Relevant Phthalate Mixture. Toxicol Sci. 169, 246–259. [DOI] [PMC free article] [PubMed] [Google Scholar]
- Warner GR, et al. 2020. Phthalates and Hot Flashes SI. University of Illinois at Urbana-Champaign. [Google Scholar]
- Wasserstein RL, Lazar NA, 2016. The ASA statement on p-values: context, process, and purpose Vol. 70, 129–133. [Google Scholar]
- Weuve J, et al. 2010. Association of exposure to phthalates with endometriosis and uterine leiomyomata: findings from NHANES, 1999–2004. Environ. Health Perspect 118, 825–832. [DOI] [PMC free article] [PubMed] [Google Scholar]
- Zhou C, et al. 2017. Exposure to an Environmentally Relevant Phthalate Mixture Causes Transgenerational Effects on Female Reproduction in Mice. Endocrinology 158, 1739–1754. [DOI] [PMC free article] [PubMed] [Google Scholar]
- Ziv-Gal A, et al. 2017. The Midlife Women’s Health Study - a study protocol of a longitudinal prospective study on predictors of menopausal hot flashes. Womens Midlife Health. 3, 4. [DOI] [PMC free article] [PubMed] [Google Scholar]
Associated Data
This section collects any data citations, data availability statements, or supplementary materials included in this article.
Supplementary Materials
Data Availability Statement
The authors do not have permission to share data.