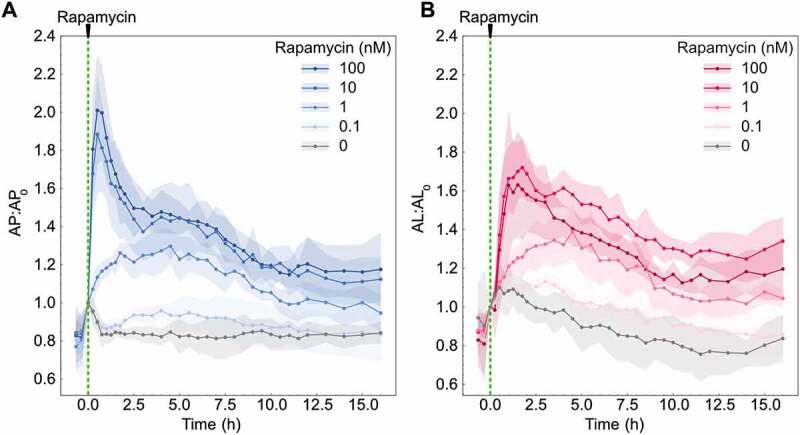
Figure 3.

Autophagosome and autolysosome dynamics are a function of rapamycin concentration. (A) Autophagosome and (B) autolysosome number dynamics after rapamycin treatment. The indicated concentration of rapamycin was added at 0 min. The number of autophagosomes and autolysosomes at 0 min was used as the normalization factor. Data points represent mean while shaded area represents ± standard deviation. Four independent replicates were performed. At least 150–200 cells were imaged for all experiments.
