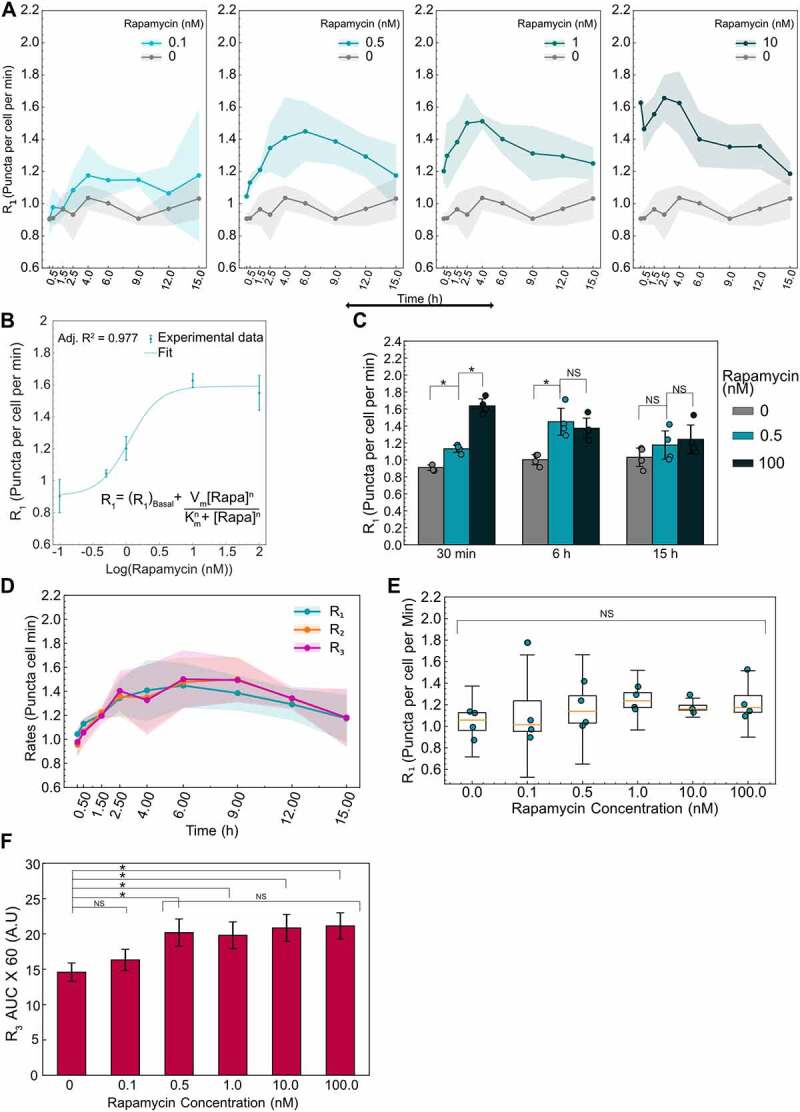
Figure 6.

Initial and time evolution of autophagy rates depend on rapamycin concentration. (A) Temporal dynamics of R1 for different concentrations of rapamycin. Data points represent the mean while shaded area represents ± standard deviation. Four independent replicates were performed. (B) R1 at 10 min after rapamycin addition is plotted as a function of rapamycin concentration. Individual data points represent experimental data while the dotted line represents the model fit. The model used for fitting the data along with the adjusted R2 value is also shown. (C) Statistical comparison of R1 for three different rapamycin concentrations at three different time points. (*) indicates p-value <0.05 and NS indicates not significant. P-values were calculated using an independent two-tail t-test. (D) Temporal evolution of all autophagic rates (R1, R2, R3) for 0.5 nM rapamycin-treated cells. Data points represent the mean while the shaded area represents ± standard deviation. (E) R1 at 15 h as a function of rapamycin concentration. NS indicates not significant. P-values were calculated using a one-way ANOVA test. (F) AUC for R3 data for different concentrations of rapamycin. Data represent mean ± standard deviation. P-values were calculated using a one-way ANOVA test followed by Tukey’s post hoc test for pairwise comparison. At least 150–200 cells were imaged for all experiments.
