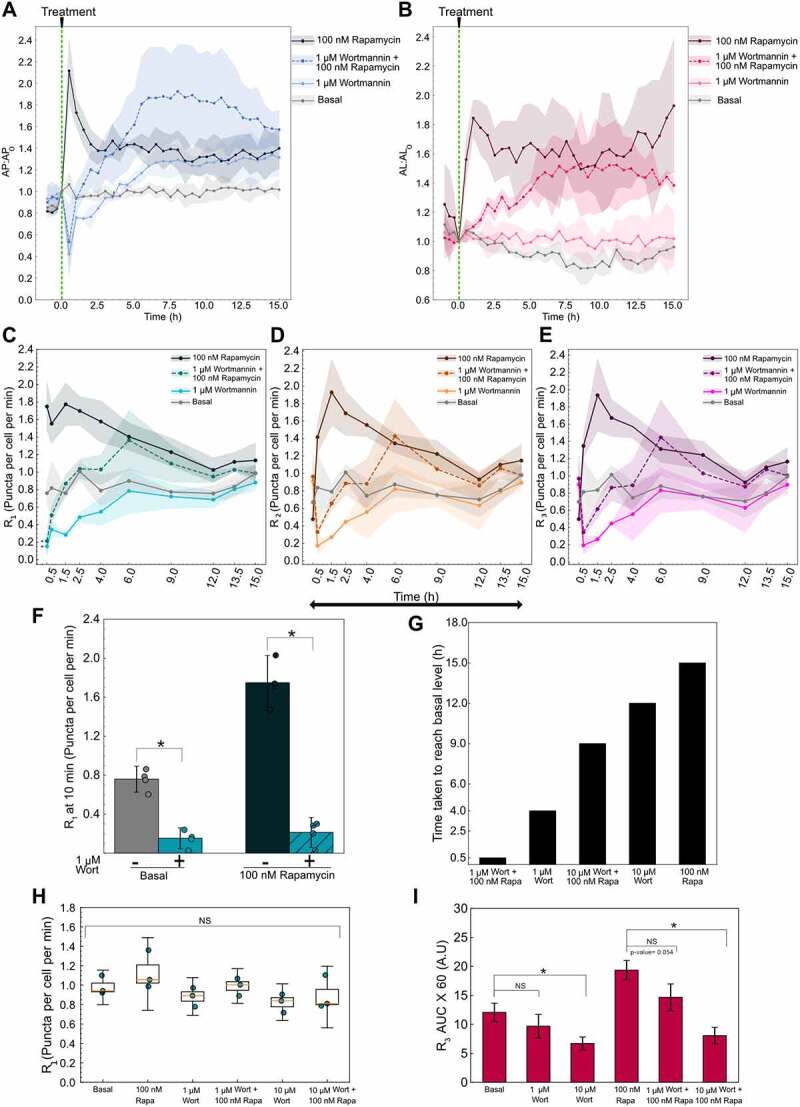
Figure 7.

Variable autophagy recovery time from wortmannin’s inhibition. (A) Autophagosome and (B) autolysosome number dynamics after treatment. The indicated concentration of small molecule was added at 0 min. The number of autophagosomes and autolysosomes at 0 min was used as the normalization factor. Data points represent the mean while the shaded area represents ± standard deviation. Three independent replicates were performed. (C) R1 (D) R2 (E) R3 temporal dynamics for basal, 1 µm wortmannin (Wort) with and without 100 nM rapamycin (Rapa), and 100 nM rapamycin alone. Data points represent the mean while the shaded area represents ± standard deviation. Three independent replicates were performed. (*) indicates p-value <0.05, p-values were calculated using an independent two-tail t-test. (F) Statistical comparison of R1 at 10 min for different treatments. (*) indicates p-value <0.05, p-values were calculated using an independent two-tail t-test. (G) Time taken for R1 of each treatment condition to reach the basal level. (H) R1 at 15 h plotted as a function of treatment condition. NS indicates not significant. p-values were calculated using a one-way ANOVA test. (I) AUC for R3 for different treatments. P-values were calculated using a one-way ANOVA test followed by Tukey’s post hoc test for pairwise comparison. (*) indicates p-value <0.05 and NS indicates not significant. At least 150–200 cells were imaged for all experiments.
