Abstract
Dendritic cells (DCs)‐based tumor vaccines have the advantages of high safety and rapid activation of T cells, and have been approved for clinical tumor treatment. However, the conventional DC vaccines have some severe problems, such as poor activation of DCs in vitro, low level of antigen presentation, reduced cell viability, and difficulty in targeting lymph nodes in vivo, resulting in poor clinical therapeutic effects. In this research, magnetic nanoparticles Fe3O4@Ca/MnCO3 were prepared and used to actively and efficiently deliver antigens to the cytoplasm of DCs, promote antigen cross‐presentation and DC activation, and finally enhance the cellular immune response of DC vaccines. The results show that the magnetic nanoparticles can actively and quickly deliver antigens to the cytoplasm of DCs by regulating the magnetic field, and achieve cross‐presentation of antigens. At the same time, the nanoparticles degradation product Mn2+ enhanced immune stimulation through the interferon gene stimulating protein (STING) pathway, and another degradation product Ca2+ ultimately promoted cellular immune response by increasing autophagy. The DC vaccine constructed with the magnetic nanoparticles can more effectively migrate to the lymph nodes, promote the proliferation of CD8+ T cells, prolong the time of immune memory, and produce higher antibody levels. Compared with traditional DC vaccines, cytoplasmic antigen delivery with the magnetic nanoparticles provides a new idea for the construction of novel DC vaccines.
Keywords: antigen delivery, DC vaccines, magnetic nanoparticles
1. INTRODUCTION
With the huge therapeutic potential, cancer immunotherapy is expected to become the mainstream of cancer treatment. Tumor vaccines, as an important immunotherapy method, have attracted wide attention due to their strong specificity, low side effects, generation of immune memory to long‐term supervise the tumor metastasis, and recurrence. 1 , 2 , 3 Like traditional vaccines, ordinary tumor vaccines containing tumor antigens/adjuvants can be directly immunized to hosts. 4 However, it has been found that conventional tumor vaccines cannot be effectively taken up by antigen presenting cells (APCs) in the body, cannot effectively activate APCs, and fail to produce effective cellular immunity, resulting in poor therapeutic effects. 4 , 5 , 6 To solve this problem, researchers isolate the patient's own dendritic cells (DCs) out of the body and treated them directly in vitro with tumor antigen/adjuvant complex to promote the uptake of the tumor antigen by the DCs. The DCs sensitized in this way are called DC vaccines. Compared with ordinary tumor vaccines, these DC vaccines have more advantages. First, vaccination with the DC vaccines that are sensitized in vitro will greatly save the time for DCs to take up antigen and mature in the body, and activate T cells more quickly and effectively. Second, it is easier for the DC vaccines to activate CD8+ T cells. 7 Third, the safety of DC vaccines is higher. 8 At present, four DC tumor vaccines have been approved for marketing in the world. Among them, the DC vaccine (Provenge) was first approved by the Food and Drug Adminisrtation (FDA) for the treatment of prostate cancer in 2010. 9
Although many DC vaccines have entered clinical trials, the clinical response effectiveness of patients is still low. For example, the objective clinical response rate of the DC vaccines for prostate cancer and renal cell carcinoma is only 7.7%–12.7%. 10 , 11 The main reasons for the inefficiency of DC vaccines include: poor activation of DCs in vitro, reduced activity and migration ability of DCs due to long‐term in vitro culture. As a result, the DC vaccines loaded with antigens usually stay at the injection site for a long time and are eliminated within 48 h. 12 , 13 These problems hinder the clinical application of DC vaccines. In order to improve the efficacy of DC vaccines, researchers have made various attempts to improve the clinical treatment effect of DC vaccine. For example, Toll‐like receptor (TLR) agonists (lipopolysaccharide, polyI:C, Resiquimod, etc.) or inflammatory cytokines (tumor necrosis factor‐α [TNF‐α], IL‐1β, IL‐6, etc.) are used to activate DCs in vitro. 14 Fusion of DCs and tumor cells into DC–tumor hybrid cells can produce stronger cellular immunity, compared with the mixture of DCs and tumor cells. 15 Downregulation of the expression of cytokine signal transduction inhibitor 1 in DCs using siRNA can enhance the immunotherapy effect of DC vaccines. 16 Using the CD40 ligand expressed by T or B cells to bind to CD40 on the surface of DCs to increase expression of their costimulatory molecules can increase the efficacy of the DC vaccines. 17 Using physical techniques such as electroporation can promote the transfection of mRNA to DCs and enhance their antigen presentation. 18 Although these methods increase the anti‐tumor immune response of DC vaccines to a certain extent, there are still problems to be solved, such as complicated preparation technology, low preparation success rate, high cost, and low response rate. Therefore, there is an urgent need to develop easily prepared, low‐cost, efficient, and safe DC vaccines.
In recent years, magnetic nanoparticles have been widely used in tumor diagnosis, treatment, and imaging because of their good biocompatibility, stable performance, easy surface modification, and magnetic controlled drug delivery and release. 19 , 20 , 21 , 22 For example, Chiang et al. 22 used magnetic nanoparticles to load checkpoint inhibitor and T‐cell activators, which could target to tumors by applying an external magnetic field to achieve in situ expansion of tumor‐infiltrating T cells and repair the immunosuppressive tumor microenvironment. Inspired by the directional movement of magnetic nanoparticles, we propose to use magnetic nanoparticles to deliver tumor antigens to the DC cytoplasm under magnetic field, promote antigen cross‐presentation, activate the DCs at the same time, and thereby enhance the cellular immune response. In addition, as reported, Mn2+ can activate cyclic guanosine monophosphate adenosine monophosphate synthase‐interferon gene stimulating protein (cGAS‐STING) cascade reaction to induce antigen cross‐presentation of DCs, 23 , 24 and Ca2+ can regulate autophagy, which will help increase antigen cross‐presentation. 25 , 26 , 27 This stimulated research's interest in Mn/Ca based bioactive materials and adjuvants. For example, calcium phosphate, 28 , 29 , 30 calcium carbonate, 27 , 31 , 32 nano manganese (Mn2+‐cyclic guanosine monophosphate‐adenosine monophosphate synthase (cGAMP) coordinated nano vaccine, 33 Mn2+‐cyclic dinucleotide (CDN) particles, 34 and MnFe2O4 nanoparticles 35 ) were used to enhance the immune response of antigens.
In this work, we prepared magnetic nanoparticles Fe3O4@Ca/MnCO3 with Fe3O4 nanoparticles as the core and Ca/MnCO3 as the shell, and used the nanoparticles to construct a new type of DC vaccines with multiple advantages. First, magnetic field can wirelessly control the magnetic nanoparticles to actively and quickly reach the cytoplasm of DCs. Second, the surface modification of Fe3O4 nanoparticles with degradable Ca/MnCO3 coating can alleviate the aggregation problem of Fe3O4 nanoparticles and meanwhile enhance their loading capacity. Third, Ca/MnCO3 coating and Fe3O4 particles have the merits of simple preparation, low cost, and good bio‐safety, and can be used for safe inoculation. 36 Fourth, the Ca/MnCO3 coating can enhance immune stimulation effect, because its degradation product Mn2+ has vaccine adjuvant effect, 23 , 24 and its degradation product Ca2+ can regulate autophagy 25 , 26 and also promote antigen cross‐presentation. 27 The magnetic nanoparticles‐based antigen delivery system provides a new strategy for the development of novel DC vaccines.
2. METHODS
2.1. Materials
Calcium chloride (CaCl2), sodium carbonate (Na2CO3), manganese chloride monohydrate (MnCl2·H2O), and Fe3O4 nanoparticles were bought from Macklin (Shanghai, China). Cell culture medium 1640 RPMI, fetal bovine serum and penicillin–streptomycin were obtained from Gibco (CA, USA). Lysotracker Green DND‐26 was purchased from ThermoFisher (Waltham, USA). Fluo‐4 AM kit, Bicinchoninic acid (BCA) protein detection kit, 2‐(4‐amidinophenyl)‐6‐indolecarbamidine dihydrochloride (DAPI) staining solution and red blood cell lysis buffer were obtained from Beyotime (Shanghai, China). The cell counting kit‐8 (CCK‐8) was obtained from Dojindo (Kyushu, Japan). Monodansylcadaverine (MDC) was obtained from Solarbio (Beijing, China). Fluorescein isothiocyanate (FITC)‐Tunnel cell apoptosis detection kit and CD8‐GB13429 were obtained from Servicebio (Wuhan, China). LumiKine Xpress mIFN‐β 2.0 enzyme linked immunosorbent assay (ELISA) kit was purchased from InvivoGen (CA, USA). Murine granulocyte‐macrophage colony‐stimulating factor (GM‐CSF) and murine Interleukin (IL) 4 were purchased from PeproTech (NJ, USA). All flow cytometry antibody dyes and cytokine detection ELISA kits were purchased from BioLegend (CA, USA). All female C57BL/6 mice (4–6 weeks) used in the research were purchased from Beijing HFK Laboratory Animal Technology Co. (Beijing, China). In addition, all animal experiments were approved by the Institute of Laboratory Animal Science of Jinan University and complied with animal ethics and guidelines of Jinan University.
2.2. Fabrication and characterization of Fe3O4 @Ca/MnCO3 nanoparticles
First, CaCl2 and MnCl2 mixed solutions (0.016 M, the molar ratio of Ca2+ and Mn2+ = 1:1) were prepared with glycerol/water solution (1/1, v/v). Then, Fe3O4 nanoparticles (5 mg) were added to CaCl2 and MnCl2 mixed solution (10 ml) and stirred for 30 min. NH4HCO3 (10 ml, 0.16 M) in glycerol/water solution (1/1, v/v) was then added to the mixture and stirred for 1 h at 50°C. Then, the precipitate was centrifuged and washed with water three times. Finally, the formed nanoparticles were subject to characterization with scanning electron microscope (SEM, Zeiss, Germany), transmission electron microscope (TEM, JEM‐2010HR, Japan), Fourier infrared spectrometer (FT‐IR, VERTEX70, Germany), laser nanoparticle sizer (Malvern, Britain), X‐ray powder diffractometer (XRD, Miniflex 600, Rigaku, Japan), vibrating sample magnetometer (LakeShore, USA), and specific surface area and porosity analyzer (ASAP 2460, Micromeritics, USA).
2.3. Adsorption and release of OVA by Fe3O4 @Ca/MnCO3 nanoparticles
Firstly, 1 ml of OVA solution (300 μg/ml) was prepared with physiological saline. Then, the Fe3O4 (5 mg) and Fe3O4@Ca/MnCO3 nanoparticles (5 mg) were added into the ovalbumin (OVA) solution (1 ml). The resulting suspensions were stirred at room temperature, and the free OVA in the solution was detected at different time points with the BCA kit. Then, Fe3O4@Ca/MnCO3/OVA were placed in acid phosphate buffered saline (PBS) buffer solution (pH 5.6), and BCA kits were used to detect the release behavior of OVA in vitro acidic environment.
2.4. Isolation and stimulation of bone marrow‐derived dendritic cells
Bone marrow‐derived dendritic cells (BMDCs) were obtained from the healthy female C57BL/6 mice. Briefly, the bone marrow cells were obtained from tibias and femurs, and red blood cells in it were lysed with red blood cell lysate. These bone marrow cells were cultured with RPMI1640 complete medium (containing 20 ng/ml GM‐CSF and 10 ng/ml IL‐4) and seeded into 6‐well plates. The medium was replaced in every 2 days. On the 6th day, the immature BMDCs were seeded into 24‐well low attachment surface plates (1 × 10⁵ cells/well) and treated for 24 h with OVA, Fe3O4@Ca/MnCO3 + OVA (mixture of soluble OVA and blank nanoparticles), Fe3O4@Ca/MnCO3/OVA (Fe3O4@Ca/MnCO3 loaded with OVA, without magnetic field), Fe3O4@Ca/MnCO3(M) (Fe3O4@Ca/MnCO3 loaded with OVA, with magnetic field created by neodymium iron boron permanent magnetic disks) or Alum/OVA formulations (5 μg OVA/well). Then, the fluorescent dye‐labeled antibodies solutions (anti‐CD11c‐APC, anti‐H2Kb/SIINFEKL [MHC I]‐PE, anti‐MHC II‐PE, anti‐CD80‐FITC, anti‐CD40‐PerCP‐Cy5.5, and anti‐CD86‐PerCP‐Cy5.5) were used to detect the expression of OVA‐specific class I major histocompatibility complex (MHC I), MHC II, CD80, CD86, and CD40 molecules on CD11c+ DCs. The cells were detected by a flow cytometer (Beckman Coulter, USA). Meanwhile, the secretion levels of interferon (IFN)‐β in the supernatants were detected with mIFN‐β 2.0 ELISA kits as detailed in the manufacturer's instructions.
In addition, the levels of BMDC maturation and antigen presentation induced by Fe3O4/OVA and Fe3O4@Ca/MnCO3/OVA group were compared. Firstly, in order to ensure consistent OVA loading amount on Fe3O4 and Fe3O4@Ca/MnCO3 nanoparticles, 120 μg OVA was added into 5 mg of Fe3O4 or Fe3O4@Ca/MnCO3 suspension to obtain Fe3O4/OVA and Fe3O4@Ca/MnCO3/OVA formulation. Then, the immature BMDCs were seeded into 24‐well low attachment surface plates (1 × 10⁵ cells/well) and treated for 24 h with OVA, Fe3O4/OVA, Fe3O4@Ca/MnCO3/OVA, or Alum/OVA formulations (5 μg OVA/well). Subsequently, the cells were stained with the above fluorescent dye‐labeled antibodies solutions and detected by the flow cytometer.
2.5. Cell uptake and subcellular co‐localization of magnetic nanoparticles
DC2.4 and BMDCs were seeded in glass‐bottom cell culture dishes (35 mm in diameter) (about 5 × 10⁴ cells/dish), and incubated for 24 h. Then, the cells were incubated at 37°C for 6 h with the OVA molecule labeled with Cy5.5 (Cy5.5‐OVA), Fe3O4@Ca/MnCO3 + Cy5.5‐OVA, Fe3O4@Ca/MnCO3/Cy5.5‐OVA, or Fe3O4@Ca/MnCO3/Cy5.5‐OVA(M) formulations. Subsequently, the cells were incubated for 2 h with the Lyso‐Green fluorescent dye solution, fixed for 20 min with the 4% paraformaldehyde solution, and then stained for 10 min with DAPI dye solution (300 μl). Finally, the cells were observed with a confocal laser scanning microscope (CLSM, LSM 880, Zeiss, Germany).
The DC2.4 cells were seeded in 24‐well plates (5 × 10⁴ cells/well), and incubated for 24 h at 37°C. The cells were incubated for 6 h at 37°C with PBS, Cy5.5‐OVA, Fe3O4@Ca/MnCO3 + Cy5.5‐OVA, Fe3O4@Ca/MnCO3/Cy5.5‐OVA, or Fe3O4@Ca/MnCO3/Cy5.5‐OVA(M) formulations. Finally, the cells were washed twice to remove the free particles, and detected by the flow cytometer.
2.6. Observation of intracellular Fe3O4 @Ca/MnCO3 nanoparticles in DC2.4
The DC2.4 cells were seeded in 10 cm petri dishes (5 × 10⁵ cells/dish) and incubated for 24 h. Subsequently, the cells were incubated for 24 h with Fe3O4@Ca/MnCO3 nanoparticles. Then, the cells were fixed for 15 min with 1 ml of glutaraldehyde solution. Next, the cells were gently collected and re‐fixed for 2 h with glutaraldehyde solution. Finally, the cells were embedded in resin, sliced, and observed by the TEM.
2.7. Detection of lysosome integrity
The DC2.4 cells were seeded in 24‐well plates (5 × 10⁴ cells/well) and incubated for 24 h. Next, the cells were stained for 1 h with 5 μg/ml acridine orange dye solution. After removing the dye, the cells were cultured for 24 h with PBS, OVA, Fe3O4@Ca/MnCO3 + OVA, Fe3O4@Ca/MnCO3/OVA, Fe3O4@Ca/MnCO3/OVA(M), or Alum/OVA formulations. The distribution of acridine orange in the cells was observed with a fluorescence microscope (DMRA2, Leica, Germany).
The DC2.4 cells were seeded in 96‐well black plates (1 × 10⁴ cells/well) and incubated for 24 h at 37°C. The treatment of acridine orange staining was as same as the above steps. Then, the red (620 nm) and green (485 nm) fluorescence intensities of the cells were detected with a multifunctional microplate reader (Cytation5, Biotek, USA). Lysosome integrity of the treated cells (%) = (red/green fluorescence intensity of the treated cells)/(red/green fluorescence intensity of the control cells) × 100%.
2.8. Detection of intracellular Mn2+ level and Ca2+
The DC2.4 cells were seeded in 6‐well plates (1 × 10⁵ cells/well) and incubated for 24 h at 37°C. Then, the cells were incubated at 37°C for 24 h with OVA, Fe3O4@Ca/MnCO3 + OVA, Fe3O4@Ca/MnCO3/OVA, or Fe3O4@Ca/MnCO3/OVA(M) formulations. Subsequently, the cells were lysed with 1 ml cell lysis buffer, then the supernatant was collected and diluted to 5 ml. Mn content in each sample was determined using inductively coupled plasma‐atomic emission spectrometry (iCAP 7000, Thermo, USA). For detection of intracellular Ca2+ level, the above cells were stained for 30 min with Flo‐4 AM staining solution (200 μl, 5 μmol/L) and detected with the flow cytometer.
2.9. Detection of autophagosome
The DC2.4 cells were seeded in 24‐well plates (5 × 10⁴ cells/well) and incubated for 24 h at 37°C. Then, the cells were incubated at 37°C for 24 h with OVA, Fe3O4@Ca/MnCO3 + OVA, Fe3O4@Ca/MnCO3/OVA, Fe3O4@Ca/MnCO3/OVA(M), or Alum/OVA formulations. Subsequently, the cells were stained for 1 h with MDC staining and observed with the fluorescence microscope.
2.10. Detection of IFN‐β
The BMDCs were seeded in 24‐well plates (5 × 10⁴ cells/well), and incubated at 37°C for 24 h with OVA, Fe3O4@Ca/MnCO3 + OVA, Fe3O4@Ca/MnCO3/OVA, Fe3O4@Ca/MnCO3/OVA(M), or Alum/OVA formulations. Subsequently, their supernatants were collected to detect the level of IFN‐β.
2.11. Coculture assays
The above‐activated BMDCs were cocultured with naive splenocytes in 24‐well plates at a splenocytes/BMDCs ratio of 1,000,000/100,000. Their supernatants were collected after 48 h and evaluated with ELISA for IFN‐γ, TNF‐α, IL‐4, IL‐6, and IL‐10. Meanwhile, the cells were dyed with the fluorescent dye‐labeled antibodies solutions (anti‐CD3‐APC and anti‐CD8‐PerCP‐Cy5.5) to detect the ratio of CD8+ T cells.
2.12. Detection of antigen migration to lymph nodes
First, the above activated BMDCs were collected and suspended in PBS at a final concentration of 1 × 10⁷ cells/ml. The C57BL/6 female mice (4–6 weeks old) were randomly divided into four groups (n = 4), and immunized with 100 μl of activated DCs. On the 2nd day after immunization, the lymph nodes of the mice were collected and observed with a small animal bioluminescence imaging system (IVIS Lumina III, PerkinElmer, USA). Subsequently, the lymphocytes were obtained and counted with the flow cytometer.
2.13. Immunohistochemical analysis
The female C57BL/6 mice (4–6 weeks old) were randomly divided into five groups (n = 5). Subsequently, the mice were subcutaneously immunized with 100 μl of the OVA‐activated DCs (1 × 10⁶ cells/mouse). On the 2nd and 7th day, the spleens and lymph nodes of the mice were collected, and fixed with 4% paraformaldehyde solution for further immunohistochemical analysis. The distributions of antigen protein OVA in spleens and lymph nodes were observed by an optical microscope (Leica DMI6000, Germany).
2.14. Immunization evaluations of the DC vaccines in vivo
The C57BL/6 female mice (4–6 weeks old) were randomly divided into five groups (n = 5) and subcutaneously immunized with 100 μl of the OVA, Fe3O4@Ca/MnCO3 + OVA, Fe3O4@Ca/MnCO3/OVA, Fe3O4@Ca/MnCO3/OVA(M), or Alum/OVA ‐treated DCs (1 × 10⁶ cells/mouse). The mice were vaccinated twice with interval of 7 days. On the 7th day after the 2nd vaccination, the sera and splenocytes were separated from the mice.
In addition, the immunological evaluation of Fe3O4/OVA or Fe3O4@Ca/MnCO3/OVA nanoparticles activated DCs was carried out in vivo. The C57BL/6 female mice (4–6 weeks old) were randomly divided into five groups (n = 5) and subcutaneously immunized with 100 μl of the OVA, Fe3O4/OVA, Fe3O4@Ca/MnCO3/OVA, or Alum/OVA‐treated DCs (1 × 10⁶ cells/mouse). The mice were vaccinated twice with interval of 7 days. On the 7th day after the 2nd vaccination, the sera, splenocytes, and lymphocytes were separated from the mice.
2.15. Determination of OVA‐specific antibodies in sera
The OVA‐specific antibodies in the sera were detected with ELISA. First, the antigen OVA solution (10 μg/ml) was prepared with carbonate buffer (0.1 M, pH = 9.6) and added to 96‐well plates (100 μl/well) for coating overnight at 4°C. On the 2nd day, the 96‐well plates were washed three times with PBS containing 0.05% Tween (PBST) and incubated at 37°C for 1 h with 200 μl of blocking solution (PBST solution containing 2% bovine serum albumin). Subsequently, the 96‐well plates were washed three times and incubated for 2 h with 100 μl of diluted sera samples (dilution ratio: 1000). Then, the 96‐well plates were washed with PBST three times and incubated at 37°C for 1 h with the horseradish peroxidase‐conjugated goat anti‐mouse IgG antibody solution (100 μl/well). Subsequently, the 96‐well plates were washed with PBST four times, and incubated in dark for 15 min with the 3,3′,5,5′‐tetramethylbenzidine substrate solution (100 μl/well). Finally, the 96‐well plates were incubated with H2SO4 solution (100 μl/well) to stop the enzymatic reaction. Then, the optical absorbances (ODs) of the wells were read at 450 nm by the microplate reader.
2.16. Measurement of splenocytes proliferation
The obtained splenocytes were seeded in 96‐well plates (6 parallel wells/mouse, 5 × 10⁴ cells/well). Among them, three parallel wells were restimulated for 72 h with the OVA solution (final concentration: 25 μg/ml) and the other three parallel wells without OVA solution were used as negative controls. Then, all cells were incubated for 4 h at 37°C with the CCK‐8 reagent (20 μl/well) and measured with the microplate reader. The splenocyte proliferation index (PI) was calculated with the formula:
2.17. Detection of the cytokines secreted by the splenocytes
The obtained splenocytes were seeded in 12‐well plates (5 × 10⁵ cells/well) and re‐stimulated for 60 h with OVA solution (final concentration: 25 μg/ml). Subsequently, the secretion levels of cytokines IFN‐γ, IL‐6, IL‐4, and TNF‐α in supernatants were detected with ELISA kits as detailed in the manufacturer's instructions and the cells were dyed with the fluorescent dye‐labeled antibodies solutions (anti‐CD3‐APC, anti‐CD8‐PerCP‐Cy5.5, and anti‐CD4‐FITC) to detect the percentage of CD8+/CD4+ T cells.
2.18. Detection of immune memory T cells
The obtained splenocytes (1 × 10⁶ cells/mouse) were stained with fluorescent dye‐labeled antibodies solutions (anti‐CD62L‐APC, anti‐CD44‐PE, anti‐CD8a‐PerCP‐Cy5.5, and anti‐CD4‐FITC) and then detected the percentages of CD44hi CD62Llow cells in CD8+ T cells and CD4+ T cells with the flow cytometer.
2.19. Evaluation of histocompatibility of the DC vaccines
The five main tissues (heart, liver, spleen, lung, and kidney) of the mice were collected and fixed with 4% paraformaldehyde solution to prepare the tissue slices. Subsequently, those tissue slices were stained with hematoxylin–eosin staining solution and observed with the optical microscope.
2.20. Statistical analysis
The obtained data were statistically analyzed using GraphPad Prism 5 software and the differences between the groups were analyzed using one‐way ANOVA test. The data were expressed as the mean ± standard deviation (Mean ± SEM). *p < 0.05, **p < 0.01, and ***p < 0.001 were used to indicate the significant differences.
3. RESULTS AND DISCUSSION
3.1. Rational design and characterization of Fe3O4 @Ca/MnCO3 nanoparticles
Multifunctional Fe3O4@Ca/MnCO3 magnetic nanoparticles were synthesized via one‐step method by forming Ca doped MnCO3 (Ca/MnCO3) coating around Fe3O4 nanoparticles cores. The size and shape of the Fe3O4@Ca/MnCO3 nanoparticles were investigated by SEM and TEM. The TEM images showed that the size of the Fe3O4 nanoparticles and Fe3O4@Ca/MnCO3 nanoparticles was ~200 nm (Figure 1a) and ~900 nm (Figure 1b), respectively. In addition, the TEM image of Fe3O4@Ca/MnCO3 nanoparticles taken at low magnification was shown in Figure S1A, Fe3O4@Ca/MnCO3 nanoparticles had uniform particle size and good dispersibility. The SEM image shows that the morphology of the Fe3O4@Ca/MnCO3 nanoparticles is flower‐like (Figures 1c). As the strong magnetic properties of Fe3O4 nanoparticles (Figure 1d), the obtained Fe3O4@Ca/MnCO3 nanoparticles still kept good magnetic property (Figure 1e). The sizes and zeta potentials of the Fe3O4 nanoparticles were 255.0 nm and −7.02 mV respectively, and those of Fe3O4@Ca/MnCO3 nanoparticles were 955.4 nm and − 15.7 mV, respectively (Figures 1f), which indicates that Ca/MnCO3 coating increased the size of Fe3O4 nanoparticles and decreased the zeta potential of Fe3O4 nanoparticles. This will help to reduce the aggregation of magnetic nanoparticles. Meanwhile, we measured size of Fe3O4@Ca/MnCO3 nanoparticles dispersed in deionized water at different times. As shown in Figure S2A,B, the measured sizes of Fe3O4 nanoparticles increased obviously within 12 h, while the measured sizes of Fe3O4@Ca/MnCO3 nanoparticles remained almost unchanged within 12 h, indicating that the Fe3O4@Ca/MnCO3 nanoparticles maintain good dispersion over 12 h, which will not affect their application in DCs.
FIGURE 1.
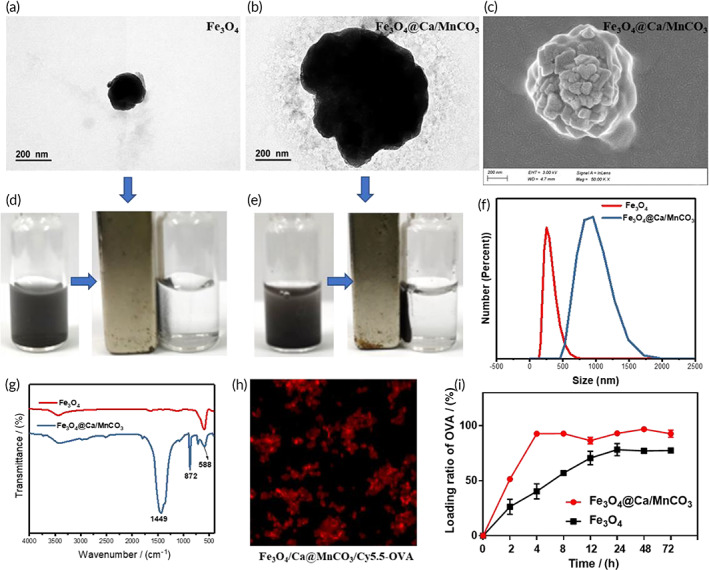
Characterization of Fe3O4 and Fe3O4@Ca/MnCO3 nanoparticles. Transmission electron microscope images of Fe3O4 (a) and Fe3O4@Ca/MnCO3 nanoparticles (b). (c) Scanning electron microscope image of Fe3O4@Ca/MnCO3 nanoparticles. The magnetic response capacity of Fe3O4 (d) and Fe3O4@Ca/MnCO3 nanoparticles (e). (f) The size of Fe3O4 and Fe3O4@Ca/MnCO3 nanoparticles. (g) FT‐IR spectra of Fe3O4 and Fe3O4@Ca/MnCO3 nanoparticles. (h) The confocal laser scanning microscope images of Fe3O4@Ca/MnCO3 nanoparticles loaded with Cy5.5‐OVA. (i) the loading ratios of OVA by Fe3O4 and Fe3O4@Ca/MnCO3 nanoparticles
Subsequently, the FT‐IR and XRD were used to analyze the crystal structure of the Fe3O4@Ca/MnCO3 nanoparticles. The FT‐IR spectra of Fe3O4 and Fe3O4@Ca/MnCO3 nanoparticles are shown in Figure 1g, the absorption peak at around 588 cm−1 was the characteristic absorption of Fe–O–Fe stretching vibration, 37 while the absorption band at 1449 and 872 cm−1 in the spectrum corresponds to the stretching and bending vibrations of CO3 2− 38 respectively. The XRD spectra of Fe3O4 and Fe3O4@Ca/MnCO3 nanoparticles are shown in Figure S1B. The diffraction peaks around 2θ = 23.45°, 30.15°, 36.47°, 39.98°, and 49.42° corresponded to the (012), (104), (110), (113), and (116) crystal planes of standard XRD pattern of MnCO3 (JCPDS no. 44‐1472), respectively. The diffraction peaks around 2θ = 18.28°, 35.48°, 43.06°, 56.98°, and 62.66° corresponded to the (111), (311), (400), (511), and (440) crystal planes of standard XRD pattern of Fe3O4 nanoparticles (JCPDS no. 65‐3107), 39 respectively. The XRD pattern of Fe3O4@Ca/MnCO3 does not contain the crystal form of CaCO3, indicating that Ca does not exist in CaCO3 form in the crystal. While the inductively coupled plasma (ICP) elemental analysis result showed that the Fe3O4@Ca/MnCO3 nanoparticles contained Fe (14.1%, w/w), Ca (14.8%, w/w), and Mn (11.3%, w/w) element. These results indicate that Ca/MnCO3 was successfully coated around the surface of the Fe3O4 nanoparticles, and Fe3O4@Ca/MnCO3 nanoparticles were successfully synthesized.
In addition, the specific surface area results of Fe3O4 and Fe3O4@Ca/MnCO3 nanoparticles are shown in Figure S1C,D. The specific surface area of Fe3O4 nanoparticles was extremely low (7.345 m2/g), while the specific surface area of Fe3O4@Ca/MnCO3 nanoparticles increased to 57.67 m2/g. Thus, the coating of Ca/MnCO3 increased the specific surface area, which will help to improve the loading level of OVA. The magnetization curves of Fe3O4 and Fe3O4@Ca/MnCO3 nanoparticles are shown in Figure S2C. The magnetic property (Ms) of Fe3O4 nanoparticles was 80.1 emu/g, and that of Fe3O4@Ca/MnCO3 nanoparticles was 13.36 emu/g. Although the coating of Ca/MnCO3 reduces the Ms of Fe3O4, this level of Ms (13.36 emu/g) is sufficient for biological applications (usually 7–22 emu/g). 40 , 41 Moreover, no hysteresis curve was observed, which indicates the characteristic superparamagnetic behavior of the Fe3O4 and Fe3O4@Ca/MnCO3 nanoparticles. 42
3.2. Antigen loading and release capacity of Fe3O4 @Ca/MnCO3 nanoparticles
The tumor model antigen, OVA, was selected to test the antigen loading capacity of Fe3O4@Ca/MnCO3 nanoparticles. After adsorbing the fluorescently labeled OVA (Cy5.5‐OVA), the resulting Fe3O4@Ca/MnCO3/Cy5.5‐OVA complexes emitted red fluorescence (Figure 1h). Subsequently, the OVA loading capabilities by Fe3O4 and Fe3O4@Ca/MnCO3 nanoparticles were measured. As shown in Figure 1i, the OVA loading ability of the Fe3O4 nanoparticles was low, 5 mg of Fe3O4 nanoparticles only loaded 120 μg OVA within 4 h, while 5 mg of Fe3O4@Ca/MnCO3 nanoparticles could load 280 μg OVA within 4 h and remained intact within 72 h. Those results prove that Ca/MnCO3 coating increase the antigen loading capacity of Fe3O4 nanoparticles, which may be attributed to the fact that the coating of Ca/MnCO3 increased the specific surface area that provides more adsorption sites. In addition, several literatures have reported that the amounts of OVA loaded on carriers is usually in the range of 7.32–220 μg/mg. 43 , 44 , 45 , 46 , 47 , 48 , 49 In this study, the OVA amount loaded on Fe3O4@Ca/MnCO3 nanoparticles was 56 μg/mg, which has met the application of immunization.
Subsequently, the release of OVA was detected with BCA kit at different times, as shown in Figure S1D. OVA was quickly released from the Fe3O4@Ca/MnCO3/OVA nanoparticles at acidic buffer solution and reached the maximum release ratio within 1 h.
3.3. Nanoparticles enhance the maturation of BMDCs and antigen presentation
Exogenous antigens with low immunogenicity and stability, 50 are usually presented to CD4+ T cells through the MHC class II molecules. However, nanoparticles act as reservoirs of antigens, can promote antigen uptake, and present antigen to CD8+ T cells with MHC class I molecules to induce cellular immunity. 51 , 52 In addition, costimulatory molecules such as CD40, CD80, and CD86 are necessary for all antigen presentations.
In this study, the isolated BMDCs were treated with the magnetic Fe3O4@Ca/MnCO3 nanoparticles and other controls for 24 h, and their expressions of OVA‐specific MHC I, MHC II, CD40, CD80, and CD86 molecules were analyzed. The results are shown in Figure 2a–f. The Fe3O4@Ca/MnCO3 + OVA groups (OVA was simply mixed with Fe3O4@Ca/MnCO3 nanoparticles) showed increased level of MHC and costimulatory molecules. However, the levels of MHC and costimulatory molecules in Fe3O4@Ca/MnCO3/OVA group (OVA was loaded by Fe3O4@Ca/MnCO3 nanoparticles) were significantly higher. It is worth noting that, application of magnetic fields can significantly increase the expression of OVA‐specific MHC I and CD86 molecules of Fe3O4@Ca/MnCO3/OVA group, the results indicate that the load of antigen on Fe3O4@Ca/MnCO3 nanoparticles and application of magnetic fields could promote antigen cross‐presentation, and further promote the proliferation of CD8+ T cells. To explore the mechanisms of magnetic nanoparticles to activate DCs, more data about their interaction with DCs were necessary.
FIGURE 2.
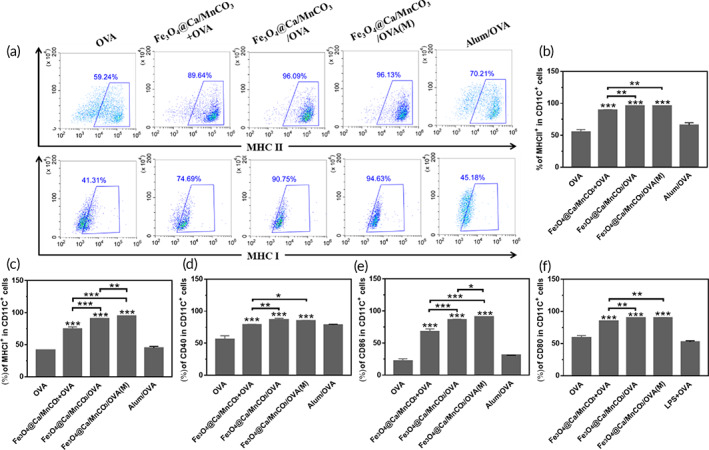
Maturation of bone marrow‐derived dendritic cells and antigen presentation induced by Fe3O4@Ca/MnCO3 nanoparticles. (a) Representative scatter plots of MHC II and MHC I, and the corresponding percentages of MHC II (b), MHC I (c), CD40 (d), CD86 (e), and CD80 (f) molecules expressed on CD11c+ DC cells. *p < 0.05, **p < 0.01, and ***p < 0.001
In addition, the levels of BMDC maturation and antigen presentation induced by Fe3O4/OVA and Fe3O4@Ca/MnCO3/OVA group were compared. The OVA loading amounts of Fe3O4 and Fe3O4@Ca/MnCO3 nanoparticles were 24 and 56 μg/mg, respectively. In order to ensure consistent OVA loading amount on Fe3O4 and Fe3O4@Ca/MnCO3 nanoparticles, we added 120 μg OVA into 5 mg of Fe3O4 or Fe3O4@Ca/MnCO3 suspension. Subsequently, Fe3O4 or Fe3O4@Ca/MnCO3 nanoparticles loaded with OVA were co‐cultured with BMDCs. The results are shown in Figure S3. The Fe3O4/OVA groups showed low level of expressions of MHC and costimulatory molecules. By contrast, the levels of MHC and costimulatory molecules in Fe3O4@Ca/MnCO3/OVA group were significantly higher. These results indicate that Ca/MnCO3 shell of Fe3O4@Ca/MnCO3/OVA group can significantly enhance antigen presentation and stimulate DC maturation, which will promote subsequent immune response.
3.4. Cellular uptake of the magnetic nanoparticles
Antigen uptakes are key steps for APCs' activation in the generation of potent immune responses. 53 The antigen delivery performance of Fe3O4@Ca/MnCO3 nanoparticles to DC2.4 and BMDCs was examined. As the CLSM (Figure 3a,b) images show, in comparison with the Cy5.5‐OVA alone and Fe3O4@Ca/MnCO3 + Cy5.5‐OVA groups, the Fe3O4@Ca/MnCO3/Cy5.5‐OVA containing groups significantly increased the antigen internalization into the lysosome, revealing that Fe3O4@Ca/MnCO3/OVA nanoparticles can deliver OVA to DCs more effectively after loading OVA. Moreover, the flow cytometry was used to evaluate whether Fe3O4@Ca/MnCO3/Cy5.5‐OVA nanoparticles can further enhance the delivery of OVA under magnetic field. As shown in Figure 3c,d, the Fe3O4@Ca/MnCO3 nanoparticles under magnetic field significantly increased the antigen internalization, which may be due to the fact that the magnetic field actively and rapidly pulls all magnetic particles into contact with cells. Surprisingly, the BMDC in Fe3O4@Ca/MnCO3/OVA group presented dendritic morphology (Figure 3e), which indicates that BMDCs were completely activated.
FIGURE 3.
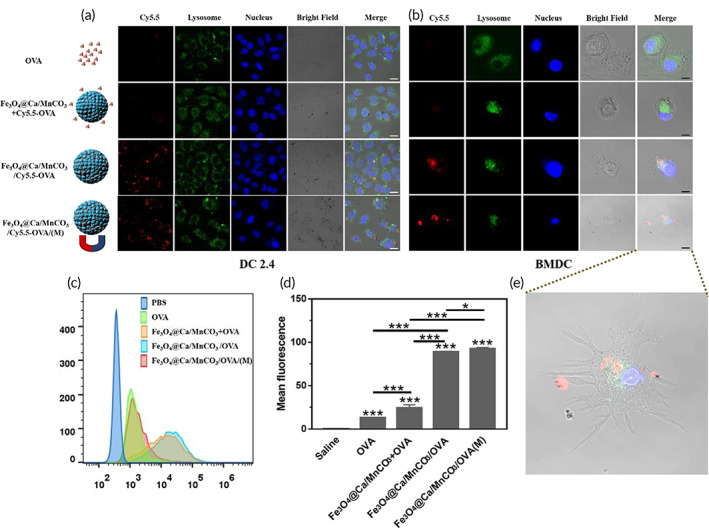
Uptake of antigen by DCs. Confocal laser scanning microscope images of DC2.4 (a) and bone marrow‐derived dendritic cells (BMDCs) (b) after incubation with vaccine formulations for 6 h, OVA labeled with Cy5.5 (red fluorescence), lysosome labeled with FITC (green fluorescence), and nucleus labeled with DAPI (blue fluorescence). White scar bar: 20 μm, Black scar bar: 10 μm. (c) The flow histograms of internalized Cy5.5‐OVA in each group, and (d) the corresponding statistical analysis. (e) The enlarged images of BMDC in Fe3O4@Ca/MnCO3/OVA(M). *p < 0.05, **p < 0.01, and ***p < 0.001
3.5. Intracellular degradation of the Fe3O4 @Ca/MnCO3 nanoparticles
The degradation of vaccine carriers with good biological safety in cytoplasm is critical to release antigens and adjuvants for subsequent antigen presentation. Thus, it is necessary to observe degradation of Fe3O4@Ca/MnCO3 nanoparticles in the cytoplasm of DCs. First, the toxicities of Fe3O4@Ca/MnCO3 nanoparticles to DCs under the presence or absence of the magnetic field were tested, as shown in Figure 4a, there is no obvious cytotoxicity when at the concentrations of Fe3O4@Ca/MnCO3 nanoparticles <2 mg/ml, indicating that Fe3O4@Ca/MnCO3 nanoparticles under presence or absence of a magnetic field had good safety. Subsequently, the morphology of Fe3O4@Ca/MnCO3 nanoparticles in DCs was observed with TEM, and the result is shown in Figure 4b. The Fe3O4@Ca/MnCO3 nanoparticles in DC2.4 were broken at 24 h. This suggests that the Fe3O4@Ca/MnCO3 nanoparticles dissolved in the weak acid environment of the lysosomes. Then, acridine orange dye was used to detect the lysosome integrity. Results (Figure 4c,d) show that the magnetic field will accelerate the rupture of lysosomes, which can promote the release of antigens into the cytoplasm.
FIGURE 4.
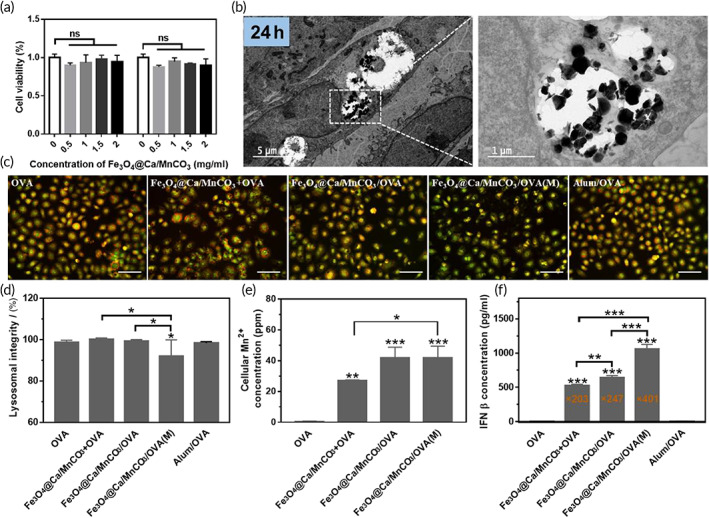
The degradation of Fe3O4@Ca/MnCO3 nanoparticles in the DCs. (a) The toxicity of the Fe3O4@Ca/MnCO3 nanoparticles to DC2.4 in the presence or absence of a magnetic field. (b) TEM observation of DC2.4 treated with Fe3O4@Ca/MnCO3 nanoparticles for 24 h. (c) Lysosomal integrity observation of DC2.4 exposed to vaccine preparations for 24 h, and (d) quantitative results of lysosomal integrity. Scar bar: 50 μm. (e) Intracellular Mn2+ level in DC2.4 after incubation with vaccine preparations for 24 h, and (f) the IFN‐β level in DCs after incubation with vaccine preparations for 24 h. *p < 0.05, **p < 0.01, and ***p < 0.001
In addition, intracellular Ca2+ and Mn2+ levels were determined to further confirm the degradation of the Fe3O4@Ca/MnCO3 nanoparticles in the lysosomes. As shown in Figure 4e, the intracellular Mn2+ level in the OVA alone group was very low, while the intracellular Mn2+ levels were significantly increased in the Fe3O4@Ca/MnCO3‐containing groups, further proving the degradation of Fe3O4@Ca/MnCO3 nanoparticles in lysosomes. Moreover, the intracellular Mn2+ can stimulate the production of the type I‐IFN, 23 and thereby increasing the effectiveness of the CD8+ T cell response. 54 IFN‐β is one kind of type I IFN and an important indicator of the STING pathway activation. We investigated whether Mn2+ produced by the degradation of intracellular Fe3O4@Ca/MnCO3 nanoparticles could activate the STING pathway in DCs. As shown in Figure 4f, the concentration of IFN‐β in Fe3O4@Ca/MnCO3‐containing groups was significantly higher than OVA alone groups. Among them, Fe3O4@Ca/MnCO3/OVA under magnetic field can significantly increase concentration of IFN‐β. The results indicate that Fe3O4@Ca/MnCO3 nanoparticles and magnetic field can activate the STING pathway. Overall, the concentration of IFN‐β in Fe3O4@Ca/MnCO3/OVA(M) group was the highest, which may be the reason for the highest expression of MHC I and CD86 in this group.
Subsequently, the intracellular Ca2+ was detected with the fluorescent dye Fluo‐4/AM. 55 As shown in Figure 5a,c, the intracellular Ca2+ level in the OVA alone and Alum/OVA groups was low, while the intracellular Ca2+ level was significantly increased in the Fe3O4@Ca/MnCO3‐containing groups, further proving the degradation of Fe3O4@Ca/MnCO3 in cytoplasm. Among them, the application of magnetic field lead to the highest level of intracellular Ca2+, which might be attributed to the largest amount of their internalization in lysosomes (Figure 3b,c). It is worth mentioning that, intracellular Ca2+ plays an important role in the induction or activation of autophagy, 25 which will be beneficial to antigen cross‐presentation. 56 In this study, MDCs staining was used to label the autophagic vacuoles of DCs induced by Fe3O4@Ca/MnCO3 nanoparticles, and the results are shown in Figure 5b,d. The OVA alone and Alum/OVA groups only had weak blue fluorescent, while strong blue fluorescence intensity (autophagic vacuoles) appeared in Fe3O4@Ca/MnCO3‐containing groups, indicating that the addition of Fe3O4@Ca/MnCO3 nanoparticles promoted the production of autophagosome. STING signaling pathway (by Mn2+) and autophagy (by Ca2+) can promote antigen cross‐presentation, which helps to produce cytotoxic T lymphocytes. Overall, the Fe3O4@Ca/MnCO3/OVA(M) group had the highest intracellular Ca2+ and Mn2+ levels, which may be attributed to the application of magnetic field increasing the amounts of magnetic nanoparticles entering DC.
FIGURE 5.
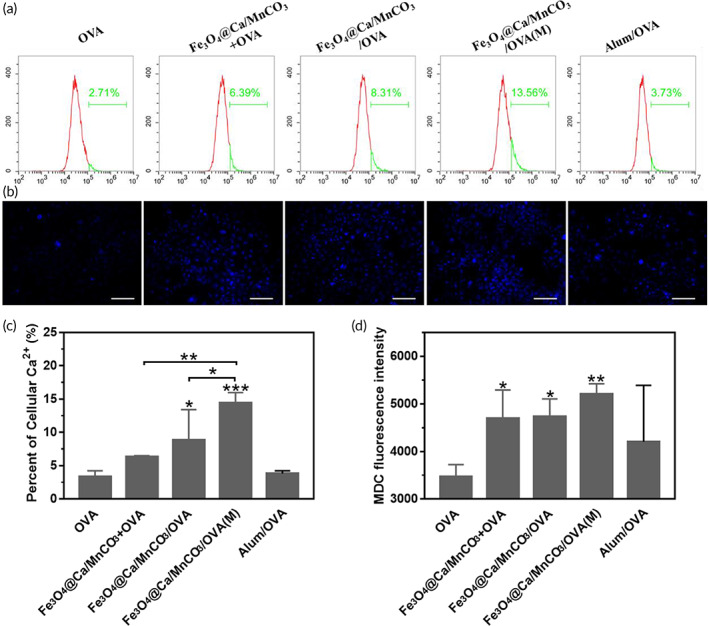
(a) Intracellular Ca2+ level and (c) quantitative results. (b) monodansylcadaverine staining images in DC2.4 after incubation with vaccine preparations for 24 h, and (d) the corresponding fluorescence intensity of MDC. Scar bar: 50 μm. *p < 0.05, **p < 0.01, and ***p < 0.001
3.6. Magnetic nanoparticles activated DC promote the proliferation and activation of CD8 + T lymphocytes in vitro
In view of the fact that magnetic nanoparticles could enhance antigen uptake, promote DCs activation, and enhance antigen cross‐presentation under a magnetic field, the Fe3O4@Ca/MnCO3 nanoparticles activated BMDCs were then incubated with naive splenocytes, and evaluated its function to stimulate CD8+ T cell proliferation and cytokine secretion in vitro. As shown in Figure 6a,b, The DCs activated by the Fe3O4@Ca/MnCO3 containing nanoparticles could significantly increase the proportion of CD8+ T cells in T cells, which will contribute to cellular immunity.
FIGURE 6.
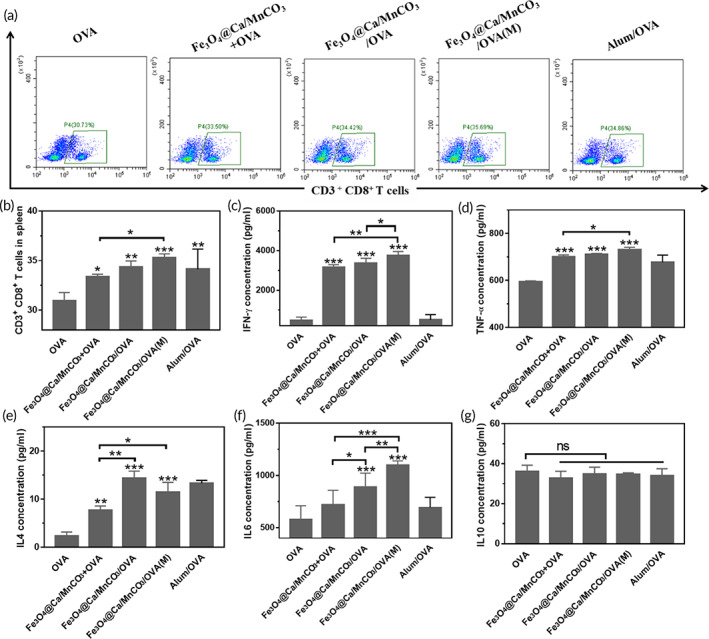
Bone marrow‐derived dendritic cells loaded with magnetic nanoparticles were co‐cultured with naive splenocytes for 48 h. (a, b) the ratio of CD8+ T cells in T cells, and the level of IFN‐γ (c), TNF‐α (d), IL‐4 (e), IL‐6 (f), and IL‐10 (g) secreted by T cells. *p < 0.05, **p < 0.01, and ***p < 0.001
Subsequently, the supernatant of the co‐culture of BMDCs and splenocytes was tested. IFN‐γ is an important cytokine to promote the production of antibody IgG2a and differentiation of CD8+ T cells into cytotoxic T lymphocyte (CTLs). 57 And TNF‐α is also highly related to anti‐tumor immunity. 58 , 59 IL‐6 can participate in the regulation of cellular and humoral immune responses. 60 , 61 IL‐4 can regulate the production of antibody IgG1 and promote humoral immunity. 62 IL‐10 is a master regulator of immunity to balance immune responses. 63 As shown in Figure 6c–f, the DCs activated by the magnetic nanoparticles would significantly activate T cells, express IFN‐γ, TNF‐α, and IL‐4. However, in comparison with Fe3O4@Ca/MnCO3 + OVA activated DCs, the Fe3O4@Ca/MnCO3/OVA activated DCs significantly increased the level of IL‐4 and IL‐6. Moreover, in comparison with Fe3O4@Ca/MnCO3/OVA activated DCs without magnetic field, the Fe3O4@Ca/MnCO3/OVA activated DCs with magnetic field significantly increased the level of IFN‐γ and IL‐6, while did not increase the level of IL‐4. In addition, the levels of IL‐10 secretion in each group were similar (Figure 6g), indicating that nanoparticles activated DCs would not trigger immunomodulatory effects to downregulate the expression of these anti‐tumor related cytokines. These results indicate that the magnetic nanoparticles can increase the secretion of cytokines and the application of magnetic field can promote secretion of cytokines that contribute to cellular immunity.
3.7. Antigen migration to peripheral immune organs
Activated DCs are more likely to migrate from the high endothelial venules of the lymph nodes to the lymph nodes. 64 Moreover, localization of DCs in the lymph nodes can induce T cell responses faster. 65 As shown in Figure 7a,c, in comparison with Cy5.5‐OVA‐actived DCs, the fluorescence intensities of lymph nodes in the Fe3O4@Ca/MnCO3/Cy5.5‐OVA activated DCs groups were obviously increased. Among them, the fluorescence intensity in the Fe3O4@Ca/MnCO3/OVA/(M) activated DCs group was the highest. In addition, it can be seen that the antigen‐loaded nanoparticle groups enlarged the sizes of lymph nodes and increased the number of lymphocytes (Figure 7b,d). Among them, Fe3O4@Ca/MnCO3/OVA/(M) activated DCs group had largest lymph nodes. These results indicate that after treatment with Fe3O4@Ca/MnCO3 and magnetic field, DCs can migrate more to lymph nodes and promote the proliferation of T lymphocytes.
FIGURE 7.
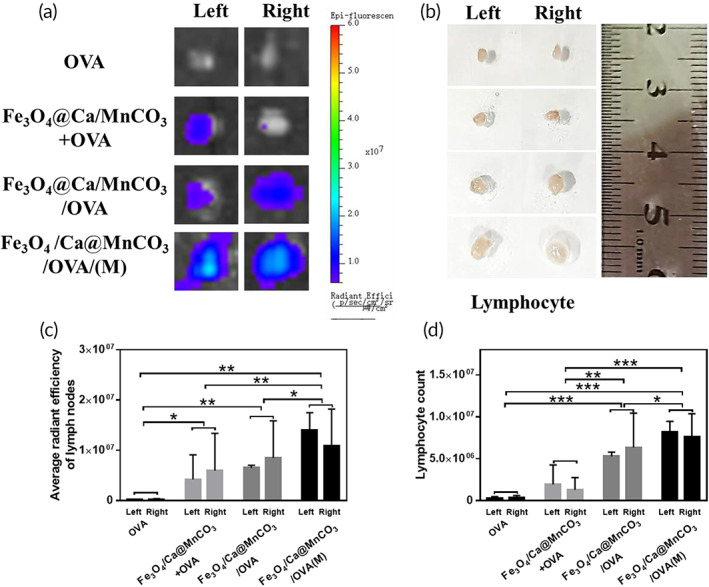
Observation of the migration of antigen taken up by bone marrow‐derived dendritic cell to lymph nodes. (a) Observation of Cy5.5‐OVA at lymph nodes from each group of mice, and (c) the corresponding average radiant efficiency. (b) Observation of sizes of lymph nodes from each group of mice, and (d) the corresponding count of lymph node cells. *p < 0.05, **p < 0.01, and ***p < 0.001
In addition, the immunohistochemical analysis was conducted to explore the ability of activated DCs to reach the peripheral immune organs and present antigen to T lymphocytes. To aim this, the mice were subcutaneously injected with activated DCs and their spleens and lymph nodes were collected for the immunohistochemical analysis on 2nd and 7th day. As shown in Figure 8, the OVA amount in the spleens and lymph nodes of all groups on 2nd day was lower than that of on 7th day. Compared with the OVA alone and Fe3O4@Ca/MnCO3 + OVA activated DCs groups, the OVA amount (brown area) in the Fe3O4@Ca/MnCO3/OVA activated DCs groups obviously increased on 2nd and 7th day. Among them, the OVA amount of the Fe3O4@Ca/MnCO3/OVA(M) activated DCs group was the highest. The above results also indicate that the DC activated by the magnetic nanoparticles and magnetic field facilitated the delivery of antigens and promoted the migration of DCs to peripheral immune organs.
FIGURE 8.
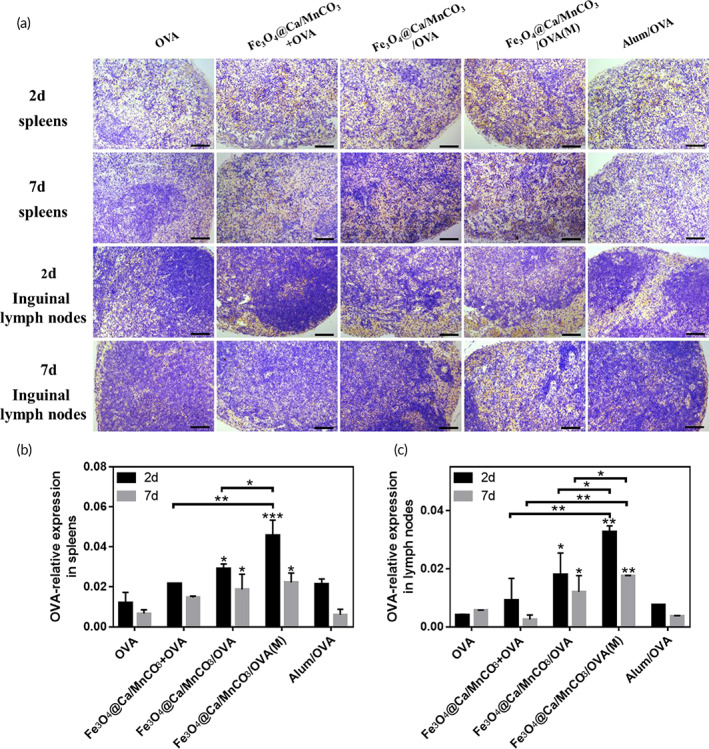
(a) Immunohistochemical images of the spleens and lymph nodes of immunized mice, OVA is represented in yellow areas, scar bar: 100 μm, and the corresponding statistical results of spleens (b) and lymph nodes (c). *p < 0.05, **p < 0.01, and ***p < 0.001
3.8. DC vaccine induces an effective immune response in vivo
Antibody titer is a key indicator of the level of humoral and cellular immunity. The OVA‐specific antibody titers in the sera of the immunized mice were measured by ELISA. As shown in Figure 9a–c, in comparison with OVA alone, Alum/OVA, and Fe3O4@Ca/MnCO3 + OVA activated DCs, the antibody titers of the Fe3O4@Ca/MnCO3/OVA activated DCs significantly increased, which indicates that Fe3O4@Ca/MnCO3/OVA activated DCs can enhance the immune response. It is worth noting that, the level of IgG1 and IgG2a induced by Fe3O4@Ca/MnCO3/OVA(M) activated DCs was significantly higher than that of Fe3O4@Ca/MnCO3/OVA activated DCs, while the level of IgG1 of them was basically the same (Figure 9b). These results show that Fe3O4@Ca/MnCO3 loaded with antigen can effectively increase the production of antibodies induced by DC vaccine and the application of magnetic field can further enhance the production of antibodies related to cellular immunity induced by DC vaccine. This may be attributed to the magnetic field promoting the entry of magnetic nanoparticles into DCs and subsequently enhancing the cross presentation of antigens.
FIGURE 9.
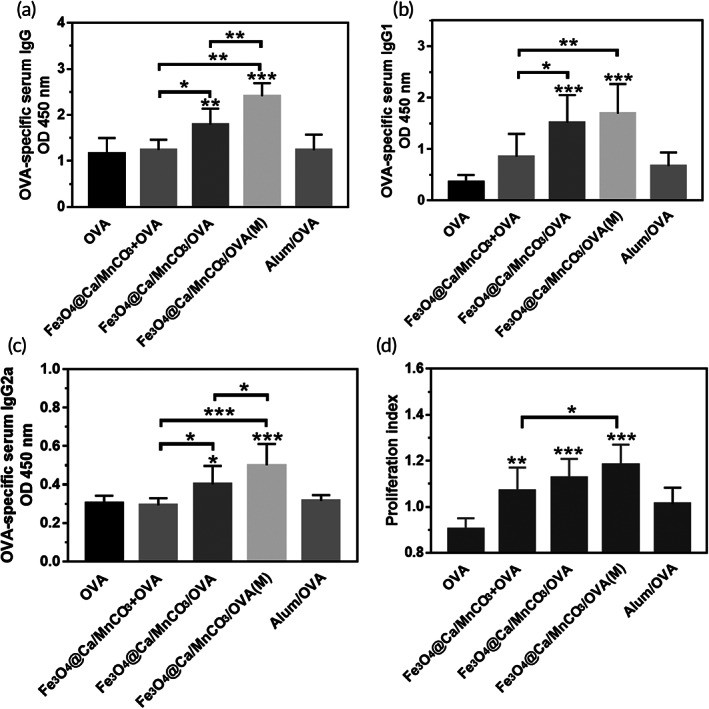
The mice immunized with each dendritic cell vaccine. Serum OVA specific IgG (a), IgG1 (b) and IgG2a (c) titer detected by ELISA. (d) Splenocytes proliferation detected by CCK‐8 kit. *p < 0.05, **p < 0.01, and ***p < 0.001
Subsequently, the immunological evaluation of Fe3O4/OVA or Fe3O4@Ca/MnCO3/OVA nanoparticles activated DCs was carried out in vivo. The OVA‐specific antibody titers in the sera of the immunized mice were measured. As shown in Figure S4, in comparison with Fe3O4/OVA activated DCs, the IgG, IgG1, and IgG2a antibody titers of the Fe3O4@Ca/MnCO3/OVA activated DCs significantly increased, which indicates that Ca/MnCO3 shell can enhance the humoral and cellular immune response.
The spleens contain a variety of immune cells, which play important roles in immune responses. 66 When exposed to the same antigen again, the cells will proliferate rapidly and the T cells will produce fast and effective immune responses. 67 Subsequently, the splenocytes proliferation of the immunized mice was evaluated to initially assess the level of immune memory. The results are shown in Figure 9d, in comparison with the OVA alone and Alum/OVA activated DCs, the splenocyte PI of the Fe3O4@Ca/MnCO3 containing groups activated DCs increased. Among them, the splenocyte PI of the Fe3O4@Ca/MnCO3/OVA(M) activated DCs was the highest. It demonstrates that DC activated with magnetic nanoparticles and magnetic field can promote the proliferation of splenocytes and causes a stronger immune response to re‐exposed antigens.
Then, the proportion of CD8+ T cell in splenocytes and the cytokine secretion level was measured, as shown in Figure 10a,b, the DCs activated by magnetic nanoparticles could significantly increase the proportion of CD8+ T cells, and Fe3O4@Ca/MnCO3/OVA(M) activated DCs had highest level of CD8+ T cells. Meanwhile, the proportion of CD8+ T cell in splenocytes and lymphocytes was measured, as shown in Figure S5. Fe3O4/OVA activated DCs basically did not promote the proliferation of CD8+ T cells, while the Fe3O4@Ca/MnCO3/OVA activated DCs could significantly increase the proportion of CD8+ T cells. This indicates that the application of Ca/MnCO3 shell is more conducive to increase the proportion of CD8+ T cells. Subsequently, the supernatant splenocytes were tested, as shown in Figure 10c–f, the DCs activated by Fe3O4@Ca/MnCO3/OVA significantly increased cytokine secretion. Among them, Fe3O4@Ca/MnCO3/OVA(M) activated DCs had highest level of TNF‐α and IL‐6. While the levels of IL‐4 in the Fe3O4@Ca/MnCO3/OVA activated DCs were basically the same as those in the Fe3O4@Ca/MnCO3/OVA(M) activated DCs. This indicates that the application of magnetic field is more conducive for Fe3O4@Ca/MnCO3/OVA activated DCs to induce cellular immune responses. These are consistent with the results of in vitro co‐incubation (Figure 6c–f).
FIGURE 10.
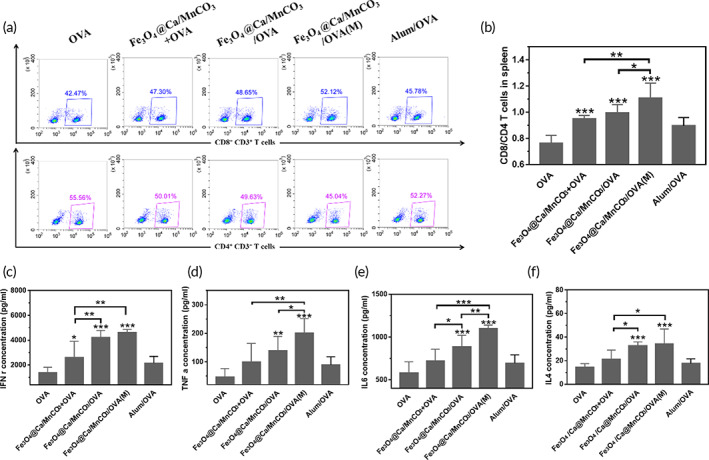
Stimulation and specificity of T cell responses. (a, b) The ratio of CD8+/CD4+ T cells in T cells, and the level of IFN‐γ (c), TNF‐α (d), IL‐6 (e), and IL‐4 (f) secreted by T cells. *p < 0.05, **p < 0.01, and ***p < 0.001
Formation of immune memory T cells is the most important characteristic of vaccination, which plays a key role in immune surveillance by rapidly and potently responding to the re‐exposed antigens. 68 Memory T cells can be divided into two subgroups, namely, effector memory T cells (TEM cells, CD44high CD62Llow) and central memory T cells (TCM cells, CD44high CD62Lhigh). 69 Here, the percentage of TEM cells among the splenocytes was detected. As shown in Figure 11, the DCs activated by Fe3O4@Ca/MnCO3/OVA(M) could significantly increase the percentages of CD8+ TEM and CD4+ TEM cells, which indicates that the application of magnetic field and magnetic nanoparticles can help DCs induce the generation of CD8+ TEM and CD4+ TEM, which can make an immune response instantaneously when antigens invade again.
FIGURE 11.
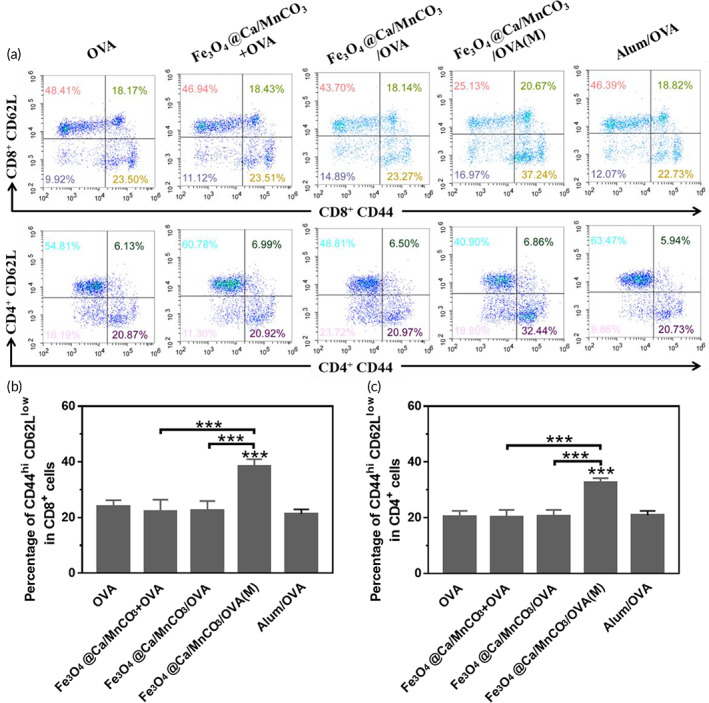
The percentages of CD44hi CD62low cells in CD4+ T and CD8+ T cells of splenocytes. *p < 0.05, **p < 0.01, and ***p < 0.001
Finally, the bio‐safety of the DC vaccine in vivo is critical to their clinical applications. On the 7th day after the last immunization, the heart, liver, spleen, lung, and kidney of the immunized mice were collected to evaluate the histopathological toxicity of the vaccine formulations. As shown in Figure 12, all the organs did not show obvious pathological changes, indicating that DC vaccine had excellent biological safety.
FIGURE 12.
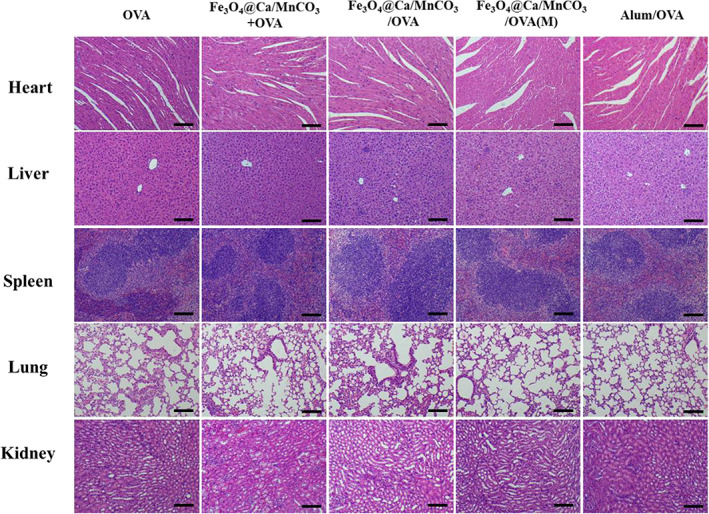
HE staining images of heart, liver, spleen, lung, and kidney sections. Scar bar: 100 μm
4. CONCLUSION
In conclusion, Fe3O4@Ca/MnCO3 magnetic nanoparticles can improve antigen cross presentation and cellular immunity. Due to the fact that the magnetic field actively pulled the magnetic nanoparticles to contact the cells, the Fe3O4@Ca/MnCO3 promoted internalization of antigen. Fe3O4@Ca/MnCO3 nanoparticles in the cell slowly degrade, release Mn2+, Ca2+ and antigens, increase IFN‐β concentration and autophagy, effectively activate DCs, and promote antigens cross‐presentation. Moreover, DCs activated by magnetic nanoparticles can enter lymph nodes to activate CD8+ T cells after immunization, and produce higher levels of antibodies. In comparison with traditional DC vaccine, cytoplasmic antigen delivery with the magnetic nanoparticles provides a new idea for the construction of novel DC vaccines.
AUTHOR CONTRIBUTIONS
Linghong Huang: Methodology; investigation; data curation; formal analysis; writing – original draft. Zonghua Liu: Funding acquisition; investigation; writing – review and editing. Chongjie Wu: Methodology and investigation. Jiansheng Lin: Investigation; conceptualization; writing – review and editing. Ning Liu: Writing – original draft; formal analysis; project administration; funding acquisition.
CONFLICT OF INTEREST
The authors declare that they have no competing financial interests or personal relationships that could have appeared to influence the work reported in this paper.
5.
PEER REVIEW
The peer review history for this article is available at https://publons.com/publon/10.1002/btm2.10400.
Supporting information
Appendix S1 Supporting Information.
ACKNOWLEDGMENTS
This work was supported by the Science and Technology Program of Guangzhou, China (Grant no. 202103030004) and the Excellent youth funding of Hunan Provincial Education Department (Grant no. 21B0367).
Huang L, Liu Z, Wu C, Lin J, Liu N. Magnetic nanoparticles enhance the cellular immune response of dendritic cell tumor vaccines by realizing the cytoplasmic delivery of tumor antigens. Bioeng Transl Med. 2023;8(2):e10400. doi: 10.1002/btm2.10400
Funding information Excellent youth funding of Hunan Provincial Education Department, Grant/Award Number: 21B0367; the Science and Technology Program of Guangzhou, Grant/Award Number: 202103030004
Contributor Information
Jiansheng Lin, Email: linjiansheng1020@163.com.
Ning Liu, Email: liuning@163.com.
DATA AVAILABILITY STATEMENT
The data that support the findings of this study are available from the corresponding author.
REFERENCES
- 1. Liu J, Fu M, Wang M, Wan D, Wei Y, Wei X. Cancer vaccines as promising immuno‐therapeutics: platforms and current progress. J Hematol Oncol. 2022;15(1):28. [DOI] [PMC free article] [PubMed] [Google Scholar]
- 2. Saxena M, Van Der Burg SH, Melief CJM, Bhardwaj N. Therapeutic cancer vaccines. Nat Rev Cancer. 2021;21(6):360‐378. [DOI] [PubMed] [Google Scholar]
- 3. Gao S, Yang XY, Xu JK, Qiu N, Zhai G. Nanotechnology for boosting cancer immunotherapy and remodeling tumor microenvironment: the horizons in cancer treatment. ACS Nano. 2021;15(8):12567‐12603. [DOI] [PubMed] [Google Scholar]
- 4. Reed SG, Orr MT, Fox CB. Key roles of adjuvants in modern vaccines. Nat Med. 2013;19(12):1597‐1608. [DOI] [PubMed] [Google Scholar]
- 5. Neek M, Kim TI, Wang SW. Protein‐based nanoparticles in cancer vaccine development. Nanomedicine. 2018;15(1):164‐174. [DOI] [PMC free article] [PubMed] [Google Scholar]
- 6. Rosenberg SA, Yang JC, Restifo NP. Cancer immunotherapy: moving beyond current vaccines. Nat Med. 2004;10(9):909‐915. [DOI] [PMC free article] [PubMed] [Google Scholar]
- 7. Santos PM, Butterfield LH. Dendritic cell‐based cancer vaccines. J Immunol. 2018;200(2):443‐449. [DOI] [PMC free article] [PubMed] [Google Scholar]
- 8. Rosenblatt J, Avivi I, Vasir B, et al. Vaccination with dendritic cell/tumor fusions following autologous stem cell transplant induces immunologic and clinical responses in multiple myeloma patients. Clin Cancer Res. 2013;19(13):3640‐3648. [DOI] [PMC free article] [PubMed] [Google Scholar]
- 9. Kantoff PW, Higano CS, Shore ND, et al. Sipuleucel‐T immunotherapy for castration‐resistant prostate cancer. N Engl J Med. 2010;363(5):411‐422. [DOI] [PubMed] [Google Scholar]
- 10. Engell‐Noerregaard L, Hansen TH, Andersen MH, Thor Straten P, Svane IM. Review of clinical studies on dendritic cell‐based vaccination of patients with malignant melanoma: assessment of correlation between clinical response and vaccine parameters. Cancer Immunol Immunother. 2009;58(1):1‐14. [DOI] [PMC free article] [PubMed] [Google Scholar]
- 11. Draube A, Klein‐González N, Mattheus S, et al. Dendritic cell based tumor vaccination in prostate and renal cell cancer: a systematic review and meta‐analysis. PLoS One. 2011;6(4):e18801. [DOI] [PMC free article] [PubMed] [Google Scholar]
- 12. Sabado RL, Balan S, Bhardwaj N. Dendritic cell‐based immunotherapy. Curr Top Microbiol Immunol. 2003;25(5–6):377‐413. [Google Scholar]
- 13. Verdijk P, Aarntzen EHJG, Lesterhuis WJ, et al. Limited amounts of dendritic cells migrate into the T‐cell area of lymph nodes but have high immune activating potential in melanoma patients. Clin Cancer Res. 2009;15(7):2531‐2540. [DOI] [PubMed] [Google Scholar]
- 14. Lee AW, Truong T, Bickham K, et al. A clinical grade cocktail of cytokines and PGE2 results in uniform maturation of human monocyte‐derived dendritic cells: implications for immunotherapy. Vaccine. 2002;20(Suppl 4):A8‐A22. [DOI] [PubMed] [Google Scholar]
- 15. Kikuchi T, Akasaki Y, Irie M, Homma S, Abe T, Ohno T. Results of a phase I clinical trial of vaccination of glioma patients with fusions of dendritic and glioma cells. Cancer Immunol Immunother. 2001;50(7):337‐344. [DOI] [PMC free article] [PubMed] [Google Scholar]
- 16. Subramanya S, Armant M, Salkowitz JR, et al. Enhanced induction of HIV‐specific cytotoxic T lymphocytes by dendritic cell‐targeted delivery of SOCS‐1 siRNA. Mol Ther. 2010;18(11):2028‐2037. [DOI] [PMC free article] [PubMed] [Google Scholar]
- 17. Ma DY, Clark EA. The role of CD40 and CD154/CD40L in dendritic cells. Semin Immunol. 2009;21(5):265‐272. [DOI] [PMC free article] [PubMed] [Google Scholar]
- 18. Strobel I, Berchtold S, Götze A, Schulze U, Schuler G, Steinkasserer A. Human dendritic cells transfected with either RNA or DNA encoding influenza matrix protein M1 differ in their ability to stimulate cytotoxic T lymphocytes. Gene Ther. 2000;7(23):2028‐2035. [DOI] [PubMed] [Google Scholar]
- 19. Yan L, Amirshaghaghi A, Huang D, et al. Protoporphyrin IX (PpIX)‐coated superparamagnetic iron oxide nanoparticle (SPION) nanoclusters for magnetic resonance imaging and photodynamic therapy. Adv Funct Mater. 2018;28(16):1707030. [DOI] [PMC free article] [PubMed] [Google Scholar]
- 20. Shubayev VI, Pisanic Ii TR, Jin S. Magnetic nanoparticles for theragnostics. Adv Drug Deliv Rev. 2009;61(6):467‐477. [DOI] [PMC free article] [PubMed] [Google Scholar]
- 21. Kianfar E. Magnetic nanoparticles in targeted drug delivery: a review. J Supercond Novel Magn. 2021;34(7):1709‐1735. [Google Scholar]
- 22. Chiang C‐S, Lin Y‐J, Lee R, et al. Combination of fucoidan‐based magnetic nanoparticles and immunomodulators enhances tumour‐localized immunotherapy. Nat Nanotechnol. 2018;13(8):746‐754. [DOI] [PubMed] [Google Scholar]
- 23. Wang C, Guan Y, Lv M, et al. Manganese increases the sensitivity of the cGAS‐STING pathway for double‐stranded DNA and is required for the host defense against DNA viruses. Immunity. 2018;48(4):675‐687. [DOI] [PubMed] [Google Scholar]
- 24. Lv M, Chen M, Zhang R, et al. Manganese is critical for antitumor immune responses via cGAS‐STING and improves the efficacy of clinical immunotherapy. Cell Res. 2020;30(11):966‐979. [DOI] [PMC free article] [PubMed] [Google Scholar]
- 25. Hu Y‐X, Han X‐S, Jing Q. Ca(2+) ion and autophagy. Adv Exp Med Biol. 2019;1206:151‐166. [DOI] [PubMed] [Google Scholar]
- 26. Huang F, Chen J‐Y, Ouyang J‐M. Comparison of the inhibition of high phosphate‐induced smooth muscle cell calcification by Porphyra yezoensis and Astragalus polysaccharides. J Funct Foods. 2020;73:104160. [Google Scholar]
- 27. Wang S, Ni D, Yue H, et al. Exploration of antigen induced CaCO3 nanoparticles for therapeutic vaccine. Small. 2018;14(14):1704272. [DOI] [PubMed] [Google Scholar]
- 28. Lin Y, Wang X, Huang X, Zhang J, Xia N, Zhao Q. Calcium phosphate nanoparticles as a new generation vaccine adjuvant. Expert Rev Vaccines. 2017;16(9):895‐906. [DOI] [PubMed] [Google Scholar]
- 29. Sun B, Zhao X, Gu W, et al. ATP stabilised and sensitised calcium phosphate nanoparticles as effective adjuvants for a DNA vaccine against cancer. J Mater Chem B. 2021;9(36):7435‐7446. [DOI] [PubMed] [Google Scholar]
- 30. Pele LC, Haas CT, Hewitt RE, et al. Synthetic mimetics of the endogenous gastrointestinal nanomineral: silent constructs that trap macromolecules for intracellular delivery. Nanomedicine. 2017;13(2):619‐630. [DOI] [PMC free article] [PubMed] [Google Scholar]
- 31. Jia J, Liu Q, Yang T, Wang L, Ma G. Facile fabrication of varisized calcium carbonate microspheres as vaccine adjuvants. J Mater Chem B. 2017;5(8):1611‐1623. [DOI] [PubMed] [Google Scholar]
- 32. Chen Q, Wang C, Zhang X, et al. In situ sprayed bioresponsive immunotherapeutic gel for post‐surgical cancer treatment. Nat Nanotechnol. 2019;14(1):89‐97. [DOI] [PubMed] [Google Scholar]
- 33. Chen C, Tong Y, Zheng Y, et al. Cytosolic delivery of thiolated Mn‐cGAMP nanovaccine to enhance the antitumor immune responses. Small. 2021;17(17):2006970. [DOI] [PubMed] [Google Scholar]
- 34. Sun X, Zhang Y, Li J, et al. Amplifying STING activation by cyclic dinucleotide–manganese particles for local and systemic cancer metalloimmunotherapy. Nat Nanotechnol. 2021;16(11):1260‐1270. [DOI] [PMC free article] [PubMed] [Google Scholar]
- 35. Zhou B, Wu Q, Wang M, et al. Immunologically modified MnFe2O4 nanoparticles to synergize photothermal therapy and immunotherapy for cancer treatment. Chem Eng J. 2020;396:125239. [DOI] [PMC free article] [PubMed] [Google Scholar]
- 36. Ebrahiminezhad A, Ghasemi Y, Rasoul‐Amini S, Barar J, Davaran S. Impact of amino‐acid coating on the synthesis and characteristics of iron‐oxide nanoparticles (IONs). Bull Korean Chem Soc. 2012;33(12):3957‐3962. [Google Scholar]
- 37. Ghasemzadeh MA, Abdollahi‐Basir MH. Fe3O4@SiO2‐NH2 nanocomposite as a robust and effective catalyst for the one‐pot synthesis of polysubstituted dihydropyridines. Acta Chim Slov. 2016;63(3):627‐637. [DOI] [PubMed] [Google Scholar]
- 38. Stoica‐Guzun A, Stroescu M, Jinga SI, Jipa IM, Dobre T. Microwave assisted synthesis of bacterial cellulose‐calcium carbonate composites. Indus Crops Prod. 2013;50:414‐422. [Google Scholar]
- 39. Esmaeili N, Mohammadi P, Abbaszadeh M, Sheibani H. Au nanoparticles decorated on magnetic nanocomposite (GO‐Fe3O4/Dop/Au) as a recoverable catalyst for degradation of methylene blue and methyl orange in water. Int J Hydrogen Energy. 2019;44(41):23002‐23009. [Google Scholar]
- 40. Lu HC, Yi GS, Zhao SY, Chen D, Guo L‐H, Cheng J. Synthesis and characterization of multi‐functional nanoparticles possessing magnetic, up‐conversion fluorescence and bio‐affinity properties. J Mater Chem. 2004;14(8):1336‐1341. [Google Scholar]
- 41. Tartaj P, Serna CJ. Synthesis of monodisperse superparamagnetic Fe/silica nanospherical composites. J Am Chem Soc. 2003;125(51):15754‐15755. [DOI] [PubMed] [Google Scholar]
- 42. Shi D, Yang H, Ji S, Jiang S, Liu X, Zhang D. Preparation and characterization of core–shell structure Fe3O4@C magnetic nanoparticles. Procedia Eng. 2014;102:1555‐1562. [Google Scholar]
- 43. Zhang X‐Q, Dahle CE, Baman NK, Rich N, Weiner GJ, Salem AK. Potent antigen‐specific immune responses stimulated by codelivery of CpG ODN and antigens in degradable microparticles. J Immunother. 2007;30(5):469‐478. [DOI] [PubMed] [Google Scholar]
- 44. Xiong W, Ren C, Li J, Li B. Enhancing the photostability and bioaccessibility of resveratrol using ovalbumin–carboxymethylcellulose nanocomplexes and nanoparticles. Food Funct. 2018;9(7):3788‐3797. [DOI] [PubMed] [Google Scholar]
- 45. Liu L, Ma P, Wang H, et al. Immune responses to vaccines delivered by encapsulation into and/or adsorption onto cationic lipid‐PLGA hybrid nanoparticles. J Control Release. 2016;225:230‐239. [DOI] [PubMed] [Google Scholar]
- 46. Heffernan MJ, Kasturi SP, Yang SC, Pulendran B, Murthy N. The stimulation of CD8+ T cells by dendritic cells pulsed with polyketal microparticles containing ion‐paired protein antigen and poly (inosinic acid)–poly (cytidylic acid). Biomaterials. 2009;30(5):910‐918. [DOI] [PMC free article] [PubMed] [Google Scholar]
- 47. Geary SM, Hu Q, Joshi VB, Bowden NB, Salem AK. Diaminosulfide based polymer microparticles as cancer vaccine delivery systems. J Control Release. 2015;220:682‐690. [DOI] [PMC free article] [PubMed] [Google Scholar]
- 48. Lu Y, Yang Y, Gu Z, et al. Glutathione‐depletion mesoporous organosilica nanoparticles as a self‐adjuvant and co‐delivery platform for enhanced cancer immunotherapy. Biomaterials. 2018;175:82‐92. [DOI] [PubMed] [Google Scholar]
- 49. Song C, Noh Y‐W, Lim YT. Polymer nanoparticles for cross‐presentation of exogenous antigens and enhanced cytotoxic T‐lymphocyte immune response. Int J Nanomed. 2016;11:3753‐3764. [DOI] [PMC free article] [PubMed] [Google Scholar]
- 50. Neundorf I, Rennert R, Franke J, Közle I, Bergmann R. Detailed analysis concerning the biodistribution and metabolism of human calcitonin‐derived cell‐penetrating peptides. Bioconjug Chem. 2008;19(8):1596‐1603. [DOI] [PubMed] [Google Scholar]
- 51. Fan Q, Ma Q, Bai J, et al. An implantable blood clot‐based immune niche for enhanced cancer vaccination. Sci Adv. 2020;6(39):eabb4639. [DOI] [PMC free article] [PubMed] [Google Scholar]
- 52. Han X, Shen S, Fan Q, et al. Red blood cell‐derived nanoerythrosome for antigen delivery with enhanced cancer immunotherapy. Sci Adv. 2019;5(10):eaaw6870. [DOI] [PMC free article] [PubMed] [Google Scholar]
- 53. Paulis LE, Mandal S, Kreutz M, Figdor CG. Dendritic cell‐based nanovaccines for cancer immunotherapy. Curr Opin Immunol. 2013;25(3):389‐395. [DOI] [PubMed] [Google Scholar]
- 54. Zitvogel L, Galluzzi L, Kepp O, Smyth MJ, Kroemer G. Type I interferons in anticancer immunity. Nat Rev Immunol. 2015;15(7):405‐414. [DOI] [PubMed] [Google Scholar]
- 55. Rizaner N, Onkal R, Fraser SP, Pristerá A, Okuse K, Djamgoz MBA. Intracellular calcium oscillations in strongly metastatic human breast and prostate cancer cells: control by voltage‐gated sodium channel activity. Eur Biophys J. 2016;45(7):735‐748. [DOI] [PubMed] [Google Scholar]
- 56. Ho NI, Camps MGM, Verdoes M, Münz C, Ossendorp F. Autophagy regulates long‐term cross‐presentation by murine dendritic cells. Eur J Immunol. 2021;51(4):835‐847. [DOI] [PMC free article] [PubMed] [Google Scholar]
- 57. Karmakar P, Lee K, Sarkar S, Wall KA, Sucheck SJ. Synthesis of a liposomal MUC1 glycopeptide‐based immunotherapeutic and evaluation of the effect of L‐rhamnose targeting on cellular immune responses. Bioconjug Chem. 2016;27(1):110‐120. [DOI] [PMC free article] [PubMed] [Google Scholar]
- 58. Yang R, Xu J, Xu L, et al. Cancer cell membrane‐coated adjuvant nanoparticles with mannose modification for effective anticancer vaccination. ACS Nano. 2018;12(6):5121‐5129. [DOI] [PubMed] [Google Scholar]
- 59. Calzascia T, Pellegrini M, Hall H, et al. TNF‐α is critical for antitumor but not antiviral T cell immunity in mice. J Clin Invest. 2007;117(12):3833‐3845. [DOI] [PMC free article] [PubMed] [Google Scholar]
- 60. Cui A‐H, Zhao J, Liu S‐X, Hao YS. Associations of IL‐4, IL‐6, and IL‐12 levels in peripheral blood with lung function, cellular immune function, and quality of life in children with moderate‐to‐severe asthma. Medicine. 2017;96(12):e6265. [DOI] [PMC free article] [PubMed] [Google Scholar]
- 61. Okada M, Kitahara M, Kishimoto S, Matsuda T, Hirano T, Kishimoto T. IL‐6/BSF‐2 functions as a killer helper factor in the in vitro induction of cytotoxic T cells. J Immunol. 1988;141(5):1543‐1549. [PubMed] [Google Scholar]
- 62. Luo Z, Wu Q, Yang C, et al. A powerful CD8+ T‐cell stimulating D‐tetra‐peptide hydrogel as a very promising vaccine adjuvant. Adv Mater. 2017;29(5):1601776. [DOI] [PubMed] [Google Scholar]
- 63. Couper KN, Blount DG, Riley EM. IL‐10: the master regulator of immunity to infection. J Immunol. 2008;180(9):5771‐5777. [DOI] [PubMed] [Google Scholar]
- 64. Roberts EW, Broz ML, Binnewies M, et al. Critical role for CD103+/CD141+ dendritic cells bearing CCR7 for tumor antigen trafficking and priming of T cell immunity in melanoma. Cancer Cell. 2016;30(2):324‐336. [DOI] [PMC free article] [PubMed] [Google Scholar]
- 65. Gerner MY, Torabi‐Parizi P, Germain RN. Strategically localized dendritic cells promote rapid T cell responses to lymph‐borne particulate antigens. Immunity. 2015;42(1):172‐185. [DOI] [PubMed] [Google Scholar]
- 66. Jennette JC, Xiao H, Falk RJ. Pathogenesis of vascular inflammation by anti‐neutrophil cytoplasmic antibodies. J Am Soc Nephrol. 2006;17(5):1235‐1242. [DOI] [PubMed] [Google Scholar]
- 67. Zhang Y, Wang F, Ju E, et al. Metal‐organic‐framework‐based vaccine platforms for enhanced systemic immune and memory response. Adv Funct Mater. 2016;26(35):6454‐6461. [Google Scholar]
- 68. Ahmed R, Gray D. Immunological memory and protective immunity: understanding their relation. Science. 1996;272(5258):54‐60. [DOI] [PubMed] [Google Scholar]
- 69. Sahu R, Dixit S, Verma R, et al. A nanovaccine formulation of Chlamydia recombinant MOMP encapsulated in PLGA 85: 15 nanoparticles augments CD4+ effector (CD44high CD62Llow) and memory (CD44high CD62Lhigh) T‐cells in immunized mice. Nanomed Nanotechnol Biol Med. 2020;29:102257. [DOI] [PMC free article] [PubMed] [Google Scholar]
Associated Data
This section collects any data citations, data availability statements, or supplementary materials included in this article.
Supplementary Materials
Appendix S1 Supporting Information.
Data Availability Statement
The data that support the findings of this study are available from the corresponding author.


