

Abstract
Whole‐body physiologically‐based pharmacokinetic (PBPK) models have many applications in drug research and development. It is often necessary to inform these models with animal or clinical data, updating model parameters, and making the model more predictive for future applications. This provides an opportunity and a challenge given the large number of parameters of such models. The aim of this work was to propose new mechanistic model structures with reduced complexity allowing for parameter optimization. These models were evaluated for their ability to estimate realistic values for unbound tissue to plasma partition coefficients (Kpu) and simulate observed pharmacokinetic (PK) data. Two approaches are presented: using either established kinetic lumping methods based on tissue time constants (drug‐dependent) or a novel clustering analysis to identify tissues sharing common Kpu values or Kpu scalars based on similarities of tissue composition (drug‐independent). PBPK models derived from these approaches were assessed using PK data of diazepam in rats and humans. Although the clustering analysis produced minor differences in tissue grouping depending on the method used, two larger groups of tissues emerged. One including the kidneys, liver, spleen, gut, heart, and lungs, and another including bone, brain, muscle, and pancreas whereas adipose and skin were generally considered distinct. Overall, a subdivision into four tissue groups appeared most physiologically relevant in terms of tissue composition. Several models were found to have similar abilities to describe diazepam i.v. data as empirical models. Comparability of estimated Kpus to experimental Kpu values for diazepam was one criterion for selecting the appropriate PK model structure.
Study Highlights.
WHAT IS THE CURRENT KNOWLEDGE ON THE TOPIC?
Empirical models are frequently used to describe pharmacokinetic (PK) data but may have limited predictive utility (lack of physiological mechanisms). Whole‐body physiologically‐based PK (PBPK) models are particularly suited to integrate knowledge of different origins (e.g., in silico, in vitro, and in vivo) in a physiologically relevant framework. However, model fitting and parameter estimation are challenging.
WHAT QUESTION DID THIS STUDY ADDRESS?
Can a novel, drug‐independent approach based on tissue‐composition be used to simplify PBPK models without reducing their kinetic structure? Can these models be used for parameter estimation purposes?
WHAT DOES THIS STUDY ADD TO OUR KNOWLEDGE?
Clustering of tissues based on their similarity allows tissue aggregation a priori without modifying PBPK models' kinetic structure. For diazepam, these mechanistic models were overall found equally suitable for describing i.v. data as empirical models and are likely more suitable for PK translation. Additionally, they produced biologically plausible unbound tissue to plasma partition coefficients estimates.
HOW MIGHT THIS CHANGE DRUG DISCOVERY, DEVELOPMENT, AND/OR THERAPEUTICS?
Simplified PBPK models enable more frequent use of PBPK models for parameter estimation and subsequent predictive applications.
INTRODUCTION
Physiologically‐based pharmacokinetic (PBPK) modeling provides a powerful tool for integrating preclinical and in vitro data in a model for human pharmacokinetic (PK) predictions. 1 , 2 , 3 Although PBPK models become more and more informed as knowledge about the drug and system increases, numerous and often untested assumptions are inherent to these models. When observed PK data become available, certain PBPK model parameters can be optimized by combining the bottom‐up and top‐down approaches. 4 Yet, the high dimensionality and complexity of PBPK models, as well as the limited data available (e.g., plasma or blood observations only and generally relatively sparse sampling) may limit the simultaneous estimation of a large number of parameters due to computational and numerical issues and some kinetic processes may be missed as they unfold too rapidly or have little influence on the plasma profiles. To stabilize PBPK model parameter estimation, many parameters are fixed to typical values and only a few selected are estimated through mathematical computations, which could result in bias. In addition, the decision as to which parameters to fix and which to estimate is often subjective and therefore the final model and model parameters may vary significantly between different investigators. 4 , 5
Several lumping approaches have been proposed to reduce the dimensionality and complexity of whole body PBPK models by aggregating model states (i.e., tissue compartments) or parameters. Formal or proper lumping is a method of model reduction, where each state of the original model contributes to only one state of the reduced system. 6 Tissues with identical structural positions and similar kinetic properties are lumped together. The reduced model with lumped compartments retains the kinetic behavior of the original model, and the associated parameters maintain their meaning. 7 , 8 , 9 , 10 , 11 , 12 To lump parallel tissues, they should have similar time constants. 6 Additional model reduction approaches have been suggested for reducing PBPK models. 13 , 14 However, kinetic lumping approaches are typically tailor‐made for each new compound as they are generally only valid locally for a specific set of parameter values. 15
The limitation of drug‐dependence in model reduction might be overcome by using a general simplified PBPK model. A few generalized minimal PBPK models have been proposed as simplifications of a whole‐body PBPK model for estimation of physiologically relevant PK parameters without tissue concentration data available and for interspecies extrapolation. 16 , 17 , 18 However, these models are generally limited to evaluate blood/plasma concentration or drug concentrations of lumped tissue compartments which may not extrapolate well.
The purpose of this work was to investigate generalized approaches for the simplification of PBPK models that can easily be used to describe PK data, translation of PK properties from animals to humans, and even population PK analysis. The proposed models should be mechanistic in nature allowing separation of system‐ and drug‐specific parameters and the model parameters can be estimated without tissue concentration data. This approach is particularly useful for improving a PBPK model when the volume of distribution at steady‐state (V ss) is not well‐predicted from a bottom‐up approach with in silico equations, such as the Rodgers and Rowland (RR) model. 19 , 20 An evaluation of these simplified PBPK models will be shown for diazepam. The approach with these models retains physiological interpretability and can be performed a priori (e.g., in the absence of data in humans). These models could be applied for the prediction of human PKs from preclinical data.
METHODS
In typical whole‐body PBPK models for small molecules, compartments represent individual organs or tissues of the body, connected by systemic blood circulation. 6 , 21 , 22 Commonly, two blood compartments (arterial and venous) and 14 tissue compartments (lungs, heart, kidneys, bone, muscle, brain, adipose, skin, spleen, pancreas, liver, stomach, gut, bones, and the rest of the body) are included (Appendix S1). Two distinct approaches were investigated to simplify the PBPK model structure and/or reduce the number of parameters to facilitate parameter estimation, as shown in Figure 1. Kinetic lumping reduces the complexity of the model from a mathematical point of view. In contrast, steady‐state commonality in drug partitioning, reduces the number of unknown parameters while mostly retaining the kinetic structure of the PBPK model.
FIGURE 1.

Approaches investigated for simplifying a whole‐PBPK model. (1) Model with three compartments obtained by kinetic lumping. (2) The 14‐compartmental PBPK model with steady‐state commonality partitioning. (2.1) The 14‐compartmental PBPK model with common Kpus. (2.2) The 14‐compartmental PBPK model with common Kpus scalars. Kpus, unbound tissue to plasma partition coefficients; PBPK, physiologically‐based pharmacokinetic
Lumped body physiologically‐based pharmacokinetic model with three compartments
For an extensive description of lumping principles, the reader is referred to this publication. 6 The main rule is that tissues with identical model specifications (i.e., connected in parallel or in series) and similar time constants, can be grouped together. In this model, time constants (T) are defined as follows (Equation 1 to Equation 3):
Eliminating tissue (e.g., liver)
| (1) |
Non‐eliminating tissue
| (2) |
Arterial and venous blood
| (3) |
where V i, Kbi, and Q i are the volume, the blood tissue‐to‐plasma partitioning coefficient, blood flow of tissue i. The fu b is the drug fraction unbound in blood and CLint, i is the intrinsic clearance of tissue i.
For the three‐compartment PBPK model, the lungs, venous, and arterial (serial tissues) compartments were lumped as one “central” compartment because they have similar and low time constants (Table 1). 6
TABLE 1.
| Tissues | Human | Rat | ||||
|---|---|---|---|---|---|---|
| Time constant a (min) | Rank b | Compartment | Time constant a (min) | Rank b | Compartment | |
| Adipose | 53.5*Kbadipose | 16 | 3 | 3.40*Kbadipose | 13 | 2 |
| Bone | 17.8*Kbbone | 14 | 2 | 0.53*Kbbone | 7 | 1 |
| Brain | 1.92*Kbbrain | 10 | 2 | 0.83*Kbbrain | 11 | 2 |
| Gut | 1.92*Kbgut | 9 | 2 | 0.59*Kbgut | 9 | 1 |
| Heart | 1.35*Kbheart | 7 | 2 | 0.20*Kbheart | 5 | 2 |
| Kidney | 0.296*Kbkidney/(1.11 + fub*Clintkidney) | 3 | 2 | 1.76*Kbkidney/(11.72 + fub*Clintkidney) | 3 | 2 |
| Liver | 1.67*Kbliver/(1.49 + fub*Clintliver) | 6 | 2 | 8.47*Kbliver/(12.55 + fub*Clintliver) | 10 | 2 |
| Lung | 0.088*Kblung | 1 | 1 | 0.014*Kblung | 1 | 1 |
| Muscle | 27.1*Kbmuscle | 15 | 2 | 4.21*Kbmuscle | 15 | 2 |
| Pancreas | 1.61*Kbpancreas | 8 | 2 | 0.51*Kbpancreas | 6 | 2 |
| Skin | 8.55*Kbskin | 13 | 2 | 9.49*Kbskin | 16 | 3 |
| Spleen | 1.00*Kbspleen | 5 | 2 | 0.58*Kbspleen | 8 | 2 |
| Stomach | 2.42 *Kbstomach | 11 | 2 | 1.02*Kbstomach | 12 | 2 |
| RoB | 3.99*KbRoB | 12 | 2 | 3.87*KbRoB | 14 | 2 |
| Arterial | 0.228 | 2 | 1 | 0.079 | 2 | 1 |
| Venous | 0.683 | 4 | 1 | 0.157 | 4 | 1 |
A three‐compartment model was chosen as most drugs' distribution behavior can be described by such model structure. This model specification implies a rapidly‐ (central), a moderately‐ (peripheral 1), and a slowly‐ (peripheral 2) equilibrating compartment. Tissues were attributed to one of the latter two compartments depending on the percentage difference and magnitude of the tissue time constants (Table 1). A closed form solution (Appendix S1) was derived facilitating and expanding the use of this model within computationally intensive methods, such as Bayesian estimation methods. 23
For the central compartment (arterial, venous blood, and lungs), the rate equation is defined by Equation 4. Blood and lung concentrations can be derived using Equations 5 and 6.
 |
(4) |
| (5) |
| (6) |
where C central, C p1, C p2 are the total drug concentration in the central, the first and second peripheral compartments, respectively. The blood flow Q central is equivalent to the cardiac output and V central is defined as V arterial + V venous + V lung; Qp1 and Kbp1 are the blood flow and blood tissue‐to‐plasma partitioning coefficient for all tissues in the lumped peripheral one compartment. As drug clearance occurs in the peripheral compartment one, Kbp1 is weighted by the following volume term ΣVi (1‐Ei)/ΣVi where Ei represents the extraction ratio for extracting tissues only (liver and kidneys); Q p2 and Kbp2 are the blood flow and blood tissue‐to‐plasma partitioning coefficient for all the tissues in the lumped peripheral two compartment. CLblood represents the total apparent blood clearance: sum of the apparent hepatic and renal clearance (CLH and CLR, respectively), and is defined by the well‐stirred model. 24 The model allows estimation of hepatic and renal clearance in case urinary excretion data are collected. If no urinary data are collected, only one clearance term can be estimated (unless nonlinearity exist in at least one of the clearance processes).
For each of the lumped peripheral compartments one and two, the rate equations are defined as follow (Equation 7 and 8):
| (7) |
| (8) |
Qz = ΣQi and Vz = ΣVi where z = p1 or p2 and Qi and Vi are the blood flow and volume of the ith‐tissue lumped in the compartment z.
The volume of distribution at steady‐state based on whole blood (Vss,b) can be calculated as (Equation 9):
| (9) |
Physiologically‐based pharmacokinetic model with common Kpus or common scalars
Compared to the previous lumped PBPK model, the 14‐compartmental PBPK model only makes the kinetic assumption that the lungs, venous, and arterial blood equilibrate quasi instantaneously. 6 Hereafter, the term “PBPK model” will be used for the 14‐compartmental PBPK model (model 2 in Figure 1). All relevant model equations are provided in the Appendix S1. This PBPK model is primarily based on similarity in tissue composition or steady‐state drug partitioning while individual tissue blood‐flows and volumes are preserved compared to a full PBPK model. Two variations of this model were explored. In the PBPK model with common Kpus (model 2.1 in Figure 1), drugs are expected to have similar Kpu values in tissues with similar composition. Whereas in the PBPK model with common scalars (model 2.2 in Figure 1), individual Kpu values predicted, for instance by the RR model, may be modified by a common tissue‐scaling factor (referred to as scalar; Equation 10):
| (10) |
where Kpui is the true value of Kpu for tissue i whereas KpupredRR,i is the Kpu predicted using the RR model and SF i is the scaling factor for the tissue i.
A global sensitivity analysis showed that tissues could behave similarly in terms of Kpu values across different compounds with different properties, suggesting grouping of correlated tissues. 25 Clustering analyses were performed to identify tissue groups that share commonality in composition or steady‐state drug partitioning. Therefore, observations within the same group are as similar as possible, whereas observations from different clusters are as dissimilar as possible. Many clustering algorithms have been proposed and described in the literature. 26 , 27 Among them, the k‐means and hierarchical clustering are the most widely used. Given the utility and limitations of each method, 27 , 28 both were explored here. The tissue similarities were assessed using two different datasets (Figure 1): (a) tissue composition data (rat and human) or (b) using normalized in vivo Kpu values (rat data only). More details about the clustering analysis can be found in Appendix S1.
Diazepam data
The models were fitted to diazepam PK data in rats and humans. Individual and average PK profiles following intravenous administration were available in humans (35 profiles) and rats (6 profiles). Diazepam has logP and pKa values of 2.82 and 3.4. 29 Fup and BP were measured internally, and values were 0.009 and 0.559 for humans and 0.1 and 0.836 for rats (details in Appendix S1). Urinary excretion fraction was reported to be 0.0005 in humans 30 and 0.009 in rats. 31
Data analysis
The suitability of the proposed models was explored: (1) to fit the data, (2) to produce biologically plausible Kpu values (comparison to experimental data in rat), and (3) to propose a suitable model structure for translation as an important application, such as using the rat model to predict into humans. Although this is not discussed herein, it is the subject of the accompanying research. 32
The investigated models were fitted to the human and rat PK data and their model parameter values were estimated using the first order conditional estimation with interaction method as implemented in NONMEM 7.3. The following general model was fitted to the data (Equation 11):
| (11) |
where Y ij is the observed data for individual study i at time t ij, f is the structural model, θ i is the vector of p individual PK parameters for studies/individual i, and ε ij is the residual error. An exponential model was used to account for interindividual variability (IIV). 33
Models were evaluated using standard goodness‐of‐fit (GOF) diagnostics, numerical evaluation, and decrease in objective function value (approximated by −2*Log Likelihood). 34 Model comparison was made using the Bayesian information criterion (BIC). The biological plausibility of parameter estimates was evaluated against existing data, in particular, rat Kpu values of diazepam available from the literature. 35 An analysis of the distribution of the prediction success using RR model on a large dataset of rat Kpus showed that 95% RR Kpu predictions are found within ~21‐fold error (Appendix S1). Kpu values predicted beyond 21‐fold were considered less likely to occur.
A common study design was simulated using the R package “RxODE,” 36 allowing the comparison of the different models and study designs. Observations in humans and in rats were simulated from a reference model (structure, parameter estimates, and associated uncertainty). The reference models represent empirical compartmental models (two compartments in humans and three compartments in rats) fitted to the diazepam data. For each species, 1000 drug concentration‐time courses were simulated for a single i.v. dose of diazepam and infusion rate to achieve a steady‐state plasma concentration determined by the drug elimination rate; a 16.1 h infusion of 10 mg in humans and a 2‐min infusion of 5 mg/kg in rats were chosen. Predictions of the different PBPK models were superimposed onto simulations from the reference model to obtain a visual display of the investigated models' ability to describe the data. Additionally, the median V ss,b predicted from the investigated models (Equation 9) were compared against the median V ss,b simulated “observed” from the fitted empirical model (note that this compares models with central and peripheral elimination). The root mean square error (RMSE) was calculated between PBPK and empirical models to assess the precision of the predictions. 37
RESULTS
The different approaches to simplify PBPK model complexity are illustrated in Figure 1.
Lumped PBPK model with three compartments
The first approach for simplifying PBPK models was to lump tissue compartments with similar kinetics. The time constants of the tissue compartments and their ranking are shown in Table 1. The tissues were classified into three categories, according to the values of their time constants (Figure 2):
Quasi‐instantaneously or very rapidly equilibrating tissues with a time constant virtually equal to zero;
Rapidly equilibrating tissues with moderately low time constants;
Slowly equilibrating tissues with large time constants.
FIGURE 2.

Schematic representation of the lumped three compartment‐model in humans (a) and in rats (b) and the 14‐compartmental PBPK model with common Kpus or common scalars (c). Kpus, unbound tissue to plasma partition coefficients; PBPK, physiologically‐based pharmacokinetic
Physiologically‐based pharmacokinetic model with common Kpu values or common scalars
The second approach for simplifying PBPK models was to have a 14‐compartmental model with tissue compartments sharing common Kpu values or common Kpu scalars (Figure 2). Although this approach did not simplify the model structure, the number of unknown distribution parameters was reduced from 13 to 3 (or 4). To identify tissue with common Kpu values or scalars, a clustering analysis was performed (Figure 3 and Figure S1). Using hierarchical clustering, the same three or four tissue groups were identified for humans and rats, whereas slightly different tissue groups were identified using k‐means clustering (Figure 3). For humans, skin tissue composition (very high fraction of extracellular water, high albumin and low lipoprotein concentrations) is separate from other tissue groups (Table S2). Group 2 (kidneys, gut, lungs, heart, liver, and spleen) includes tissues with high acid phospholipid and lipoprotein contents, whereas group 1 (adipose, bone, brain, pancreas, and muscle) contains tissues with low tissue water, low acid phospholipid, and lipoprotein contents but very high neutral lipid and phospholipids. Adipose has a very particular composition (low water and very high neutral lipids) compared to other tissues of group 1, and thus having four groups may be more appropriate (Table S2). Likewise in the rat, the adipose tissue composition stands out from other group 1‐tissues and thus it is more relevant to consider four groups with adipose separate (Table S3). On the other hand, when using k‐means clustering, skin in the rat was not considered to be different to the group 3‐tissues (gut, heart, lungs, and stomach) which are tissues with higher fractional extracellular water, higher albumin than other tissues (Table S3). Additionally, clustering analysis was performed based on experimental rat Kpu values. Tissue grouping was based on frequencies of tissue assignments to a cluster, as some tissues have the probability of arising from different clusters (Figure S1). The tissue groups obtained based on the dataset of Kpus were surprisingly different from the clustering analysis based on tissue composition data. Here, all the tissues were grouped together except the lungs, which was separate from the other tissues, and the two eliminating tissues (kidneys and liver), which could be further differentiated into two different groups on their own into a three compartmental model. This tissue grouping seemed to be similar to the time constants based on kinetic lumping.
FIGURE 3.
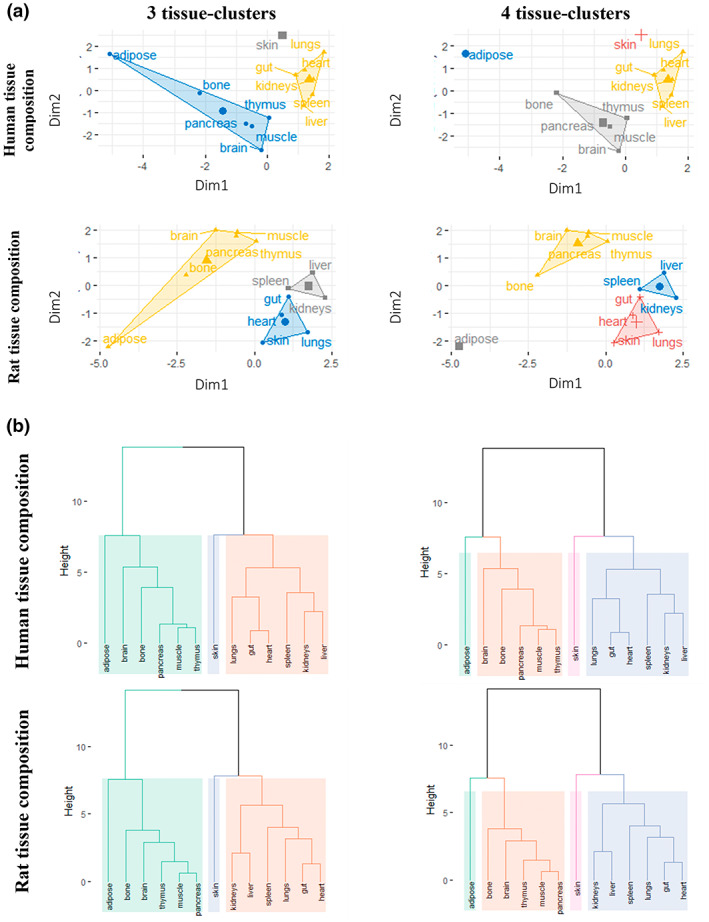
Tissue grouping using k‐means and hierarchical clustering methods: (a) Principal component plots for k‐means clustering with three and four groups in humans and rats. (b) Dendrograms obtained from hierarchically clustering of the human and rat tissue composition data with Euclidian distance and Ward's method, cut into three or four distinct clusters. In (a), the dots represent a two‐dimensional matrix of tissues generated by principal component analysis of the tissue composition data. Horizontal axis, factor score of the first component extracted from the composition of each tissue; vertical axis, factor score of the second component. in (b), distinct clusters are shown in different colors. Tissue composition data for humans are from ref. 3 and data for rats are from ref. 19
Estimation of Kpu values for diazepam using the simplified PBPK models
The proposed PBPK models were further investigated for parameter estimation using diazepam data in humans and rats. Initial exploration of structural models revealed that a linear two‐compartment model best described the concentration‐time profiles of diazepam in humans whereas a linear three‐compartment model best described the rat data. A clearance value of 3.71 L/h and a total volume of distribution of 145 L (~2 L/kg) were estimated in humans. In rats, the clearance and total volumes were estimated to be 0.920 L/h and 0.914 L (~4 L/kg). These values were overall in good agreement with values reported in published studies (Tables S4 and S5). These empirical models served as reference to compare the PBPK model predictions.
In total five different PBPK model variants were fitted to the concentration‐time data of diazepam in humans (GOF plots of the models are provided in Figure S3). Table 2 shows the final parameter estimates together with the BIC values and lists the number of parameters in the models differentiating between fixed and random (IIV and residual) effects.
TABLE 2.
Parameter estimates of the different investigated mechanistic models for diazepam in man and comparison of median V ss and RMSE of simulated concentration profiles
| Model | Lumped 3‐compartment | 3 common Kpus | 4 common Kpus | 3 scalars | 4 scalars |
|---|---|---|---|---|---|
| Number of parameters (structural/IIV/residual) | 4/1/1 | 4/1/1 | 5/1/1 | 4/1/1 | 5/1/1 |
| Median plasma concentration RMSE | 2.56 | 2.11 | 1.92 | 6.60 | 2.02 |
| BIC | −2632.71 | −2662.18 | −2597.66 | −2344.21 | −2596.42 |
| CLb (L/h) | 3.63 (4) | 3.67 (4) | 3.67 (4) | 3.71 (4) | 3.56 (5) |
| IIVCLb | 33.1% (17) | 34.3% (18) | 32.1% (19) | 26% (16) | 35.2% (20) |
| Kpu1 or SF1* | 1150 (5) | 29.1 (5) | 32.4 (6) | 3.35 (7)* | 0.206 (42)* |
| Kpu2 or SF2* | 24.3 (10) | 72.2 (11) | 89.1 (10) | 1.66 (41)* | 5.70 (11)* |
| Kpu3 or SF3* | 483 (2) | 3430 (2) | 324 (5) | 0.26 (10)* | 6.42 (14)* |
| Kpu4 or SF4* | 483 (8) | 8.67 (6)* | |||
| Residual error | 39.3% (8) | 38.7% (8) | 38.6% (8) | 53.9% (15) | 38.6% (8) |
| V ss median | 154 | 158 | 159 | 115 | 159 |
Abbreviations: BIC, Bayesian information criterion; CLb, blood clearance; IIV, interindividual variability; PBPK, physiologically‐based pharmacokinetic; RMSE, root mean square error; SF, scaling factor; V ss, volume of distribution at steady‐state.
Parameter estimates are listed together with the coefficient of variation [CV (%)] in parentheses.
In the lumped‐three compartment model: Kpu1 corresponds to the lumped compartment (blood and lungs), Kpu2 corresponds to (muscle, bone, skin, brain, rest of body, kidneys, heart, spleen, liver, pancreas, gut, and stomach), Kpu3 to (adipose).
In the three‐common Kpus/scalars PBPK models: Kpu1/SF1 corresponds to the cluster (adipose, bone, brain, muscle, pancreas, muscle, rest of body), Kpu2/SF2 corresponds to the cluster (lung, gut, stomach, kidney, heart, spleen, liver), Kpu3/SF3 corresponds to the cluster (skin).
In the four‐common Kpus/scalars PBPK models: Kpu1/SF1 corresponds to the cluster (bone, brain, muscle, pancreas, muscle, and the rest of the body), Kpu2/SF2 corresponds to the cluster (lungs, gut, stomach, kidneys, heart, spleen, and liver), Kpu3/SF3 corresponds to the cluster (skin), Kpu4/SF4 corresponds to the cluster (adipose).
The RMSE is calculated relative to the median concentration simulated from the reference model (2 compartment) during the simulation time interval (0–240 h).
All PBPK models could be successfully fitted to diazepam data in humans, and all estimated a V ss value within 20%–25% of the observed value (145 L). Estimated Kpu values from the investigated models were similar. However, two models—the kinetically lumped model and the PBPK model with three common Kpu values—produced very high values for one Kpu value and may not be physiologically plausible (Table 2). Additionally, the predicted concentration‐time profiles of all investigated models, except the PBPK model with three scalars, were like those predicted by the empirical model (low RMSE; Table 2). Figure 4 shows the model‐predicted population profiles following a single IV infusion of diazepam for each of the simplified PBPK models investigated. All models except the PBPK model with three scalars could adequately describe the median observed data (simulations using the empirical model), whereas the 10th and the 90th percentiles were not always well‐captured (Figure 4).
FIGURE 4.

Simulated concentration‐time profiles of diazepam following an infusion dose (10 mg during 16.1 h) in humans for the different investigated mechanistic models versus the reference model. The solid red line represents the median concentrations and the semi‐transparent red field represents a simulation based 90% confidence interval for the median using the reference model (empirical two‐compartmental model). The blue solid line represents the median concentrations and the blue semi‐transparent field represents a simulation based 90% confidence interval for the median using the lumped three‐compartmental model (a), the PBPK models with three or four common Kpus (b, c) and with 3 or 4 scalars (d, e). Kpus, unbound tissue to plasma partition coefficients; PBPK, physiologically‐based pharmacokinetic
Based on the BIC, plausibility of estimated values, and the model performance, the models with four common Kpus or four Kpu scalars best describe the diazepam data in humans. The lumped three compartment performed very well in terms of numerical predictive checks and could also be considered. On the contrary, due to poor physiological plausibility of skin Kpu and poor model performance, the PBPK models with three common Kpus or three scalars would not be selected here. Similar analysis was performed in rats (results can be found in Appendix S1).
DISCUSSION
In this work, two approaches for simplifying whole‐body PBPK models were investigated (Figure 1 and Table 3). For diazepam, both approaches produced models which generally showed a good ability to describe in vivo data and to estimate parameters relating to drug clearance and distribution.
TABLE 3.
Summary and characteristics of the approaches investigated for simplifying PBPK models
| Models and assumptions | Advantages | Disadvantages | |
|---|---|---|---|
Lumped 3 compartment model:
|
|
|
|
14 compartment PBPK model:
|
With common Kpus: Assumption of same Kpus between species |
|
• Long estimation run times due to high model dimentionality |
|
With common scalars: Assumption of similar bias from predicted Kpus (by RR model) across species | |||
Abbreviations: PBPK, physiologically‐based pharmacokinetic; QSS, quasi‐steady state; RR, Rodgers and Rowland.
The first method followed Nestorov's lumping principles for PBPK models. 6 This is consistent with other minimal PBPK models, which reduce the number of compartments to a few compartments with comparable blood flow rates. 38 , 39 Kinetically lumped PBPK models and their application during drug development have been extensively researched. The number of compartments considered in the current work was in good agreement with previous work by Pilari and Huisinga 9 where lumped models generally comprised three to four compartments, respectively, for bases and acids which are moderately to highly unbound in plasma, whereas a single compartment model was sufficient for acids with low f up values. Arundel suggested a model with six tissue compartments but estimating six Kpu parameters may be challenging given typical PK data. 17 In the manner of previous studies, 6 , 40 a general “quasi‐steady state” approximation was proposed for blood and lungs given the low time constant and the time scale differences between lung distribution relative to any observations. This assumption holds true in general except for highly lipophilic compounds. Being in the central compartment, the lung Kpu might represent additional processes more rapid than blood flows (e.g., extravasation from the site of injection or during the transit from the site of injection to the site of observation). Another important and less studied aspect is that the proposed models should ideally scale between animal species. However, scaling of this lumping approach across species may not work well as some tissues (e.g., muscle, skin, and adipose) have different flows and volumes in difference species (Table S1), and consequently different tissue kinetics between humans and animals resulting in slightly different lumped tissue compartments (Figure 2). Moreover, plasma PK data generated in rats may contain very little information for adipose tissue as it is a much leaner species than humans. The opposite is true for the skin, which represents a much larger proportion of the total body weight in rats compared to humans. The utility of the kinetically lumped PBPK model for extrapolation has to be explored in future research. 32
The second approach discussed here, which has not been previously explored in the literature, followed the assumption that a drug has similar steady‐state binding/partitioning behavior in tissues with similar compositions, but different kinetic behaviors given the different volumes, flow rates of tissues, and drug‐dependent differences due to differences in tissue partitioning. The possible advantage of such an approach is that the final model structure depends on physiological and not drug‐specific properties. This assumption is consistent with previous work where it was observed that several tissues had similar Kpu behavior, whereas adipose stood out possibly due to different tissue composition. 25 Additionally, a previous study observed correlation between muscle Kpu and other tissues Kpus and proposed to have muscle Kpu represent lean tissues. 41 To formalize this idea, a clustering analysis was performed to identify tissues with common Kpu values or scalars thus reducing the number of unknown parameters while keeping the kinetic structure of the PBPK model. Future work could aim to combine kinetic lumping and clustering analysis to cluster tissues with the same time constants.
Clustering methods were applied to formally group tissues using two different types of information: human/rat tissue composition data or rat normalized Kpu data. For the former, the assessment of tissue composition data was based on the RR model, whereas tissue partitioning equations are evolving with better mechanistic understanding (e.g., inclusion of lysosomal compartment 42 ). For the latter, the tissue composition data are a hybrid of measured, calculated, approximated individual or mean values. 19 , 20 , 43 , 44 Values could originate from different strains or even taken from another species especially for human values due to limited data available. Even when experimental rat Kpu data are available, various methods are used for their determination. Kpu data are ideally derived from in vivo studies following a constant rate infusion of drug until steady‐state is supposedly reached or plasma and tissue areas under concentration time profiles following an i.v. bolus. Nevertheless, these in vivo Kpu methods require at least one animal per timepoint. The differences in tissue grouping between the clustering using rat experimental Kpus compared to the clustering based on tissue composition data, could be due to the dataset size, the data availability (high percentage of missing data), the quality of reported experimental Kpus, as well as the varying source of studies and methods used for measuring Kpus. This limitation due to experimental design of studies can influence the grouping of Kpus.
In this work, sources and quality of diazepam i.v. data were varied (rich data in humans, and more limited and variable data in rats). Data in humans showed better bioanalytical resolution and slower kinetics, which may reveal kinetic phases that are hidden in rats. It should be noted that the quality of the plasma PK data used for fitting was not ideal as the data were mostly arithmetic mean data, which may misrepresent the terminal phase in addition to coming from multiple studies following different protocols in different populations. Thus, the recommendation would be to perform this analysis on individual data or on geometric mean data if data are aggregated. Compared to previous works where diazepam data was fitted in man, 35 , 45 , 46 the models investigated here have the advantage of not requiring a highly dimensional PBPK model structure and the use of prior information or full Bayesian estimation methods for estimating the multiple parameters. The current work is an example of middle‐out approach linking PBPK modeling (bottom‐up) and population PK modeling (top‐down) and where PBPK models can be fitted to observed preclinical or clinical data. Contrary to empirical compartment models that are frequently used in all stages of drug development, the investigated PBPK models retain important physiological features giving estimates physiologically meaningful and thus supporting extrapolation purposes while requiring a similar number of free parameters.
The value of PBPK modeling is indeed its ability to be used for extrapolation to another population or species and experimental conditions. The aspect of interspecies extrapolation from preclinical species to human will be investigated in another study. 32 Among the various investigated PBPK models, the PBPK models with scalars show more promise for a wider set of drugs and for interspecies translation. Although the PBPK models with three scalars are more parsimonious and should be considered first when data are limited, the PBPK models with four scalars are more physiologically relevant. For a comprehensive comparison of the investigated mechanistic models, evaluation of different compounds would be needed.
AUTHOR CONTRIBUTIONS
E.Y., M.G., and A.O.‐M. wrote the manuscript. E.Y., M.G., A.O.‐M., K.O., and L.A. designed the research. E.Y. performed the research. E.Y. analyzed the data.
FUNDING INFORMATION
This work has been funded by F. Hoffmann‐La Roche.
CONFLICT OF INTEREST
E.Y., M.G., and A.O.‐M. are employees of F. Hoffmann‐La Roche. All other authors declared no competing interests for this work.
Supporting information
Appendix S1
ACKNOWLEDGMENTS
The authors would like to thank Isabelle Walter for assistance with in vitro measurements of diazepam and Neil Parrott for scientific discussion and reviewing this manuscript.
Yau E, Olivares‐Morales A, Ogungbenro K, Aarons L, Gertz M. Investigation of simplified physiologically‐based pharmacokinetic models in rat and human. CPT Pharmacometrics Syst Pharmacol. 2023;12:333‐345. doi: 10.1002/psp4.12911
REFERENCES
- 1. Aarons L. Physiologically based pharmacokinetic modelling: a sound mechanistic basis is needed. Br J Clin Pharmacol. 2005;60(6):581‐583. [DOI] [PMC free article] [PubMed] [Google Scholar]
- 2. Reddy MB, Iii HJC, Lave T, Andersen ME. Physiologically based pharmacokinetic modeling: a tool for understanding ADMET properties and extrapolating to human. In: Gowder S, ed. New Insights into Toxicity and Drug Testing. InTech; 2013:197‐217. [Google Scholar]
- 3. Poulin P, Jones RD, Jones HM, et al. PHRMA CPCDC initiative on predictive models of human pharmacokinetics, part 5: prediction of plasma concentration‐time profiles in human by using the physiologically‐based pharmacokinetic modeling approach. J Pharm Sci. 2011;100(10):4127‐4157. [DOI] [PubMed] [Google Scholar]
- 4. Tsamandouras N, Rostami‐Hodjegan A, Aarons L. Combining the 'bottom up' and 'top down' approaches in pharmacokinetic modelling: fitting PBPK models to observed clinical data. Br J Clin Pharmacol. 2013;79(1):48‐55. [DOI] [PMC free article] [PubMed] [Google Scholar]
- 5. Margolskee A, Darwich AS, Pepin X, et al. IMI ‐ Oral biopharmaceutics tools project ‐ evaluation of bottom‐up PBPK prediction success part 2: an introduction to the simulation exercise and overview of results. Eur J Pharm Sci. 2017;96:610‐625. [DOI] [PubMed] [Google Scholar]
- 6. Nestorov IA, Aarons LJ, Arundel PA, Rowland M. Lumping of whole‐body physiologically based pharmacokinetic models. J Pharmacokinet Biopharm. 1998;26(1):21‐46. [DOI] [PubMed] [Google Scholar]
- 7. Dokoumetzidis A, Aarons L. Proper lumping in systems biology models. IET Syst Biol. 2009;3(1):40‐51. [DOI] [PubMed] [Google Scholar]
- 8. Dokoumetzidis A, Aarons L. A method for robust model order reduction in pharmacokinetics. J Pharmacokinet Pharmacodyn. 2009;36(6):613‐628. [DOI] [PubMed] [Google Scholar]
- 9. Pilari S, Huisinga W. Lumping of physiologically‐based pharmacokinetic models and a mechanistic derivation of classical compartmental models. J Pharmacokinet Pharmacodyn. 2010;37(4):365‐405. [DOI] [PubMed] [Google Scholar]
- 10. Brochot C, Toth J, Bois FY. Lumping in pharmacokinetics. J Pharmacokinet Pharmacodyn. 2005;32(5–6):719‐736. [DOI] [PubMed] [Google Scholar]
- 11. Bjorkman S. Reduction and lumping of physiologically based pharmacokinetic models: prediction of the disposition of fentanyl and pethidine in humans by successively simplified models. J Pharmacokinet Pharmacodyn. 2003;30(4):285‐307. [DOI] [PubMed] [Google Scholar]
- 12. Fronton L, Pilari S, Huisinga W. Monoclonal antibody disposition: a simplified PBPK model and its implications for the derivation and interpretation of classical compartment models. J Pharmacokinet Pharmacodyn. 2014;41(2):87‐107. [DOI] [PubMed] [Google Scholar]
- 13. Gueorguieva I, Nestorov IA, Rowland M. Reducing whole body physiologically based pharmacokinetic models using global sensitivity analysis: diazepam case study. J Pharmacokinet Pharmacodyn. 2006;33(1):1‐27. [DOI] [PubMed] [Google Scholar]
- 14. Snowden TJ, van der Graaf PH, Tindall MJ. Model reduction in mathematical pharmacology: integration, reduction and linking of PBPK and systems biology models. J Pharmacokinet Pharmacodyn. 2018;45:537‐555. [DOI] [PMC free article] [PubMed] [Google Scholar]
- 15. Dokoumetzidis A. Lumping of compartments. PAGE 21, Venice, Italy, 5‐8 June 2012, Abstr 2637;2012. Accessed January 12, 2023. https://www.page‐meeting.org/?abstract=2637
- 16. Cao Y, Jusko WJ. Applications of minimal physiologically‐based pharmacokinetic models. J Pharmacokinet Pharmacodyn. 2012;39(6):711‐723. [DOI] [PMC free article] [PubMed] [Google Scholar]
- 17. Arundel PA. A multi‐compartmental model generally applicable to physiologically‐based pharmacokinetics. 3rd IFAC Modelling and Control in Biomedical Systems: Warwick, UK; 1997. 5.
- 18. Luttringer O, Theil FP, Poulin P, Schmitt‐Hoffmann AH, Guentert TW, Lave T. Physiologically based pharmacokinetic (PBPK) modeling of disposition of epiroprim in humans. J Pharm Sci. 2003;92(10):1990‐2007. [DOI] [PubMed] [Google Scholar]
- 19. Rodgers T, Leahy D, Rowland M. Physiologically based pharmacokinetic modeling 1: predicting the tissue distribution of moderate‐to‐strong bases. J Pharm Sci. 2005;94(6):1259‐1276. [DOI] [PubMed] [Google Scholar]
- 20. Rodgers T, Rowland M. Physiologically based pharmacokinetic modelling 2: predicting the tissue distribution of acids, very weak bases, neutrals and zwitterions. J Pharm Sci. 2006;95(6):1238‐1257. [DOI] [PubMed] [Google Scholar]
- 21. Bernareggi A, Rowland M. Physiologic modeling of cyclosporin kinetics in rat and man. J Pharmacokinet Biopharm. 1991;19(1):21‐50. [DOI] [PubMed] [Google Scholar]
- 22. Rowland M, Peck C, Tucker G. Physiologically‐based pharmacokinetics in drug development and regulatory science. Annu Rev Pharmacol Toxicol. 2011;51:45‐73. [DOI] [PubMed] [Google Scholar]
- 23. Bauer RJ. NONMEM tutorial part I: description of commands and options, with simple examples of population analysis. CPT Pharmacometrics Syst Pharmacol. 2019;8:525‐537. [DOI] [PMC free article] [PubMed] [Google Scholar]
- 24. Pang KS, Han YR, Noh K, Lee PI, Rowland M. Hepatic clearance concepts and misconceptions: why the well‐stirred model is still used even though it is not physiologic reality? Biochem Pharmacol. 2019;169:113596. [DOI] [PubMed] [Google Scholar]
- 25. Yau E, Olivares‐Morales A, Gertz M, et al. Global sensitivity analysis of the Rodgers and Rowland model for prediction of tissue: plasma partitioning coefficients: assessment of the key physiological and physicochemical factors that determine small‐molecule tissue distribution. AAPS J. 2020;22(2):41. [DOI] [PubMed] [Google Scholar]
- 26. Jain AK. Data clustering: 50 years beyond K‐means. Pattern Recogn Lett. 2010;31(8):651‐666. [Google Scholar]
- 27. Xu D, Tian Y. A comprehensive survey of clustering algorithms. Ann Data Sci. 2015;2(2):165‐193. [Google Scholar]
- 28. MacQueen J. Some Methods for Classification and Analysis of Multivariate Observations. Proceedings of the Fifth Berkeley Symposium on Mathematical Statistics and Probability, Volume 1: Statistics. University of California Press; 1967. [Google Scholar]
- 29. Wishart DS, Feunang YD, Guo AC, et al. DrugBank 5.0: a major update to the DrugBank database for 2018. Nucleic Acids Res. 2018;46(D1):D1074‐D1082. [DOI] [PMC free article] [PubMed] [Google Scholar]
- 30. Kaplan SA, Jack ML, Alexander K, Weinfeld RE. Pharmacokinetic profile of diazepam in man following single intravenous and oral and chronic oral administrations. J Pharm Sci. 1973;62(11):1789‐1796. [DOI] [PubMed] [Google Scholar]
- 31. Igari Y, Sugiyama Y, Sawada Y, Iga T, Hanano M. Prediction of diazepam disposition in the rat and man by a physiologically based pharmacokinetic model. J Pharmacokinet Biopharm. 1983;11(6):577‐593. [DOI] [PubMed] [Google Scholar]
- 32. Yau E, Gertz M, Ogungbenro K, Aarons L, Olivares‐Morales A. Prediction of human drug disposition from preclinical data using a ‘middle‐out approach’ to physiologically based pharmacokinetic (PBPK) modelling; 2022. [In submission]. [DOI] [PMC free article] [PubMed]
- 33. Laporte‐Simitsidis S, Girard P, Mismetti P, Chabaud S, Decousus H, Boissel JP. Inter‐study variability in population pharmacokinetic meta‐analysis: when and how to estimate it? J Pharm Sci. 2000;89(2):155‐167. [DOI] [PubMed] [Google Scholar]
- 34. Nguyen TH, Mouksassi MS, Holford N, et al. Model evaluation of continuous data Pharmacometric models: metrics and graphics. CPT Pharmacometrics Syst Pharmacol. 2017;6(2):87‐109. [DOI] [PMC free article] [PubMed] [Google Scholar]
- 35. Gueorguieva I, Aarons L, Rowland M. Diazepam pharamacokinetics from preclinical to phase I using a Bayesian population physiologically based pharmacokinetic model with informative prior distributions in WinBUGS. J Pharmacokinet Pharmacodyn. 2006;33(5):571‐594. [DOI] [PubMed] [Google Scholar]
- 36. Wang W, Hallow KM, James DA. A tutorial on RxODE: simulating differential equation Pharmacometric models in R. CPT Pharmacometrics Syst Pharmacol. 2016;5(1):3‐10. [DOI] [PMC free article] [PubMed] [Google Scholar]
- 37. Barnston AG. Correspondence among the correlation, RMSE, and Heidke forecast verification measures; refinement of the Heidke score. Weather Forecast. 1992;7(4):699‐709. [Google Scholar]
- 38. Jones HM, Mayawala K, Poulin P. Dose selection based on physiologically based pharmacokinetic (PBPK) approaches. AAPS J. 2013;15(2):377‐387. [DOI] [PMC free article] [PubMed] [Google Scholar]
- 39. Sager JE, Yu J, Ragueneau‐Majlessi I, Isoherranen N. Physiologically based pharmacokinetic (PBPK) modeling and simulation approaches: a systematic review of published models, applications, and model verification. Drug Metab Dispos. 2015;43(11):1823‐1837. [DOI] [PMC free article] [PubMed] [Google Scholar]
- 40. Yates JW, Arundel PA. On the volume of distribution at steady state and its relationship with two‐compartmental models. J Pharm Sci. 2008;97(1):111‐122. [DOI] [PubMed] [Google Scholar]
- 41. Bjorkman S. Prediction of the volume of distribution of a drug: which tissue‐plasma partition coefficients are needed? J Pharm Pharmacol. 2002;54(9):1237‐1245. [DOI] [PubMed] [Google Scholar]
- 42. Assmus F, Houston JB, Galetin A. Incorporation of lysosomal sequestration in the mechanistic model for prediction of tissue distribution of basic drugs. Eur J Pharm Sci. 2017;109:419‐430. [DOI] [PubMed] [Google Scholar]
- 43. Ruark CD, Hack CE, Robinson PJ, Mahle DA, Gearhart JM. Predicting passive and active tissue:plasma partition coefficients: interindividual and interspecies variability. J Pharm Sci. 2014;103(7):2189‐2198. [DOI] [PubMed] [Google Scholar]
- 44. Poulin P, Theil FP. Prediction of pharmacokinetics prior to in vivo studies. 1. Mechanism‐based prediction of volume of distribution. J Pharm Sci. 2002;91(1):129‐156. [DOI] [PubMed] [Google Scholar]
- 45. Langdon G, Gueorguieva I, Aarons L, Karlsson M. Linking preclinical and clinical whole‐body physiologically based pharmacokinetic models with prior distributions in NONMEM. Eur J Clin Pharmacol. 2007;63(5):485‐498. [DOI] [PubMed] [Google Scholar]
- 46. Tsiros P, Bois FY, Dokoumetzidis A, Tsiliki G, Sarimveis H. Population pharmacokinetic reanalysis of a diazepam PBPK model: a comparison of Stan and GNU MCSim. J Pharmacokinet Pharmacodyn. 2019;46:173‐192. [DOI] [PubMed] [Google Scholar]
- 47. Valentin J. Basic anatomical and physiological data for use in radiological protection: reference values: ICRP publication 89: approved by the commission in September 2001. Ann ICRP. 2002;32(3–4):1‐277. doi: 10.1016/S0146-6453(03)00002-2 [DOI] [PubMed] [Google Scholar]
- 48. Williams LR, Leggett RW. Reference values for resting blood flow to organs of man. Clin Phys Physiol Meas. 1989;10(3):187‐217. doi: 10.1088/0143-0815/10/3/001 [DOI] [PubMed] [Google Scholar]
- 49. Nestorov I. Modelling and simulation of variability and uncertainty in toxicokinetics and pharmacokinetics. Toxicol Lett. 2001;120(1–3):411‐420. doi: 10.1016/s0378-4274(01)00273-9 [DOI] [PubMed] [Google Scholar]
- 50. Brown RP, Delp MD, Lindstedt SL, Rhomberg LR, Beliles RP. Physiological parameter values for physiologically based pharmacokinetic models. Toxicol Ind Health. 1997;13(4):407‐484. doi: 10.1177/074823379701300401 [DOI] [PubMed] [Google Scholar]
Associated Data
This section collects any data citations, data availability statements, or supplementary materials included in this article.
Supplementary Materials
Appendix S1