

STRUCTURED ABSTRACT
Objective:
Our objective was to identify macrophage subpopulations and gene signatures associated with regenerative or fibrotic healing across different musculoskeletal injury types.
Background:
Subpopulations of macrophages are hypothesized to fine tune the immune response after damage, promoting either normal regenerative, or aberrant fibrotic healing.
Methods:
Mouse single-cell RNA sequencing data before and after injury were assembled from models of musculoskeletal injury, including regenerative and fibrotic mouse volumetric muscle loss (VML), regenerative digit tip amputation (DTA), and fibrotic heterotopic ossification (HO). R packages Harmony, MacSpectrum and Seurat were used for data integration, analysis and visualizations.
Results:
There was substantial overlap between macrophages from the regenerative VML (2mm injury) and regenerative bone (DTA) models, as well as a separate overlap between the fibrotic VML (3mm injury) and fibrotic bone (HO) models. We identified 2 fibrotic-like (FL 1 and FL 2) along with 3 regenerative-like (RL 1, RL 2, and RL 3) subpopulations of macrophages, each of which was transcriptionally distinct. We found that regenerative and fibrotic conditions had similar compositions of pro-inflammatory and anti-inflammatory macrophages, suggesting that macrophage polarization state did not correlate with healing outcomes. Receptor/ligand analysis of macrophage-to-mesenchymal progenitor cell (MPC) crosstalk showed enhanced transforming growth factor beta (TGF-β) in fibrotic conditions and enhanced platelet derived growth factor (PDGF) signaling in regenerative conditions.
Conclusion:
Characterization of macrophage subtypes could be used to predict fibrotic responses following injury and provide a therapeutic target to tune the healing microenvironment towards more regenerative conditions.
Keywords: single-cell, macrophage, regeneration, fibrosis
MINI ABSTRACT
Macrophages are hypothesized to serve as regulators of healing patterns following trauma. In this study, we use single cell sequencing to characterize macrophage phenotypic states in both fibrotic and regenerative healing in multiple models of musculoskeletal injury. These findings will inform future studies to transform sites of fibrosis into sites of regeneration.
INTRODUCTION
Tissue repair is a highly regulated process dependent upon immune cell signaling, coordinated differentiation of mesenchymal progenitor cells (MPCs) and tissue-resident stem cells, and extracellular matrix remodeling 1–3. Regeneration is characterized by full tissue healing, which requires differentiation and proliferation of musculoskeletal progenitor cells to replace injured tissues 4,5. In tissue fibrosis, aberrant differentiation of fibroblasts in the wound site results in the deposition of pathological levels of connective tissue, preventing tissue regeneration and causing loss of function 6. Previous research has characterized regenerative and fibrotic repair processes through various mouse injury models 7. The volumetric muscle loss (VML) model represents a paradigm of muscle healing. Smaller muscle defects (<2mm VML in mice) are able to regenerate into functional tissue, while larger defects (>3mm VML in mice) result in fibrosis development 8,9. In addition to muscle, bone has also been shown to have the capacity to regenerate. Models of digit tip amputation (DTA) can regenerate functional bone and soft tissue to replace the lost digit tip when amputation occurs beyond the distal interphalangeal joint 10,11. In contrast, other musculoskeletal injuries can result in aberrant cell differentiation and tissue formation. Traumatic injuries can result in the formation of heterotopic ossification (HO) or bone fibrosis, the aberrant differentiation of MPCs within tendon and muscle into ectopic bone 12,13. To date, it remains unclear what cellular differences are present in the microenvironment in regenerative compared to fibrotic repair programs.
Following trauma, the immune system is a critical modulator of wound healing and provides a regulatory mechanism for either regenerative or fibrotic healing programs 14. While the importance of the immune system in tissue regeneration is widely accepted, a greater understanding of specific immune cell populations and associated signaling pathways is necessary to identify strategies to prevent fibrosis and to promote regeneration 15,16. Macrophages are well characterized as key regulators of both tissue regeneration and fibrosis 17–20. While recent advances in single-cell technologies have enabled more extensive identification of macrophage subsets and heterogeneity in various disease contexts, there is a paucity of data concerning macrophage heterogeneity across regenerative and fibrotic injuries in different tissue types. Focused analyses of macrophage phenotypic states in regenerating or fibrotic injuries can help identify novel macrophage subsets or signaling cascades that drive tissue regeneration and/or prevent fibrosis.
In this study, scRNA-seq data from two mouse models of regeneration (DTA and 2mm VML) and two mouse models of fibrosis (HO and 3mm VML) were integrated to study differences in macrophage transcriptional profiles in response to injury. We found that macrophages from the two regenerative models of different tissue types in different anatomic sites shared substantial transcriptional overlap and functional similarities characterized by enhanced macrophage-to-MPC crosstalk via platelet-derived growth factor (PDGF) signaling. Macrophages from both fibrotic models, on the other hand, exhibited separate transcriptional overlap and enhanced TGF-β signaling, supporting previous work from our lab and others 21,22. This data suggests that macrophages within regenerative environments are distinct from fibrosis-associated macrophages, and this variation in immune cells may represent a therapeutic target to prevent aberrant tissue healing.
METHODS
Experimental models
ScRNA-seq data of day 0, day 7, and day 14 mouse 2mm defect (regenerative) and 3mm defect (fibrotic) VML were downloaded from GSE163376 9. Additionally, scRNA-seq data from day 0, day 11, and day 14 mouse digit tip amputation (DTA; bone regeneration) and day 0, day 3, and day 7 HO (bone fibrosis) were downloaded from GSE143888 and GSE126060, respectively 21,23. Uninjured data includes uninjured macrophages from each dataset (Day 0 VML, Day 0 HO, and Day 0 DTA). Injured data were classified into two groups: early, which includes day 3 HO, day 7 VML, and day 11 DTA data; and late, which includes day 7 HO, day 14 VML, and day 14 DTA data.
Bioinformatic analysis of single cell sequencing data
Analysis of scRNA-seq data were performed using Seurat 24. All datasets underwent quality control filtering (mitochondrial content and unique feature counts) according original author specifications 9,21,23. For each dataset, the downstream analyses of normalization, identification of highly variable gene across cells, scaling based on UMI and batch effect, dimensionality reduction (PCA), unsupervised clustering and the discovery of differentially expressed cell type-specific gene markers were done separately following standard Seurat workflow. Clustering was done using dimensions of 1:30 and resolution of 0.1 for VML fibrotic cells and dimensions of 1:25 and resolution of 0.1 for VML regenerative cells. DTA data were clustered using dimensions 1:25 and resolution of 0.1. HO data were clustered using dimensions 1:25 and resolution of 0.075.
Cell type annotation and isolation
Macrophages were identified in each model using the canonical markers Adgre1 (i.e. F4/80) and Csf1r. Once each cluster was isolated, the single cell annotation R package, SingleR v1, was used to further confirm the identity of macrophage populations 25. Non-macrophage cell types annotated by SingleR were excluded. MPCs were identified using markers Prrx1 and Pdgfra 26,27. Additional cells were labeled using expression profiles of known markers.
Macrophage Integration Across Datasets
Macrophages extracted from the individual datasets were integrated using the Harmony v1 R package based on the top 50 PCA components identified to correct for batch effects 28. Default Harmony parameters were used. Downstream Seurat analysis of integrated macrophages was performed as stated above. Dimensions 1:25 and resolution of 0.15 were used to determine macrophage clusters. Furthermore, anchor-based Seurat integration and LIGER v1.0 were used in a similar fashion to further visually validate our data and confirm consistent integration results (Fig. S2) 24,29.
Analysis & visualization
Differential gene expression was calculated using standard parameters for the FindMarkers function in Seurat using both clusters (FL 1, FL 2, RL 1, RL 2, and RL 3) and injury state (uninjured, fibrotic and regenerative) as grouping factors. Only positive markers were identified. Differentially expressed genes (DEGs) with a fold change > 0.25 and p value < 0.05 (adjusted via Benjamini-Hochberg method) were considered significantly regulated when comparing clusters. Cell cycle prediction was calculated using the CellCycleScoring function in Seurat and regression was not performed. To assess differences in functional phenotypes between macrophages from regenerative and fibrotic conditions, we performed gene signature enrichment analysis (GSEA) using Gene Ontology (GO) and Kyoto Encyclopedia of Genes and Genomes (KEGG) pathways determined from significant DEGs between clusters and conditions. GO analysis was done using Enrichr web-based tool by submitting all significant DEGs between clusters and overlapping genes from each healing state 30. KEGG analysis was done with DAVID v6.8 by submitting all significant DEGs between each cluster 31. KEGG enrichment was determined significant at p < 0.1 and was adjusted using Benjamini-Hochberg method. Module scoring of enriched pathways was done with curated gene lists from KEGG pathways (Table S3) and added to sequencing data by using the native AddModuleScore function in Seurat. Overlapping gene profiles were determined by using FindAllMarkers function to find DEGs for macrophages compared to all other cell types. This was done using uninjured scRNA-seq data for each of the three tissue sources (muscle, bone, and tendon) and repeated using injured scRNA-seq data for the four injury outcomes (fibrotic healing – 3mm VML and HO, regenerative healing – 2mm VML and DTA). MacSpectrum algorithm was used to calculate macrophage polarization index (MPI) and activation induced macrophage differentiation index (AMDI) for each macrophage 32. Similar to previous literature, we used four categories to characterize our macrophages: M0 or pre-activation state (AMDI < 0, MPI < 0), M1 pre-activated (AMDI < 0, MPI > 0), M1-like cells (AMDI > 0, MPI > 0) and M2-like cells (AMDI > 0, MPI < 0) 32,33. CellChat v1.4 was used to determine cell-cell interactions between macrophages and MPCs and the pathways associated with these interactions 34. We followed the toolbox workflow and loaded normalized scRNA-seq data and Seurat metadata from each model into separate CellChat objects. CellChatDB.mouse and Secreted Signaling pathways were selected as the databases. Then, default parameters were used to determine probabilistic interactions between cells based on expression of putative ligand-receptor interaction pairs. The results were displayed as chord plots.
RESULTS
Macrophages from regenerative and fibrotic healing models are transcriptionally distinct
To characterize macrophage transcriptional states in regenerative and fibrotic healing, we analyzed in vivo mouse injury models in muscle and bone previously shown to heal by regeneration or fibrosis. DTA and HO models were used to study regenerative and fibrotic bone healing respectively, while 2mm and 3mm VML models were used to characterize regenerative and fibrotic muscle healing respectively (Fig. 1A). Following unsupervised clustering of each dataset, we used the unbiased cell annotation algorithm SingleR to identify macrophage populations 25, which were confirmed by expression of the canonical markers Adgre1 and Csf1r (Fig. 1B, Fig. S1). Since our data arise from various tissue types and inherently have differences in sequencing methodology, laboratory origin, and time points, we used Harmony to integrate all 11,515 macrophages into a single dataset, permitting analysis of biological variation without confounders 28. Uniform Manifold Approximation and Project (UMAP) plots of macrophages labeled by injury type demonstrated appropriate correction for batch effects following Harmony integration (Fig. 1C). Interestingly, despite different tissue types, there was substantial overlap in the phenotypic states of macrophages between the regenerative VML (2mm injury) model and the regenerative bone model (DTA) and separate overlap between the muscle fibrosis (3mm injury) and bone fibrosis (HO) (Fig. 1C). To verify our findings, we also integrated our macrophages using LIGER and Seurat, which showed similar overlapping populations 24,29 (Fig. S2). Unsupervised clustering of integrated macrophages demonstrated 5 clusters, each composed of macrophages from the four models (Fig. 1D). Macrophages from models of fibrotic healing (VML 3mm and HO) were primarily observed in two clusters, labeled as fibrotic-like (FL) 1 and FL 2 (Fig. 1E). Uninjured macrophages, irrespective of dataset, and macrophages from models of regenerative healing (VML 2mm and DTA) were primarily detected in 3 clusters, labeled regenerative-like (RL) 1, RL 2 and RL 3 (Fig. 1E). We then characterized each of the five subpopulations of macrophages by identifying differentially expressed gene markers to verify transcriptionally unique subpopulations (Fig. 1F–G). The top 25 DEGs based on average log2 fold change for each cluster are included in supplemental data (Table S1). FL 1 was enriched in macrophages expressing Irf7 and Ccl8, potentially mediating TGFβ1 response and aberrant stem cell differentiation 35,36. FL 2 expressed the markers Ly6c2, Chil3 and Plac8, representing a previously defined population of immature, inflammatory Ly6c-high monocytes associated with fibrotic healing in lung and liver tissue 37,38. RL 1 expressed previously known anti-inflammatory macrophage markers Selenop, Gdf15, Mrc1, and Egr1, which were highly enriched in environments that promote restoration of normal tissue 39–41.
Figure 1. Isolation and integration of macrophages from musculoskeletal injury models identifies five macrophage subpopulations.
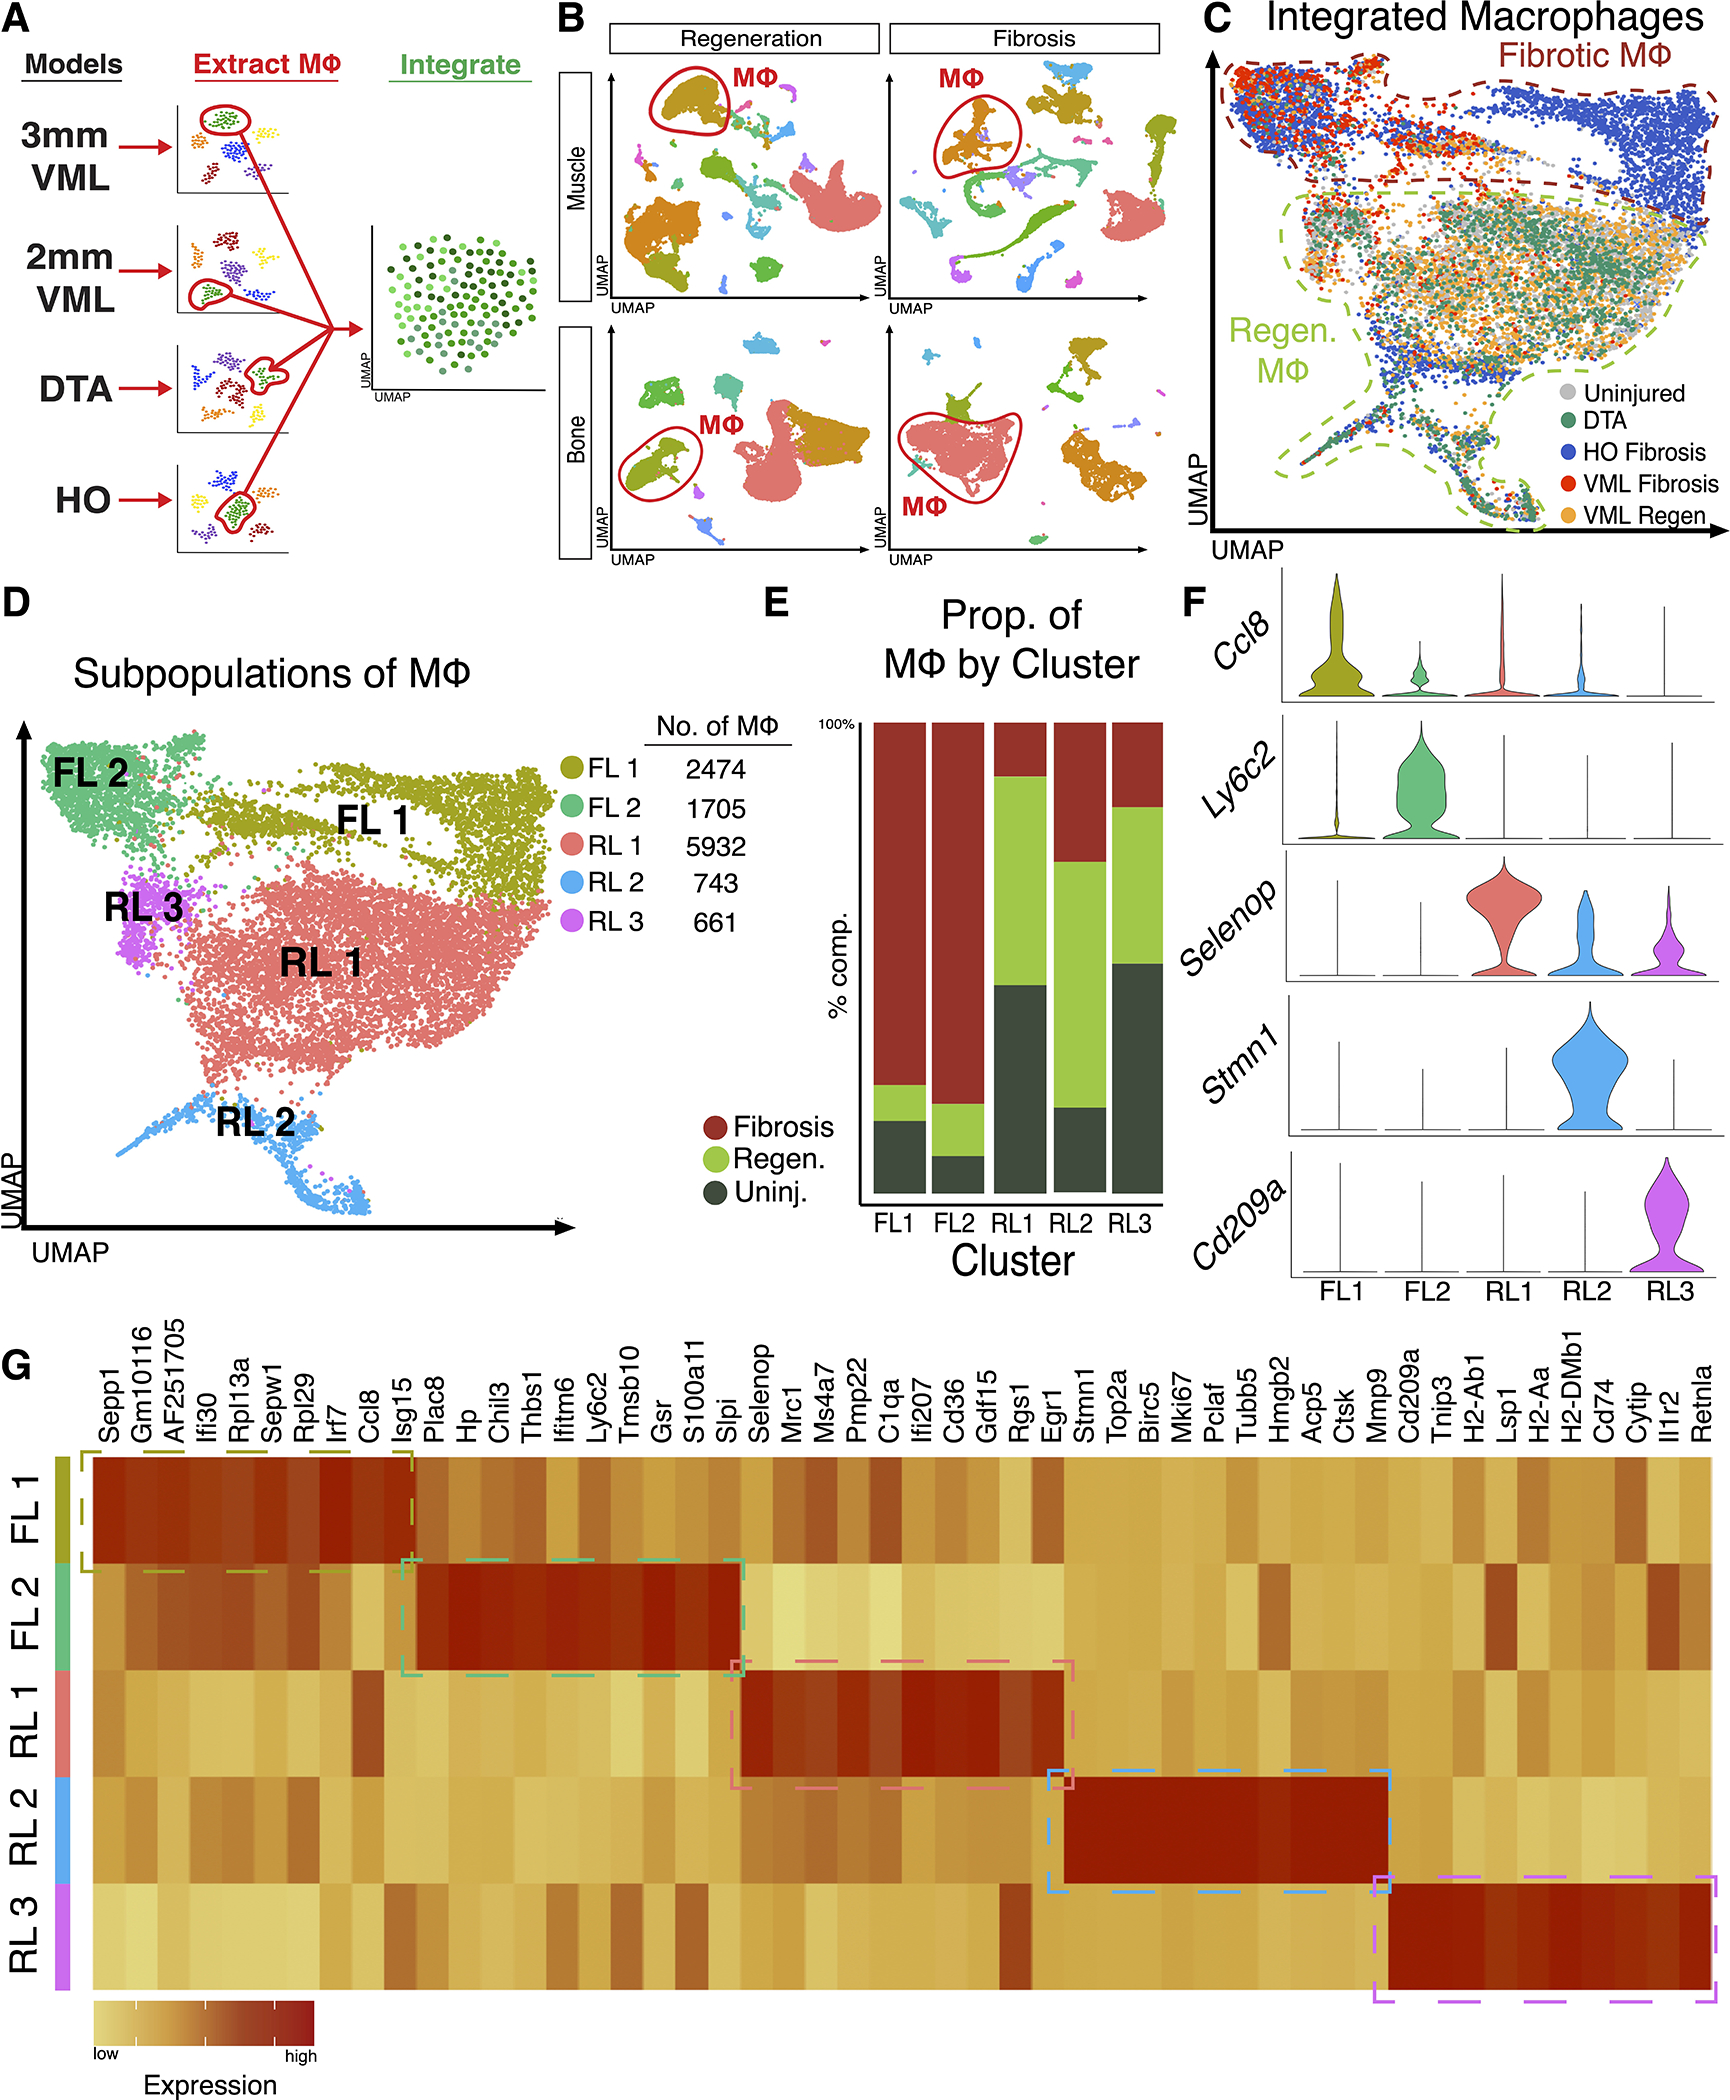
(A) Overview of workflow; Macrophages were identified from each of the four datasets (2 fibrotic and 2 regenerative), extracted, and integrated. (B) Identification of macrophages among other cells within injury microenvironment from each dataset using markers Adgre1 and Csfr1. (C) Despite different tissue types, integration of macrophages shows overlapping macrophages from regenerative conditions and a separate overlap of macrophages from fibrotic conditions. (D) Clustering analysis reveals five transcriptional distinct macrophage populations, 2 populations composed mostly of macrophages from fibrotic conditions (FL 1 and FL 2) and 3 populations composed mostly of macrophages from uninjured and regenerative conditions (RL 1, RL 2, and RL 3). (E) Analysis of cluster composition demonstrated a fibrotic macrophage dominance in clusters FL 1 and FL 2 and uninjured or regenerative dominance in clusters RL 1, RL 2 and RL 2. Clusters FL 1 and FL 2 were composed 77.0% and 81.0% of macrophages from fibrotic injuries, respectively. Cluster RL 1 was composed of an equal proportion of uninjured and macrophages from regenerative healing (44.3% each), Cluster RL 2 was enriched in regenerative macrophages (52.2%) and cluster RL 3 was composed of uninjured macrophages (48.8%). (F) Violin plots of select marker genes identifying enrichment of gene expression in each macrophage subpopulation. (G) Heatmap displaying top 10 differentially expressed genes for each cluster as determined by average log2 fold change.
Cluster RL 2 was enriched in expression of proliferative genes such as Stmn1, Top2a, and Mki67. Finally, cluster RL 3 expressed anti-inflammatory marker Retnla, along with various antigen presentation genes in the Cd209 family, representing a perivascular macrophage population 42. Notably, genes in the Cd209 family are down regulated by the pro-fibrotic ligand TGFβ1 43. In summary, our data suggest macrophages from fibrotic and regenerative environments occupy unique transcriptional niches, potentially suggesting variation in function.
Fibrotic-like and regenerative-like macrophages exhibit distinct functions and inflammatory states
Next, we assessed whether the distinct transcriptional programs of the macrophage subsets are underpinned by distinct biological functions relevant to regenerative or fibrotic tissue healing. Using EnrichR, GO analysis was performed as stated in methods. Bubble plot visualization of upregulated pathways identified unique functions for each macrophage cluster (Fig. 2A). Top 100 enriched GO biological pathways are included in Table S2. Similarly, GSEA using KEGG was done using DAVID 31. Complete list of significantly enriched (adj. p value < 0.1) KEGG pathways is included in Table S3. To further characterize the enrichment of signaling pathways in our clusters, we used gene lists developed from KEGG pathways (Table S4) to create modular scores. Dot plot visualization of modular scores demonstrated functional pathways enriched in uninjured/regenerative clusters (RL 1, RL 2, and RL 3) were not enriched in fibrotic clusters (FL 1, FL 2) (Fig. 2B–C). Notably, cluster RL 1 was enriched in genes related to MAPK and FoxO signaling, pathways known for roles in cytokine regulation and stem cell maintenance (Fig. 2B) 44,45. Cluster RL 2 was enriched in oxidative phosphorylation genes, demonstrating a role in metabolic shifts known to be increased in pro-regenerative macrophages 46. Pathway analysis of RL 3 suggested functional roles in NFκB and PI3K/Akt signaling, representing roles in pro-regenerative inflammatory signaling (Fig. 2B) 47,48. Finally, clusters FL 1 and FL 2 exhibited genes related to hypoxia-inducible factor 1 (HIF1) signaling and mTOR, pathways previously shown drive fibrotic healing in bone and muscle (Fig. 2C) 13,49. These results demonstrate an overlap in the functional programs amongst fibrotic conditions, which are separate from the overlap in functions observed amongst regenerative conditions. Additionally, our data suggests some functional similarities between uninjured and regenerative macrophages, indicating key functional similarities amongst homeostatic and regenerative tissue that are distinct from pathological fibrosis.
Figure 2. Characterization of macrophage subpopulations reveals distinct function and varied inflammatory states.
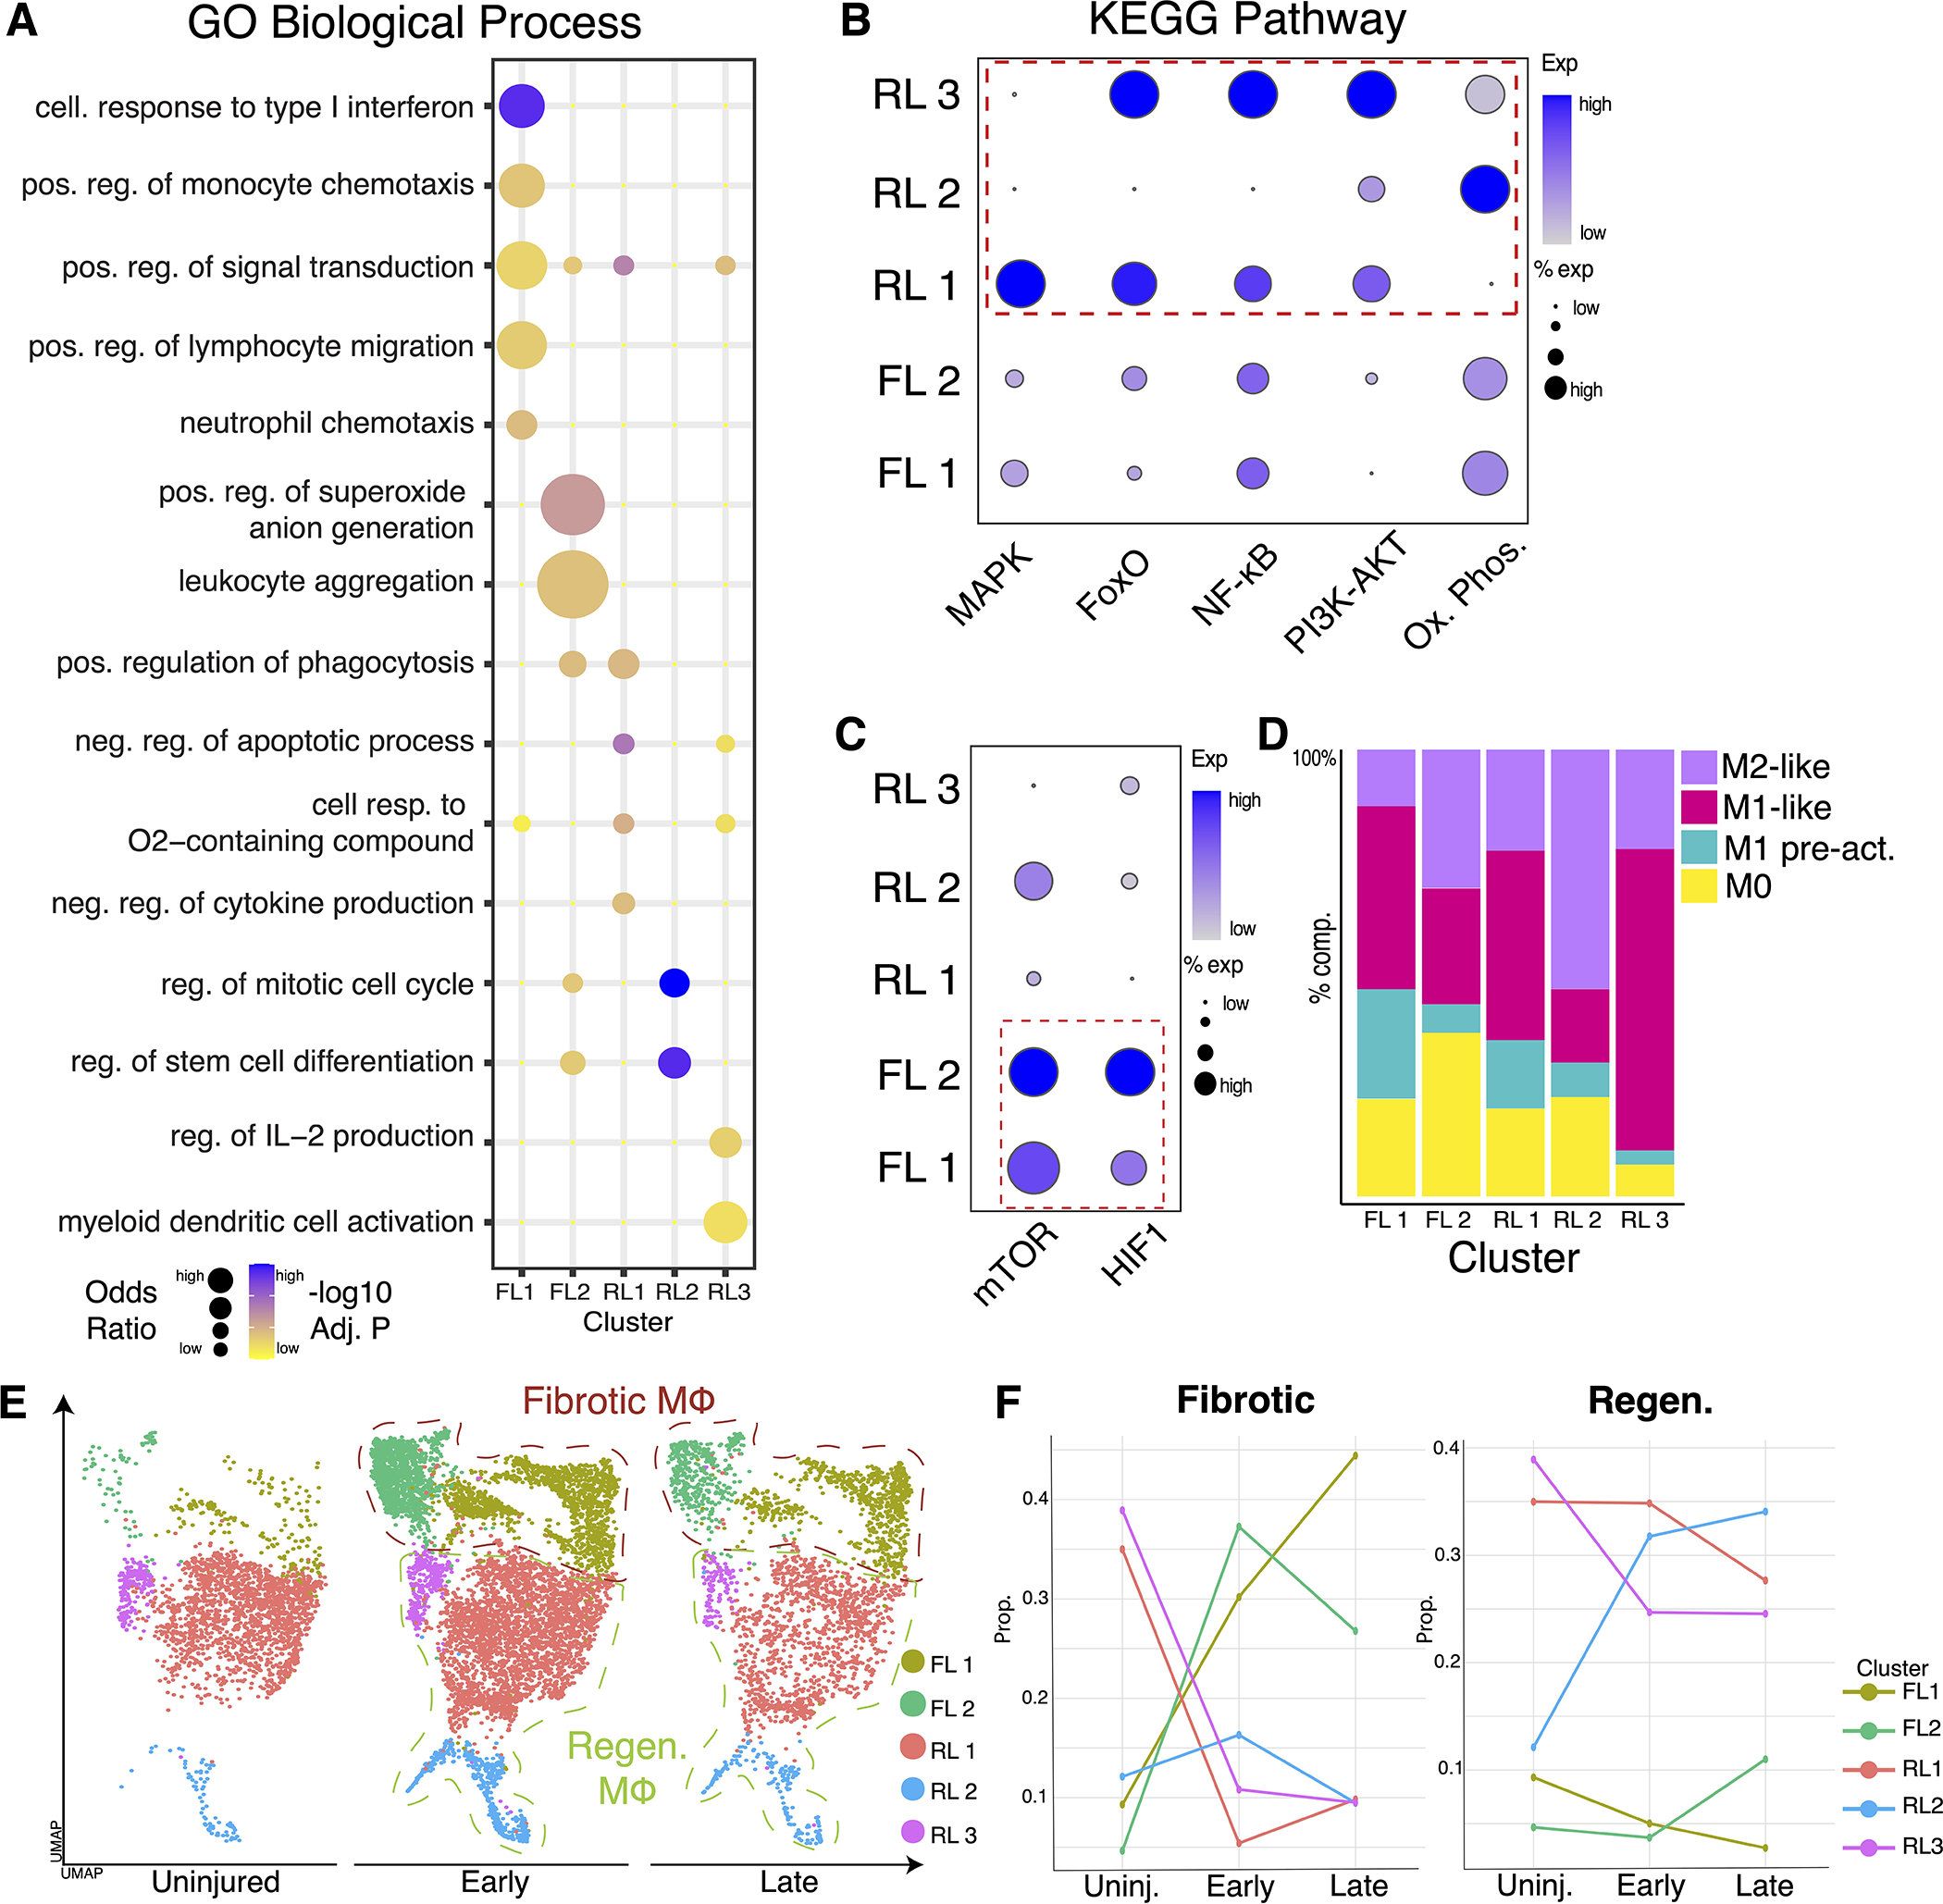
(A) Bubble plots of select GO biological process terms demonstrate variations in function for each macrophage cluster. (B) Dot plot visualization showing module scoring of KEGG terms using unbiased gene lists shows overlapping function between uninjured/regenerative clusters (RL 1, RL 2, and RL 3). (C) Module scoring showing fibrotic clusters FL 1 and FL 2 enriched in distinct pathways compared to uninjured and regenerative conditions. (D) Bar graph showing distribution of inflammatory states for each cluster of macrophages using MPI and AMDI scores from MacSpectrum. (E) UMAP plot displaying macrophage from three different timepoints present: uninjured, early (day 3 HO, day 7 VML, day 11 DTA), and late (day 7 HO, day 14 VML, and day 14 DTA). (F) Line graph demonstrating proportion of each cluster distributed by timepoint.
Next, we characterized the inflammatory (MPI) and activation (AMDI) states of our macrophages using the MacSpectrum gene enrichment tool 32. Both M1 and M2-like macrophages of various amounts were present in regenerative and fibrotic clusters, suggesting healing patterns are independent of macrophage inflammatory states (Fig. 2D). Complete MacSpectrum data aggregated by cluster can be found in Table S5. Furthermore, our data include various timepoints following injury in both regenerative and fibrotic models. Macrophages separated by each timepoint showed expansion from uninjured state (Fig. 2E), consistent with the inflammatory nature of injury. To assess the timeline of macrophage transcriptional divergence between regenerative and fibrotic states, the proportion of each macrophage cluster was calculated for each timepoint (Fig. 2F). The data indicate that macrophages in either fibrotic or regenerative models transition to transcriptionally unique fibrotic or regenerative macrophage subtypes, respectively, shortly after injury and persist in these states throughout the injury healing process. Therefore, while macrophage phenotypes are dynamic, healing outcomes are associated with specific transcriptional gene sets in macrophages that diverge rapidly after injury.
Direct comparison of fibrotic and regenerative macrophages reveals novel gene markers and upregulated signaling pathways
While identifying macrophage subpopulations helps to profile their heterogeneity and roles, it does not directly compare macrophages from various healing states. UMAP independent of dataset demonstrated overlap between uninjured and regenerative macrophages while fibrotic macrophages seem to occupy a distinct space (Fig. 3A). Since the analyzed macrophages are from different tissues, we next compared the transcriptomic profiles of uninjured macrophages from each dataset to establish commonalities. Using uninjured data, DEGs for macrophages compared to other cells were determined for each model. These genes represent the transcriptional profiles of uninjured macrophages from the uninjured quadricep (VML model), distal phalangeal bone and surrounding connective tissues (DTA model) or Achilles tendon (HO model). Analysis of DEGs found an overlap of 576 genes across all 3 models at the uninjured timepoint (Fig. 3B, Table S6), suggesting a greater transcriptional overlap between quadriceps muscle- and tendon-derived macrophages than between distal phalangeal bone and tendon or bone and muscle. Macrophages from the quadriceps and tendon models expressed the marker gene Mgl2, a known marker of skeletal muscle macrophages, while distal phalangeal region macrophages expressed the unique marker gene Fabp5 50. As expected, all macrophages at uninjured expressed the well-known marker Mrc1 (Fig. 3C).
Figure 3. Direct comparison of fibrotic and regenerative macrophages reveals novel gene markers and upregulated signaling pathways.
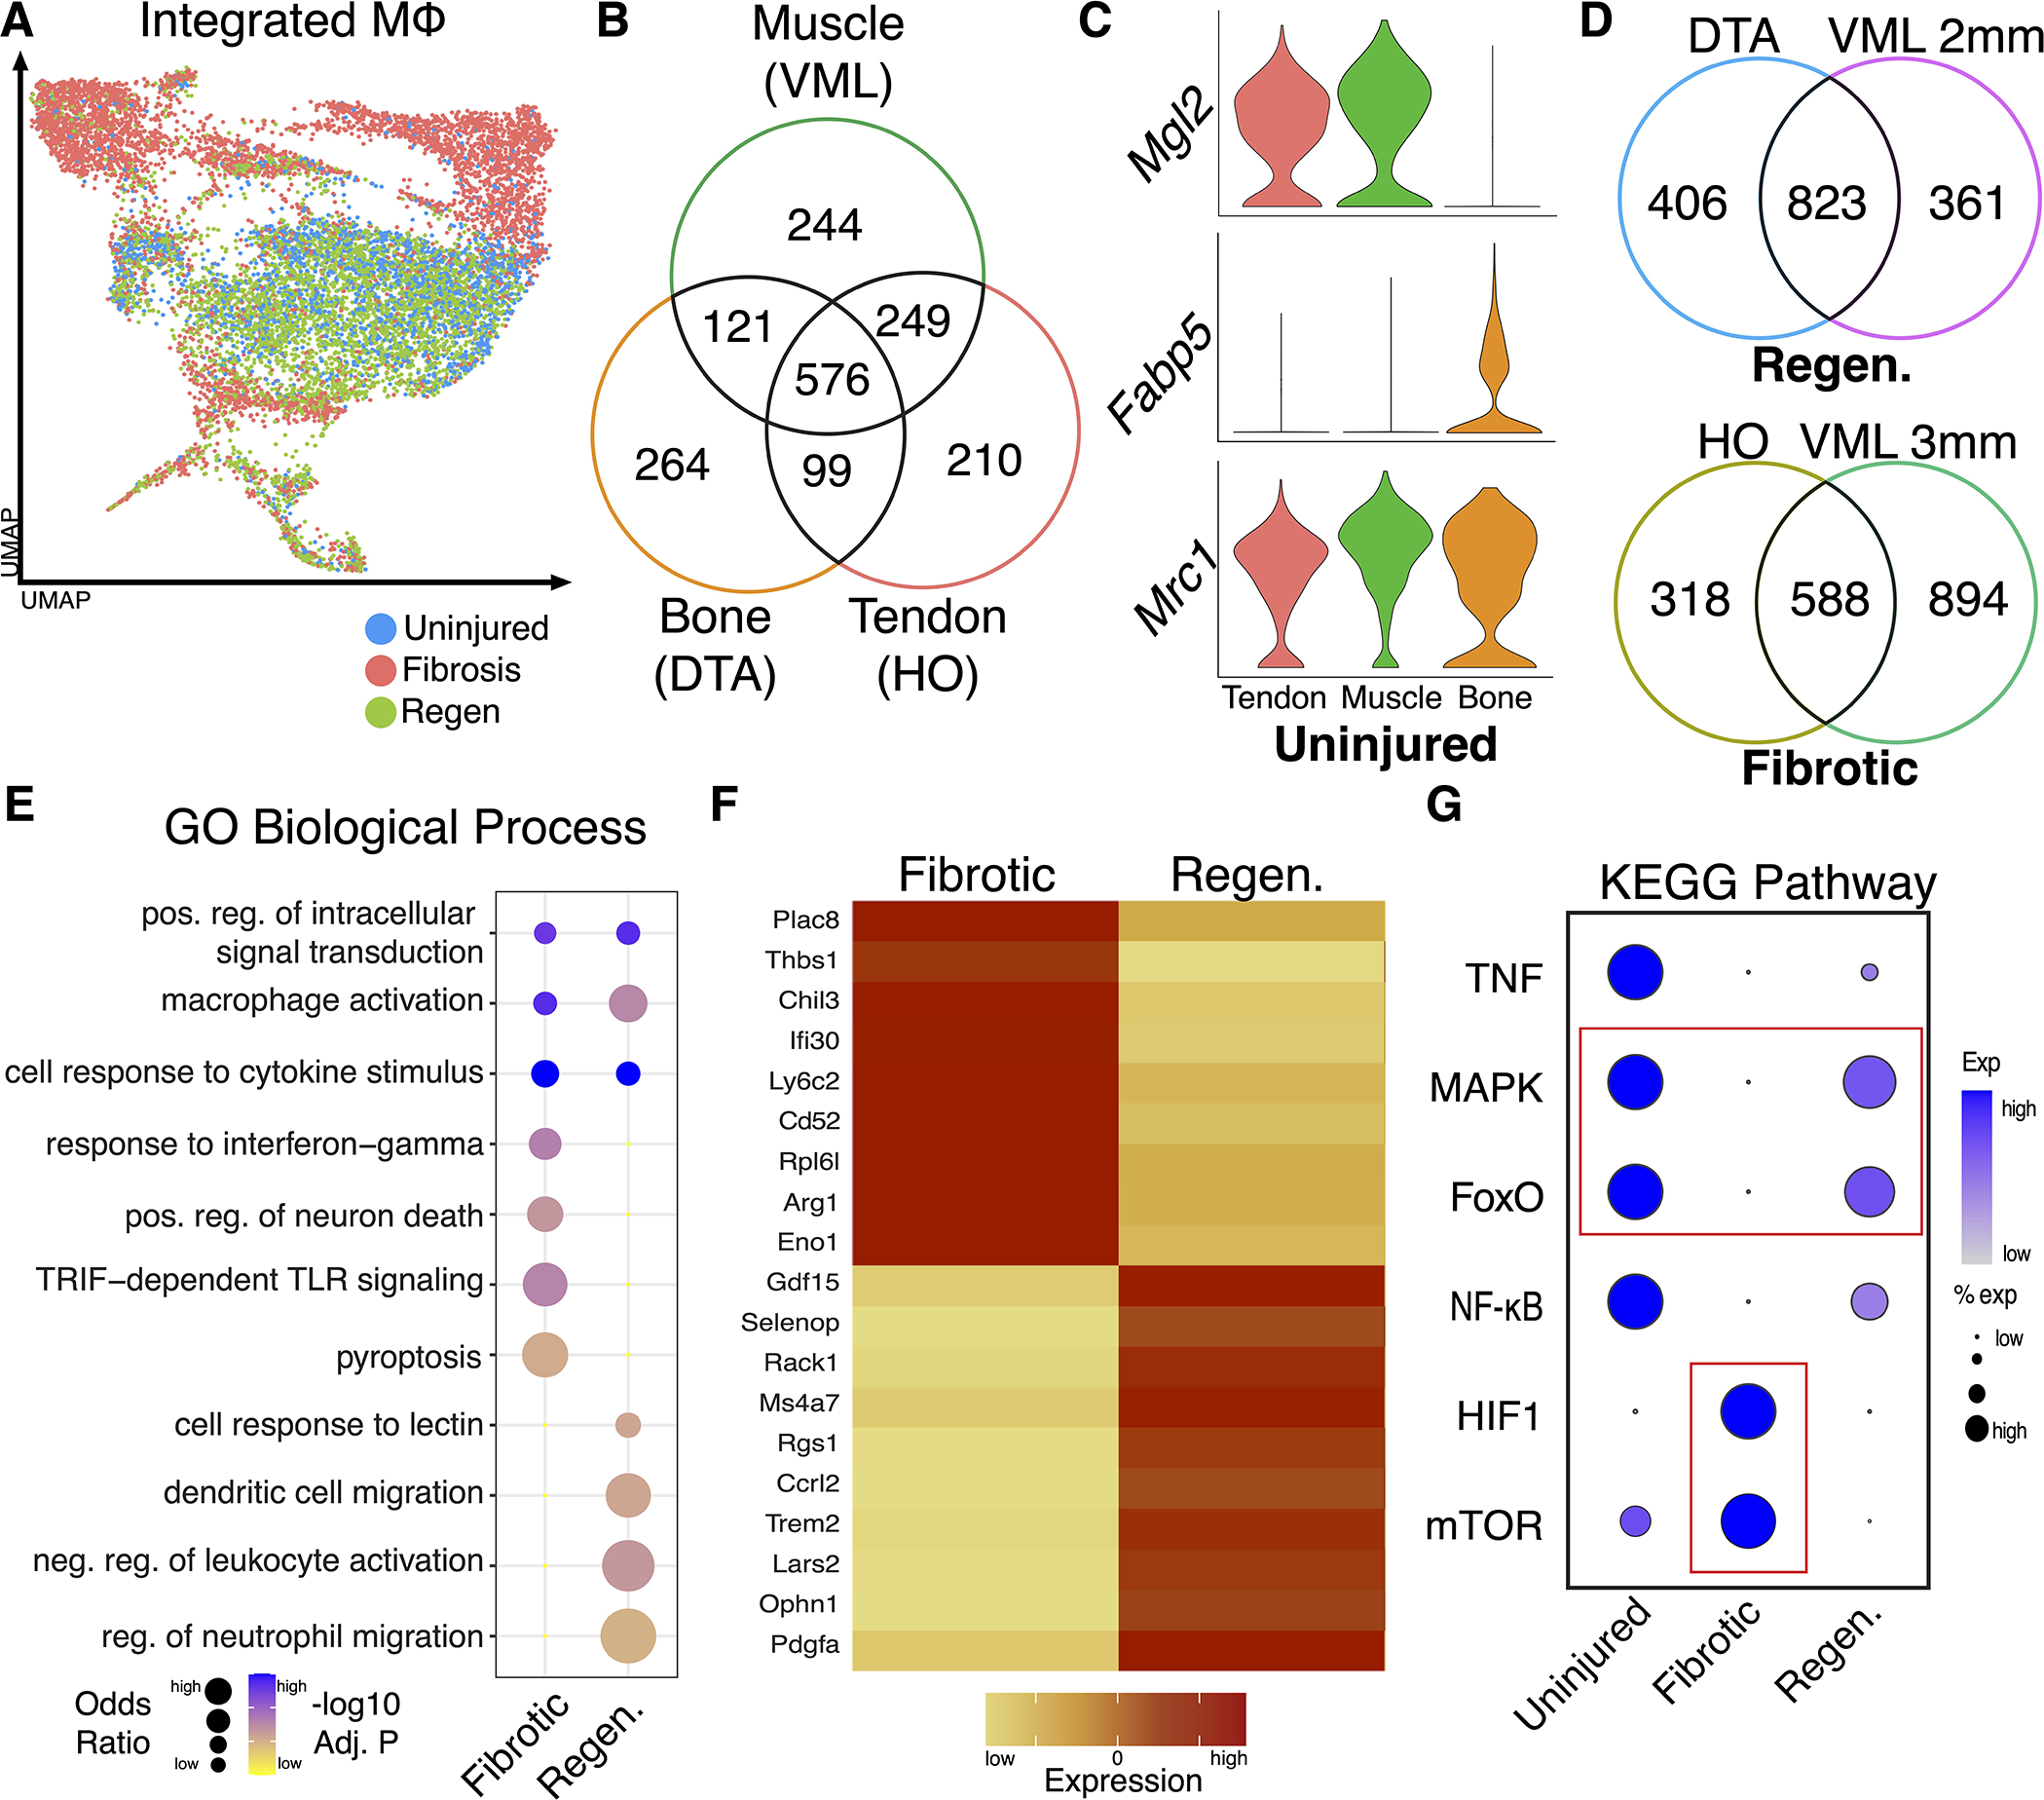
(A) UMAP displaying integrated macrophages highlighted by condition (uninjured, fibrotic and regenerative). (B) Analysis of uninjured macrophage gene expression identified 576 genes overlapping across all 3 models. (C) Violin plots showing expression of genes in uninjured macrophages: Mgl2 was highly expressed in macrophages from muscle (VML and HO), while macrophages from DTA expressed Fabp5. Macrophages from all 3 models expressed Mrc1. (D) Analysis of injured macrophage gene expression identified 823 (52%) of overlapping genes in macrophages from regenerative models and 588 (33%) overlapping genes in macrophages from fibrotic conditions. (E) Bubble plot of GO biological process activated in macrophages from fibrotic and regenerative environments. (F) Heatmap showing select marker genes for macrophages from fibrotic and regenerative environments, demonstrating distinct transcriptional features. (G) Dot plot visualization showing module scoring of KEGG terms using gene lists shows overlapping enrichment of pathways in uninjured and regenerative but not fibrotic macrophages.
We next identified unique and overlapping DEGs of macrophages in the two fibrotic healing models (HO and 3mm VML defect) and two regenerative healing models (DTA and 2mm VML). We found an overlap of 832 (52%) between DTA and regenerative VML (2mm) and an overlap of 588 (33%) genes between HO and fibrotic VML (3mm), suggesting shared transcriptional profiles in each healing condition (Fig. 3D). Using these overlapping macrophage genes from regenerative and fibrotic models, GSEA was performed using GO via EnrichR 30. Bubble plot visualization of GO biological process terms identified conserved and unique functions for macrophages in contrasting healing states (Fig. 3E). Macrophages from fibrotic healing activated pathways related to persistent inflammation and cell death, while macrophages from regenerative healing active pathways related to dendritic cell migration and resolution of inflammation. Furthermore, DEG analyses found expression of fibrotic and regenerative specific macrophage markers (Fig. 3F). Violin plots further demonstrated specific expression of additional fibrotic (Thbs1, Plac8, and Chil3) and regenerative (Ophn1, Pdgfa and Mrc1) macrophage markers (Fig. S3). To identify variations in signaling pathways across the healing states, we performed pathway analysis using KEGG derived gene lists (Table S4), as done above. The modular scoring data demonstrated an overlap in FoxO and MAPK pathways within uninjured and regenerative macrophages that was not present in fibrotic macrophages. Additionally, expression of HIF1 and mTOR signaling was restricted to fibrotic macrophages (Fig. 3G). Taken together, these data demonstrate shared features of macrophages leading to fibrotic healing and a separate overlap of features in macrophages leading to regenerative healing.
Receptor/ligand analysis of macrophage-MPC crosstalk shows enhanced expression of platelet derived growth factor signaling in regenerative conditions
Macrophage-MPC crosstalk is vital for driving healing patterns 51,52. To determine differences in cell-cell signaling in contrasting healing states, we analyzed ligand-receptor interactions between macrophages and MPCs using CellChat 34 (Table S7). We identified MPCs in each model using genes Prrx1 and Pdgfra 26,27 (Fig. 4A). Fibrotic conditions (3mm VML and HO models) exhibited MPC-macrophage signaling via the TGF-β pathway which was not found in the regenerative conditions (Fig. 4B). This supports previous work by our laboratory and others demonstrating that macrophage TGFβ1 production regulates fibrosis 21,22. In contrast, DTA and regenerative (VML 2 mm) models demonstrated enhanced platelet derived growth factor (PDGF) signaling between macrophages and MPCs (Fig. 4C). Fibrotic VML (3 mm) and HO microenvironments showed PDGF ligand-receptor interactions from non-immune cells to MPCs, but no signaling from macrophages. An analysis of PDGF ligand-receptor contribution in shows Pdgfa-Pdgfrb as the primary interaction in both regenerative models (Fig. 4D–E). Taken together, these results demonstrate that the distinct transcriptional programs observed in fibrotic vs regenerative macrophages result in distinct cell-cell signaling patterns towards MPCs. This potentially identifies a mechanism by which regenerative vs fibrotic healing occurs.
Figure 4. Receptor/ligand analysis shows increased macrophage PDGF signaling to MPCs in regenerative, but not fibrotic conditions.
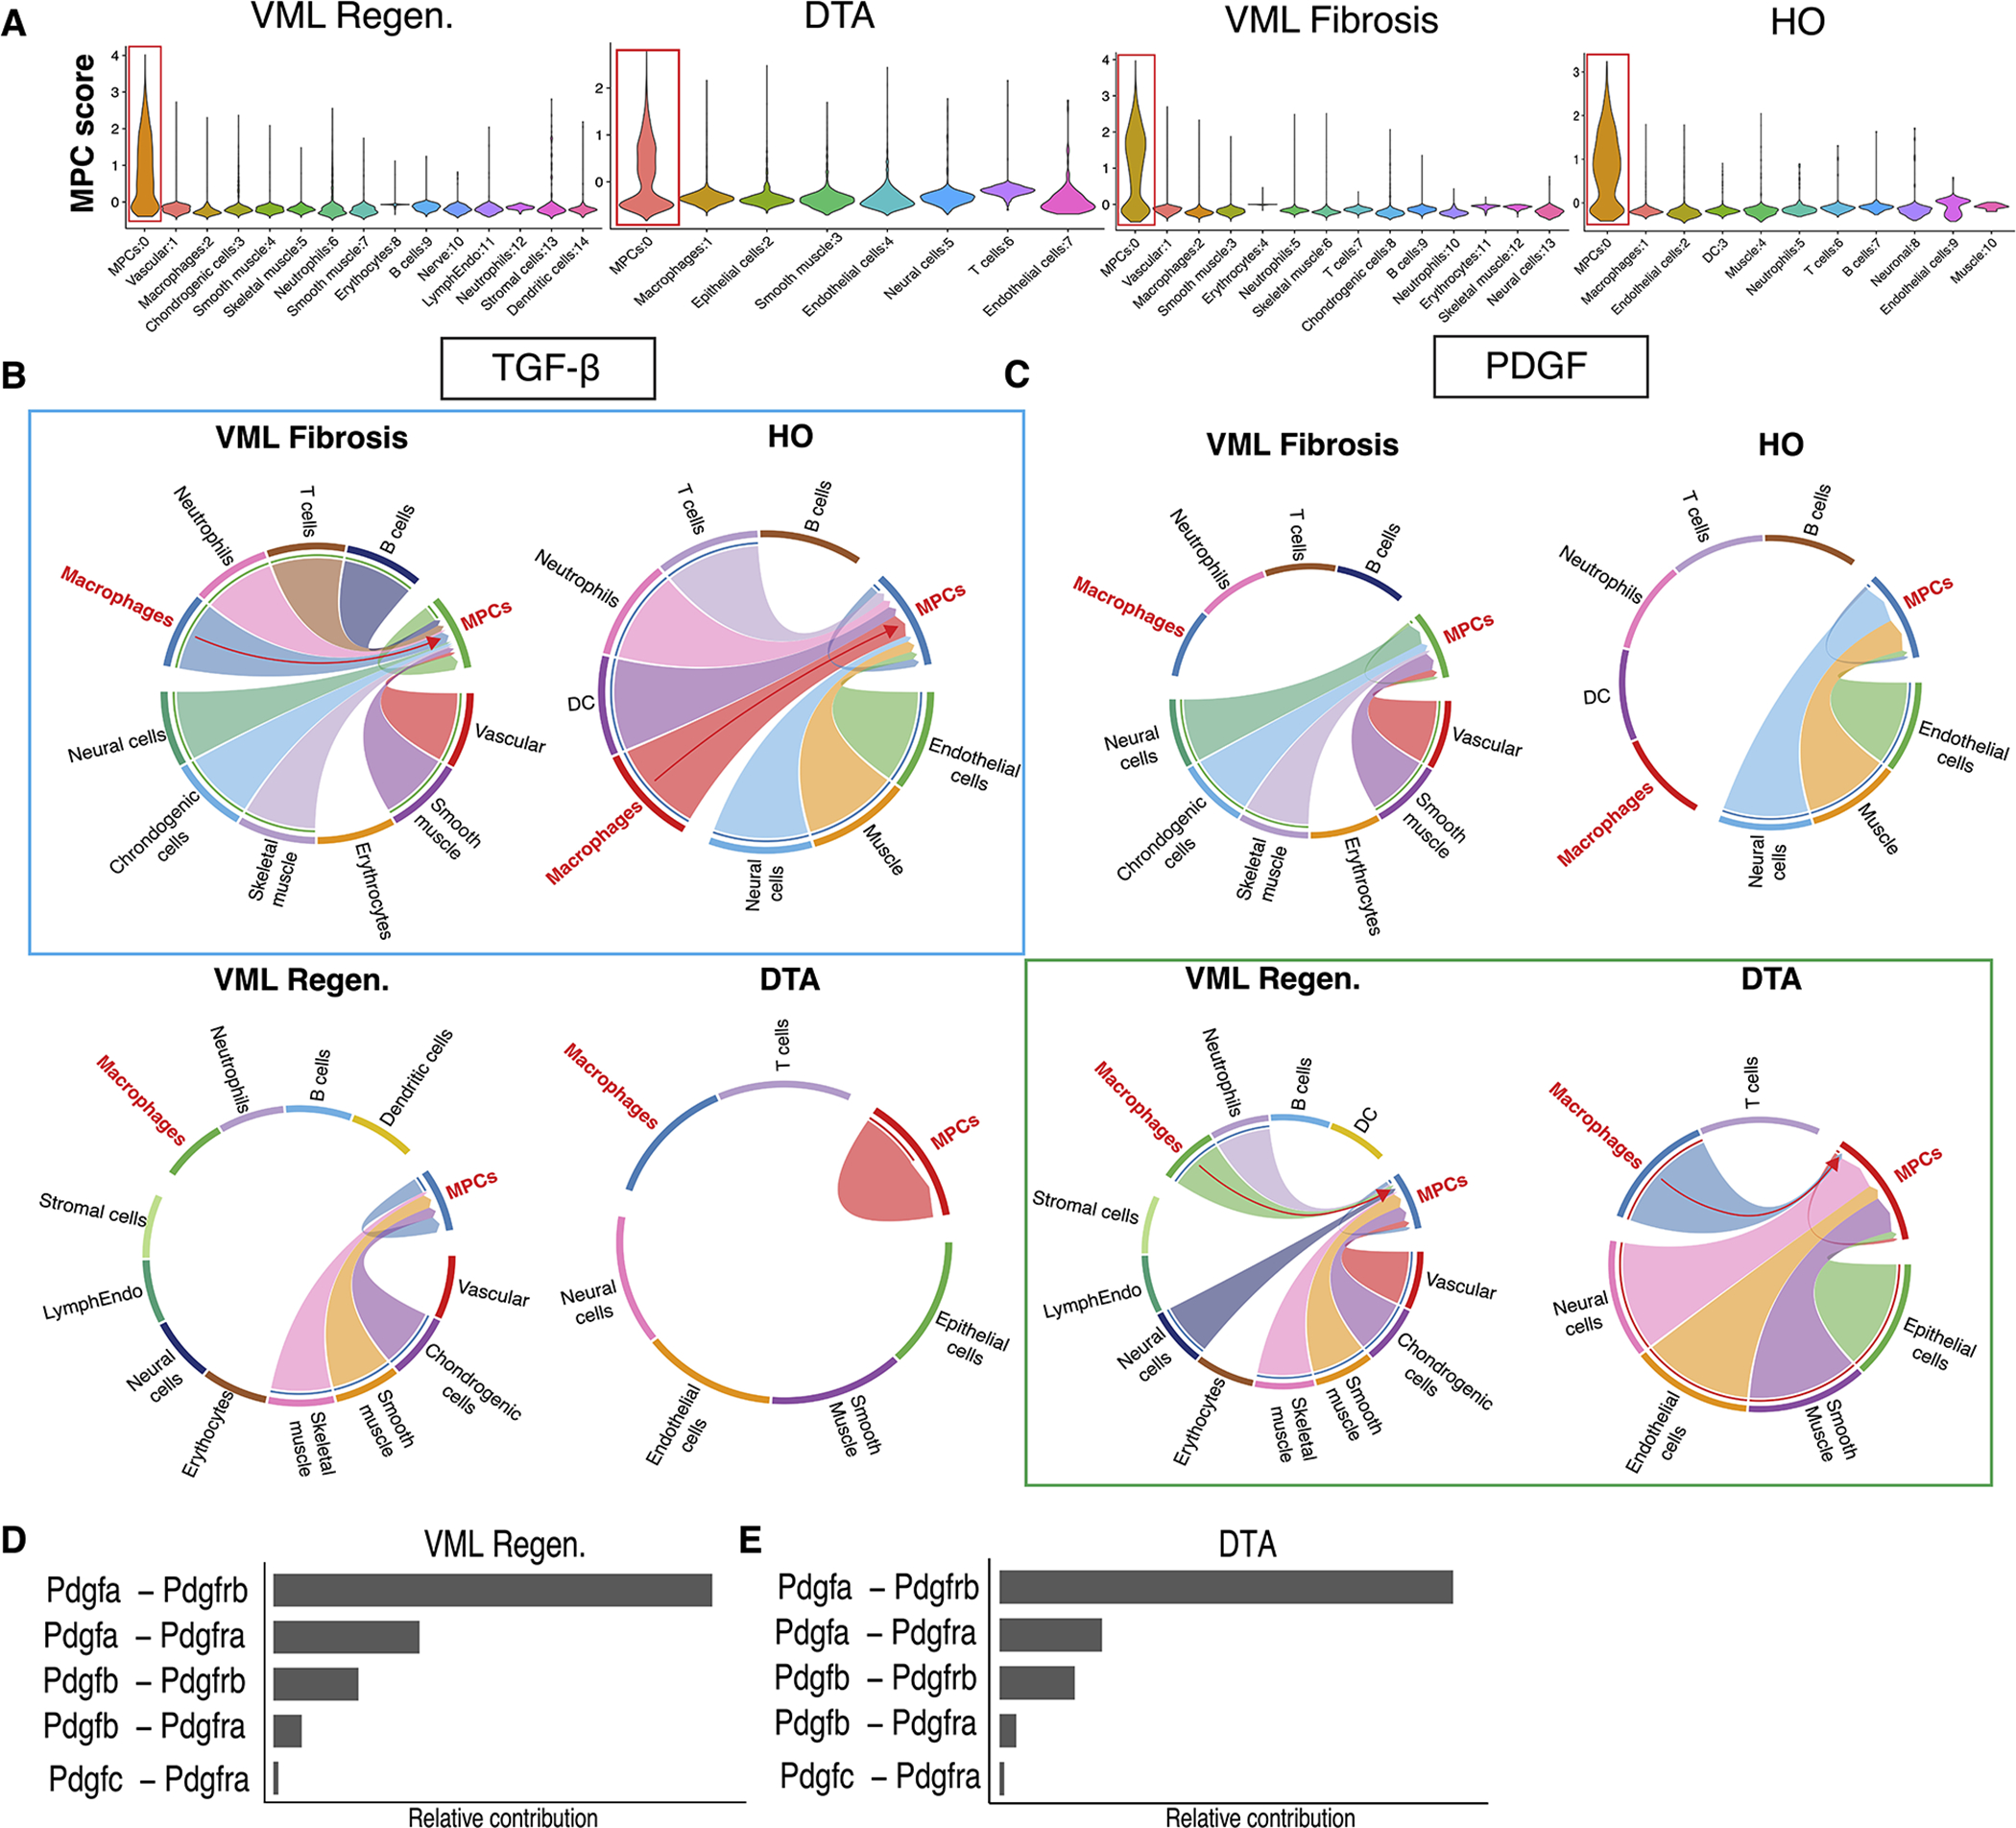
(A) Violin plots showing the identification of MPCs using Prrx1 and Pdgfra expression in each of the four injury conditions. (B) Receptor/ligand analysis using CellChat shows macrophage TGF-β signaling to MPCs in both fibrotic injury models (3mm VML and HO, highlighted in blue). (C) Increased macrophage PDGF signaling to MPCs in regenerative injuries (2mm VML and DTA, highlighted in green) which is not present in macrophages from fibrotic models. (D) Bar graph demonstrating relative contribution of PDGF ligand-receptor pairs in regenerative (2mm) VML model and (E) DTA.
Macrophage PDGF signaling causes variation in regenerative and fibrotic MPC PDGF signaling cascades
To interrogate signaling patterns associated with macrophage-MPC crosstalk, further analysis on feature expression was conducted. Macrophages demonstrated enhanced expression of Tgfb1 in both injury conditions compared to uninjured, with fibrotic macrophages expressing more of the ligand (Fig. 5A). Ligands Tgfb2 and Tgfb3 showed limited expression in macrophages (Fig. S4). Within the MPCs, the TGF-β receptors, Tgfbr1, Tgfbr2 and Tgfbr3, were found to be expressed greater in fibrotic conditions than uninjured or regenerative (Fig. 5B, Fig. S4). In contrast, macrophages from regenerative models (DTA and 2mm VML) exhibited Pdgfa expression, which was not observed in macrophages from fibrotic models (Fig. 5C). Pdgfb was expressed in only regenerative VML macrophages, while Pdgfc and Pdgfd were expressed lowly in all macrophage populations (Fig. S4). Pdgfra is a well-established gene marker for MPCs, and was expectedly expressed by MPCs from all conditions 27. Interestingly, Pdgfrb exhibited increased expression in MPCs from uninjured and regenerative models compared to MPCs from fibrotic models (Fig. 5D). Analysis of TGF-β and PDGF ligands in regenerative-like and fibrotic-like macrophage subsets further corroborated that fibrotic clusters (FL 1 and FL 2) exhibit pronounced TGF-β ligand expression and regenerative clusters (RL 1 and RL 2) exhibit the strongest PDGF ligand expression (Fig. 5E). Analysis of PDGF and TGF-β ligands by timepoint confirmed upregulation in early and late timepoints (Fig. 5F).
Figure 5. Macrophage PDGF signaling causes variation in MPC PDGF signaling cascades.
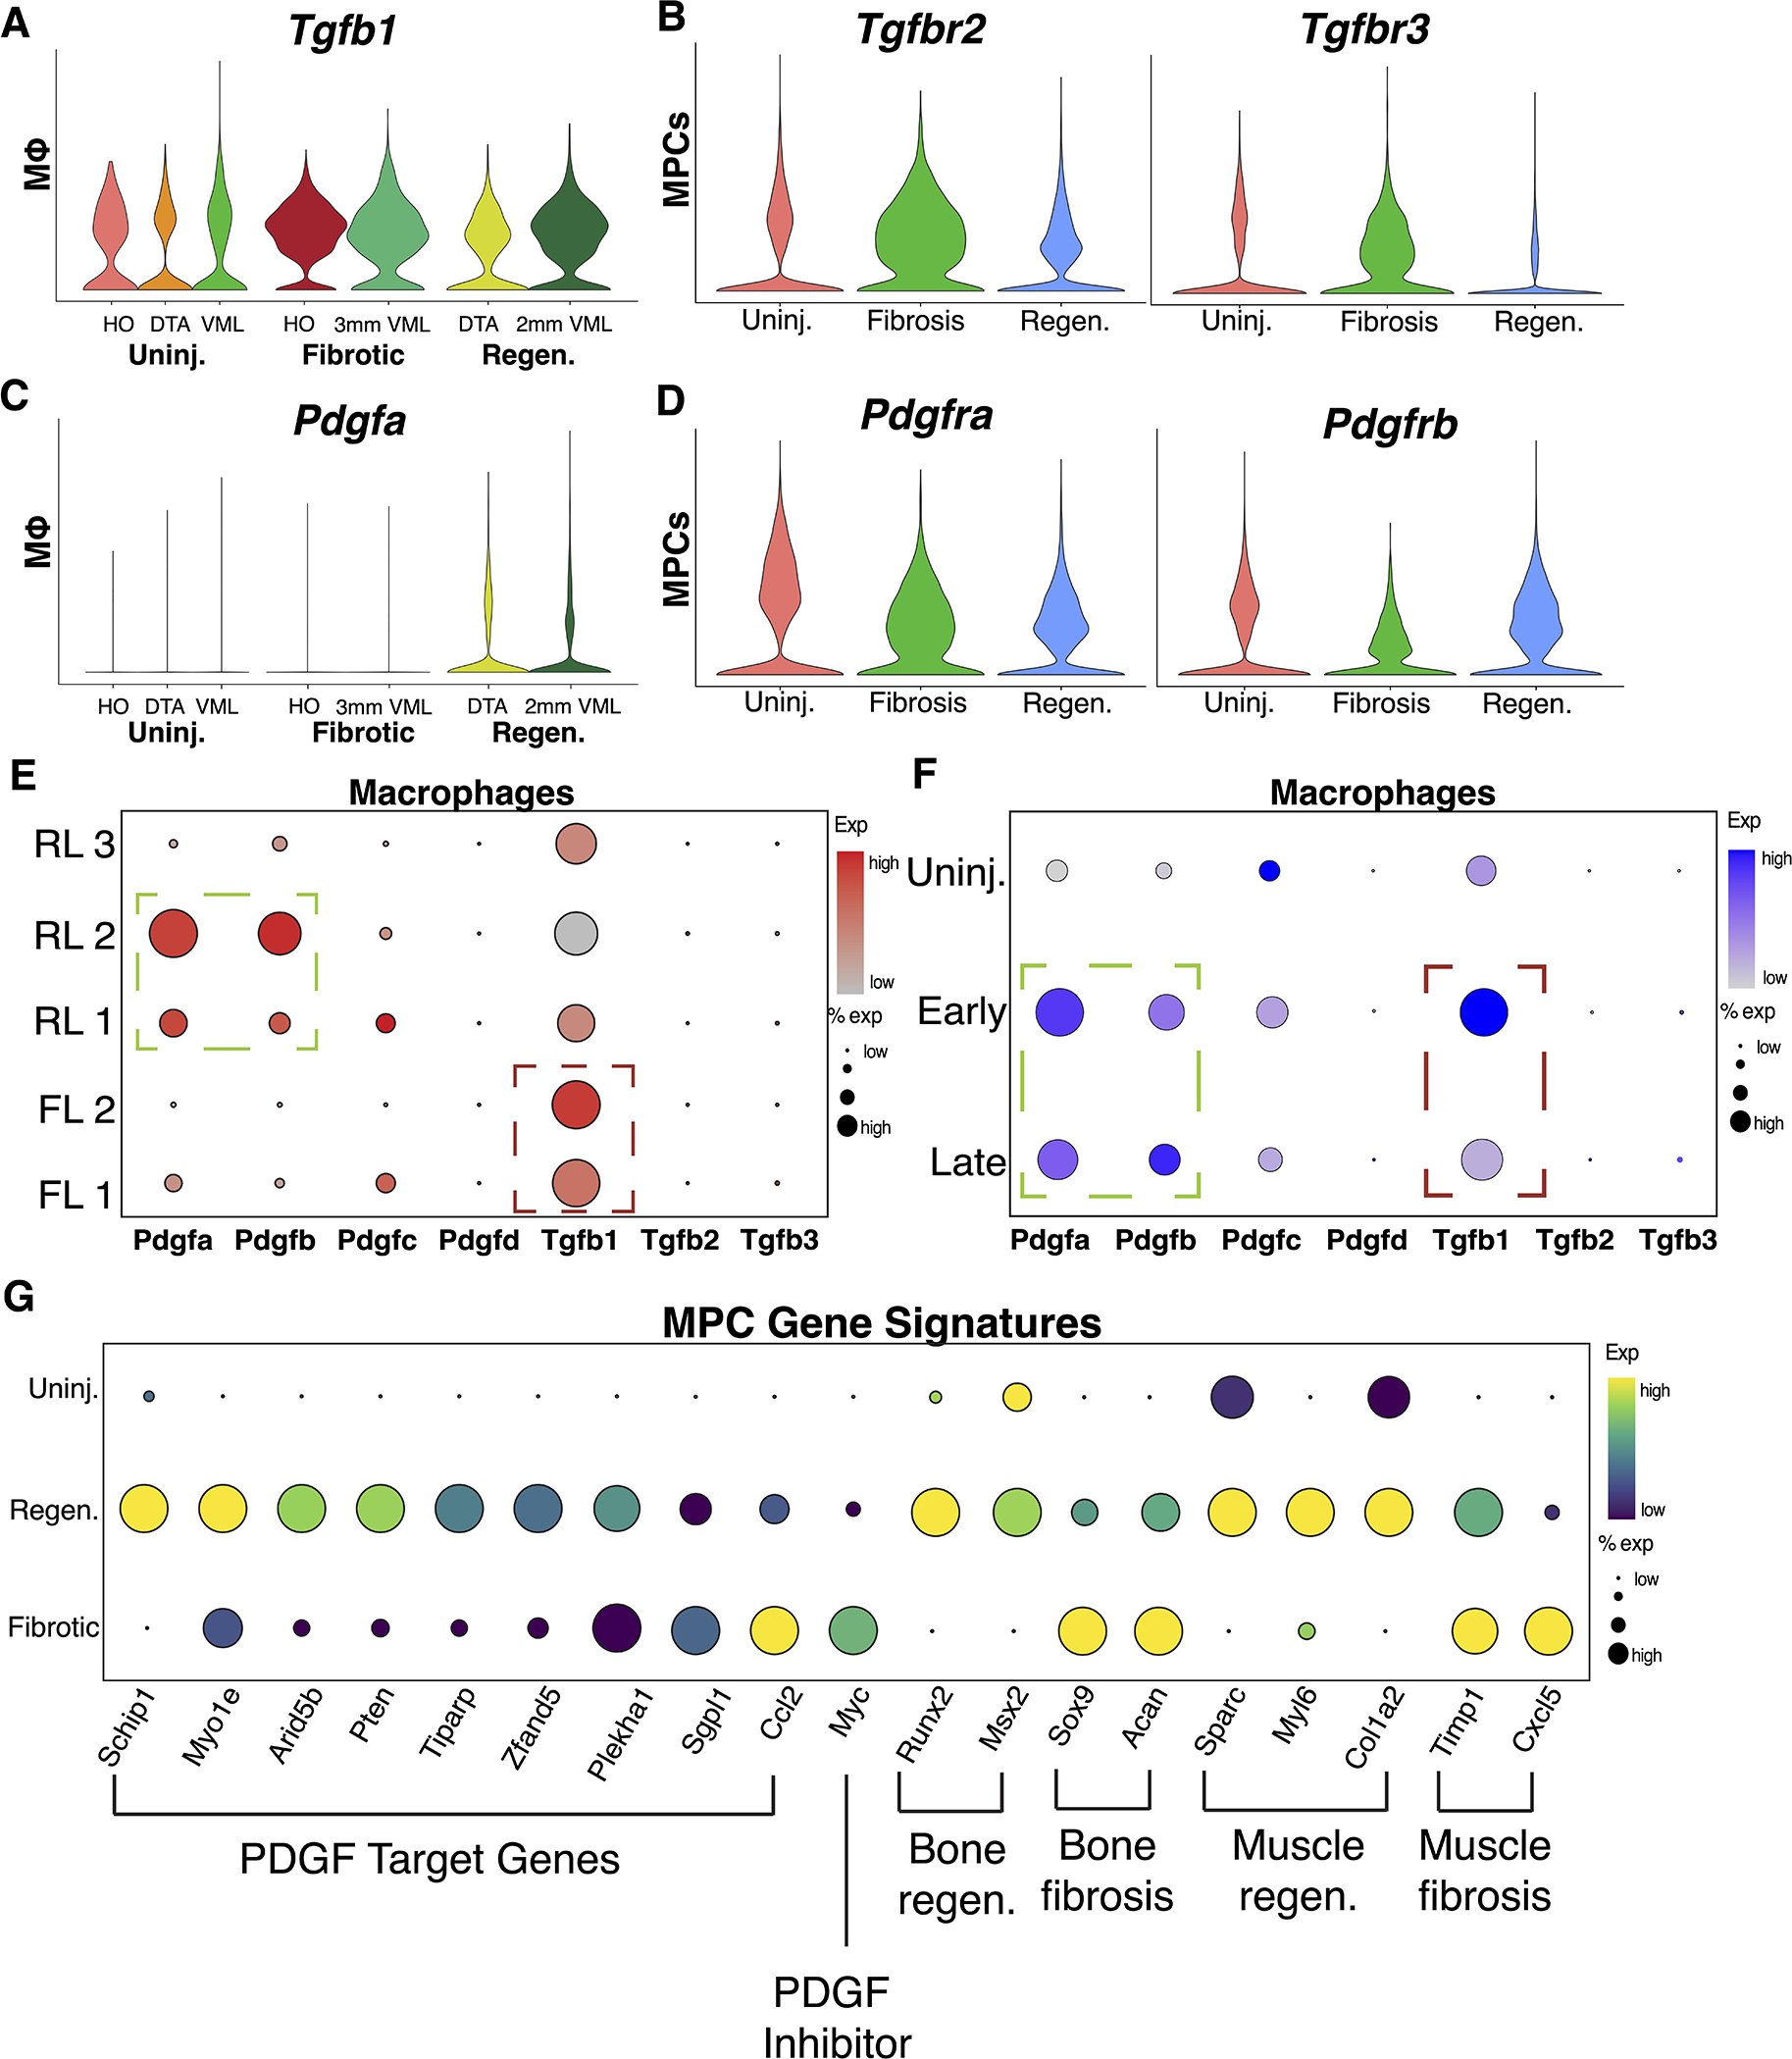
(A) Violin plots showing increased gene expression of ligand Tgfb1 in macrophages and (B) receptors Tgfbr1 and Tgfbr2 in MPCs from both fibrotic models. (C) Violin plots showing increased gene expression of ligand Pdgfa in macrophages and (D) receptors Pdgfra and Pdgfrb in MPCs from both regenerative models. (E) Dot plot visualization demonstrating localization of PDGF and TGF-β ligand expression to specific subpopulations of macrophages. (F) Dot plot visualization demonstrating PDGF and TGF-β ligand expression by uninjured, early, and late macrophages. (G) Dot plot visualization of PDGF target genes and markers of regenerative and fibrotic differentiation patterns in bone and muscle.
Next, we identified the effect of macrophage PDGF ligands on MPC activation by analyzing MPC gene signatures. MPC PDGF signaling leads to MPC proliferation and differentiation 53. Furthermore, intracellular PI3K/Akt signaling has been shown to be a positive regulator of PDGF receptor signaling 54. Using a KEGG pathway derived gene list for PI3K/Akt signaling (Table S4), modular score was calculated and compared across MPCs from uninjured, fibrotic, and regenerative conditions. We found that PI3K/Akt signaling was enriched in uninjured and regenerative MPCs, but not fibrotic MPCs (Fig. S4). The data suggest activation of PI3K/Akt genes in regenerative conditions, potentially reflecting greater PDGF-induced signaling. To assess MPC proliferation, we used the CellCycleScoring function in Seurat. Dot plots demonstrated increased activation of genes related to synthesis (S score) and G2/M (G2M score) phases in MPCs from regenerative conditions when compared to uninjured and fibrotic, suggesting increased mitotic activity (Fig. S4). To identify downstream effects of PDGF signaling, we evaluated expression of previously identified PDGF target genes in MPCs 55. We observed markedly stronger transcript levels of PDGF target genes in regenerative MPCs compared to fibrotic MPCs (Fig. 5G). Myc, a gene known to inhibit PDGF signaling was enriched in fibrotic MPCs 56. Next, we assessed the expression of markers relevant to tissue healing in MPCs. Bone regeneration in DTA occurs via intramembranous ossification, while bone fibrosis (HO) has shown to occur via endochondral ossification 10,57. The osteogenic markers Runx2, and Msx2 exhibited increased expression in regenerative MPCs, whereas chondrogenic markers Sox9 and Acan were increased in fibrotic MPCs (Fig. 5G). Regenerative MPCs also expressed Sparc, Myl6, and Col1a2, similar to previously studied transcriptomes of pro-regenerative MPCs in muscle 58 (Fig. 5G). In contrast, fibrotic MPCs showed enrichment in Timp1 and Cxcl5, markers of adipogenic MPC populations in muscle, potentially related to aberrant differentiation (Fig. 5G) 59. These results demonstrate that macrophage-derived PDGF ligands orchestrate downstream PDGF activation and associated target gene signatures primarily in regenerative models, not in fibrotic models.
DISCUSSION
Understanding post-traumatic regeneration is necessary to devise clinical strategies to prevent tissue fibrosis and restore functionality. Extreme examples of regeneration occur in amphibians, which can regenerate a fully functional limb 60. Macrophages have been shown to be necessary for regeneration in amphibians but their specific profiles have been incompletely characterized 17,61. In this study, we directly compared musculoskeletal macrophages from regenerative mouse models (2mm VML and DTA) and fibrotic mouse models (3mm VML and HO) using scRNA-seq.
The identification of five unique macrophage subpopulations supports the growing body of literature that there is a spectrum of macrophage activation rather than the traditional two subset model of polarized macrophages (M1 vs M2) in vivo. The five subpopulations expressed novel gene markers, identifying potential roles for driving healing outcomes. Fibrotic-like clusters FL 1 and FL 2 were enriched in HIF1 signaling genes. Uncontrolled pro-inflammatory signaling causes increased metabolic demand, inhibiting proliferation, and shifts macrophages to engage the HIF1 transcriptional program for continued insult response 62. In contrast, cluster RL 2, enriched in macrophages from regenerative conditions, expressed genes related to macrophage proliferation. This proliferative subpopulation may represent self-renewing tissue macrophages, functionally similar to uninjured macrophages as demonstrated by the overlap in pathway activation, with the ability to appropriately mediate the inflammatory response 63,64.
Our study also identified DEGs in fibrotic and regenerative macrophages. Fibrotic macrophages in both bone and muscle expressed Thbs1 (encoding thrombospondin-1 [TSP1]). TSP1 is highly expressed in inflammatory macrophages and a known activator of TGF-β signaling 65,66. Work from our lab and others have shown macrophage TGF-β ligands associated with bone fibrosis 21. Here, we demonstrate muscle fibrosis is also associated with macrophage TGF-β expression. Immune microenvironments with high levels of TSP1 expressing macrophages may positively regulate TGF-β signaling and induce fibrotic changes within tissue. Previous research has characterized TSP1 role in pathological states similar to fibrosis, such as tissue limb ischemia necrosis 67. Furthermore, macrophage TSP1 interacts with both CD47 and CD36 to inhibit angiogenesis, potentially driving the hypoxic phenotype observed in fibrosis 68. In regenerative macrophages, Mrc1, known marker of anti-inflammatory macrophages, was found to be constitutively expressed when compared to fibrotic macrophages. Research has shown a particular subset of Mrc1+ macrophages with high proliferation rates present in cardiac muscle which were protective of age related cardiomyocyte fibrosis 69. Our findings support this published data that Mrc1+ are associated with regenerative, rather than fibrotic healing.
To gain a better understanding of cell-cell interactions within the various injury environments, ligand-receptor crosstalk was investigated. Our study identified a macrophage-to-MPC platelet derived growth factor signaling axis upregulated in regenerative muscle (VML 2mm defect) and distal digit tip. More specifically, PDGFA is a known mitogen for mesenchymal progenitor cells and has shown to be a component of the macrophage secretory products 70,71. Our data support recent work showing consistently elevated levels of PDGF and lower levels of TGF-β contributed to tenocyte regeneration without fibrosis 72. While PDGF signaling to MPCs is present from other cell types in both fibrotic and regenerative environments, we hypothesize that macrophage dependent PDGF plays a critical role in driving regenerative outcomes.
One limitation of our study is related to the integration of multiple scRNA-seq datasets from different studies. Here, we used Harmony for scRNA-seq data integration however, computational data integration does not guarantee that all effects were minimized. This risk is mitigated through verification of a strong segregation between fibrotic and regenerative macrophages using other available integration methods (LIGER and Seurat). In addition, receptor/ligand interaction as identified through CellChat are inferred through average gene expression and probability of interaction. While the both 2mm and 3mm injuries within the VML model undergo a component of muscle fibrosis and regeneration, the 3mm defect demonstrates a lasting inflammatory response, leading to delayed regeneration 9. Our work identifies a potential cause of this variation using macrophages as the foundation. As shown, macrophage divergence occurs early following injury and thereby has the potential drive healing outcome through cell interactions. While the work here is limited to computational analyses and predictions that furthers the understanding of macrophage biology, it provides the basis for additional hypothesis testing. Further research in this field may lead to the development of a clinical score for macrophage phenotypes that could be used to predict healing response patterns soon after injury.
Supplementary Material
Supplemental Figure 1 Identification of macrophages from four datasets using canonical markers Adgre1 and Csfr1. (A-D) Violin plots showing cluster specific expression of macrophage specific marker genes for each dataset. (E) Violin plots showing Cluster 5 expressing both macrophage marker genes was excluded from our macrophage population due to the high gene expression of neutrophil markers S100a9 and S100a8.
Supplemental Figure 2 Integration of macrophages from unique environments demonstrates consistent overlap regardless of method. (A) UMAP plot of integrated macrophages following LIGER protocol demonstrates overlap of macrophages from fibrotic conditions and separate distinct overlap of macrophages from regenerative conditions. (B) UMAP plot of integrated macrophages following Seurat integration protocol demonstrates overlap of macrophages from fibrotic conditions and separate distinct overlap of macrophages from regenerative conditions.
Supplemental Figure 3 Enrichment of KEGG terms using differential gene expression of macrophages by condition. (A) Violin plots showing gene expression specific for macrophages from fibrotic models only (3mm VML and HO). (B) Violin plots showing gene expression specific for macrophages from regenerative models only (2mm VML and DTA).
Supplemental Figure 4 Expression of TGF-β and PDGF ligands and receptors in macrophages and MPCs by condition. (A) Violin plots demonstrates limited expression of ligands tgfb2 and tgfb3 across all integrated macrophages. (B) Violin plot demonstrates greater expression of tgfbr1 in MPCs from fibrotic conditions compared to regenerative conditions. (C) Violin plots demonstrates expression of ligand Pdgfb in regenerative VML (2mm) injury model only and limited expression of ligands Pdgfc and Pdgfd. (D) Dot plot visualization of MPCs from regenerative models express higher levels of PI3K/Akt modular score suggesting increased downstream PDGF activation. (E) Dot plot visualization of MPCs from regenerative models show higher levels of mitotic activity based on G2M and S modular scores.
Acknowledgements
Work was supported by R01 AR071379 and R01 AR079863 from the National Institutes of Health (NIH) to BL. Research reported in this publication was partially supported by 3M Foundation (C.A.A.), American Federation for Aging Research Grant for Junior Faculty (C.A.A.), National Science Foundation CAREER award 2045977 (C.A.A.), Genentech Research Award (C.A.A.), Defense Advanced Research Projects Agency (DARPA) Bioelectronics for Tissue Regeneration Program through Cooperative Agreement (D20AC0002), awarded by the U.S. Department of the Interior (C.A.A.), and the Department of Defense and Congressionally Directed Medical Research Program W81XWH2010336 (C.A.A) and W81XWH2110492 (C.A.A. and B.L.). The authors would like to acknowledge Jacqueline Larouche, PhD candidate at University of Michigan, for her role in developing the VML injury models. The funders had no role in study design, data collection and analysis, decision to publish, or preparation of manuscript.
Footnotes
Conflict of Interest The authors have no disclosures or relevant conflicts of interest.
Works Cited
- 1.Eming SA, Martin P, Tomic-Canic M. Wound repair and regeneration: mechanisms, signaling, and translation. Sci Transl Med. 2014;6(265):265sr6. doi: 10.1126/scitranslmed.3009337 [DOI] [PMC free article] [PubMed] [Google Scholar]
- 2.Han Y, Li X, Zhang Y, Han Y, Chang F, Ding J. Mesenchymal Stem Cells for Regenerative Medicine. Cells. 2019;8(8):E886. doi: 10.3390/cells8080886 [DOI] [PMC free article] [PubMed] [Google Scholar]
- 3.Wynn TA, Vannella KM. Macrophages in Tissue Repair, Regeneration, and Fibrosis. Immunity. 2016;44(3):450–462. doi: 10.1016/j.immuni.2016.02.015 [DOI] [PMC free article] [PubMed] [Google Scholar]
- 4.Krebsbach PH, Kuznetsov SA, Bianco P, Robey PG. Bone marrow stromal cells: characterization and clinical application. Crit Rev Oral Biol Med Off Publ Am Assoc Oral Biol. 1999;10(2):165–181. doi: 10.1177/10454411990100020401 [DOI] [PubMed] [Google Scholar]
- 5.Yin H, Price F, Rudnicki MA. Satellite cells and the muscle stem cell niche. Physiol Rev. 2013;93(1):23–67. doi: 10.1152/physrev.00043.2011 [DOI] [PMC free article] [PubMed] [Google Scholar]
- 6.Zeisberg M, Kalluri R. Cellular mechanisms of tissue fibrosis. 1. Common and organ-specific mechanisms associated with tissue fibrosis. Am J Physiol Cell Physiol. 2013;304(3):C216–225. doi: 10.1152/ajpcell.00328.2012 [DOI] [PMC free article] [PubMed] [Google Scholar]
- 7.Hardy D, Besnard A, Latil M, et al. Comparative Study of Injury Models for Studying Muscle Regeneration in Mice. PloS One. 2016;11(1):e0147198. doi: 10.1371/journal.pone.0147198 [DOI] [PMC free article] [PubMed] [Google Scholar]
- 8.Anderson SE, Han WM, Srinivasa V, et al. Determination of a Critical Size Threshold for Volumetric Muscle Loss in the Mouse Quadriceps. Tissue Eng Part C Methods. 2019;25(2):59–70. doi: 10.1089/ten.TEC.2018.0324 [DOI] [PMC free article] [PubMed] [Google Scholar]
- 9.Larouche JA, Fraczek PM, Kurpiers SJ, et al. Neutrophil and natural killer cell imbalances prevent muscle stem cell-mediated regeneration following murine volumetric muscle loss. Proc Natl Acad Sci U S A. 2022;119(15):e2111445119. doi: 10.1073/pnas.2111445119 [DOI] [PMC free article] [PubMed] [Google Scholar]
- 10.Sensiate LA, Marques-Souza H. Bone growth as the main determinant of mouse digit tip regeneration after amputation. Sci Rep. 2019;9(1):9720. doi: 10.1038/s41598-019-45521-4 [DOI] [PMC free article] [PubMed] [Google Scholar]
- 11.Lehoczky JA, Robert B, Tabin CJ. Mouse digit tip regeneration is mediated by fate-restricted progenitor cells. Proc Natl Acad Sci U S A. 2011;108(51):20609–20614. doi: 10.1073/pnas.1118017108 [DOI] [PMC free article] [PubMed] [Google Scholar]
- 12.Peterson JR, Agarwal S, Brownley RC, et al. Direct Mouse Trauma/Burn Model of Heterotopic Ossification. J Vis Exp JoVE. 2015;(102):e52880. doi: 10.3791/52880 [DOI] [PMC free article] [PubMed] [Google Scholar]
- 13.Agarwal S, Loder S, Brownley C, et al. Inhibition of Hif1α prevents both trauma-induced and genetic heterotopic ossification. Proc Natl Acad Sci U S A. 2016;113(3):E338–347. doi: 10.1073/pnas.1515397113 [DOI] [PMC free article] [PubMed] [Google Scholar]
- 14.Park JE, Barbul A. Understanding the role of immune regulation in wound healing. Am J Surg. 2004;187(5A):11S–16S. doi: 10.1016/S0002-9610(03)00296-4 [DOI] [PubMed] [Google Scholar]
- 15.Tidball JG, Villalta SA. Regulatory interactions between muscle and the immune system during muscle regeneration. Am J Physiol Regul Integr Comp Physiol. 2010;298(5):R1173–1187. doi: 10.1152/ajpregu.00735.2009 [DOI] [PMC free article] [PubMed] [Google Scholar]
- 16.Karin M, Clevers H. Reparative inflammation takes charge of tissue regeneration. Nature. 2016;529(7586):307–315. doi: 10.1038/nature17039 [DOI] [PMC free article] [PubMed] [Google Scholar]
- 17.Godwin JW, Pinto AR, Rosenthal NA. Macrophages are required for adult salamander limb regeneration. Proc Natl Acad Sci. 2013;110(23):9415–9420. doi: 10.1073/pnas.1300290110 [DOI] [PMC free article] [PubMed] [Google Scholar]
- 18.Kawamura S, Ying L, Kim HJ, Dynybil C, Rodeo SA. Macrophages accumulate in the early phase of tendon-bone healing. J Orthop Res Off Publ Orthop Res Soc. 2005;23(6):1425–1432. doi: 10.1016/j.orthres.2005.01.014.1100230627 [DOI] [PubMed] [Google Scholar]
- 19.Schlundt C, El Khassawna T, Serra A, et al. Macrophages in bone fracture healing: Their essential role in endochondral ossification. Bone. 2018;106:78–89. doi: 10.1016/j.bone.2015.10.019 [DOI] [PubMed] [Google Scholar]
- 20.Wang H, Melton DW, Porter L, Sarwar ZU, McManus LM, Shireman PK. Altered macrophage phenotype transition impairs skeletal muscle regeneration. Am J Pathol. 2014;184(4):1167–1184. doi: 10.1016/j.ajpath.2013.12.020 [DOI] [PMC free article] [PubMed] [Google Scholar]
- 21.Sorkin M, Huber AK, Hwang C, et al. Regulation of heterotopic ossification by monocytes in a mouse model of aberrant wound healing. Nat Commun. 2020;11(1):722. doi: 10.1038/s41467-019-14172-4 [DOI] [PMC free article] [PubMed] [Google Scholar]
- 22.Wang X, Li F, Xie L, et al. Inhibition of overactive TGF-β attenuates progression of heterotopic ossification in mice. Nat Commun. 2018;9(1):551. doi: 10.1038/s41467-018-02988-5 [DOI] [PMC free article] [PubMed] [Google Scholar]
- 23.Johnson GL, Masias EJ, Lehoczky JA. Cellular Heterogeneity and Lineage Restriction during Mouse Digit Tip Regeneration at Single-Cell Resolution. Dev Cell. 2020;52(4):525–540.e5. doi: 10.1016/j.devcel.2020.01.026 [DOI] [PMC free article] [PubMed] [Google Scholar]
- 24.Hao Y, Hao S, Andersen-Nissen E, et al. Integrated analysis of multimodal single-cell data. Cell. 2021;184(13):3573–3587.e29. doi: 10.1016/j.cell.2021.04.048 [DOI] [PMC free article] [PubMed] [Google Scholar]
- 25.Aran D, Looney AP, Liu L, et al. Reference-based analysis of lung single-cell sequencing reveals a transitional profibrotic macrophage. Nat Immunol. 2019;20(2):163–172. doi: 10.1038/s41590-018-0276-y [DOI] [PMC free article] [PubMed] [Google Scholar]
- 26.Hwang C, Marini S, Huber AK, et al. Mesenchymal VEGFA induces aberrant differentiation in heterotopic ossification. Bone Res. 2019;7(1):36. doi: 10.1038/s41413-019-0075-6 [DOI] [PMC free article] [PubMed] [Google Scholar]
- 27.Houlihan DD, Mabuchi Y, Morikawa S, et al. Isolation of mouse mesenchymal stem cells on the basis of expression of Sca-1 and PDGFR-α. Nat Protoc. 2012;7(12):2103–2111. doi: 10.1038/nprot.2012.125 [DOI] [PubMed] [Google Scholar]
- 28.Korsunsky I, Millard N, Fan J, et al. Fast, sensitive and accurate integration of single-cell data with Harmony. Nat Methods. 2019;16(12):1289–1296. doi: 10.1038/s41592-019-0619-0 [DOI] [PMC free article] [PubMed] [Google Scholar]
- 29.Liu J, Gao C, Sodicoff J, Kozareva V, Macosko EZ, Welch JD. Jointly defining cell types from multiple single-cell datasets using LIGER. Nat Protoc. 2020;15(11):3632–3662. doi: 10.1038/s41596-020-0391-8 [DOI] [PMC free article] [PubMed] [Google Scholar]
- 30.Chen EY, Tan CM, Kou Y, et al. Enrichr: interactive and collaborative HTML5 gene list enrichment analysis tool. BMC Bioinformatics. 2013;14:128. doi: 10.1186/1471-2105-14-128 [DOI] [PMC free article] [PubMed] [Google Scholar]
- 31.Huang DW, Sherman BT, Lempicki RA. Systematic and integrative analysis of large gene lists using DAVID bioinformatics resources. Nat Protoc. 2009;4(1):44–57. doi: 10.1038/nprot.2008.211 [DOI] [PubMed] [Google Scholar]
- 32.Li C, Menoret A, Farragher C, et al. Single cell transcriptomics based-MacSpectrum reveals novel macrophage activation signatures in diseases. JCI Insight. 2019;5:126453. doi: 10.1172/jci.insight.126453 [DOI] [PMC free article] [PubMed] [Google Scholar]
- 33.Landry AP, Balas M, Alli S, Spears J, Zador Z. Distinct regional ontogeny and activation of tumor associated macrophages in human glioblastoma. Sci Rep. 2020;10(1):19542. doi: 10.1038/s41598-020-76657-3 [DOI] [PMC free article] [PubMed] [Google Scholar]
- 34.Jin S, Guerrero-Juarez CF, Zhang L, et al. Inference and analysis of cell-cell communication using CellChat. Nat Commun. 2021;12(1):1088. doi: 10.1038/s41467-021-21246-9 [DOI] [PMC free article] [PubMed] [Google Scholar]
- 35.Cohen M, Matcovitch O, David E, et al. Chronic exposure to TGFβ1 regulates myeloid cell inflammatory response in an IRF7-dependent manner. EMBO J. 2014;33(24):2906–2921. doi: 10.15252/embj.201489293 [DOI] [PMC free article] [PubMed] [Google Scholar]
- 36.Zhang X, Chen L, Dang WQ, et al. CCL8 secreted by tumor-associated macrophages promotes invasion and stemness of glioblastoma cells via ERK1/2 signaling. Lab Investig J Tech Methods Pathol. 2020;100(4):619–629. doi: 10.1038/s41374-019-0345-3 [DOI] [PubMed] [Google Scholar]
- 37.Gibbons MA, MacKinnon AC, Ramachandran P, et al. Ly6Chi monocytes direct alternatively activated profibrotic macrophage regulation of lung fibrosis. Am J Respir Crit Care Med. 2011;184(5):569–581. doi: 10.1164/rccm.201010-1719OC [DOI] [PubMed] [Google Scholar]
- 38.Ramachandran P, Pellicoro A, Vernon MA, et al. Differential Ly-6C expression identifies the recruited macrophage phenotype, which orchestrates the regression of murine liver fibrosis. Proc Natl Acad Sci U S A. 2012;109(46):E3186–3195. doi: 10.1073/pnas.1119964109 [DOI] [PMC free article] [PubMed] [Google Scholar]
- 39.Jung SB, Choi MJ, Ryu D, et al. Reduced oxidative capacity in macrophages results in systemic insulin resistance. Nat Commun. 2018;9(1):1551. doi: 10.1038/s41467-018-03998-z [DOI] [PMC free article] [PubMed] [Google Scholar]
- 40.Ratnam NM, Peterson JM, Talbert EE, et al. NF-κB regulates GDF-15 to suppress macrophage surveillance during early tumor development. J Clin Invest. 2017;127(10):3796–3809. doi: 10.1172/JCI91561 [DOI] [PMC free article] [PubMed] [Google Scholar]
- 41.Trizzino M, Zucco A, Deliard S, et al. EGR1 is a gatekeeper of inflammatory enhancers in human macrophages. Sci Adv. 2021;7(3):eaaz8836. doi: 10.1126/sciadv.aaz8836 [DOI] [PMC free article] [PubMed] [Google Scholar]
- 42.Chakarov S, Lim HY, Tan L, et al. Two distinct interstitial macrophage populations coexist across tissues in specific subtissular niches. Science. 2019;363(6432):eaau0964. doi: 10.1126/science.aau0964 [DOI] [PubMed] [Google Scholar]
- 43.Relloso M, Puig-Kröger A, Pello OM, et al. DC-SIGN (CD209) expression is IL-4 dependent and is negatively regulated by IFN, TGF-beta, and anti-inflammatory agents. J Immunol Baltim Md 1950. 2002;168(6):2634–2643. doi: 10.4049/jimmunol.168.6.2634 [DOI] [PubMed] [Google Scholar]
- 44.García-Prat L, Perdiguero E, Alonso-Martín S, et al. FoxO maintains a genuine muscle stem-cell quiescent state until geriatric age. Nat Cell Biol. 2020;22(11):1307–1318. doi: 10.1038/s41556-020-00593-7 [DOI] [PubMed] [Google Scholar]
- 45.Neamatallah T Mitogen-Activated Protein Kinase Pathway: A Critical Regulator in Tumor-associated Macrophage Polarization. J Microsc Ultrastruct. 2019;7(2):53–56. doi: 10.4103/JMAU.JMAU_68_18 [DOI] [PMC free article] [PubMed] [Google Scholar]
- 46.Viola A, Munari F, Sánchez-Rodríguez R, Scolaro T, Castegna A. The Metabolic Signature of Macrophage Responses. Front Immunol. 2019;10:1462. doi: 10.3389/fimmu.2019.01462 [DOI] [PMC free article] [PubMed] [Google Scholar]
- 47.Jackson LN, Larson SD, Silva SR, et al. PI3K/Akt activation is critical for early hepatic regeneration after partial hepatectomy. Am J Physiol Gastrointest Liver Physiol. 2008;294(6):G1401–1410. doi: 10.1152/ajpgi.00062.2008 [DOI] [PMC free article] [PubMed] [Google Scholar]
- 48.Karra R, Knecht AK, Kikuchi K, Poss KD. Myocardial NF-κB activation is essential for zebrafish heart regeneration. Proc Natl Acad Sci U S A. 2015;112(43):13255–13260. doi: 10.1073/pnas.1511209112 [DOI] [PMC free article] [PubMed] [Google Scholar]
- 49.Agarwal S, Cholok D, Loder S, et al. mTOR inhibition and BMP signaling act synergistically to reduce muscle fibrosis and improve myofiber regeneration. JCI Insight. 2016;1(20). doi: 10.1172/jci.insight.89805 [DOI] [PMC free article] [PubMed] [Google Scholar]
- 50.Wang X, Sathe AA, Smith GR, et al. Heterogeneous origins and functions of mouse skeletal muscle-resident macrophages. Proc Natl Acad Sci U S A. 2020;117(34):20729–20740. doi: 10.1073/pnas.1915950117 [DOI] [PMC free article] [PubMed] [Google Scholar]
- 51.Ortiz LA, Gambelli F, McBride C, et al. Mesenchymal stem cell engraftment in lung is enhanced in response to bleomycin exposure and ameliorates its fibrotic effects. Proc Natl Acad Sci U S A. 2003;100(14):8407–8411. doi: 10.1073/pnas.1432929100 [DOI] [PMC free article] [PubMed] [Google Scholar]
- 52.Uccelli A, Moretta L, Pistoia V. Mesenchymal stem cells in health and disease. Nat Rev Immunol. 2008;8(9):726–736. doi: 10.1038/nri2395 [DOI] [PubMed] [Google Scholar]
- 53.Ng F, Boucher S, Koh S, et al. PDGF, TGF-beta, and FGF signaling is important for differentiation and growth of mesenchymal stem cells (MSCs): transcriptional profiling can identify markers and signaling pathways important in differentiation of MSCs into adipogenic, chondrogenic, and osteogenic lineages. Blood. 2008;112(2):295–307. doi: 10.1182/blood-2007-07-103697 [DOI] [PubMed] [Google Scholar]
- 54.Zhang H, Bajraszewski N, Wu E, et al. PDGFRs are critical for PI3K/Akt activation and negatively regulated by mTOR. J Clin Invest. 2007;117(3):730–738. doi: 10.1172/JCI28984 [DOI] [PMC free article] [PubMed] [Google Scholar]
- 55.Schmahl J, Raymond CS, Soriano P. PDGF signaling specificity is mediated through multiple immediate early genes. Nat Genet. 2007;39(1):52–60. doi: 10.1038/ng1922 [DOI] [PubMed] [Google Scholar]
- 56.Oster SK, Marhin WW, Asker C, et al. Myc is an essential negative regulator of platelet-derived growth factor beta receptor expression. Mol Cell Biol. 2000;20(18):6768–6778. doi: 10.1128/MCB.20.18.6768-6778.2000 [DOI] [PMC free article] [PubMed] [Google Scholar]
- 57.Pagani CA, Huber AK, Hwang C, et al. Novel Lineage-Tracing System to Identify Site-Specific Ectopic Bone Precursor Cells. Stem Cell Rep. 2021;16(3):626–640. doi: 10.1016/j.stemcr.2021.01.011 [DOI] [PMC free article] [PubMed] [Google Scholar]
- 58.De Micheli AJ, Laurilliard EJ, Heinke CL, et al. Single-Cell Analysis of the Muscle Stem Cell Hierarchy Identifies Heterotypic Communication Signals Involved in Skeletal Muscle Regeneration. Cell Rep. 2020;30(10):3583–3595.e5. doi: 10.1016/j.celrep.2020.02.067 [DOI] [PMC free article] [PubMed] [Google Scholar]
- 59.McKellar DW, Walter LD, Song LT, et al. Large-scale integration of single-cell transcriptomic data captures transitional progenitor states in mouse skeletal muscle regeneration. Commun Biol. 2021;4(1):1280. doi: 10.1038/s42003-021-02810-x [DOI] [PMC free article] [PubMed] [Google Scholar]
- 60.Kragl M, Knapp D, Nacu E, et al. Cells keep a memory of their tissue origin during axolotl limb regeneration. Nature. 2009;460(7251):60–65. doi: 10.1038/nature08152 [DOI] [PubMed] [Google Scholar]
- 61.Debuque RJ, Hart AJ, Johnson GH, Rosenthal NA, Godwin JW. Identification of the Adult Hematopoietic Liver as the Primary Reservoir for the Recruitment of Pro-regenerative Macrophages Required for Salamander Limb Regeneration. Front Cell Dev Biol. 2021;9:750587. doi: 10.3389/fcell.2021.750587 [DOI] [PMC free article] [PubMed] [Google Scholar]
- 62.Liu L, Lu Y, Martinez J, et al. Proinflammatory signal suppresses proliferation and shifts macrophage metabolism from Myc-dependent to HIF1α-dependent. Proc Natl Acad Sci U S A. 2016;113(6):1564–1569. doi: 10.1073/pnas.1518000113 [DOI] [PMC free article] [PubMed] [Google Scholar]
- 63.Jenkins SJ, Ruckerl D, Cook PC, et al. Local macrophage proliferation, rather than recruitment from the blood, is a signature of TH2 inflammation. Science. 2011;332(6035):1284–1288. doi: 10.1126/science.1204351 [DOI] [PMC free article] [PubMed] [Google Scholar]
- 64.Robbins CS, Hilgendorf I, Weber GF, et al. Local proliferation dominates lesional macrophage accumulation in atherosclerosis. Nat Med. 2013;19(9):1166–1172. doi: 10.1038/nm.3258 [DOI] [PMC free article] [PubMed] [Google Scholar]
- 65.Stein EV, Miller TW, Ivins-O’Keefe K, Kaur S, Roberts DD. Secreted Thrombospondin-1 Regulates Macrophage Interleukin-1β Production and Activation through CD47. Sci Rep. 2016;6:19684. doi: 10.1038/srep19684 [DOI] [PMC free article] [PubMed] [Google Scholar]
- 66.Yang H, Zhou T, Sorenson CM, Sheibani N, Liu B. Myeloid-Derived TSP1 (Thrombospondin-1) Contributes to Abdominal Aortic Aneurysm Through Suppressing Tissue Inhibitor of Metalloproteinases-1. Arterioscler Thromb Vasc Biol. 2020;40(12):e350–e366. doi: 10.1161/ATVBAHA.120.314913 [DOI] [PMC free article] [PubMed] [Google Scholar]
- 67.Bréchot N, Gomez E, Bignon M, et al. Modulation of macrophage activation state protects tissue from necrosis during critical limb ischemia in thrombospondin-1-deficient mice. PloS One. 2008;3(12):e3950. doi: 10.1371/journal.pone.0003950 [DOI] [PMC free article] [PubMed] [Google Scholar]
- 68.Lawler PR, Lawler J. Molecular basis for the regulation of angiogenesis by thrombospondin-1 and −2. Cold Spring Harb Perspect Med. 2012;2(5):a006627. doi: 10.1101/cshperspect.a006627 [DOI] [PMC free article] [PubMed] [Google Scholar]
- 69.Pinto AR, Godwin JW, Chandran A, et al. Age-related changes in tissue macrophages precede cardiac functional impairment. Aging. 2014;6(5):399–413. doi: 10.18632/aging.100669 [DOI] [PMC free article] [PubMed] [Google Scholar]
- 70.Liu P, Ying Y, Anderson RG. Platelet-derived growth factor activates mitogen-activated protein kinase in isolated caveolae. Proc Natl Acad Sci U S A. 1997;94(25):13666–13670. doi: 10.1073/pnas.94.25.13666 [DOI] [PMC free article] [PubMed] [Google Scholar]
- 71.Shimokado K, Raines EW, Madtes DK, Barrett TB, Benditt EP, Ross R. A significant part of macrophage-derived growth factor consists of at least two forms of PDGF. Cell. 1985;43(1):277–286. doi: 10.1016/0092-8674(85)90033-9 [DOI] [PubMed] [Google Scholar]
- 72.Paredes J, Shiovitz DA, Andarawis-Puri N. Uncorrelated healing response of tendon and ear injuries in MRL highlight a role for the local tendon environment in driving scarless healing. Connect Tissue Res. 2018;59(5):472–482. doi: 10.1080/03008207.2018.1485665 [DOI] [PMC free article] [PubMed] [Google Scholar]
Associated Data
This section collects any data citations, data availability statements, or supplementary materials included in this article.
Supplementary Materials
Supplemental Figure 1 Identification of macrophages from four datasets using canonical markers Adgre1 and Csfr1. (A-D) Violin plots showing cluster specific expression of macrophage specific marker genes for each dataset. (E) Violin plots showing Cluster 5 expressing both macrophage marker genes was excluded from our macrophage population due to the high gene expression of neutrophil markers S100a9 and S100a8.
Supplemental Figure 2 Integration of macrophages from unique environments demonstrates consistent overlap regardless of method. (A) UMAP plot of integrated macrophages following LIGER protocol demonstrates overlap of macrophages from fibrotic conditions and separate distinct overlap of macrophages from regenerative conditions. (B) UMAP plot of integrated macrophages following Seurat integration protocol demonstrates overlap of macrophages from fibrotic conditions and separate distinct overlap of macrophages from regenerative conditions.
Supplemental Figure 3 Enrichment of KEGG terms using differential gene expression of macrophages by condition. (A) Violin plots showing gene expression specific for macrophages from fibrotic models only (3mm VML and HO). (B) Violin plots showing gene expression specific for macrophages from regenerative models only (2mm VML and DTA).
Supplemental Figure 4 Expression of TGF-β and PDGF ligands and receptors in macrophages and MPCs by condition. (A) Violin plots demonstrates limited expression of ligands tgfb2 and tgfb3 across all integrated macrophages. (B) Violin plot demonstrates greater expression of tgfbr1 in MPCs from fibrotic conditions compared to regenerative conditions. (C) Violin plots demonstrates expression of ligand Pdgfb in regenerative VML (2mm) injury model only and limited expression of ligands Pdgfc and Pdgfd. (D) Dot plot visualization of MPCs from regenerative models express higher levels of PI3K/Akt modular score suggesting increased downstream PDGF activation. (E) Dot plot visualization of MPCs from regenerative models show higher levels of mitotic activity based on G2M and S modular scores.