Abstract
Background
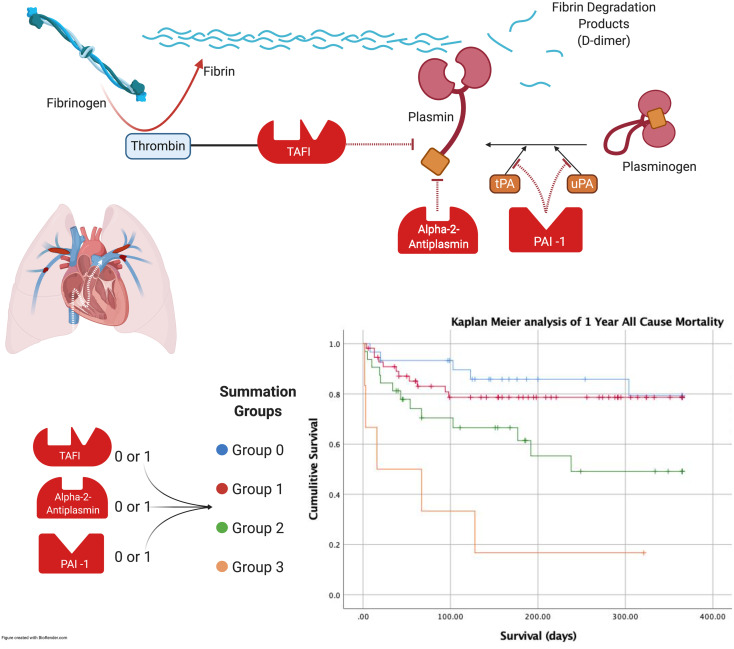
Acute pulmonary embolism (PE) is a heterogeneous disease process with variable presentation and outcomes. The endogenous fibrinolytic system is a complex framework of regulatory pathways that maintains homeostasis by dissolving overabundant thrombi. We sought to investigate phenotypic profiles of the endogenous fibrinolytic system among patients presenting with acute PE and their impact on mortality.
Methods
We enrolled all consecutive patients with acute PE in our institutional Pulmonary Embolism Response Team registry. We collected blood samples at the time of PE diagnosis and analyzed concentrations of plasminogen activator inhibitor 1 (PAI-1), thrombin-activatable fibrinolysis inhibitor (TAFI), and alpha-2-antiplasmin (A2A). We assessed the association of concentration of fibrinolytic inhibitors and 1-year all-cause mortality and various echocardiographic markers of right ventricular (RV) dysfunction.
Results
There is significant variability of PAI-1, A2A, and TAFI concentrations across the spectrum of PE risk profiles with high PAI-1, low TAFI, and low A2A (herein referred to as a high-risk biomarker profile) correlating with worse PE severity. High-risk biomarker profile correlated with high-risk echocardiographic features of RV dysfunction, including increased RV/left ventricular (LV) ratio, low tricuspid annular plane systolic excursion, and low right ventricular outflow tract velocity time integral. Higher-risk biomarker profile was able to discriminate and independently identify patients at high risk of all-cause mortality (Group 2 HR 6 95% CI 1.3-27.8, Group 3 HR 12, 95% CI 1.7-86).
Conclusions
Further studies are needed to assess the exact pathophysiological link between fibrinolytic status and poor outcome after acute PE and to ascertain the impact of anti-inhibitors of the fibrinolytic system on response to therapy and outcomes after acute PE.
Keywords: pulmonary embolism, fibrinolysis, plasminogen activator inhibitor 1, thrombin activatable fibrinolysis inhibitor, alpha-2-antiplasmin
Introduction
Acute pulmonary embolism (PE) is a heterogeneous disease process with variable presentation and outcomes. While the mainstay of therapy is anticoagulation, a high-risk subset of patients with acute PE requires fibrinolytic therapy to prevent acute decompensation and in-hospital mortality.1 Exogenous fibrinolytic therapy is efficacious at reducing clot burden, but it is associated with a high risk for bleeding.2
The endogenous fibrinolytic system is a complex framework of regulatory pathways that maintains homeostasis by dissolving overabundant thrombi. Tissue-type plasminogen activator and urinary-type plasminogen activator activate plasminogen into plasmin, which in turn cleaves fibrin polymers, initiating fibrinolysis.3 To dissolve unwanted thrombi, these activators of fibrinolysis must first overcome the action of circulating inhibitors. Plasminogen activator inhibitor 1 (PAI-1), thrombin-activatable fibrinolysis inhibitor (TAFI), and alpha-2-antiplasmin (A2A) play a central role in regulating fibrinolysis by inhibiting plasmin at various stages. (Figure 1) There is significant variability among patients in their response to exogenous fibrinolytic therapy, which may influence their response to therapy and long-term functional outcomes.4
Figure 1.
Simplified schematic representation of the fibrinolytic cascade.
Abbreviations: TAFI, thrombin activatable fibrinolysis inhibitor, PAI-1, plasminogen activator inhibitor 1; A2A, alpha-2-antiplasmin; CKD, chronic kidney disease; BNP, B-natriuretic peptide.
Although PAI-1, TAFI, and A2A are an integral part of the fibrinolytic system, little is known about their impact on mortality in patients with acute PE. Overexpression of fibrinolysis inhibitors can lead to fibrinolysis deficit and thrombosis, while under-expression may lead to bleeding.3 A better understanding of this relationship may clarify the contribution of PAI-1, TAFI, and A2A to the pathophysiology of PE and identify these enzymes as novel therapeutic targets. We sought to investigate phenotypic profiles of the fibrinolytic system among patients presenting with acute PE and their impact on mortality. Our central hypothesis was that the status of the fibrinolytic system is highly variable in patients with acute PE and that markers of the fibrinolytic system would correlate with the risk of all-cause mortality.
Methods
Study Population and Design
Study participants were enrolled from a Pulmonary Embolism Response Team (PERT) registry between March 2016 and March 2019 at Loyola University Medical Center. PERT was established as a consultative service in our tertiary care center to manage patients with acute PE and has evaluated patients across the entire spectrum of PE risk. We enrolled all consecutive patients with acute PE in the registry. All patients had a confirmed acute PE based on computed tomographic (CT) angiography or ventilation/perfusion imaging. Based on ACC/AHA guidelines, all patients were classified into low risk, submassive, and massive PE.5 We collected baseline clinical characteristics, routine laboratory data, imaging, and patient outcomes by reviewing the relevant electronic medical records. Echocardiograms were obtained on all patients at the time of PE diagnosis. Only cardiologists who are board certified in echocardiography and who have expertise in pulmonary embolism interpreted echocardiographic data. Any discrepancy in interpretation was resolved by consensus. Right ventricular (RV) and left ventricular (LV) measurements were obtained based on the current guidelines.6 RV dysfunction was assessed utilizing RV/LV ratio, tricuspid annular plane systolic excursion (TAPSE), and right ventricular outflow tract velocity time integral (RVOT VTI), which is a surrogate for RV stroke volume.5,6 All-cause mortality was ascertained from review of electronic medical record. The Institutional Review Board approved the study at Loyola University Medical Center.
Plasma Protein Analysis
All patients had blood samples collected at the time of PE diagnosis. Citrated blood was centrifuged to separate the plasma, which was then aliquoted and frozen for future analysis. Blood sample analysis was not available at the time of patient management; therefore, patients were treated based on clinical findings according to the managing physician. Blood samples were analyzed for PAI-1, TAFI, and A2A. PAI-1 and TAFI were quantified with an enzyme linked-immuno-sorbent assay (ELISA), while A2A was measured using a functional assay. PAI-1 was measured as ug/ml, while TAFI and A2A were measured as percent of normal controls. Normal controls were derived from pooled normal human plasma from healthy volunteers.
Clinical Outcomes
We assessed the association of concentration of fibrinolytic inhibitors and 1-year all-cause mortality as the primary endpoint. For the secondary outcome we evaluated the association between various echocardiographic markers of RV dysfunction and the concentration of fibrinolytic inhibitors. We also correlated PE severity and the concentration of fibrinolytic inhibitors.
Statistical Analysis
Patient demographics and clinical characteristics were presented using descriptive statistics, mean and standard deviation, and median and interquartile range where appropriate. Groups were compared using independent samples t-test for continuous variables and chi-square test for categorical variables. Box plots were constructed to visualize differences in biomarker levels across different patient groups.
A receiver operative characteristic (ROC) curve was constructed to illustrate the sensitivity and specificity of biomarker levels to predict all-cause mortality. Youden's J index was used to identify the optimum cut point to optimize the sensitivity and specificity of the test. Two groups were created for each biomarker with a cut point determined by the box plot visualization and the ROC curves. A score of 1 was assigned for values associated with high risk and a score of zero for values associated with low risk for that biomarker. A new PAI/TAFI/A2A “Summation” variable was created by summing all 0s and 1s to incorporate information on all 3 biomarkers for each patient. This method produced 4 distinct groups (Values: 0, 1, 2, and 3). Cox proportional hazard model was built to assess the association of PAI/TAFI/A2A “Summation” groups and all-cause mortality. Indicator variables were then created for each of the 4 groups for the Cox proportional hazard model. Group 0 served as a reference group. We also evaluated other important covariates with known impact on mortality in this patient population (pulmonary embolism severity index [PESI], ACC/AHA PE severity [low risk, submassive, massive], cancer, BMI, heart failure [HF], chronic kidney disease [CKD], Lactate, Troponin, B-natriuretic peptide [BNP], Age). Variables were included in the multivariable model and then progressively removed if they were not independent predictors, nor did they substantially change the association of PAI/TAFI/A2A Summation variable and all-cause mortality. Kaplan Meier curves and log-rank tests were used to assess the association between biomarker groups and all-cause mortality.
The correlation between TAFI, PAI-1, A2A, and markers of RV dysfunction was assessed using the Pearson correlation test. We evaluated the association between PE risk profile (Low, Submassive, and Massive) and concentration of fibrinolytic inhibitors.
A P value of <.05 was considered to be statistically significant. Analyses were performed using IBM SPSS Version 25. (IBM Corp. Released 2017. IBM SPSS Statistics for Macintosh, Version 25.0: IBM Corp).
Results
Of the 350 patients evaluated by PERT during the study period, 179 patients had blood samples available for any of the 3 biomarkers. They were included in the ROC analysis and individual biomarker analysis, while 125 patients had all 3 biomarkers available and were included in the Cox regression and Kaplan Meier analysis. From the larger cohort, 46 (25.7%) patients were classified as low risk, 118 (65.9%) were submassive, and 15 (8.4%) were classified as massive PE. Baseline clinical characteristics stratified by survival are presented in Table 1.
Table 1.
Baseline Clinical Characteristics of the Overall Cohort and Those who Died and did not die During the 1-Year Follow up.
| Variable | Survivors n = 136 (%) |
Nonsurvivors N = 43 (%) |
P value |
|---|---|---|---|
| Age (Mean ± SD) | 60.3 ± 16.1 | 66.2 + 13.4 | .03 |
| Female | 64 (49.2) | 28 (65.1) | .05 |
| Race | .32 | ||
| • White | 69 (53.5) | 30 (69.8) | |
| • Black | 47 (36.4) | 10 (23.3) | |
| • Hispanic | 9 (7) | 2 (4.7) | |
| • Other | 4 (3.1) | 1 (2.3) | |
| PE severity | .09 | ||
| • Low risk | 36 (27.7) | 8 (18.6) | |
| • Submassive risk | 86 (66.2) | 28 (65.1) | |
| • High risk | 8 (6.2) | 7 (16.3) | |
| Thrombolysis | .15 | ||
| • Systemic | 2 (1.6) | 2 (4.8) | |
| • CDT | 18 (14.1) | 2 (4.8) | |
| Embolectomy | .35 | ||
| • Surgical | 5 (4) | 1 (2.3) | |
| • Percutaneous | 2 (1.6) | 2 (4.6) | |
| BMI (kg/m2) (Mean ±SD) | 32.6 + 9.1 | 28.5 + 9.8 | .01 |
| PESI score(Mean ±SD) | 106 + 46.5 | 152 + 45.5 | <.01 |
| Hypertension | 63 (51.6) | 21 (47.5) | .72 |
| Diabetes | 28 (23.7) | 10 (23.3) | 1 |
| CKD | 7 (5.8) | 8 (19) | .03 |
| Cancer | 25 (20.5) | 29 (67.4) | <.01 |
| HF | 11 (9) | 9 (21.4) | .05 |
| CAD | 17 (14) | 7 (16.7) | .8 |
| COPD | 6 (4.9) | 6 (14) | .08 |
| Prior Stroke | 15 (12.3) | 2 (4.7) | .2 |
| Prior PE | 8 (6.6) | 10 (23.3) | .008 |
| Acute DVT | 80 (63) | 29 (69) | .58 |
| Lactate (Mean ±SD) | 1.9 + 1.1 | 3.9 + 4.1 | <.01 |
| Troponin (Mean ±SD) | 0.5 + 1.2 | 2.2 + 7 | .01 |
| BNP (Mean ±SD) | 198.5 + 242.9 | 436.1 + 646.6 | .002 |
| PAI-1 (µg/ml) | 58.9 + 35.9 | 76.1 + 46.5 | .02 |
| TAFI (% of normal) | 114.7 + 25.5 | 104.2 + 35.6 | .07 |
| A2A (% of normal) | 89 + 36.3 | 75.6 + 23 | .03 |
Abbreviations: PE, pulmonary embolism; CDT, catheter-directed thrombolysis; BMI, body mass index; PESI, pulmonary embolism severity index; CKD, chronic kidney disease; HF, heart failure; CAD, coronary artery disease; COPD, chronic obstructive pulmonary disease; DVT, deep vein thrombosis; BNP, brain natriuretic peptide; PAI, plasminogen activator inhibitor; TAFI, thrombin activatable fibrinolysis inhibitor; A2A, alpha 2 antiplasmin.
From our cohort, 43 (24%) patients experienced all-cause mortality within 1 year of diagnosis. Mean follow-up was of 214 ± 125 days for survivors and 59 ± 66.5 days for nonsurvivors. PE-related mortality was 2.8% (5/179). Seven patients were lost to follow-up. Their follow-up data was kept in the analysis up to the point of loss to follow-up, at which point they were censored.
PAI-1 was significantly higher in patients who died at 1 year than survivors (76.1 vs 58.9 µg/ml, P = .02). TAFI was lower in patients who died at 1 year than survivors but did not achieve statistical significance (104.2 vs 114.7%, P = .07). A2A was significantly lower in patients who died at 1 year than survivors (75.6 vs 89%, P = .03).
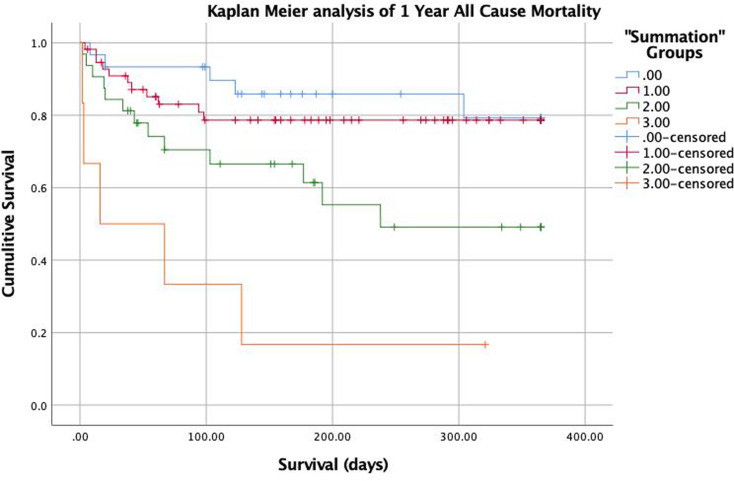
The 1-year all-cause mortality rate within PAI-1/TAFI/A2A “Summation” groups were 5/30 (16.7%) in group 0, 11/57 (19.3%) in group 1, 13/32 (40.6%) in group 2, 5/6 (83.3%) in group 3. Kaplan Meier survival analysis demonstrates a significantly higher risk for mortality in groups 2 and 3 compared to groups 1 and 2. (Figure 2).
Figure 2.
Kaplan–Meier survival analysis of 1 year all-cause mortality according to the summation variable as follows: group 0 (blue) =sum of 0, group 1 (red) =sum of 1, group 2 (green)= sum of 2, group 3 (orange) = sum of 3 (P < .001).
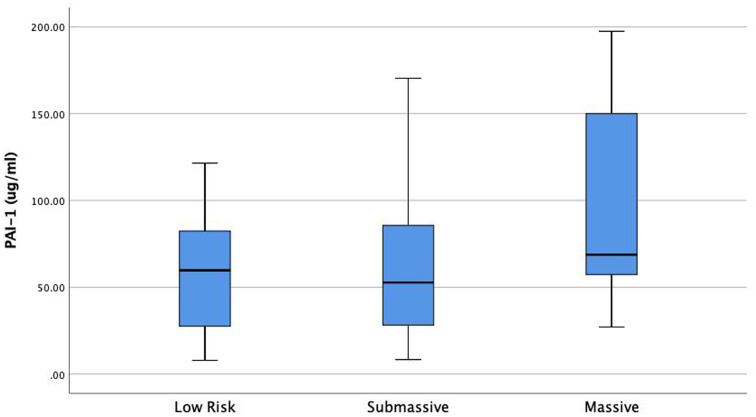
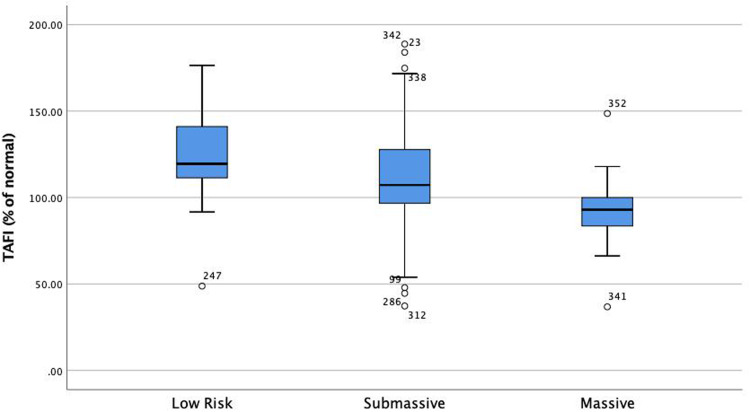
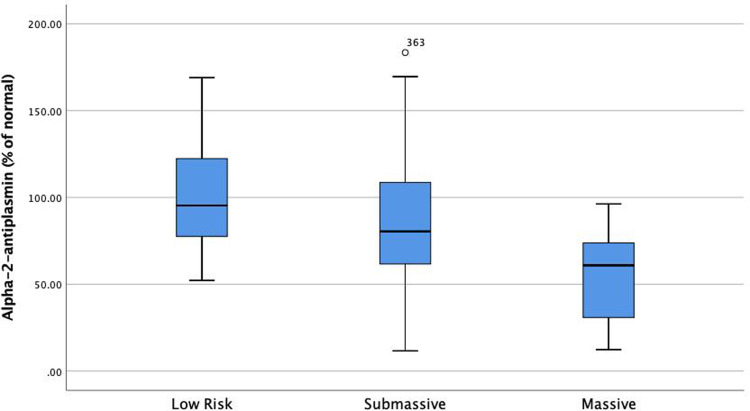
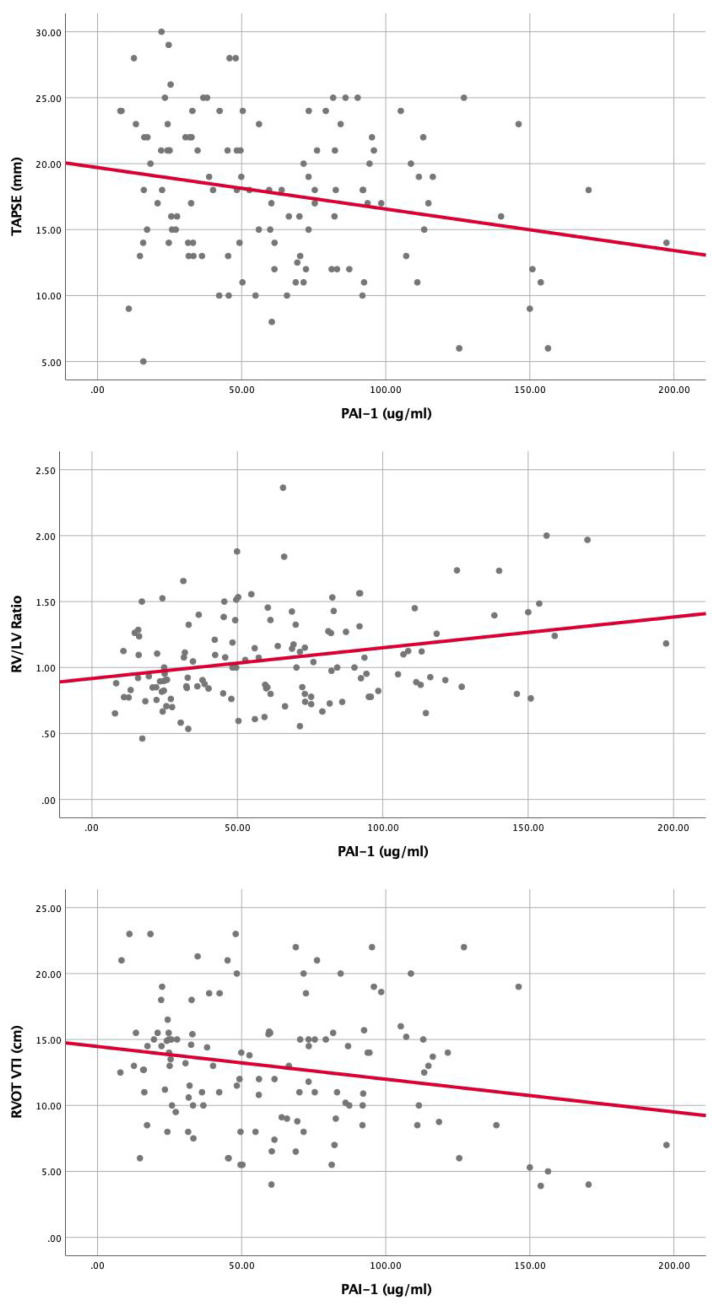
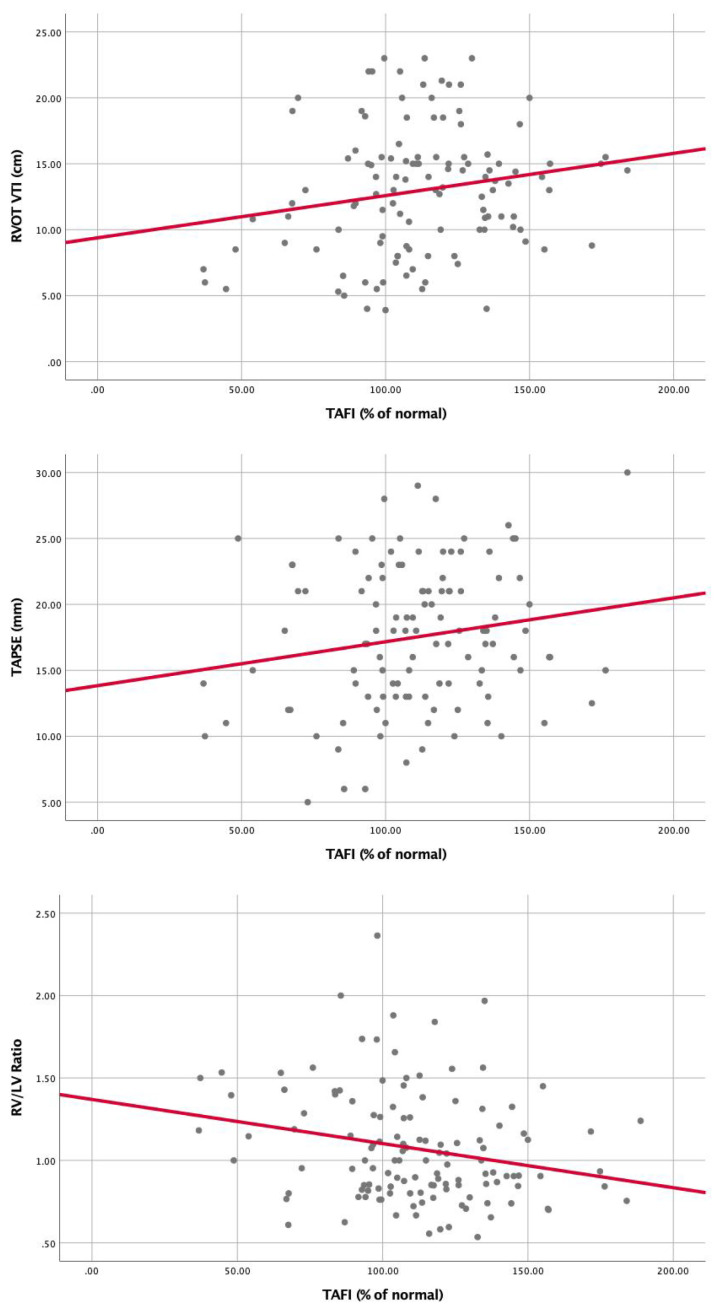
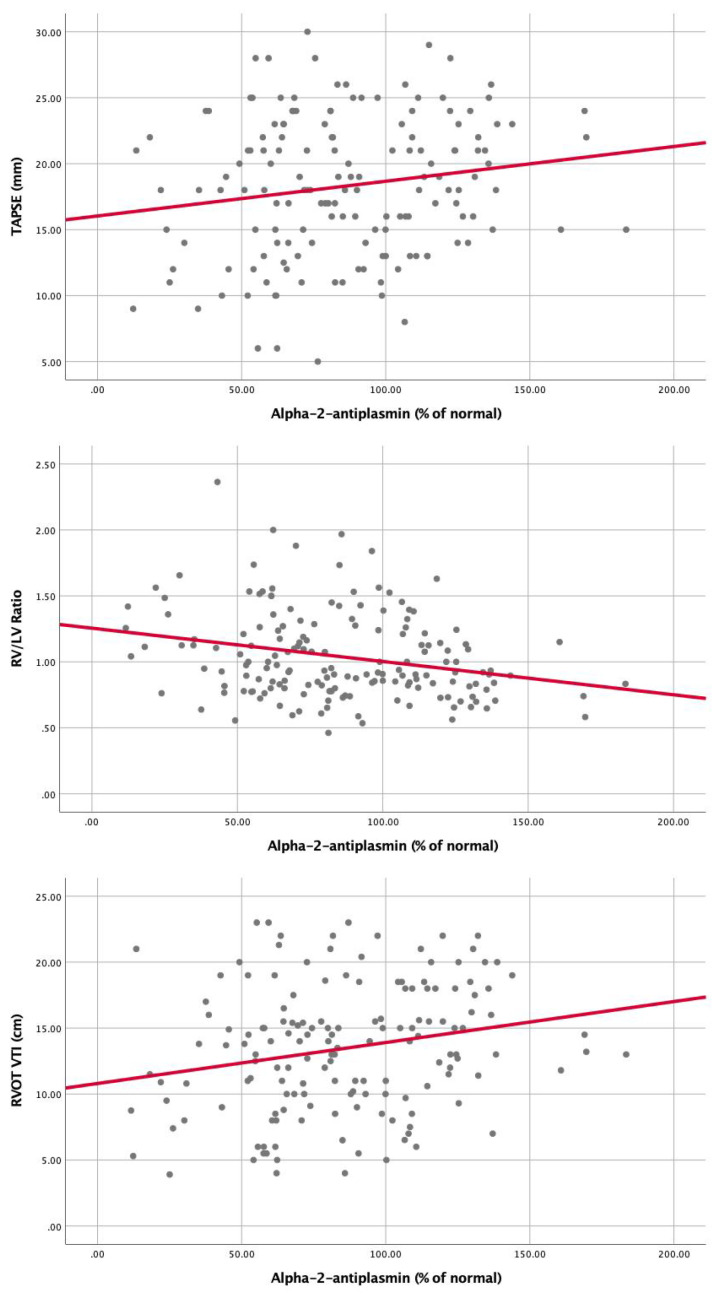
Univariable Cox proportional hazard analysis demonstrated that several factors were associated with increased 1 year all-cause mortality: Age (HR: 1.02, 95% CI: 1.007-1.05), Cancer (HR: 5, 95% CI: 2.7-9.6), PESI (per 10 point rise, HR: 1.2, 95% CI: 1.1-1.3), BMI (HR: 0.94, 95% CI: 0.9-0.98), BNP (per 10 point rise, HR: 1.001, 95% CI: 1.001-1.01), Lactate (HR: 1.2, 95% CI: 1.2-1.3), Troponin (per 1 point increase HR: 1.1, 95% CI: 1.1-1.2), HF (HR: 2.2, 95% CI: 1.1-4.6), CKD (HR: 2.2, 95% CI: 1-4.9), prior PE (HR: 2.1, 95% CI: 1-4.2), PE severity (HR: 1.6, 95% CI: 0.9-2.8), PAI-1/TAFI/A2A “Summation” groups (Group 0 as a reference) Group 1 (HR: 1.4, 95% CI: 0.5-3.9), Group 2 (HR: 3.1, 95% CI: 1.1-8.6), Group 3 (HR: 9.3, 95% CI: 2.7-32.1). (Table 2). Multivariable Cox proportional hazard analysis demonstrated that PESI, Lactate, Cancer, and PAI-1/TAFI/A2A “Summation” group 2 and group 3 were significantly associated with increased 1-year all-cause mortality (Table 2). PAI-1 was significantly elevated in patients with massive PE as compared to submassive and low-risk PE (P = .014) (Figure 3). TAFI was significantly lower in patients with massive PE than submassive and low-risk PE (P = .003) (Figure 4). A2A was significantly lower in patients with massive PE as compared to submassive and low-risk PE (P < .01) (Figure 4). PAI-1 correlated significantly with markers of RV dysfunction (Figure 5), while TAFI and A2A inversely correlated significantly with markers of RV dysfunction. (Figures 6 and 7).
Table 2.
Univariable and Multivariable Cox Proportional Hazard Model for all-Cause 1-Year Mortality.
| Variable | Univariable HR (95%CI) | P value | Multivariable HR (95%CI) | P value |
|---|---|---|---|---|
| Age | 1.02 (1.01-1.05) | .009 | NS | |
| BMI | 0.94 (0.9-0.98) | .006 | NS | |
| BNP | 1.01 (1.001-1.01) | .01 | NS | |
| Troponin | 1.1 (1.1-1.2) | <.001 | NS | |
| CHF | 2.2 (1.1-4.6) | .04 | NS | |
| CKD | 2.2 (1.0-4.9) | .04 | NS | |
| Prior PE | 2.1 (1.0-4.2) | .05 | NS | |
| PAI-1/TAFI/A2A Group 1 (as compared to Group 0) |
1.4 (0.5-3.9) | .58 | 2.1 (0.4-10.5) | .35 |
| PAI-1/TAFI/A2A Group 2 (as compared to Group 0) |
3.1 (1.1-8.6) | .03 | 6 (1.3-27.8) | .02 |
| PAI-1/TAFI/A2A Group 3 (as compared to Group 0) |
9.3 (2.7-32.1) | <.001 | 12 (1.7-86) | .013 |
| Cancer | 5 (2.7-9.6) | <.001 | 2.7 (1.1-6.6) | .03 |
| PESI (per 10 point increase) | 1.2, (1.1-1.3) | <.001 | 1.1 (1-1.2) | .01 |
| PE severity (per increase in group severity: Low, submassive, and massive) | 1.6 (0.9-2.8) | .09 | 0.44 (0.18-1.1) | .07 |
| Lactate (per 1 point increase) | 1.2 (1.2-1.3) | <.001 | 1.3 (1-1.7) | .02 |
Abbreviations: PE, pulmonary embolism; BMI, body mass index; PESI, pulmonary embolism severity index; CKD, chronic kidney disease; CHF, congestive heart failure; BNP, brain natriuretic peptide; PAI, plasminogen activator inhibitor; TAFI, thrombin activatable fibrinolysis inhibitor; A2A, alpha 2 antiplasmin.
Figure 3.
PAI-1 is significantly elevated in patients with high-risk PE compared to submassive and low-risk PE. (P = .014). Abbreviations: PAI-1, plasminogen activator inhibitor 1; PE, pulmonary embolism.
Figure 4.
TAFI is significantly lower in patients with high-risk PE than submassive and low-risk PE (P = .003). Abbreviations: TAFI, thrombin activatable fibrinolysis inhibitor; PE, pulmonary embolism.
Figure 5.
Alpha-2-Antiplasmin is significantly lower in patients with high-risk pulmonary embolism (PE) as compared to submassive and low-risk PE (P < .01)
Figure 6.
Correlation of PAI-1 with markers of RV dysfunction: (A) RV/LV ratio (r = 0.28, P = .001), (B)TAPSE (r = (-)0.23, P = .01), (C) RVOT VTI (r = (-)0.21, P = .02). Abbreviations: PAI-1, plasminogen activator inhibitor 1; TAPSE, tricuspid annular plane systolic excursion; TAFI, thrombin-activatable fibrinolysis inhibitor; RVOT-VTI, right ventricular outflow tract velocity time integral; RV, right ventricular; LV, left ventricular.
Figure 7.
Correlation of TAFI with markers of RV dysfunction, (A) RV/LV ratio (r = (-)0.23, P = .01), (B) TAPSE (r = 0.17, P = .07), (C) RVOT VTI (r = 0.19, P = .05). Abbreviations: TAFI, thrombin-activatable fibrinolysis inhibitor; TAPSE, tricuspid annular plane systolic excursion; RVOT-VTI, right ventricular outflow tract velocity time integral; RV, right ventricular; LV, left ventricular.
Discussion
We sought to investigate phenotypic profiles of fibrinolytic status and its association with mortality among patients with acute PE. The major findings of our study are (1) There is a significant variability of PAI-1, A2A, and TAFI concentrations across the spectrum of PE risk profiles, (2) high PAI-1, low TAFI, and low A2A (herein referred to as a high-risk biomarker profile) correlated with worse PE severity, (3) high-risk biomarker profile correlated with high-risk echocardiographic features of RV dysfunction, including increased RV/LV ratio, low TAPSE, and low RVOT VTI, and (4) high-risk biomarker profile was able to discriminate and independently identify patients at high risk of all-cause mortality.
Current methods of PE risk stratification rely on an assessment of systemic blood pressure, biomarkers, including BNP and troponin, evidence of RV dysfunction on echocardiogram or CT, and presence of residual lower extremity deep vein thrombosis (DVT).7,8 While these models help triage patients and allocate appropriate resources, they are associated with only 21% positive predictive value to identify all-cause mortality and clinical deterioration9,10 Identification of additional markers of PE severity that could aid in the accurate risk stratification of acute PE patients is of utmost importance.
These various scores quantify the body's response to venous thromboembolism (VTE) and do not address the underlying pathophysiology which catalyzed thrombus formation in the first place. For most patients, the inciting event is not a reversible factor but a conglomerate of inherited and acquired risk factors. We struggle to quantify the hypercoagulable state of patients. While some thrombophilic conditions carry a high risk of recurrent VTE, most are less defined, and management is unclear.11 We hypothesize that by clarifying the status of the endogenous fibrinolytic system, we can better characterize patients’ predisposition to initial event, risk of recurrence, and risk of death, and ultimately provide therapy tailored to the specific phenotypic profile of fibrinolytic deficit. However, future studies are needed to better delineate this relationship.
In our study, we found a significant correlation between biomarkers of fibrinolytic status and all-cause mortality. By incorporating data from all 3 biomarkers into a single Summation variable, we demonstrated the additive effect of these biomarkers. The use of summation groups successfully stratified patients with acute PE into being at either low risk (16.7-19.3%), submassive risk (40.6%), or high risk (83.3%) for 1-year all-cause mortality. Furthermore, multivariable Cox proportional hazard analysis identified the presence of at least 2 high-risk biomarker values as being independently predictive of 1-year all-cause mortality.
A substantial proportion of our patients had underlying malignancy (50/179, 30.2%) at the time of PE diagnosis, and during follow up a significant number of deaths (16/43 37.2%) were attributed to malignancy or transition to hospice care (Supplemental Table 1A). As such, it can be postulated that fibrinolytic markers are significantly dysregulated in this group and may identify a cohort that is at the highest risk of mortality from any cause, including cancer. In our cohort, we had a low rate of PE-related mortality (2.8%). We, therefore, cannot conclude with confidence that dysregulation of endogenous fibrinolysis leads to PE-related mortality. However, we did demonstrate an association between these biomarkers and RV dysfunction and progressively increasing biomarker levels according to PE severity (Figure 3,4,8).Figure 3-8 A more extensive study is needed to assess whether elevation of PAI-1 or reduction of TAFI and A2A leads to worsened PE-related mortality.
Figure 8.
Correlation of Alpha-2-antiplasmin with markers of RV dysfunction, (A) RV/LV ratio (r = (-)0.26, P = .001), (B) TAPSE (r = 0.17, P = .04), (C) RVOT VTI (r = 0.22, P = .006). Abbreviations: TAPSE, tricuspid annular plane systolic excursion; RVOT-VTI, right ventricular outflow tract velocity time integral; RV, right ventricular; LV, left ventricular.
A high-risk biomarker profile of fibrinolytic deficit (high PAI-1/low TAFI/low A2A) was found to correlate with increased clinical PE severity, echocardiographic features of RV dysfunction, and 1-year all-cause mortality. Since all 3 of these biomarkers are inhibitors of endogenous fibrinolysis, our initial hypothesis was that all 3 would trend in the same direction, and higher concentrations would correlate with higher risk. To our surprise, we demonstrated that although PAI-1 is increased with higher risk, low TAFI, and low A2A are associated with higher risk. The reason for this discordance is not apparent. We postulate that perhaps with higher clot burden, more TAFI and A2A get consumed or found in the bound form, which we cannot measure, leading to lower concentrations. This hypothesis is supported by the fact that we used functional assay to measure A2A and activated TAFI, while PAI-1 was measured using the ELISA method, measuring all available antigens in plasma. The exact mechanism of how these biomarkers increase the patients’ risk is not clearly understood. These may just be markers of high-risk patients but do not by themselves play a role in pathophysiology that leads to RV dysfunction or mortality. Alternatively, since these markers may play a direct role in the endogenous fibrinolytic system and alter resistance to thrombolysis, and may participate in the direct pathophysiology of RV dysfunction and mortality. Further research is needed to understand how the endogenous fibrinolytic system impacts risk profile, response to therapy, and overall survival. The profiling of the markers may have a major role in risk stratification and customizing the treatment approaches.12,13 It is clinically desirable to identify the target dose of plasminogen activators or potentially identify future therapeutic sites by targeting the fibrinolysis inhibitors, and thus “release the brakes” on fibrinolysis, as some have suggested.13,14
Study Limitations
This study has several limitations, which need to be highlighted. This is an observational, retrospective review and therefore suffers from limitations inherent to this type of study. The blood samples were only collected at a single point in time. Serial measurements may provide a better understanding of the status of the endogenous fibrinolytic system over time, which may impact short and long-term outcomes. The sample size is small, therefore limiting the power of the study. We did not use a core lab for measurements of the echo parameters; thus, the investigators were not blinded. However, since blood sample analysis was not available during clinical data collection or event recording, we hope it would limit the bias that may exist. A substantial number of patients in our cohort received advanced therapies for PE (21/179 CDT, 6/179 surgical embolectomy, 4/179 percutaneous embolectomy), which may have altered their course and biased the association of PAI-1, TAFI, and A2A towards the null. However, despite this potential bias, we could still demonstrate a significant association between these markers and mortality.
Conclusion
The endogenous fibrinolytic status phenotype as measured by PAI-1, A2A, and TAFI varies across the spectrum of acute PE. High PAI-1, low A2A, and low TAFI are associated with a higher risk profile. PESI score, cancer, PAI-1, A2A, and TAFI groups are independent predictors of 1-year mortality. Further studies are needed to assess the exact pathophysiological link between fibrinolytic deficit and poor outcomes after acute PE and to ascertain the impact of anti-inhibitors of the fibrinolytic system on outcomes after acute PE.
Supplemental Material
Supplemental material, sj-docx-1-cat-10.1177_10760296231162079 for Fibrinolytic Status and Risk of Death After Acute Pulmonary Embolism by Yevgeniy Brailovsky, DO, MSc, Vladimir Lakhter, DO, Joshua Newman, MD, Sorcha Allen, MBBCh, Ahmed Elkaryoni, MD, Parth Desai, MD, Dalila Masic, PharmD, Carlos F. Bechara, MD, Emily Bontekoe, BS, Debra Hoppensteadt, PhD, John J. Lopez, MD, Fakiha Siddiqui, BDS, Omer Iqbal, PhD, Jawed Fareed, PhD, and Amir Darki,, MD, MSc in Clinical and Applied Thrombosis/Hemostasis
Footnotes
Author Contributions: Study concept and design was handled by Yevgeniy Brailovsky, Amir Darki, and Jawed Fareed, acquisition of data/sample collection was done by Yevgeniy Brailovsky, Fakiha Siddiqui, and Emily Bontekoe, analysis and interpretation of data was carried out by Yevgeniy Brailovsky and Amir Darki, drafting of the manuscript was done by Yevgeniy Brailovsky, Vladimir Lakhter, and Amir Darki, Critical revision of the manuscript for important intellectual content was carried out by Vladimir Lakhter, Joshua Newman, Sorcha Allen, Ahmed Elkaryoni, Parth Desai, Dalila Masic, Carlos F Bechara, Debra Hoppensteadt, John J Lopez, Fakiha Siddiqui, Omer Iqbal, and Jawed Fareed, statistical analysis was performed by Yevgeniy Brailovsky and Amir Darki.
The authors declared no potential conflicts of interest with respect to the research, authorship, and/or publication of this article.
Funding: The authors disclosed receipt of the following financial support for the research, authorship, and/or publication of this article: This study was supported by funding from the Division of Cardiology and Cardiovascular Research Institute, Loyola University Chicago Stritch School of Medicine (Center for Translational Research and Education), and Loyola University Medical Center, Maywood, IL. The funding organization provided the resources for sample storage and analysis.
ORCID iDs: Debra Hoppensteadt https://orcid.org/0000-0001-9342-4213
Jawed Fareed https://orcid.org/0000-0003-3465-2499
Yevgeniy Brailovsky https://orcid.org/0000-0002-4811-5267
Supplemental Material: Supplemental material for this article is available online.
References
- 1.Secemsky E, et al. Contemporary management and outcomes of patients with massive and submassive pulmonary embolism. Am J Med. 2018. doi: 10.1016/j.amjmed.2018.07.035 [DOI] [PubMed] [Google Scholar]
- 2.Chatterjee S, et al. Thrombolysis for pulmonary embolism and risk of all-cause mortality, major bleeding, and intracranial hemorrhage: A meta-analysis. JAMA - J Am Med Assoc. 2014. doi: 10.1001/jama.2014.5990 [DOI] [PubMed] [Google Scholar]
- 3.Part 6: hemostasis and thrombosis, chapter 35: normal hemostasis, fibrinolysis. In: Rodak’s hematology. Saunders; 2020:642‐645. [Google Scholar]
- 4.Stubblefield WB, Alves NJ, Rondina MT, Kline JA. Variable resistance to plasminogen activator initiated fibrinolysis for intermediate-risk pulmonary embolism. PLoS One. 2016. doi: 10.1371/journal.pone.0148747 [DOI] [PMC free article] [PubMed] [Google Scholar]
- 5.Brailovsky Y, et al. Right ventricular outflow doppler predicts low cardiac index in intermediate risk pulmonary embolism. Clin Appl Thromb. 2019. doi: 10.1177/1076029619886062 [DOI] [PMC free article] [PubMed] [Google Scholar]
- 6.Rudski LG, et al. Guidelines for the echocardiographic assessment of the right heart in adults: A report from the American society of echocardiography. Endorsed by the European association of echocardiography, a registered branch of the European society of cardiology, and. J Am Soc Echocardiogr. 2010. doi: 10.1016/j.echo.2010.05.010 [DOI] [PubMed] [Google Scholar]
- 7.Jaff MR, et al. Management of massive and submassive pulmonary embolism, iliofemoral deep vein thrombosis, and chronic thromboembolic pulmonary hypertension: A scientific statement from the American heart association. Circulation. 2011. doi: 10.1161/CIR.0b013e318214914f [DOI] [PubMed] [Google Scholar]
- 8.Becattini C, et al. Risk stratification of patients with acute symptomatic pulmonary embolism based on presence or absence of lower extremity DVT: Systematic review and meta-Analysis. Chest. 2016. doi: 10.1378/chest.15-0808 [DOI] [PubMed] [Google Scholar]
- 9.Jiménez D, et al. Derivation and validation of multimarker prognostication for normotensive patients with acute symptomatic pulmonary embolism. Am J Respir Crit Care Med. 2014. doi: 10.1164/rccm.201311-2040OC [DOI] [PubMed] [Google Scholar]
- 10.Barnes GD, et al. Comparison of 4 acute pulmonary embolism mortality risk scores in patients evaluated by pulmonary embolism response teams. JAMA Netw open. 2020. doi: 10.1001/jamanetworkopen.2020.10779 [DOI] [PMC free article] [PubMed] [Google Scholar]
- 11.Carroll BJ, Piazza G. Hypercoagulable states in arterial and venous thrombosis: When, how, and who to test? Vasc Med (United Kingdom). 2018. doi: 10.1177/1358863X18755927 [DOI] [PubMed] [Google Scholar]
- 12.Singh S, Houng A, Reed GL. Releasing the brakes on the fibrinolytic system in pulmonary emboli: Unique effects of plasminogen activation and α2-antiplasmin inactivation. Circulation. 2017. doi: 10.1161/CIRCULATIONAHA.116.024421 [DOI] [PMC free article] [PubMed] [Google Scholar]
- 13.Zhou J, et al. A first-in-human study of DS-1040, an inhibitor of the activated form of thrombin-activatable fibrinolysis inhibitor, in healthy subjects. J Thromb Haemost. 2017. doi: 10.1111/jth.13658 [DOI] [PubMed] [Google Scholar]
- 14.Singh S, Houng A, Reed GL. Releasing the brakes on the fibrinolytic system in pulmonary emboli. Circulation. 2017. doi: 10.1161/circulationaha.116.024421 [DOI] [PMC free article] [PubMed] [Google Scholar]
Associated Data
This section collects any data citations, data availability statements, or supplementary materials included in this article.
Supplementary Materials
Supplemental material, sj-docx-1-cat-10.1177_10760296231162079 for Fibrinolytic Status and Risk of Death After Acute Pulmonary Embolism by Yevgeniy Brailovsky, DO, MSc, Vladimir Lakhter, DO, Joshua Newman, MD, Sorcha Allen, MBBCh, Ahmed Elkaryoni, MD, Parth Desai, MD, Dalila Masic, PharmD, Carlos F. Bechara, MD, Emily Bontekoe, BS, Debra Hoppensteadt, PhD, John J. Lopez, MD, Fakiha Siddiqui, BDS, Omer Iqbal, PhD, Jawed Fareed, PhD, and Amir Darki,, MD, MSc in Clinical and Applied Thrombosis/Hemostasis


