Abstract
Transcription at most promoters is divergent, initiating at closely spaced oppositely oriented core promoters to produce sense transcripts along with often unstable upstream antisense transcripts (uasTrx). How antisense transcription is regulated and to what extent it is coordinated with sense transcription is not well understood. Here, by combining acute degradation of the multi-functional transcription factor CTCF and nascent transcription measurements, we find that CTCF specifically suppresses antisense but not sense transcription at hundreds of divergent promoters. Primary transcript RNA-FISH shows that CTCF lowers burst fraction but not burst intensity of uasTrx and that co-bursting of sense and antisense transcripts is disfavored. Genome editing, chromatin conformation studies and high-resolution transcript mapping revealed that precisely positioned CTCF directly suppresses the initiation of uasTrx, in a manner independent of its architectural function. In sum, CTCF shapes the transcriptional landscape in part by suppressing upstream antisense transcription.
Reporting summary
Further information on research design is available in the Nature Research Reporting Summary linked to this Article.
Divergent transcription at active promoters is prevalent among eukaryotes, producing upstream antisense transcripts (uasTrx) that, in contrast to sense transcripts, tend to be rapidly processed and short-lived1–5. Different terms have been used to describe uasTrx, including Xrn1-sensitive unstable transcripts (XUTs) in yeast, and cryptic unannotated transcripts (CUTs), stable unannotated transcripts (SUTs), promoter upstream transcripts (PROMPTs) as well as ‘upstream divergent transcripts’ in higher eukaryotes3,6–9. Divergent promoters are nucleosome-depleted regions that are densely occupied by transcription factors. They typically harbor two distinct core promoters positioned in inverted orientations, instructing the assembly of separate transcription pre-initiation complexes (PICs) that transcribe along opposite DNA strands10–13. Transcriptional outputs by divergent promoters in both orientations are generally concordant, suggesting co-regulation2,6,7,14,15. Thus, the simultaneous presence of two PICs may help maintain nucleosome-depleted regions and allow for efficient transcription factor recruitment in both orientations6,11. However, sense and antisense transcription can also be anti-correlated16. In these cases, divergent PICs may compete for common transcription activators or physical space, thus rendering co-occurrence unfavorable17. Therefore, whether and how divergent transcription is coordinated spatially and temporally varies among genes.
CTCF (CCCTC-binding factor) was first identified as a transcription factor and was later recognized to also shape genome topology together with the cohesin protein complex18. CTCF depletion is known to cause genome-wide architectural perturbation but only limited changes in the transcription of coding genes19–27. However, expression of the mammalian genome includes widespread noncoding transcription, which in some cases has been shown to produce functional transcripts28. Whether and how CTCF affects the noncoding transcriptome has remained unexplored experimentally.
Precision nuclear run-on sequencing (PRO-seq) interrogates nascent transcription in a strand-specific manner at high resolution29 (Fig. 1a). We performed PRO-seq in the mouse erythroid cell line G1E-ER4, in which both Ctcf alleles have been modified to bear an auxin-inducible degron (AID) that allows for rapid CTCF degradation27 (Fig. 1b). Overall, we observed limited perturbation of annotated transcripts after acute CTCF depletion27. Notably, however, at 376 active promoters, CTCF loss triggered a significant increase in uasTrx production (Fig. 1c,d and Supplementary Table 1). At 9,632 genes uasTrx was unchanged, and at only 34 genes did uasTrx decline (Fig. 1c,e and Supplementary Table 1). Upregulated uasTrx were heterogeneous in size, with a median of 1,956 nucleotides (Extended Data Fig. 1a). Changes were confirmed by chromatin immunoprecipitation sequencing (ChIP-seq) of RNA polymerase II (Pol II; Extended Data Fig. 1b). Three genes with significant uasTrx (Ahcyl1, Azi2 and Rps3a1; Fig. 1f–h) were selected for validation by quantitative PCR with reverse transcription (RT–qPCR) using multiple primer pairs (Extended Data Fig. 1c,d). Indeed, overall, CTCF depletion led to increases only in the antisense direction, leaving sense transcription of the same genes ostensibly unperturbed (Fig. 1d and Extended Data Fig. 1e–g), suggesting that CTCF regulates the directionality of divergent promoters by exerting strand-specific transcription repression. This is in line with a previous computational analysis in human cell lines30. Of note, at the Rps3a1 gene, a partial reduction in CTCF occupancy was sufficient to trigger a strong uasTrx activation that was further increased upon prolonged CTCF depletion (Extended Data Fig. 1c).
Fig. 1 |. CTCF depletion leads to widespread upregulation of antisense transcription at divergent promoters.
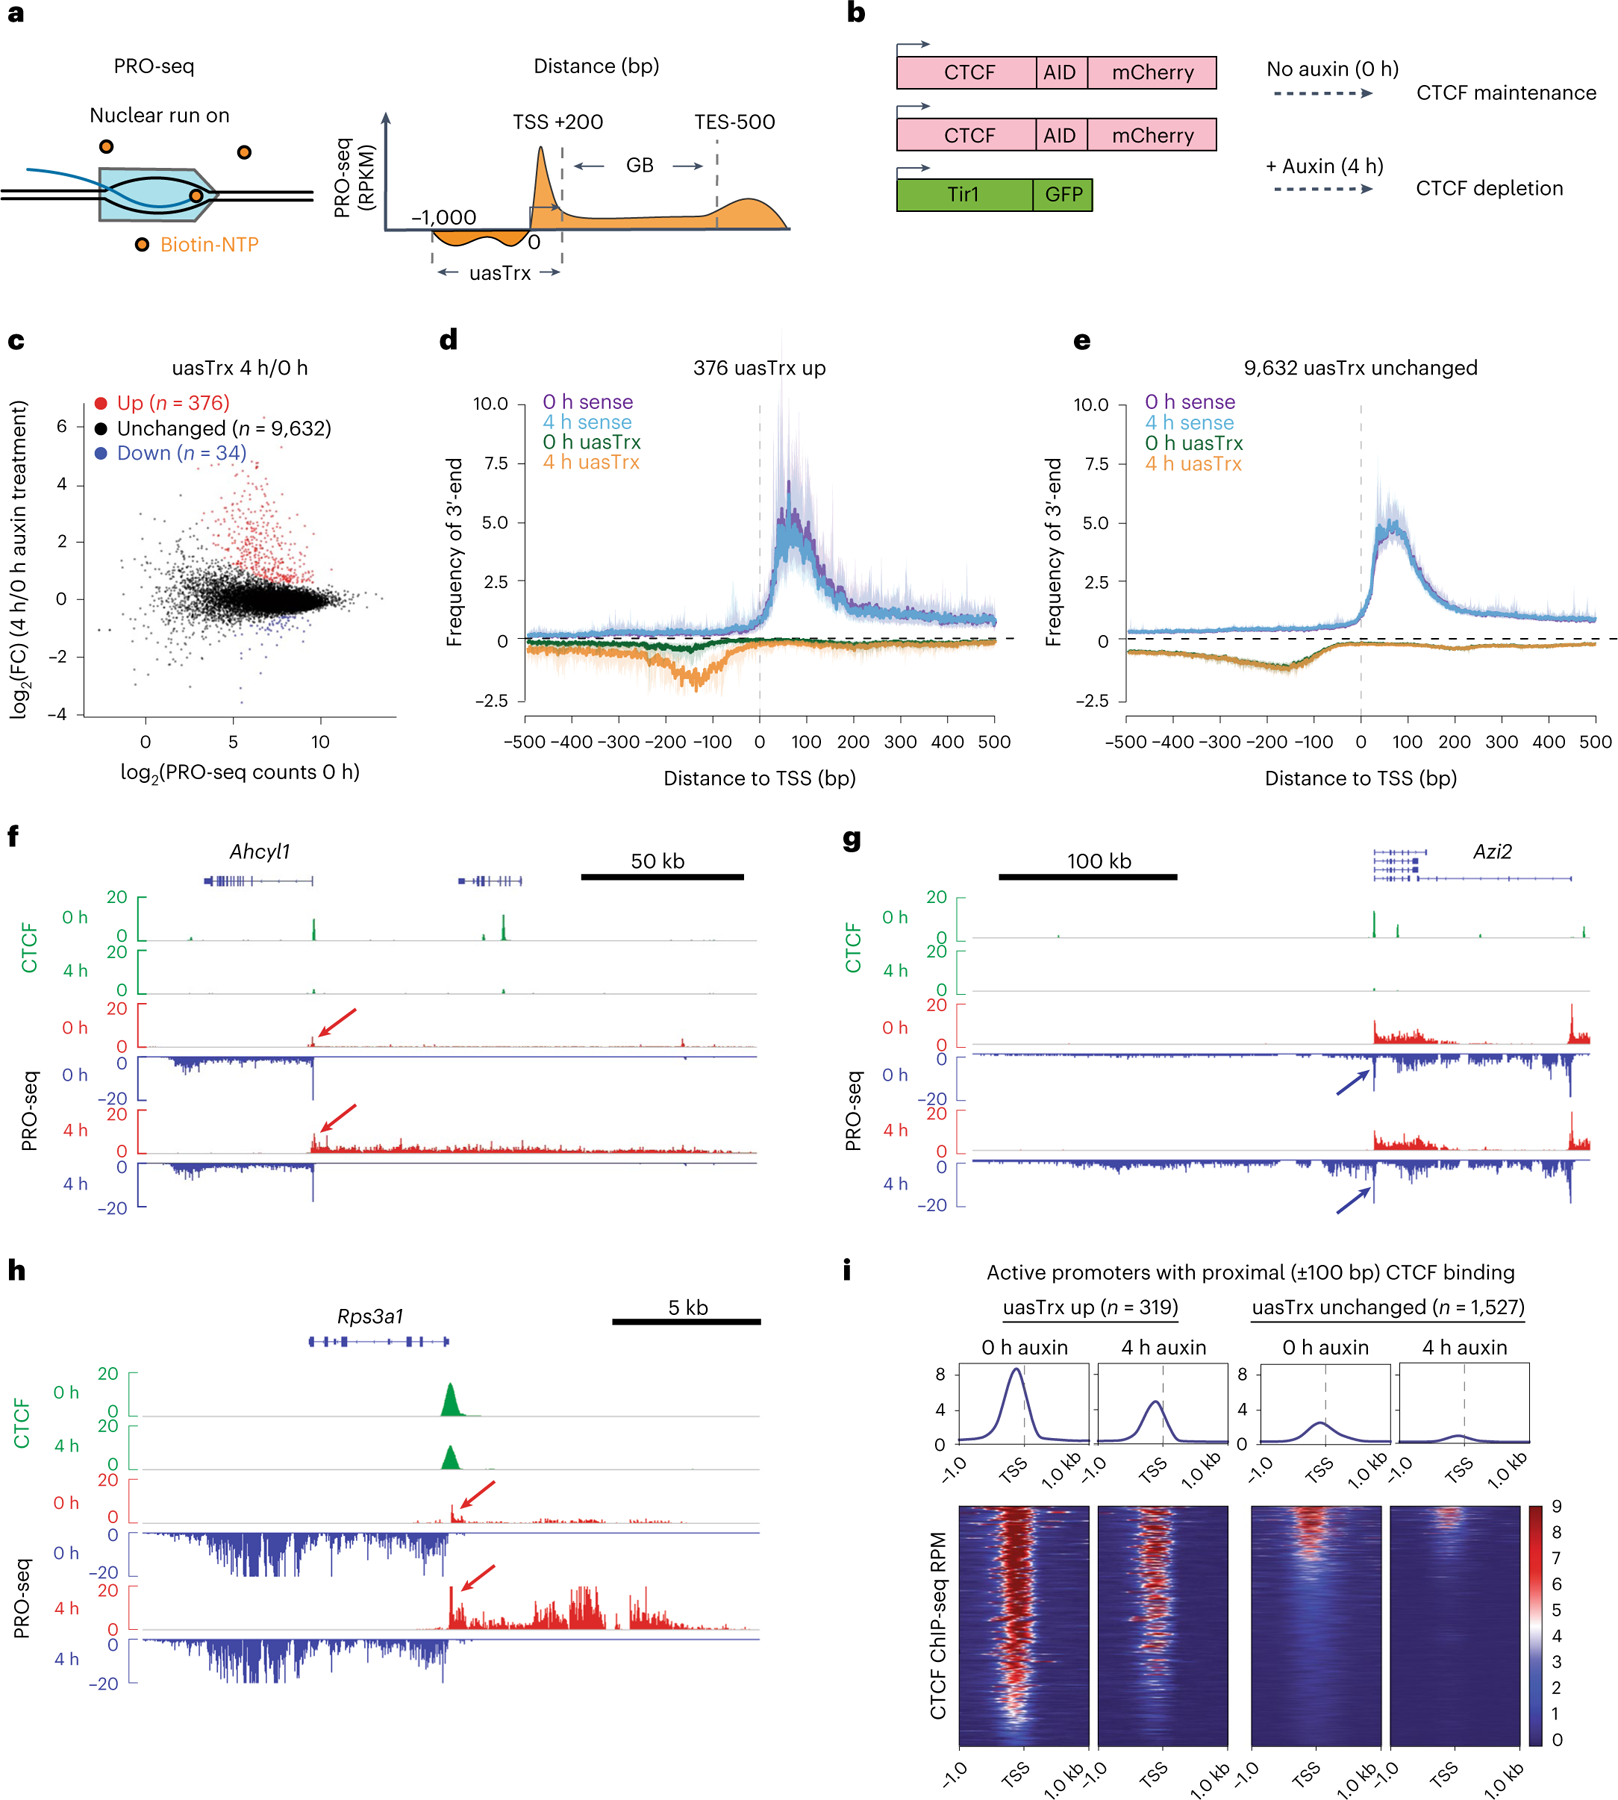
a, Schematic of the PRO-seq experiment (left) and quantification strategy (right). b, Schematic of the experimental set-up. c, PRO-seq MA plot of control versus CTCF-depleted cells on the antisense strand (−1,000 base pair (bp) to +200 bp relative to annotated TSS) in G1E-ER4s. Differentially expressed transcripts are highlighted in color. d, Metaplot of sense and antisense 3′-end PRO-seq mapping, centered at annotated TSSs and plotted with respect to sense orientation for genes with upregulated uasTrx. Solid lines and shading show average signals and the 12.5/87.5th percentiles, respectively. e, As in d for unchanged uasTrx genes. f, Genome browser views of CTCF ChIP-seq (green) and PRO-seq signals (plus strand in red, minus strand in blue) at the Ahcyl1 locus. Arrows point to increased uasTrx. g, As in f for the Azi2 locus. h, As in f for the Rps3a1 locus. i, Heatmaps showing CTCF occupancy at active promoters with proximal (±100 bp) CTCF-binding (up, n = 319; unchanged, n = 1,527) sorted by occupancy level, and shown with respect to sense orientation.
To investigate the direct involvement of CTCF in uasTrx, we determined what percent of the up, down and unchanged uasTrx harbored proximal CTCF binding. The majority (85%) of promoters with upregulated uasTrx displayed CTCF binding within 100 bp (319 of 376), whereas 16% (1,527 of 9,632) and 53% (18 of 34) of unchanged and downregulated uasTrx were CTCF-bound, respectively (Extended Data Fig. 1h). In addition, promoters with upregulated uasTrx tended to have stronger CTCF binding intensities than CTCF-bound start sites that did not gain uasTrx (Fig. 1i). The degree of CTCF-binding reduction upon auxin treatment and the associated gains in uasTrx were only weakly correlated (Extended Data Fig. 1i), suggesting a nonlinear relationship between CTCF occupancy and uasTrx inhibition.
Because strong CTCF-bound sites (CBSs) tend to be conserved across cell types19,27, we assessed CTCF occupancy across mouse tissues31. In contrast to CBSs at unchanged uasTrx promoters, CBSs at upregulated uasTrx regulatory sites were more tissue-invariant (Extended Data Fig. 2a), indicating that uasTrx repression may be a conserved feature. To investigate whether CTCF functions in a similar way in other species and tissues, we performed PRO-seq in the human colorectal carcinoma cell line HCT-116, before and after CTCF depletion. A total of 199 uasTrx were significantly upregulated, 13,034 uasTrx sites were unchanged, and 62 were downregulated (Extended Data Fig. 2b,c and Supplementary Table 2), paralleling the results in murine cells. We also examined previously published RNA-seq datasets in mouse embryonic stem cells (mESCs) and identified 107 upregulated uasTrx, 27,331 unchanged and 70 downregulated uasTrx (Extended Data Fig. 2d)32. Upregulation of uasTrx in both HCT-116 cells and mESCs was similarly associated with strong promoter-proximal CTCF binding (Extended Data Fig. 2e) and an overall lack of sense perturbation (Extended Data Fig. 2f–h and Supplementary Table 2). Upon CTCF recovery following auxin removal, upregulated uasTrx in mESCs were silenced, including the three example genes Ahcyl1, Azi2 and Rps3a1 (Extended Data Fig. 2i,j). Hence, CTCF represses uasTrx at numerous genes across species and cell lineages.
Because promoter-proximal CTCF only suppresses a subset of the uasTrx, we examined features that might determine uasTrx regulation by CTCF. In addition to being enriched for strong CBSs (Fig. 1i), promoters with upregulated uasTrx harbored high levels of cohesin (a protein complex central to genome folding33,34) compared to those that were unchanged upon CTCF depletion (Extended Data Fig. 3a). Furthermore, these promoters are enriched at chromatin loop anchors and chromatin domain boundaries (Extended Data Fig. 3b,c). The associated sense transcripts tend to be housekeeping genes, which are frequently found at domain boundaries35 (Extended Data Fig. 3d). In yeast, chromatin looping (‘gene loops’) was implicated in the control of transcription directionality36. Therefore, we interrogated the possibility that CTCF controls uasTrx production via its architectural functions (Fig. 2a).
Fig. 2 |. CTCF inhibits uasTrx directly and proximally, and independently of its architectural functions.
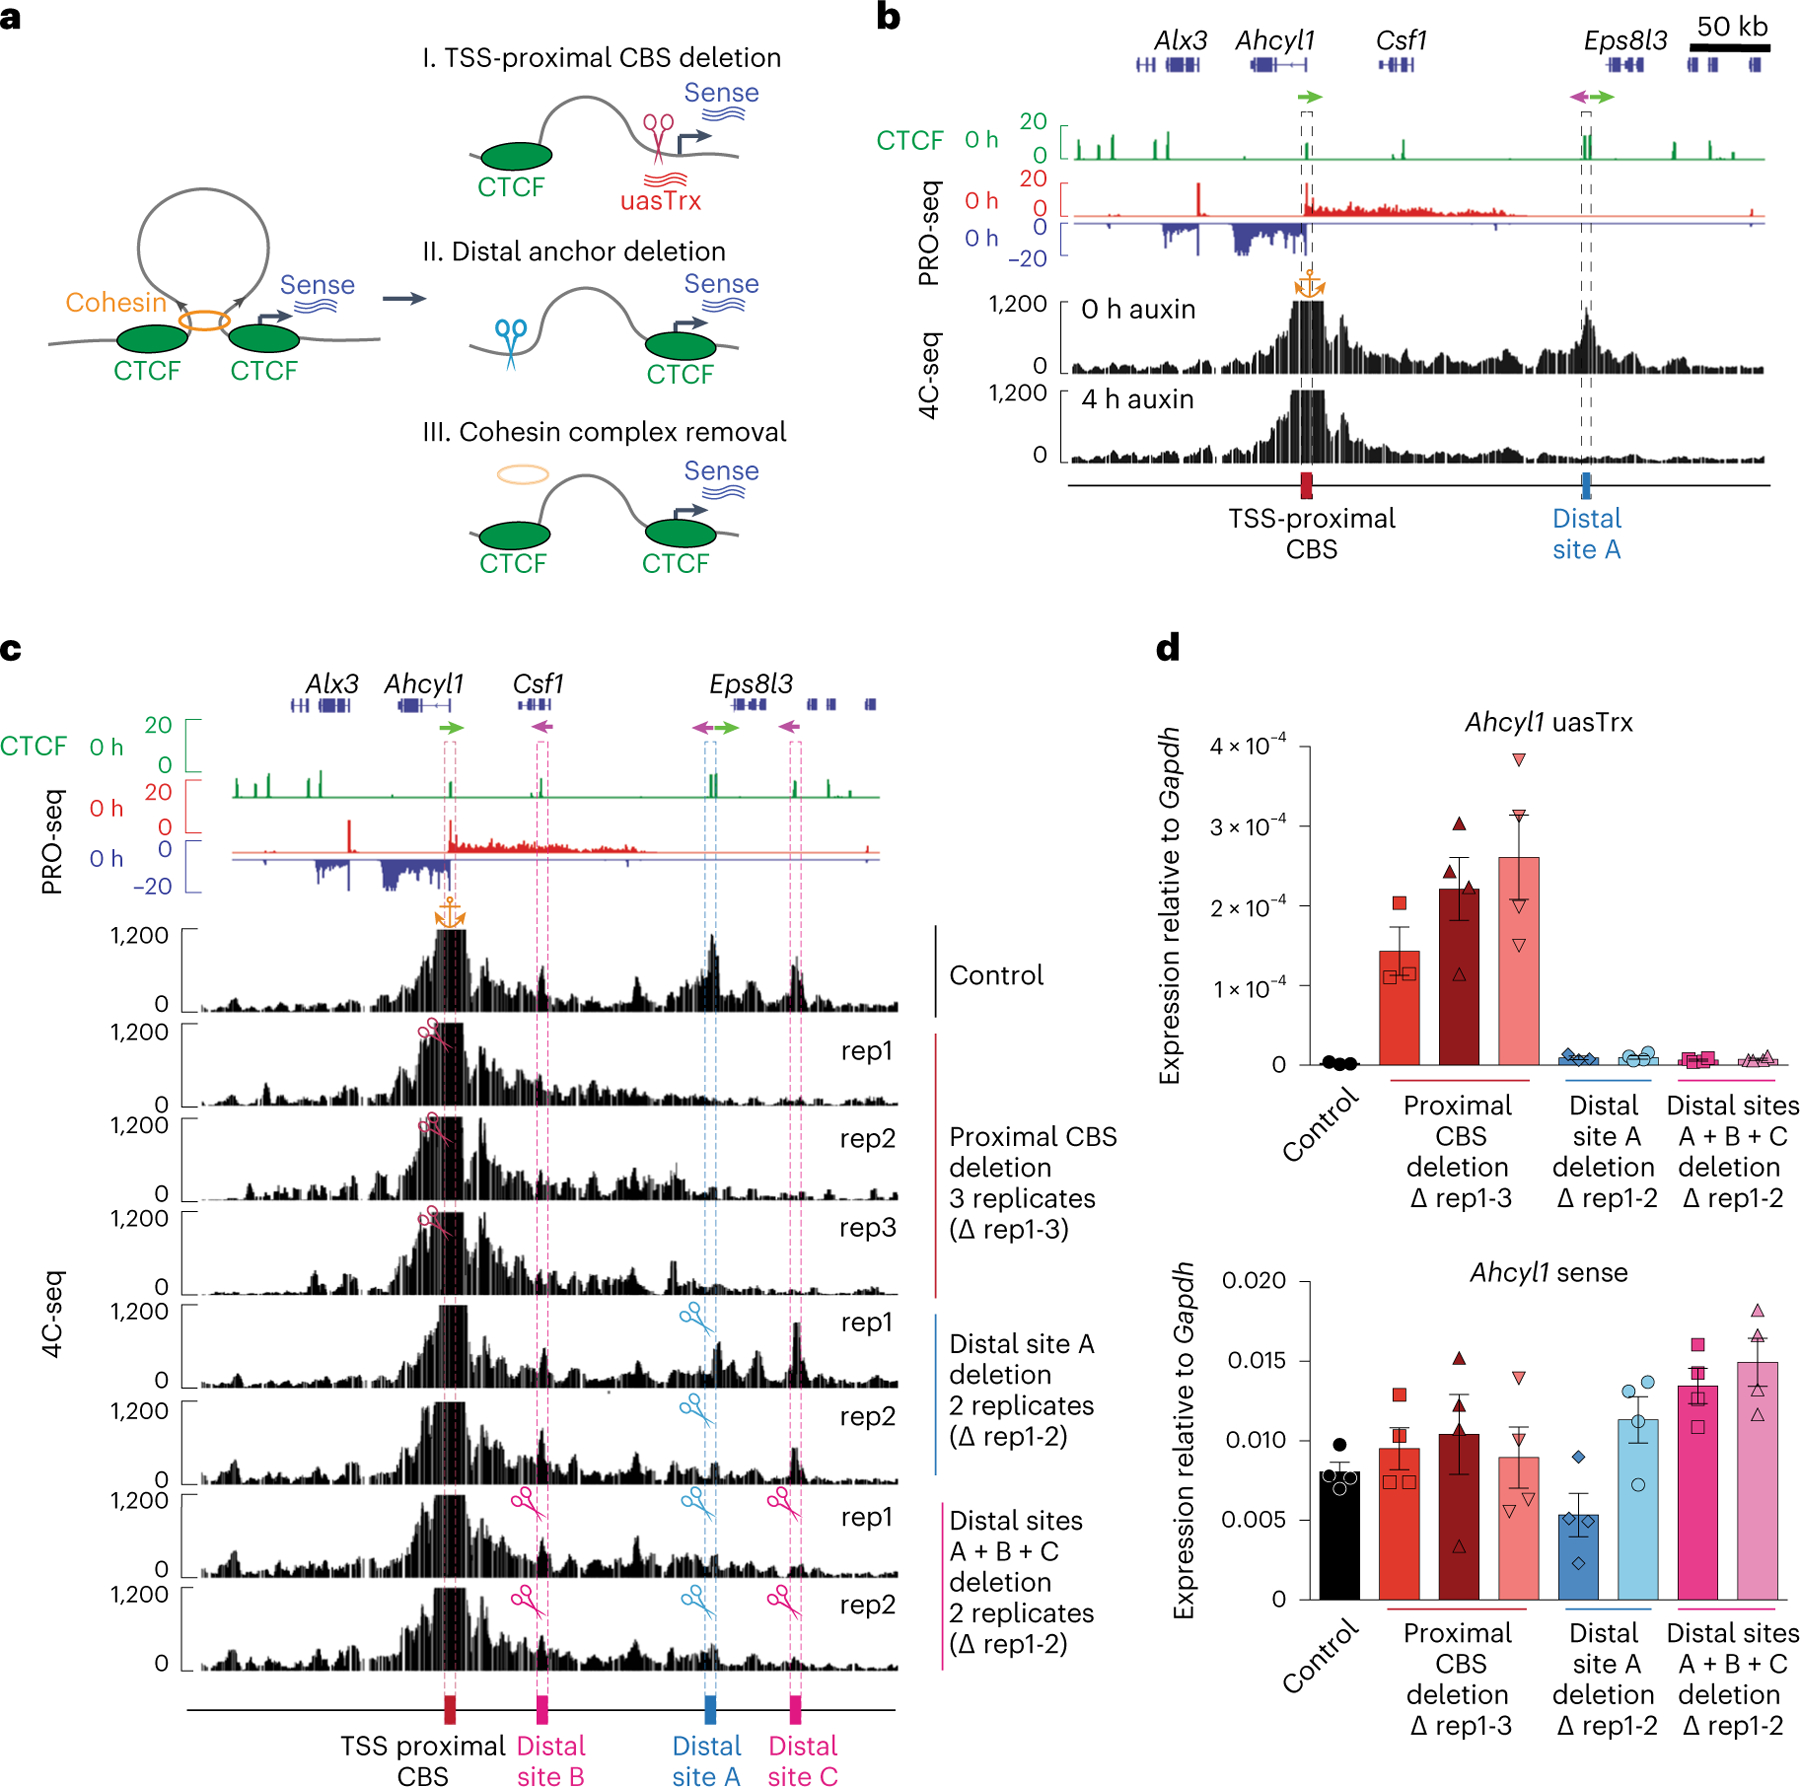
a, Illustration of the experimental strategy and summarized findings from this figure and Extended Data Figs. 3–5. b, Genome browser views of CTCF ChIP-seq, PRO-seq and 4C-seq signals at Ahcyl1. Arrows indicate CTCF motif orientation. 4C-seq anchored at the Ahcyl1 promoter with (4 h auxin) and without (0 h auxin) CTCF degradation. The orange anchor indicates the 4C-seq viewpoint. Sites of interest are indicated below the track and are highlighted by dashed boxes. c, Genome browser tracks of CTCF ChIP-seq and PRO-seq and representative 4C-seq profiles of Ahcyl1 control and edited clones. Similar observations were made in two or three independent 4C-seq experiments. The orange anchor indicates the 4C-seq viewpoint. Arrows indicate CTCF motif orientation. Scissors indicate CRISPR/Cas9-edited regions. d, RT–qPCR of Ahcyl1 uasTrx and sense transcription in control and edited clones. Transcripts were normalized to Gapdh (error bar indicates s.e.m.; n = 4, except for uasTrx control, proximal and distal CBS deletion rep1, for which n = 3). Same analyses with different primer pairs are depicted in Extended Data Fig. 4b,c.
To determine whether CTCF-bound promoters engage in long-range looped interactions, we employed circularized chromosome conformation capture sequencing (4C-seq)37–40 at the three model genes. The Ahcyl1 and Azi2, but not Rp3s1, promoters engaged in significant looping interactions with distal sites (Fig. 2b and Extended Data Fig. 3e,f). Following auxin-mediated CTCF depletion, these loops were strongly diminished, indicating that CBSs are involved in architectural functions (Fig. 2b and Extended Data Fig. 3e).
We next used CRISPR-Cas9-mediated genome editing41 to delete the transcriptional start site (TSS)-proximal CBS or the distal loop anchors. Following TSS-proximal CTCF motif deletion at the Ahcyl1 gene (Extended Data Fig. 3g,h), CTCF binding was reduced (Extended Data Fig. 3i,j), which led to complete loss of the chromatin loop between Ahcyl1 and its distal CTCF site (Fig. 2c). Upon disruption of the TSS-proximal CTCF site at the Azi2 gene, interactions remained, showing that additional sites or factors might play a role in looping at this locus (Extended Data Fig. 4a). Nonetheless, at both genes, uasTrx increased significantly, while sense transcription remained unperturbed (Fig. 2d and Extended Data Fig. 4b–e). Although Rps3a1 was not engaged in obvious three-dimensional interactions (Extended Data Fig. 3f), deletion of its proximal CBS (Extended Data Fig. 4f,g) increased uasTrx without significant changes in sense transcription (Extended Data Fig. 4h,i). In summary, this suggests that CTCF acts directly at the TSS to repress uasTrx.
To test any possible roles of downstream loop engagement, we deleted the distal loop anchors for Ahcyl1 and Azi2. At the Ahcyl1 gene, deletion of the distal site A (Extended Data Fig. 5a,b) led to loss of 4C-seq contacts, with no change in uasTrx production (Fig. 2c,d). Because some additional contacts remained, we removed two more CBSs at 4C-seq contact sites (distal B and distal C; Extended Data Fig. 5c–e), which further reduced interactions with the promoter-proximal CBS (Fig. 2c). None of these perturbations increased uasTrx production (Fig. 2d and Extended Data Fig. 4b,c). At the Azi2 gene, deletion of distal sites A and B (Extended Data Fig. 5f) resulted in loop loss (Extended Data Fig. 4a), but no increase in uasTrx production was observed (Extended Data Fig. 4d,e), arguing against an architectural mechanism by which CTCF inhibits uasTrx.
In further support of this notion, neither CTCF depletion nor CBS removal at the promoters of the Ahcyl1 and Azi2 genes detectably increased contacts between the uasTrx promoters and surrounding putative enhancers (Fig. 2c and Extended Data Fig. 4a). Hence, promoter-proximal CBSs are unlikely to serve as enhancer-blocking insulators. Together, these results suggest that looped contacts do not participate in uasTrx regulation.
Because the proximal CTCF site might still block cohesin-mediated extrusion in the absence of the downstream loop anchor after CRISPR-mediated deletion, we globally disrupted looped contacts by depleting NIPBL, a cohesin-loading factor42, in HCT-116 cells and interrogated transcriptional changes. PRO-seq in NIPBL-deficient cells revealed minimal uasTrx upregulation (Extended Data Fig. 6a and Supplementary Table 2). In addition, we analyzed previously published RNA-seq data from HCT-116 cell lines after rapid cohesin depletion (Cohesin-AID)43. In spite of genome-wide chromatin organization disruption, we did not observe strand-specific uasTrx changes. Instead, hundreds of genes underwent concomitant changes in both sense and antisense directions (Extended Data Fig. 6b–e). Importantly, promoters with changed uasTrx were not enriched for CTCF or RAD21 (Extended Data Fig. 6f), showing that these transcriptional changes are mediated by CTCF-independent mechanisms. These orthogonal approaches demonstrate that CTCF inhibits uasTrx directly and proximally, and probably independently of its architectural functions.
Transcription is known to occur in bursts, with burst frequency and amplitude being subject to modulation44–46. To investigate the effects of CTCF on bursting, and whether sense and antisense transcription are coordinated, we employed single-molecule fluorescence in situ hybridization (smFISH) to quantify (1) transcription burst size (that is, amplitude), (2) burst fraction (related to burst frequency) and (3) co-burst frequency at the Ahcyl1 and Rps3a1 loci. CTCF depletion led to no substantial changes in burst fraction or size on the sense strand, consistent with bulk PRO-seq readouts (Fig. 3a–c). Antisense transcription, on the other hand, underwent significant increases in burst fraction with minimal changes in burst size, suggesting that CTCF mainly affects antisense burst frequency (Fig. 3a–c).
Fig. 3 |. CTCF mainly regulates antisense burst fraction, and sense and antisense co-bursting is disfavored at divergent promoters.
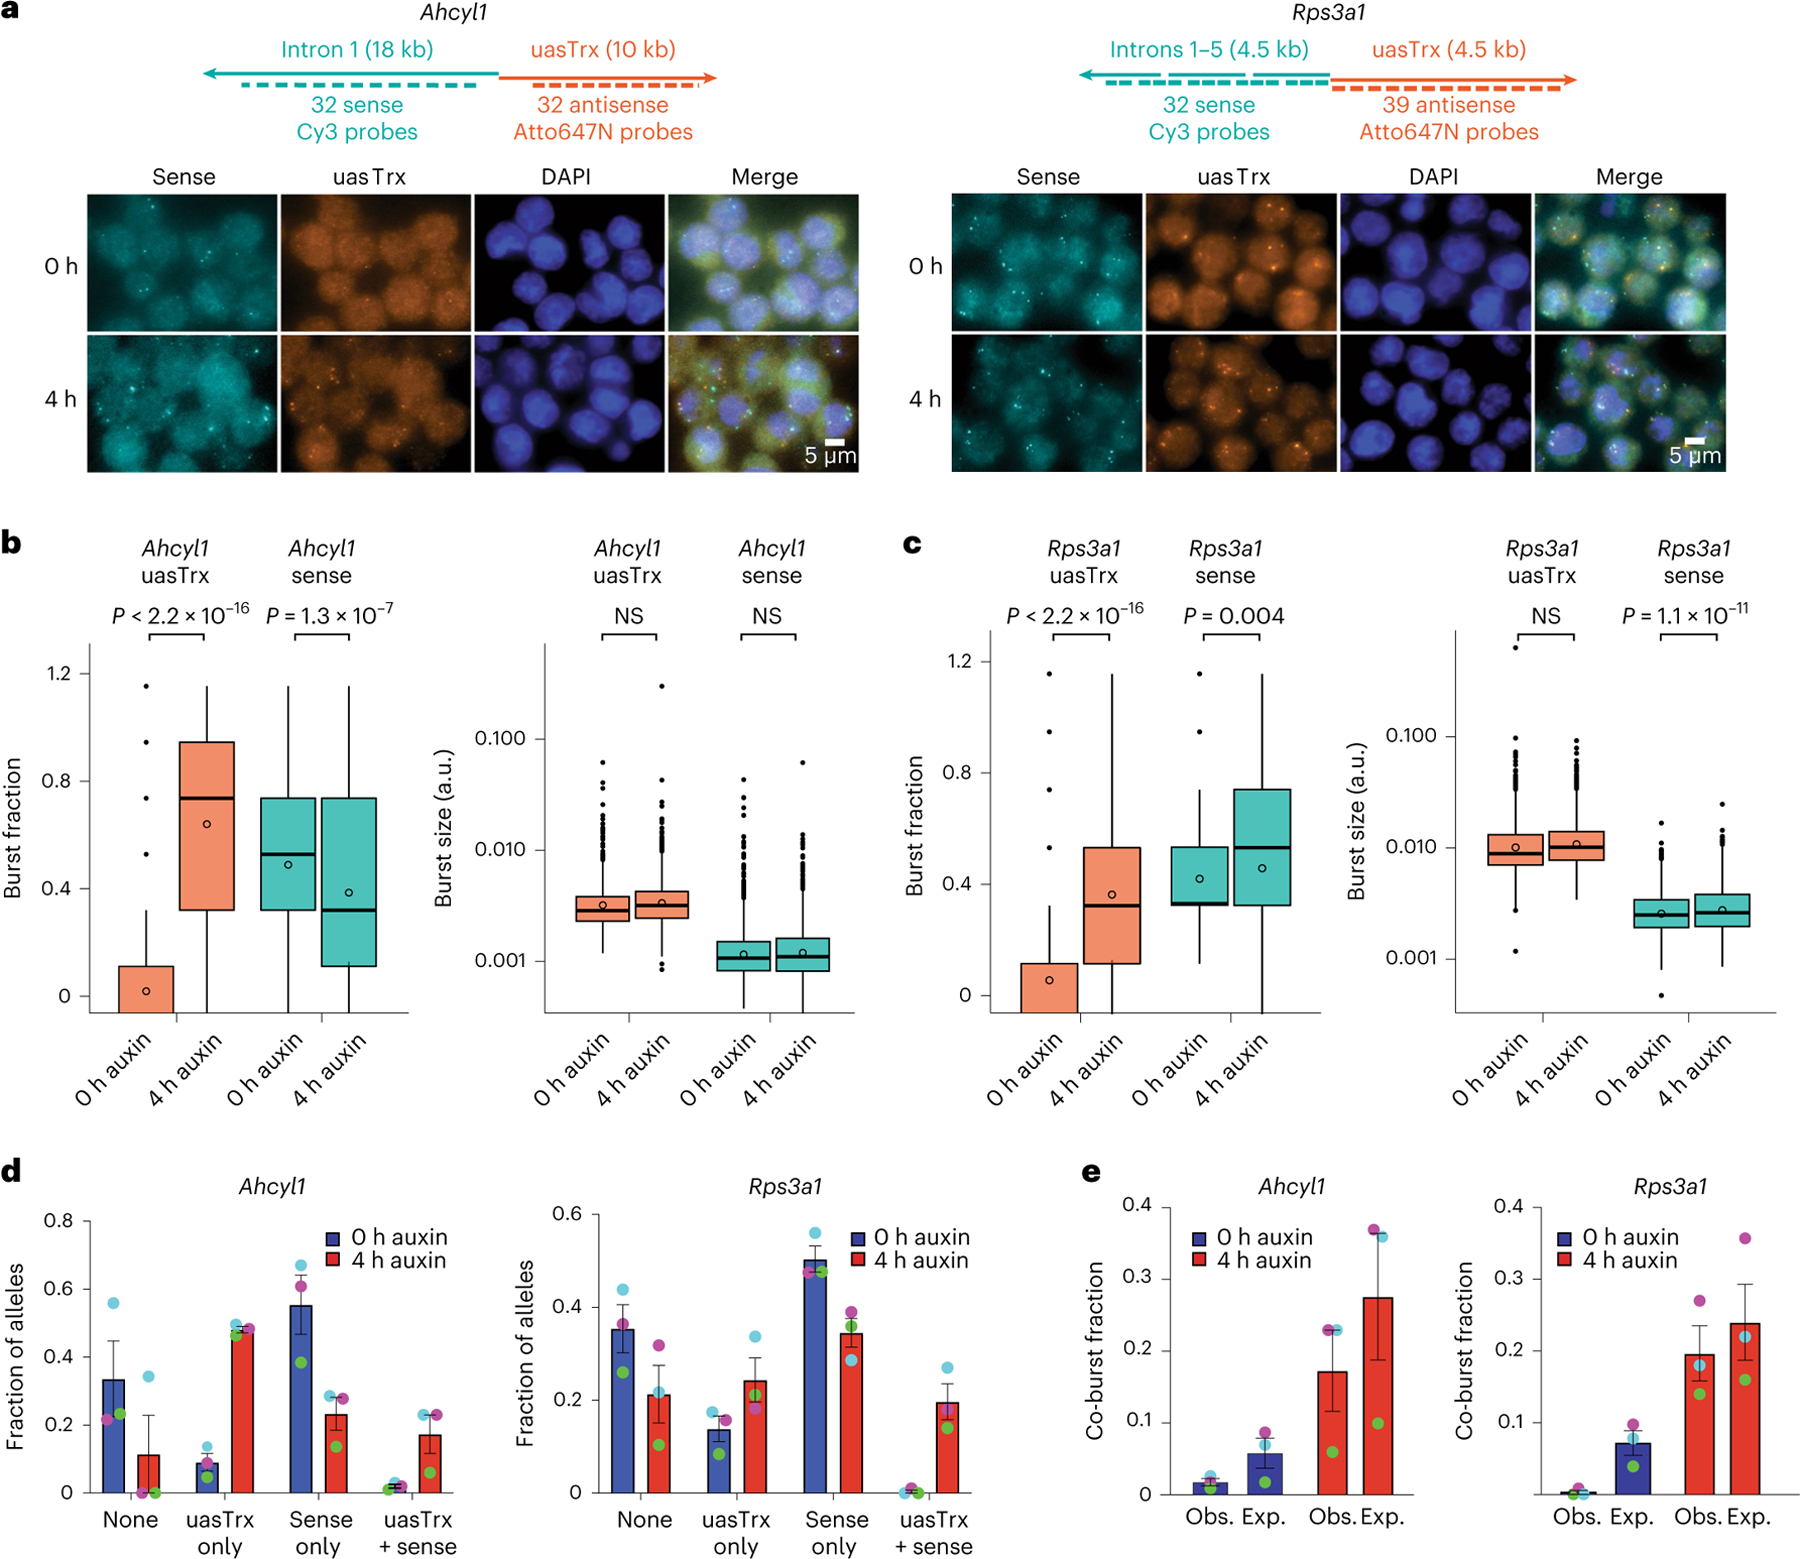
a, Top: maps of RNA-FISH probes targeting sense and antisense nascent transcripts at Ahcyl1 and Rps3a1 loci. Bottom: representative FISH images of three independent replicates before and after CTCF depletion. b, Left: box plot showing antisense and sense burst fractions before and after CTCF depletion at Ahcyl1. Right: box plot showing antisense and sense burst sizes before (0 h) and after (4 h) CTCF depletion. n = 3 biological replicates. P values were calculated by a two-sample t-test. Lower and upper box ends represent the first and third quartiles, with the median indicated as a horizontal line within the box. The mean is indicated by a circle within the box. Whiskers define the smallest and largest values within 1.5 times the interquartile range below the first or above the third quartile, respectively. Outliers are plotted as individual dots. c, As in b but for Rps3a1. d, Left: fraction of Ahcyl1 alleles with different sense/antisense burst status at 0 h and 4 h auxin (error bar, s.e.m.; n = 3). Right: same but for Rps3a1. Biological replicates are matched by dot color. e, Left: expected and observed co-burst fraction at Ahcyl1 at 0 h and 4 h auxin (error bar, s.e.m.; n = 3). Right: same but for Rps3a1. Biological replicates are matched by dot color.
To interrogate sense/antisense burst coordination, we quantified the frequency at which both strands burst alone or together before and after CTCF depletion. At baseline, sense/antisense co-bursting occurred at a minimal number of alleles that was significantly less than expected (that is, the product of sense and antisense burst fractions), suggesting that co-bursting is highly disfavored (Fig. 3d,e and Extended Data Fig. 7a). Upon CTCF removal, co-burst frequency increased but was still observed less frequently than would be expected if these events were independent of each other (Fig. 3e). It is important to note that the results are confounded by the unexpectedly long half-lives (>4 h) of uasTrx at both loci (Extended Data Fig. 7b–f), which causes uasTrx transcripts to persist after completion of a burst, thus reducing temporal resolution of smFISH and inflating signal overlap. Regardless, sense and antisense bursts appear to be anti-coordinated temporally when transcribing from the same divergent promoter, which may indicate competition between sense and antisense transcription.
The process of transcription involves multiple steps, including initiation, pausing of Pol II after transcribing the first 25–60 nucleotides (nt), and release of Pol II into the gene body (GB). CTCF was previously reported to be capable of repressing pause-release in the sense direction47 and has also been implicated in impeding Pol II elongation in the GB48,49. To determine the CTCF-controlled step(s) in uasTrx transcription, we took advantage of the high resolution afforded by PRO-seq. Only active promoters with proximal CTCF binding sites harboring high-confidence CTCF motifs (298 uasTrx up, 1,201 uasTrx unchanged; motif score > 75, Supplementary Table 3) were included in the analysis to ensure precise prediction of CTCF positioning. Mapping of the 3′-ends of PRO-seq reads allows assessment of transcription stalling, while the 5′ end mapping can be used to approximate initiation sites29. Pinpointing initiation sites via mapping of the 5′-ends of PRO-seq reads comes with a modest inaccuracy, because the PRO-seq protocol includes a light RNA hydrolysis step to generate RNA fragments suitable for sequencing. Nevertheless, 5′-end mapping of short paused RNAs can be used to accurately map TSSs11,29,50, because the transcripts associated with stalled Pol II (25–60 nt) are much shorter than the median length of RNA produced during the hydrolysis step (100 nt)51. To validate this, we focused on the 5′-end of sense reads, which confirmed enrichment at annotated TSSs (Extended Data Fig. 8a–c and Methods). We thus used the 5′ base of uasTrx reads to estimate the antisense TSSs. The average distance of 5′ uasTrx to annotated start sites was ~110 bp for upregulated and unchanged uasTrx sites (Extended Data Fig. 8b,c), which is similar to that of divergent promoters found in other mammalian cells11,17.
Changes in transcription initiation and stalling upon CTCF depletion would be expected to give rise to distinct PRO-seq patterns. Specifically, release from CTCF-mediated blockade on transcription initiation would increase the 5′ PRO-seq signal at the region around the motif (Fig. 4a, ‘initiation blockade’). On the other hand, blockade of Pol II processivity would show as significant accumulation of 3′ PRO-seq signals (that is, paused Pol II) upstream of CTCF motifs, which would disperse upon CTCF depletion (Fig. 4b, ‘stalling’). We observed a significant increase of 5′ signal around the motif triggered by CTCF loss at genes with upregulated uasTrx, but not at unchanged genes (Fig. 4c,d). Moreover, 3′ PRO-seq reads did not accumulate at the CBS before depletion (Fig. 4e,f). Together, the evidence points to CTCF repressing uasTrx transcription through initiation inhibition rather than Pol II stalling, which is consistent with our recent observation that the presence of CTCF in gene bodies does not strongly interfere with Pol II processivity27. Finally, CTCF can block uasTrx initiation, regardless of motif orientation: the CTCF motif was present on the same strand as the uasTrx TSS in 33% of the genes with upregulated uasTrx (45% at unchanged genes). Because the CTCF motif was capable of stalling elongation in gene bodies in an orientation-dependent manner (even in the absence of bound CTCF27), this further argues against CTCF functioning as an elongation barrier of uasTrx.
Fig. 4 |. CTCF inhibits antisense transcription initiation through TSS-proximal binding.
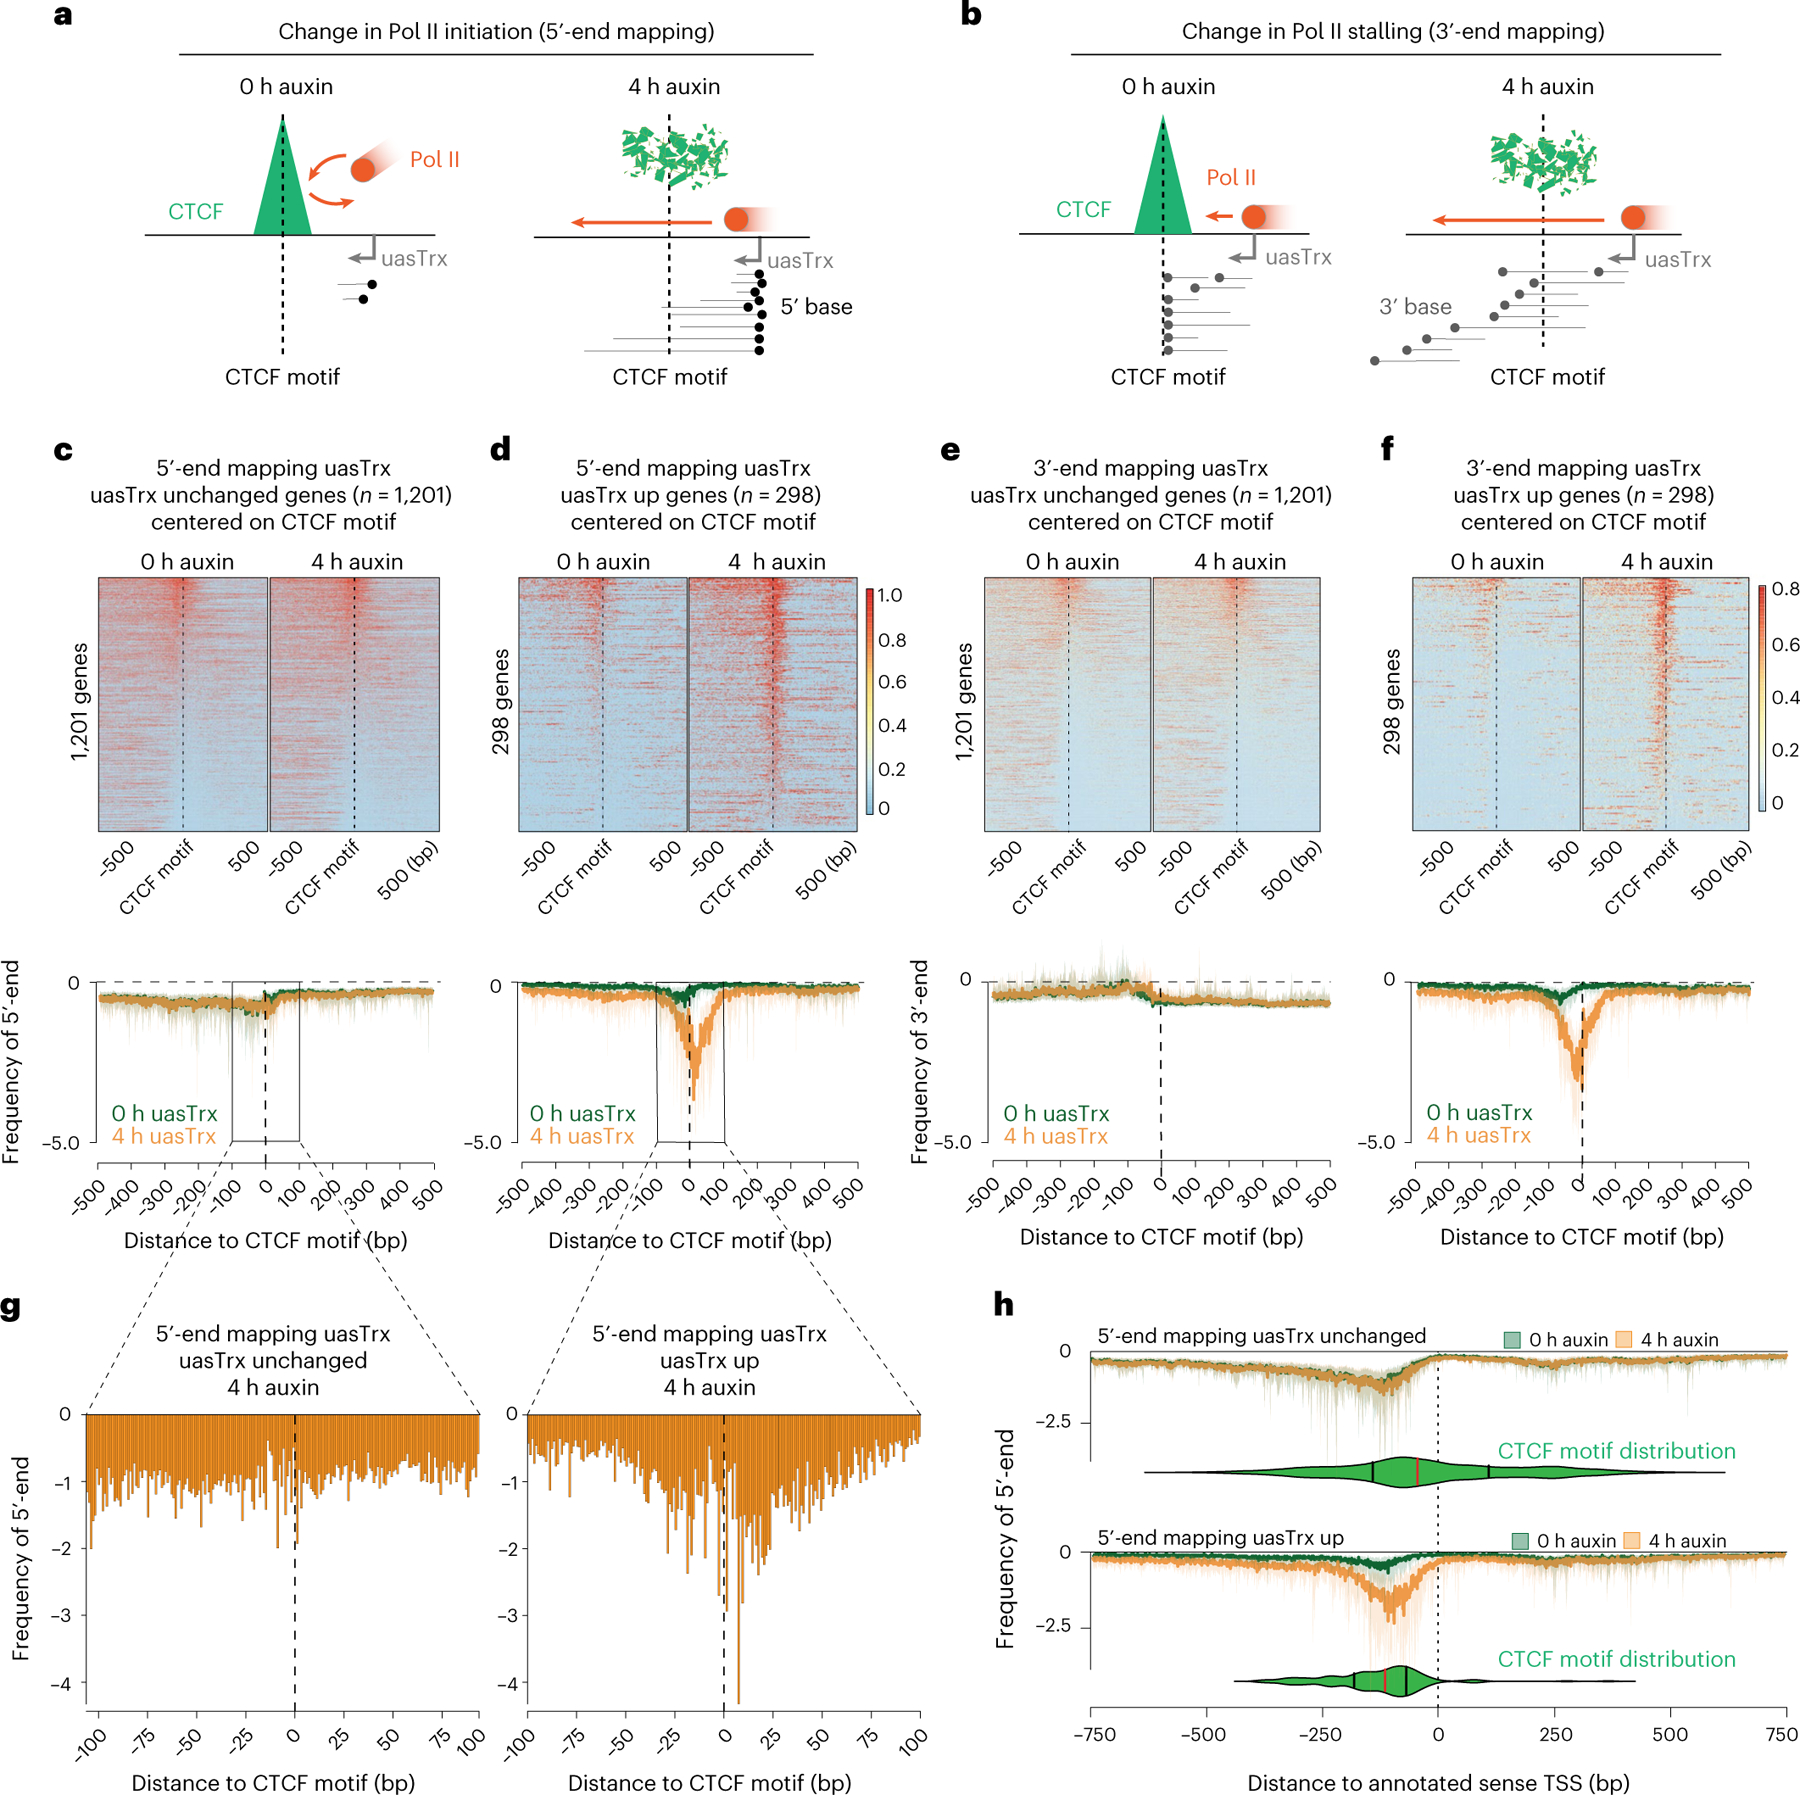
a, Model illustrating expected 5′-end mapping changes if CTCF blocks transcription initiation. b, Model illustrating expected 3′-end mapping changes if CTCF blocks Pol II stalling. c, Top: 5′-end mapping at genes with unchanged uasTrx (n = 1,201) that exhibit proximal CTCF binding and high-confidence CTCF motif(s) (motif prediction score > 75), centered on CTCF motifs, sorted by mean antisense signal densities over the center 200 bp and shown with respect to sense orientation. Black dashed lines highlight CTCF motif locations. Bottom: metaplot of data in the upper panel. d, As in c but for genes with upregulated uasTrx. e, Top: 3′-end mapping at genes with unchanged uasTrx (n = 1,201). Bottom: metaplot of data in the upper panel. f, As in e but for genes with upregulated uasTrx (n = 298). g, Zoom of 5′-end mapping of uasTrx, centered on the CTCF motif, after (4 h) CTCF depletion at genes with unchanged and upregulated uasTrx. h, 5′-end mapping before (0 h) and after (4 h) CTCF depletion centered on the annotated sense TSS. CTCF motif locations are indicated by the green violin plots (median in red, upper and lower quartiles in black) below PRO-seq tracks.
Strikingly, the CTCF motif is located predominantly within a 50-bp window of the uasTrx initiation site, with bias towards a downstream position at affected promoters (Fig. 4g). This is reminiscent of a previous observation that CBSs tend to reside at the borders of transcription initiation clusters51. This distinct spatial arrangement is in stark contrast to unperturbed promoters at which the uasTrx initiation sites were more broadly distributed (Fig. 4g). A fraction (120 of 1,201) of the unperturbed promoters did harbor CBSs downstream and proximal to the uasTrx initiation sites (Extended Data Fig. 8d, ‘downstream proximal’). A closer look revealed an upward trend of uasTrx production at these genes, even though they had been omitted in the perturbed group because of thresholding (Extended Data Fig. 8e,f). Therefore, upregulation of uasTrx upon CTCF loss is linked to positioning of the CBS.
The positions of sense transcription initiation remained essentially the same upon CTCF depletion (Extended Data Fig. 9a,b), with few exceptions. The latter include the Eif2s1 gene, for which CTCF depletion exposed an additional start site of the sense transcript (Extended Data Fig. 9c). At the Nsmce4a gene, the uasTrx overlapped with the sense transcript, implying convergent transcription (Extended Data Fig. 9d). Regardless, in the overwhelming majority of cases, the position of sense initiation did not change significantly upon uasTrx upregulation (Extended Data Fig. 9e,f).
We did note a very subtle global trend of decreased levels in sense initiation (TSS −50 to +150 bp) for genes with upregulated uasTrx compared to unchanged genes (compare the purple and blue tracks in Extended Data Figs. 8b and 9g). However, 95% of the genes with upregulated uasTrx showed no significant difference in sense transcription initiation (false discovery rate (FDR) > 0.05 or fold change (FC) < 1.5), while 1% of genes displayed sense upregulation and 4% sense downregulation, respectively. This suggests that there is no universal rule with regard to the relationship of sense and antisense transcription initiation upon CTCF depletion.
We next centered 5′-end PRO-seq reads of uasTrx TSSs and the CTCF motifs on the sense TSSs. This revealed that at 280 of 298 upregulated uasTrx (94%), the CTCF motif was positioned upstream of the sense TSS (Fig. 4h). In contrast, 61% (728 of 1,201) of genes at which uasTrx was unchanged harbored CTCF sites upstream of the sense TSS (Fig. 4h). These results suggest that if CTCF suppresses antisense Pol II initiation, it does so within a confined space from the CTCF motif that is located upstream of the sense TSS.
A variety of factors have been shown to affect uasTrx transcription, including the oncoprotein MYC, transcription elongation factor SPT6, transcription factor Rap1, R-loop formation, looped contacts, histone modifications and chromatin remodeling proteins (for example, MOT1, INO80 and NC2)36,52–57. In many instances, perturbations of these factors were also accompanied by changes in the sense transcription, which contrasts with the present findings and suggests that CTCF functions through mechanisms distinct from those previously reported. On the other hand, the CAF-1 complex and histone H3K56 acetylation have been shown to suppress antisense transcription without significantly perturbing sense transcription in yeast14, but it remains to be tested whether a similar process is operational in mammalian cells and whether CTCF is involved.
Our smFISH results show that CTCF removal increases uasTrx burst fraction. Because CTCF can block enhancer-promoter contacts58,59, and because enhancers can increase burst fraction60, it was conceivable that CTCF loss leads to illegitimate enhancer contacts. However, we did not observe increased long-range contacts upon CTCF loss. Our 5′ and 3′ PRO-seq read mapping further suggests that CTCF inhibits uasTrx production at the step of transcription initiation and not elongation (Fig. 4g). Single-molecule RNA-FISH at two genes revealed that co-bursting of divergent transcripts is disfavored, suggesting that at higher temporal resolution the oppositely oriented core promoters may compete at the level of transcription initiation. The mechanisms underlying this competition are unclear but may include steric hindrance and/or local DNA structure alterations, where supercoiling from transcription in one direction impacts transcription dynamics of the other61,62. Although divergent transcription is largely concordant in population-based assays1,2,7,14,15, that concordance might be a reflection of overall promoter strength rather than a direct coordination of sense/antisense core promoters.
CTCF at gene promoters has been invoked to facilitate communication with enhancers20,63. Nevertheless, CTCF (previously also known as NeP1) was originally shown to function as a direct transcriptional repressor in reporter gene assays47,64, either alone or perhaps by aiding the adjacent binding of a distinct repressor molecule64. The CTCF function uncovered here is novel and distinct in that it blocks initiation selectively of uasTrx production at hundreds of genes. It is possible that the initiation block by CTCF occurs via steric hindrance, preventing PIC assembly, by recruiting co-repressors, or by facilitating the binding of neighboring repressor molecules. Regardless, our study demonstrates that CTCF can play separate and independent roles in both genome architecture and transcriptional regulation, even at sites with architectural connectivity. In summary, we uncovered a novel role for CTCF as direct and selective repressor of uasTrx production, independent of its architectural functions, which expands CTCF’s role in controlling the noncoding genome.
Methods
Experiments
Cell culture and maintenance.
G1E-ER4 is an established murine erythroblast cell line65. G1E-ER4 cells were grown in IMDM + 15% FBS, penicillin/streptomycin, Kit ligand, monothioglycerol and erythropoietin in a standard tissue culture incubator at 37 °C with 5% CO2. Cells were maintained at a density below 1 million per ml at all times. CTCF depletion in G1E-ER4 cells was induced by adding 1 mM auxin to cell cultures. The nascent RNA half-life was assessed by quantifying transcript levels via smFISH and RT–qPCR after transcription blockade for 0 h, 4 h and 6 h with 75 μM 5,6-dichloro-1-β-d-ribofuranosylbenzimidazole (DRB). HCT-116 cells (ATCC, CCL-247) were cultured in McCoy’s 5A medium supplemented with 10% FBS, 2 mM l-glutamine, 100 U ml−1 penicillin and 100 μg ml−1 streptomycin at 37 °C and 5% CO2.
siRNA-mediated CTCF/NIPBL depletion.
RNAi was performed in HCT-116 cells as previously described using published small interfering RNAs (siRNAs)66 with a final concentration of 50 nM (non-targeting control, NIPBL) or 150 nM (CTCF). Cells were collected after 72 h of treatment.
CRISPR-Cas9-mediated genome editing.
All CRISPR editing was performed in a previously established Cas9-TagBFP expressing G1E-ER4 cell line to enhance editing efficiency27. All single guide RNA (sgRNA) encoding oligonucleotides were inserted into a retroviral U6-sgRNA-PGK-GFP expression vector67 using a BsmBI restriction site and transfected into cells using an Amaxa II electroporator (Lonza, program G-016) and Amax II Cell Line Nucleofector Kit (R) (Lonza, VCA-1001). GFP+ cells were sorted by fluorescence activated cell sorting at 24 h post-transfection, followed by single-cell clone screening and genotyping by Sanger sequencing. All guide RNA sequences were obtained using the CRISPR design tool (https://zlab.bio/guide-design-resources)68. Guide sequences are listed in Supplementary Table 4.
PRO-seq library preparation.
PRO-seq libraries in G1E-ER4 was performed as described previously27. For each library, 50 million cells were used with two million Drosophila Schneider 2 (S2) cells added as spike-in to control for potential global bias associated with library scaling. Fragments longer than 140 bp from the PCR-amplified library were selected and sequenced (2 × 75 bp) on the Illumina NextSeq 500 platform, according to the manufacturer’s instructions, to a depth of ~100 million/library.
PRO-seq libraries in HCT-116 were performed by the Nascent Transcriptomics Core at Harvard Medical School. Specifically, aliquots of frozen (−80 °C) permeabilized cells were thawed on ice and pipetted gently to fully resuspend. For each sample, one million permeabilized cells were used, with 50,000 permeabilized Drosophila S2 added for normalization. Nuclear run-on assays and library preparation were performed as described in ref.69 with the following modifications: 2X nuclear run-on buffer consisted of 10 mM Tris (pH 8), 10 mM MgCl2, 1 mM DTT, 300 mM KCl, 40 μM for each of the four biotin-11-NTPs (Perkin Elmer), 0.8 U μl−1 SuperaseIN (Thermo) and 1% sarkosyl. Run-on reactions were performed at 37 °C. Adenylated 3′ adapter was prepared using the 5′ DNA adenylation kit (NEB) and ligated using T4 RNA ligase 2, truncated KQ (NEB, as per the manufacturer’s instructions, with 15% PEG-8000 final) and incubated at 16 °C overnight. Betaine blocking buffer (180 μl; 1.42 g of betaine brought to 10 ml with binding buffer supplemented to 0.6 μM blocking oligo (TCCGACGATCCCACGTTCCCGTGG/3InvdT/)) was mixed with ligations and incubated for 5 min at 65 °C and 2 min on ice before the addition of streptavidin beads. After T4 polynucleotide kinase (NEB) treatment, beads were washed once each with high salt, low salt and blocking oligo wash (0.25X T4 RNA ligase buffer (NEB), 0.3 μM blocking oligo) solutions and resuspended in 5′ adapter mix (10 pmol 5′ adapter, 30 pmol blocking oligo, water). The 5′ adapter ligation was per Reimer et al.69 but with 15% PEG-8000 final. Eluted complementary DNA (cDNA) was amplified for five cycles (NEBNext Ultra II Q5 master mix (NEB) with Illumina TruSeq PCR primers RP-1 and RPI-X) following the manufacturer’s suggested cycling protocol for library construction. A portion of preCR was serially diluted for test amplification to determine the optimal amplification of the final libraries. Pooled libraries were sequenced using the Illumina NovaSeq platform.
RNA extraction, cDNA synthesis and RT–qPCR.
Cells were harvested in buffer RLT Plus (Qiagen, cat. no. 1053393) with lysate homogenized using QIAshredders (Qiagen, cat. no. 79656), followed by RNA purification with an RNeasy Mini Kit that included an on-column DNase treatment step (Qiagen, cat. no. 74106). cDNA was synthesized with iScript Supermix (Bio-Rad, cat. no. 1708841). qPCR was performed using a Power SYBR Green kit (Invitrogen, cat. no. 4368577) with signals detected by a ViiA7 System (Life Technologies). Primers used for RT–qPCR are listed in Supplementary Table 4.
ChIP-seq library preparation.
ChIP was performed as previously described64. The used antibodies include CTCF (Millipore, cat. no. 07–729), POLR2A (Cell Signaling, cat. no. 14958) and immunoglobulin-G from rabbit serum (Sigma, cat. no. 15006). qPCR was performed using a Power SYBR Green kit (Invitrogen, cat. no. 4368577) with signals detected by a ViiA7 System (Life Technologies). ChIP-seq libraries were prepared using Illumina’s TruSeq ChIP sample preparation kit (Illumina, cat. no. IP-202–1012) according to the manufacturer’s specifications, with the addition of size selection (left side at 0.9×, right side at 0.6×) using SPRIselect beads (Beckman Coulter, cat. no. B23318). Library size was determined (average 351 bp, range 333–372 bp) using the Agilent Bioanalyzer 2100, followed by quantitation using real-time PCR using the KAPA Library Quant Kit for Illumina (KAPA Biosystems, cat. no. KK4835). Libraries were then pooled and sequenced (1 × 75 bp) on the Illumina NextSeq 500 platform according to the manufacturer’s instructions. Bclfastq2 v 2.15.04 (default parameters) was used to convert reads to fastq. Primers used for ChIP-qPCR are listed in Supplementary Table 4.
4C-seq sample preparation.
The 4C-seq experiments were performed as previously described using DpnII and Csp6I as restriction enzymes70,71. Sequencing was carried out on an Illumina HiSeq 2000 genome sequencer with reads mapped onto mm9. Reads mapping to multiple fragment ends were removed, and 4C coverage was computed by averaging mapped reads in running windows of 41 fragment ends. Amplification primers for each viewpoint are listed in Supplementary Table 4. The quality of all libraries met previously described standards71 based on the cis/overall ratio and the percentage of covered fragment ends within a 0.2-Mb window around the viewpoints.
Single-molecule FISH imaging.
Single-molecule RNA-FISH was performed as previously described72. All sense probes used were complementary to introns of the gene of interest and are listed in Supplementary Table 5. Briefly, cells were fixed in 1.85% formaldehyde for 10 min at room temperature and stored in 70% ethanol at 4 °C. Pools of fluorophore-conjugated FISH probes were hybridized to samples overnight, followed by 4′,6-diamidino-2-phenylindole (DAPI) staining and washes performed in suspension. Cells were cytospun onto slides for imaging on a Nikon Ti-E inverted fluorescence microscope using a ×100 Plan-Apo objective (numerical aperture of 1.43), a cooled charge-coupled device (CCD) camera (Pixis 1024B from Princeton Instruments) and filter sets SP102v1 (Chroma), SP104v2 (Chroma) and 31000v2 (Chroma) for Cy3, Atto647N and DAPI, respectively. Slides were imaged in 36 optical z sections at intervals of 0.35 μm with a 1-s exposure time for Cy3/Atto647N and 35 ms for DAPI.
Analysis
PRO-seq quantification.
Read alignment and the identification of active transcripts have been described in detail previously27. An arbitrary window of +200 bp relative to the RefSeq-annotated TSS to −500 bp relative to the TES was used to quantify sense transcript levels to avoid any confounding effects associated with promoter-proximal pausing. A window of −1,000 bp to +200 bp relative to TSS was selected to quantify uasTrx changes unless noted otherwise. Differential expression analysis was performed using the paired DESeq2 method73 with FDR < 0.05 and FC > 1.5 as thresholds. Each upregulated uasTrx in G1E-ER4s was confirmed visually to rule out false positives such as run-throughs from nearby upregulated genes. For analysis of the PRO-seq datasets published in Rao et al.43, only active genes identified by the authors were included for characterization.
The start and end sites of uasTrx were annotated as follows. (1) Reads less than 100-bp long were extended to 100 bp from the 3′-end to ‘smooth over’ PRO-seq signals. (2) Regions overlapping any known transcripts were masked. (3) Global averaged sequencing depth was obtained by dividing all mapped reads over the entire genome. (4) Unbroken regions starting within 500 bp of the annotated TSSs on the antisense strand and with sequencing depth exceeding the global average were counted as part of uasTrx and taken into consideration for length estimates.
Benchmark use of 5′-end mapping for detection of initiation sites.
The use of 5′-end mapping was benchmarked using a training set of 1,395 active, known, TSSs with highest enrichment in a window of ±50 bp around the TSS (Extended Data Fig. 8a). The 5′-end mapping of sense reads confirmed enrichment of 5′-ends at annotated TSSs.
RNA-seq quantification.
A window of −2,000 bp to −50 bp relative to the annotated TSSs was used to quantify uasTrx in unstranded RNA-seq datasets published in Nora et al.32 to minimize the inclusion of sense signals. DESeq2 was applied to the read count matrix to evaluate differential expression between groups.
ChIP-seq analysis.
Bowtie 1.1.0 was used to align sequences to the mm9 reference genome74. Reads with more than one mismatch or multiple alignments were excluded. Significantly enriched regions were called using MACS2 version 2.1.075 with the following parameters: p = 105, extsize = 300 and local lambda = 100,000 using whole-cell extract input controls. Reads for the bigwigs were read per million (RPM) normalized.
Single-molecule FISH image analysis.
Nuclear boundaries were segmented manually from DAPI images, with RNA spots localized and quantified using custom software written in MATLAB76. Transcription sites were identified by bright nuclear intron spots, and fluorescence intensities of transcription sites were determined by 2D Gaussian fitting on processed image data. Subsequent analysis was performed in R. To identify sense and antisense co-transcription status, a wide range of sense–antisense distance thresholds were tested, ranging from 1 pixel (our resolution limit) to 10 pixels (1.3 μm). Almost all distance thresholds yielded similar results. The results shown in Fig. 3 and Extended Data Fig. 7 are based on a distance threshold of 3 pixels (0.39 μm).
Gene ontology analysis.
Gene ontology (GO) analysis was performed using the PANTHER overrepresentation test (release 20210224) against all Mus musculus genes in the database as background. Fisher’s exact test was performed with FDR correction. The GO Ontology database is at https://doi.org/10.5281/zenodo.4495804 (version 2021–02-01).
Metaplots.
All metaplots were generated as previously described51 and show estimated average signals and the 87.5th and 12.5th percentiles obtained from bootstrapping.
Statistical analysis.
Analyses were performed and plotted using R (R studio version 1.1.383) or GraphPad Prism 9. Lower and upper box ends represent the first and third quartiles, with the median indicated as a horizontal line within the box. The mean is indicated by a circle within the box. Whiskers define the smallest and largest values within 1.5 times the interquartile range below the first or above the third quartile, respectively. Outliers are plotted as individual dots. Images for RNA-FISH experiments in Fig. 3a,b and Extended Data Fig. 7c are representative of three independent replicates. No statistical method was used to predetermine the sample size. We used sample sizes commonly accepted in the field for high-throughput genome-wide experiments. The experiments were not randomized, and investigators were not blinded to allocation during experiments and outcome assessment because the experiments were performed under controlled conditions (that is, addition of auxin to tissue culture medium versus no auxin addition).
Extended Data
Extended Data Fig. 1 |. CTCF depletion leads to widespread uasTrx upregulation at divergent promoters.
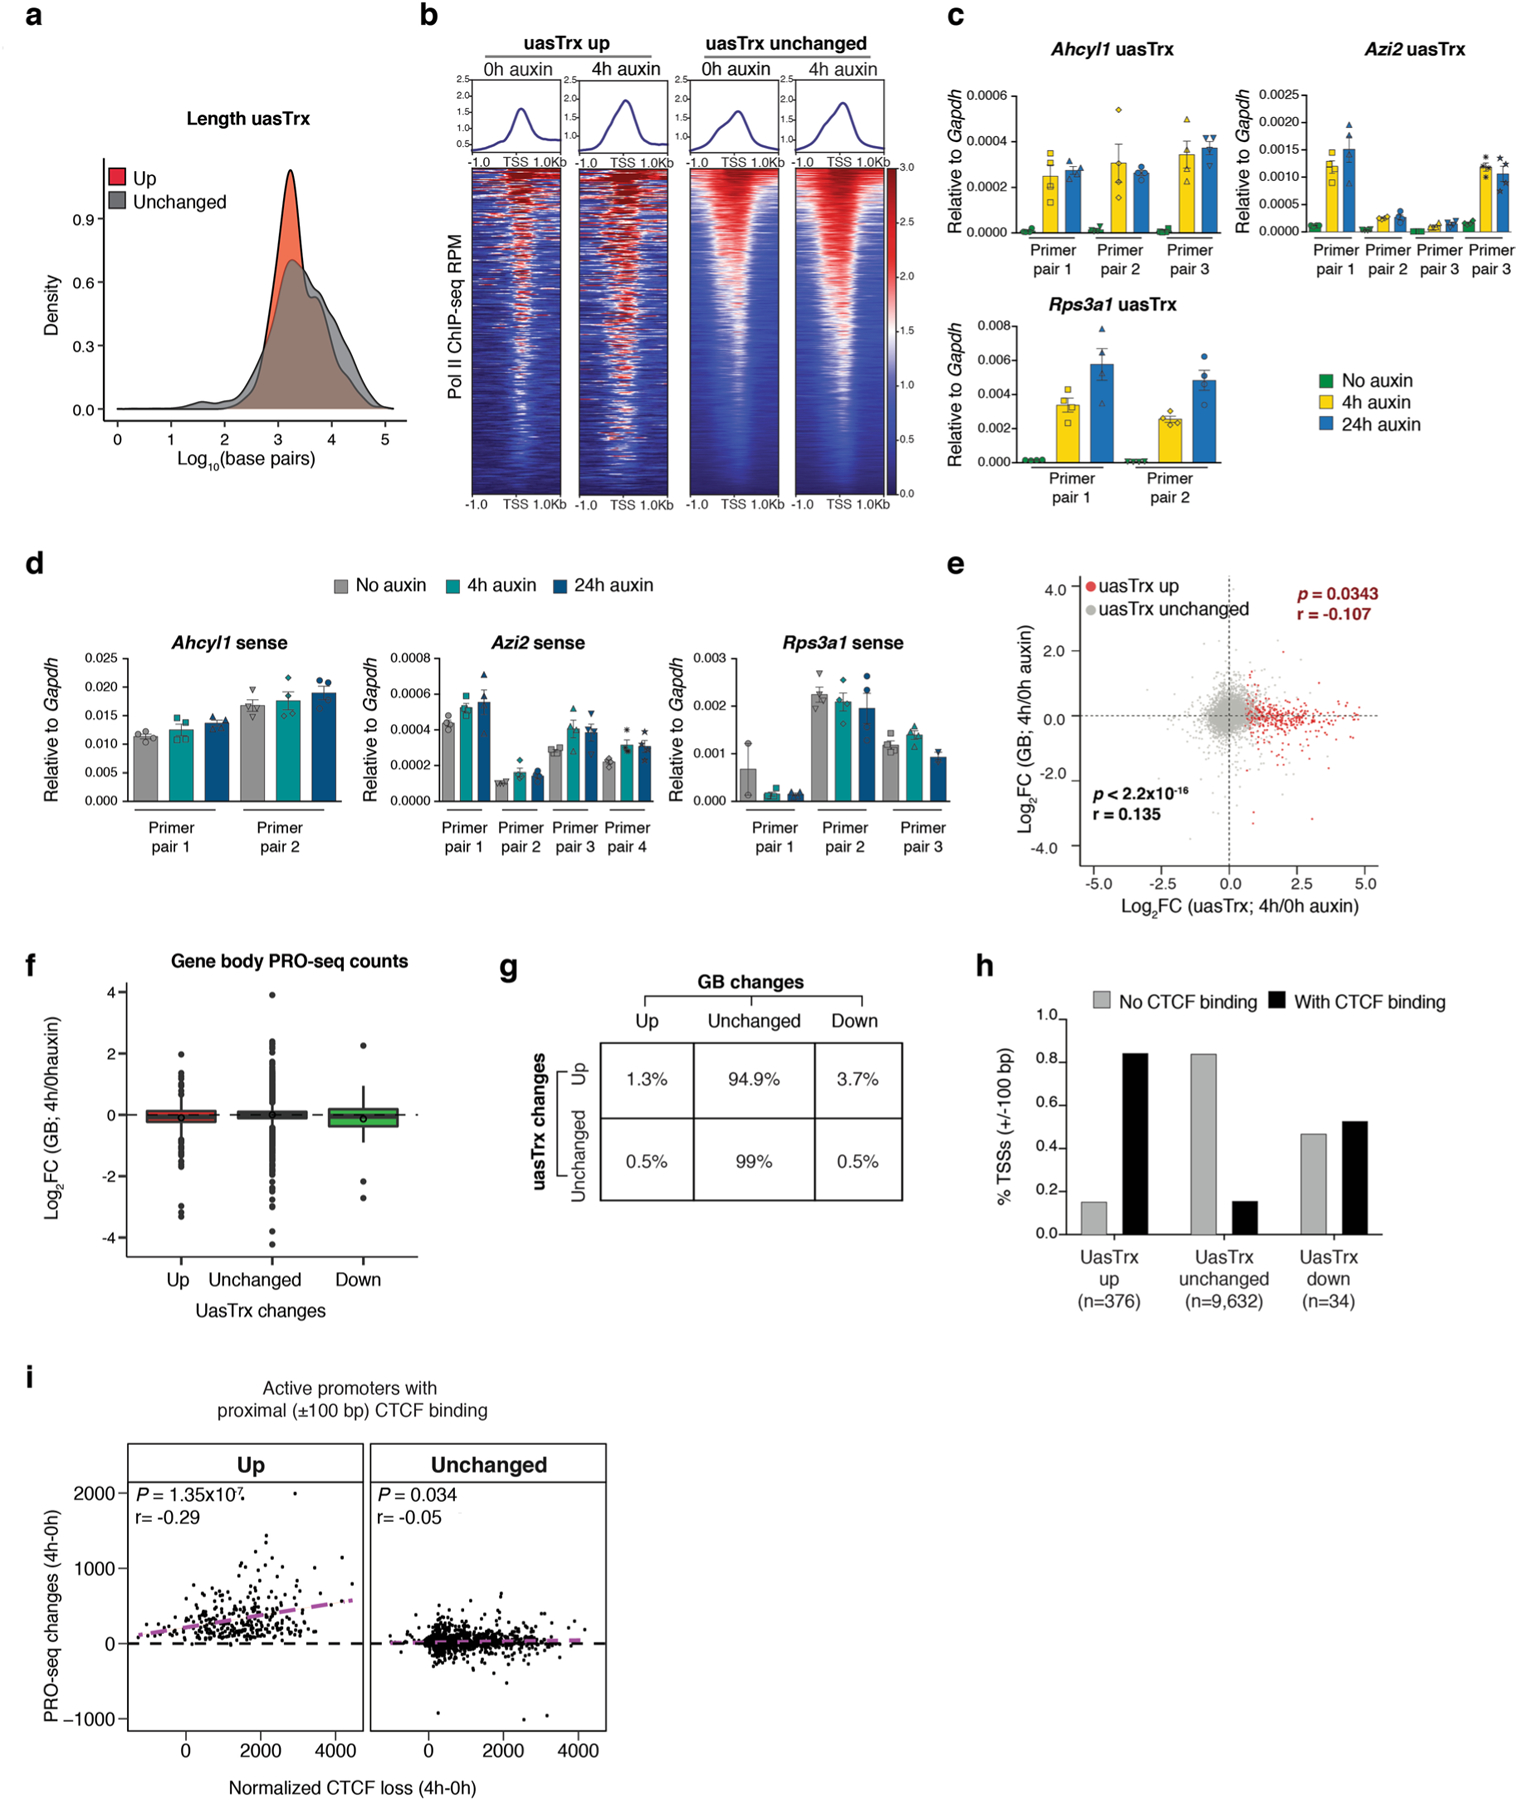
a, Distribution of uasTrx lengths, grouped by changes in response to CTCF depletion. b, Row-linked heatmaps showing Pol II occupancy at active promoters, grouped by antisense changes (up, n = 376; unchanged, n = 9,632) upon CTCF depletion, sorted by occupancy level, and shown with respect to sense orientation. c, RT–qPCR of uasTrx for Ahcyl1 at indicated time points after CTCF depletion. Transcripts were normalized to Gapdh (error bar: SEM; n = 4). d, same as (c) but quantifying nascent sense transcripts. e, Scatterplot comparing transcriptional changes in gene body (GB) versus uasTrx. Data points grouped and colored based on uasTrx changes. P values were calculated by Spearman rank correlation test, r is the correlation coefficient. f, Log-transformed PRO-seq fold changes in GB after CTCF depletion, grouped by uasTrx changes. Lower and upper box ends represent the first and third quartiles with the median indicated as a horizontal line within the box. Mean is indicated by a circle within the box. Whiskers define the smallest and largest values within 1.5 times the interquartile range below the first or above the third quartile, respectively. Outliers are plotted as individual dots. g, Transcriptional changes in uasTrx and GB after CTCF depletion. h, Percentage of promoters with and without proximal (±100 bp) CBSs as a function of uasTrx changes. i, Correlation between PRO-seq changes and CTCF loss at uasTrx with proximal (±100 bp) CTCF binding. Linear regression line shown in magenta. P values were calculated by Spearman rank correlation test, r is the correlation coefficient.
Extended Data Fig. 2 |. CTCF depletion in human HCT-116 and mESCs leads to antisense transcriptional changes.
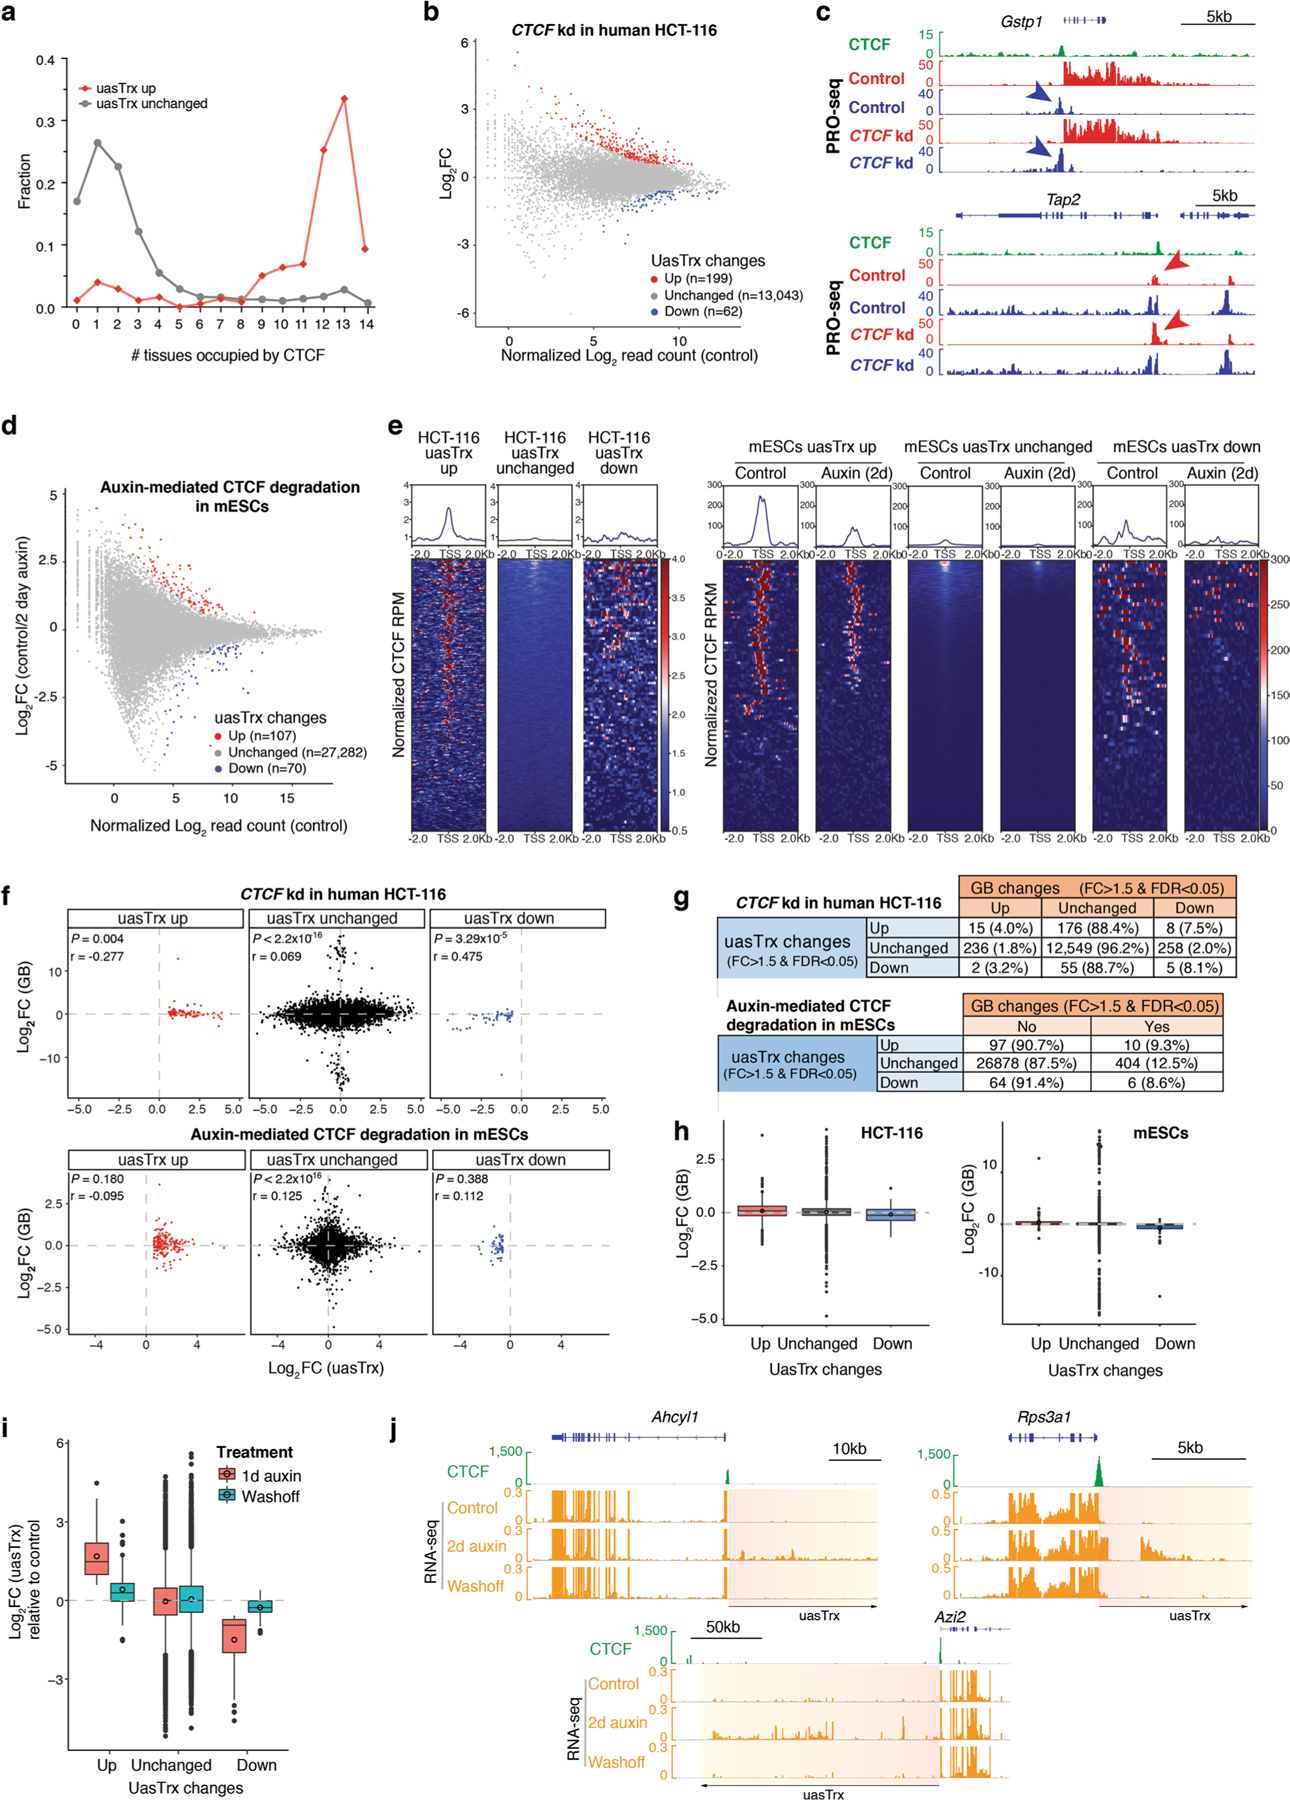
a, Fraction of TSSs detected in the indicated numbers of mouse tissues where CTCF binds in proximity (within ± 100 bp), grouped by uasTrx changes. b, PRO-seq MA plot of control versus CTCF-depleted cells on the antisense strand (−1000 bp to +200 relative to annotated TSS) in human HCT-116 cells. Differentially expressed transcripts highlighted in color. c, Browser views of CTCF ChIP-seq (mm9 liftover from Rao et al., 2014) and PRO-seq signals at Gstp1 and Tap2 loci in HCT-116 cells. Arrows highlight location of CTCF-repressed uasTrx. Arrow color indicates uasTrx strandedness. kd, knockdown. d, RNA-seq MA plot of control versus CTCF-depleted cells on the antisense strand (−1000 bp to +200 relative to annotated TSS) in mESCs. Differentially expressed transcripts highlighted in color. e, Row-linked heatmaps showing CTCF occupancy at active promoters, grouped by uasTrx changes, sorted by binding enrichment levels, and shown with respect to sense orientation in HCT-116 cells and mESCs. f, Correlation between uasTrx and GB changes after CTCF depletion in PRO-seq data from HCT-116 cells, and RNA-seq data from mESCs. P value was calculated by Spearman rank correlation test; r is the correlation coefficient. g, Transcriptional changes in uasTrx and GB after CTCF depletion in PRO-seq from HCT-116 cells and RNA-seq data from mESCs. h, Log-transformed PRO-seq and RNA-seq fold changes in GB after CTCF depletion in HCT-116 cells and mESCs, respectively. Lower and upper box ends represent the first and third quartiles with the median indicated as a horizontal line within the box. Mean is indicated by a circle within the box. Whiskers define the smallest and largest values within 1.5 times the interquartile range below the first or above the third quartile, respectively. Outliers are plotted as individual dots. i, Log-transformed RNA-seq fold change in uasTrx in indicated conditions over control in mESCs. j, Brower views of CTCF ChIP-seq and RNA-seq signals at Ahcyl1, Azi2 and Rps3a1 loci in mESCs. Orange to yellow boxes and black arrow indicate (direction of) uasTrx.
Extended Data Fig. 3 |. Affected promoters are associated with architectural features.
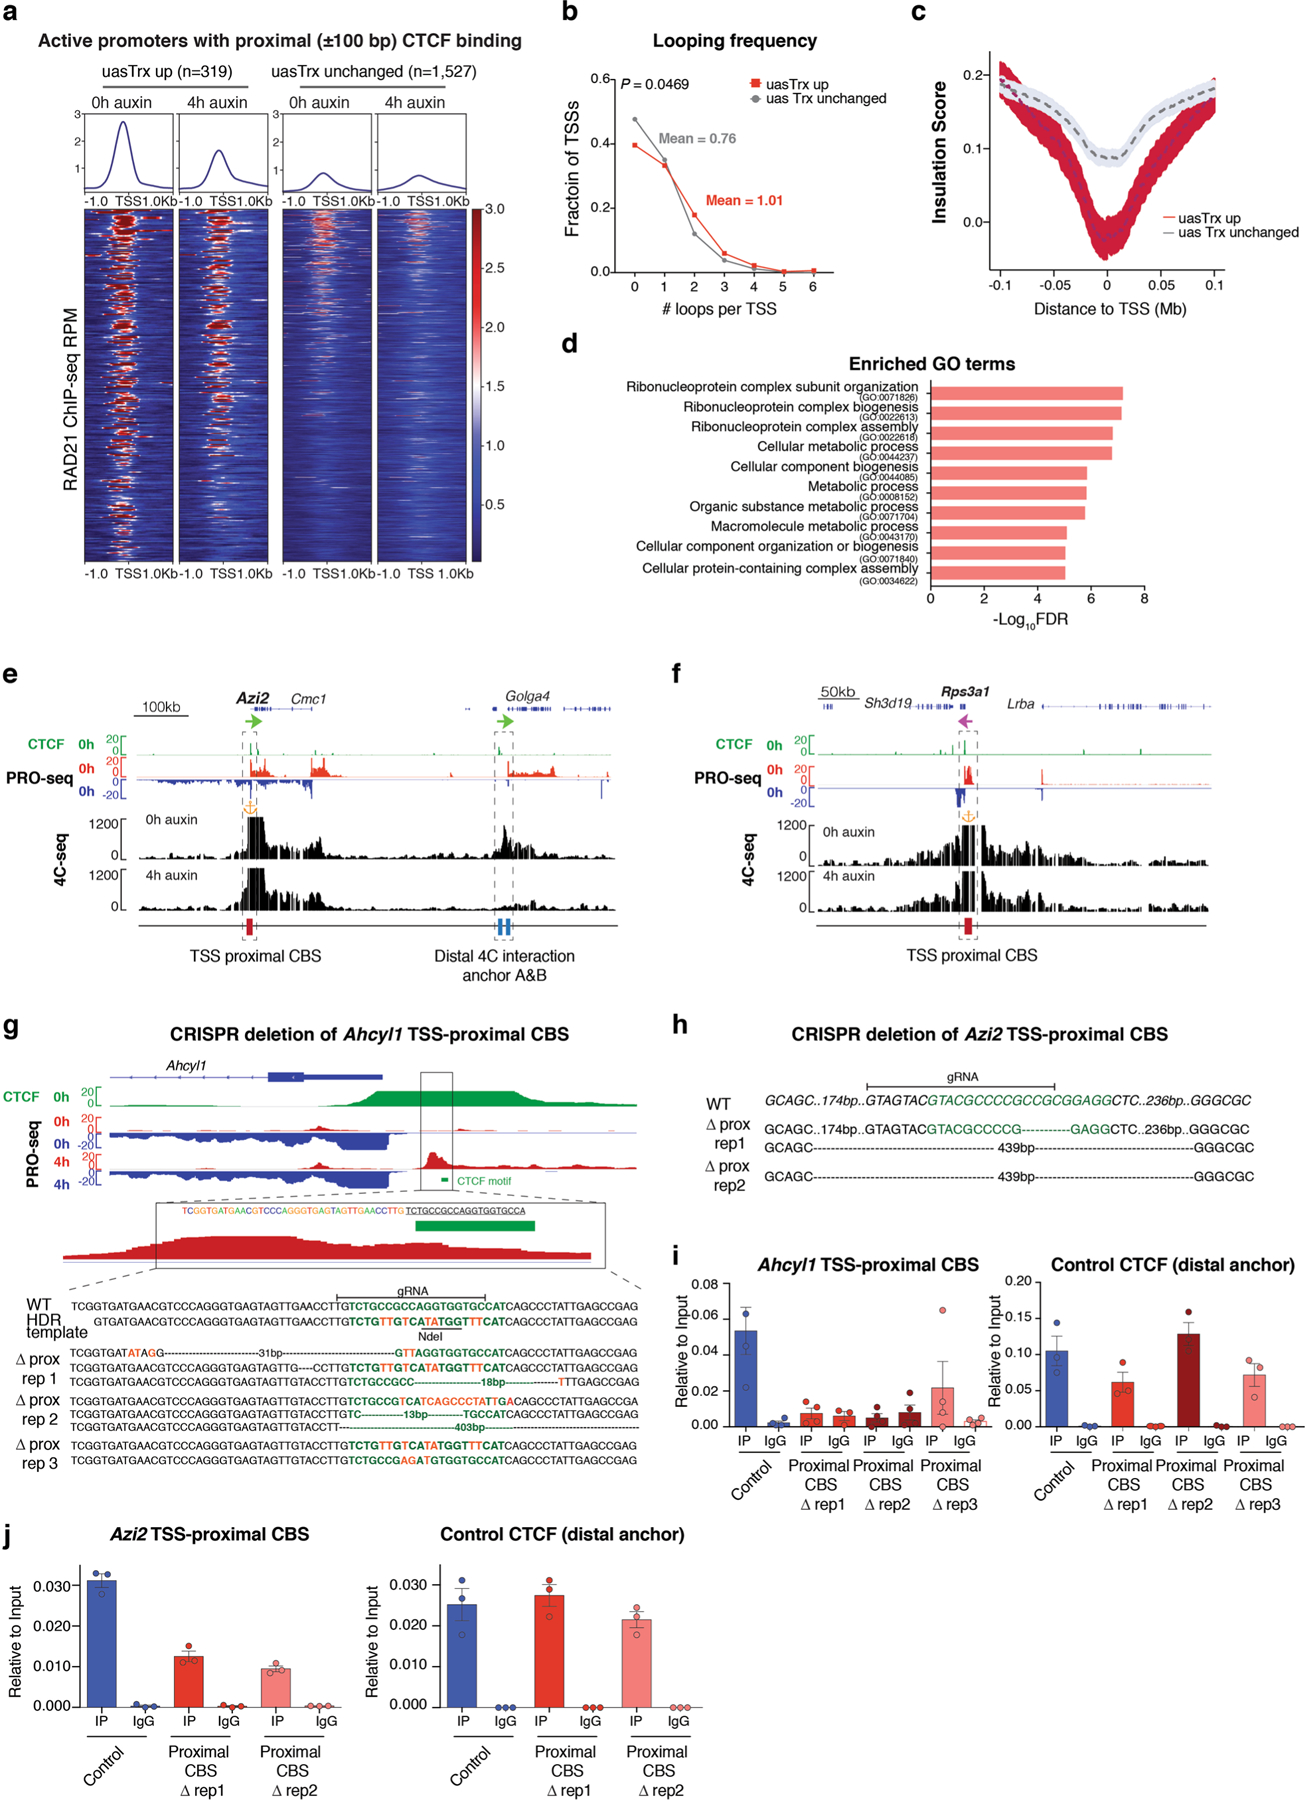
a, Row-linked heatmaps showing RAD21 occupancy at sites with proximal (±100 bp) CTCF binding (up, n = 319; unchanged, n = 1,527), grouped by CTCF depletion-elicited uasTrx changes, sorted in the same order as Fig. 1i, and shown with respect to sense orientation. b, Distribution of looping frequencies of upregulated versus unchanged uasTrx with proximal (±100 bp) CTCF binding. P value calculated by Wilcoxon signed-rank test. c, Averaged insulation score centered at annotated TSS with proximal CTCF binding (up n = 319, unchanged n = 1,527) over 0.2 Mb window, plotted with respect to sense orientation, and grouped by uasTrx changes. d, Gene ontology terms enriched at genes with activated uasTrx. e, Genome browser views of CTCF ChIP-seq, PRO-seq and 4C-seq signals at Azi2. 4C-seq anchored at Azi2 promoter with (4 h auxin) and without (0 h auxin) CTCF degradation. Orange anchor indicates 4C-seq viewpoint. Sites of interest are indicated below the track and highlighted by dashed boxes. f, Same as in (e) for the Rps3a1 locus. g, Genome browser views of bulk CTCF ChIP-seq and PRO-seq at the Ahcyl1 locus. Predicted CTCF motif is highlighted in green and genotype of edited Ahcyl1 clones shown in Fig. 2c is depicted. h, Genotype of Azi2 TSS-proximally edited clones. Predicted CTCF motif highlighted in green. i, Left, CTCF ChIP-qPCR showing abrogation of CTCF binding at Ahcyl1 TSS-proximal CBS in mutants shown in Fig. 2c. Right, Ahcyl1 distal CBS served as a control for ChIP efficiency (error bar: SEM; n = 3). j, Same as in (i) for Azi2 TSS-proximal CBS.
Extended Data Fig. 4 |. CRISPR/Cas9-mediated deletion of TSS-proximal CBS leads to uasTrx activation.
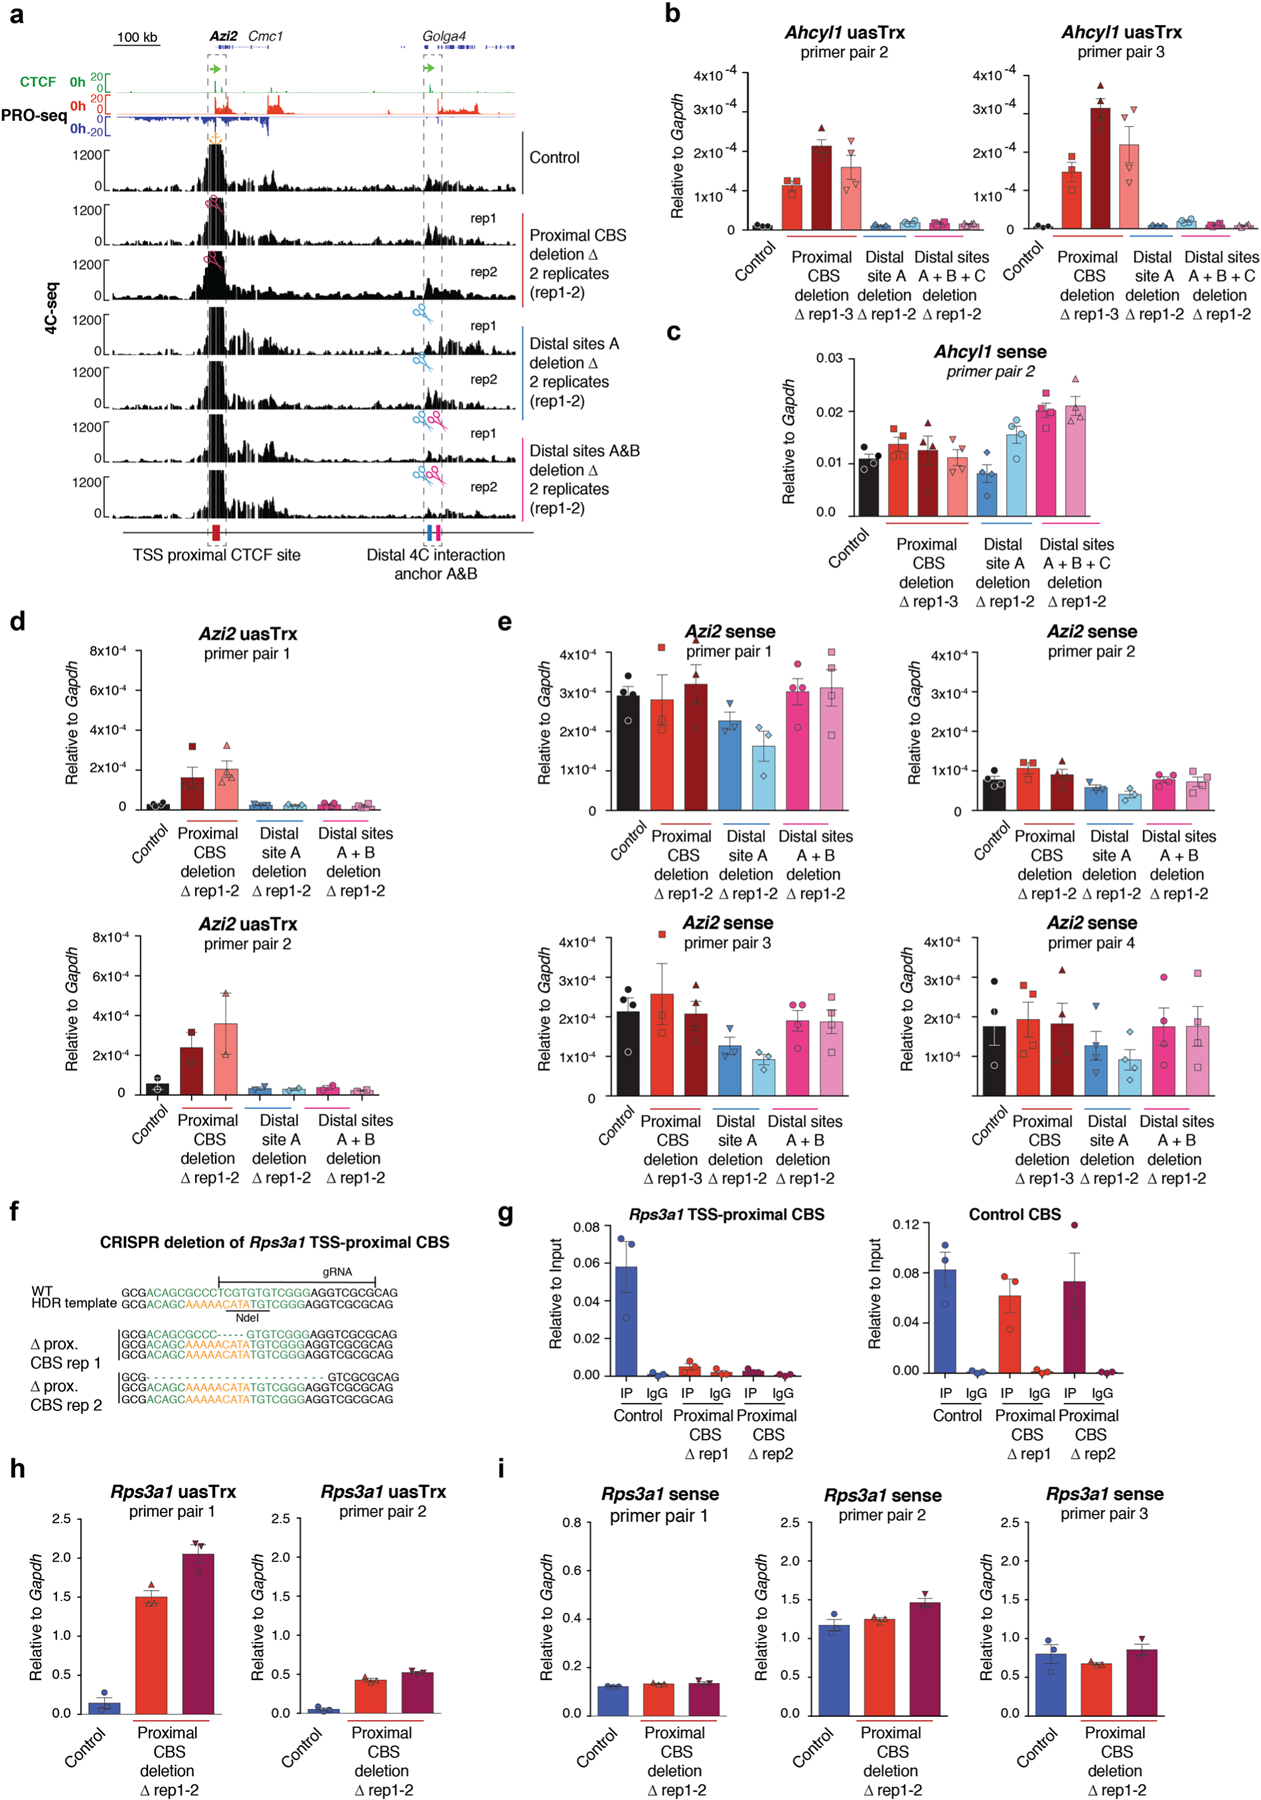
a, Genome browser tracks of CTCF ChIP-seq and PRO-seq shown at the Azi2 locus on top. Representative 4C-seq profiles of control/mutant Azi2 clones. Regions of interest are indicated below tracks and highlighted by dashed boxes. Similar observations were made in 2 independent 4C-seq experiments. Orange anchor indicates 4C-seq viewpoint. Scissors indicate CRISPR/Cas9-edited region. b, RT–qPCR of Ahcyl1 uasTrx in control and edited clones. Transcripts were normalized to Gapdh (error bar: SEM; n = 4, except for uasTrx control, proximal and distal CBS deletion rep1 for which n = 3). c, same as in (b) for sense Ahcyl1 transcripts. d, RT–qPCR of Azi2 uasTrx in control and edited clones. Transcripts were normalized to Gapdh (error bar: SEM; n = 4 for primer pair 1, n = 2 for primer pair 2). e, same as in (d) for sense Azi2 transcripts. f, Genotype of Rps3a1 TSS-proximal CBS edited clones. Predicted CTCF motif highlighted in green. g, Left, CTCF ChIP-qPCR showing abrogation of CTCF binding at Rps3a1 TSS-proximal CBS in mutants. Right, distal CBS served as a control for ChIP efficiency (error bar: SEM; n = 3). h, RT–qPCR of Rps3a1 uasTrx in control and edited clones. Transcripts were normalized to Gapdh (error bar: SEM; n = 3). i, same as in (h) for sense Rps3a1 transcripts.
Extended Data Fig. 5 |. CRISPR/Cas9-mediated deletion of distal CBS does not lead to uasTrx activation.
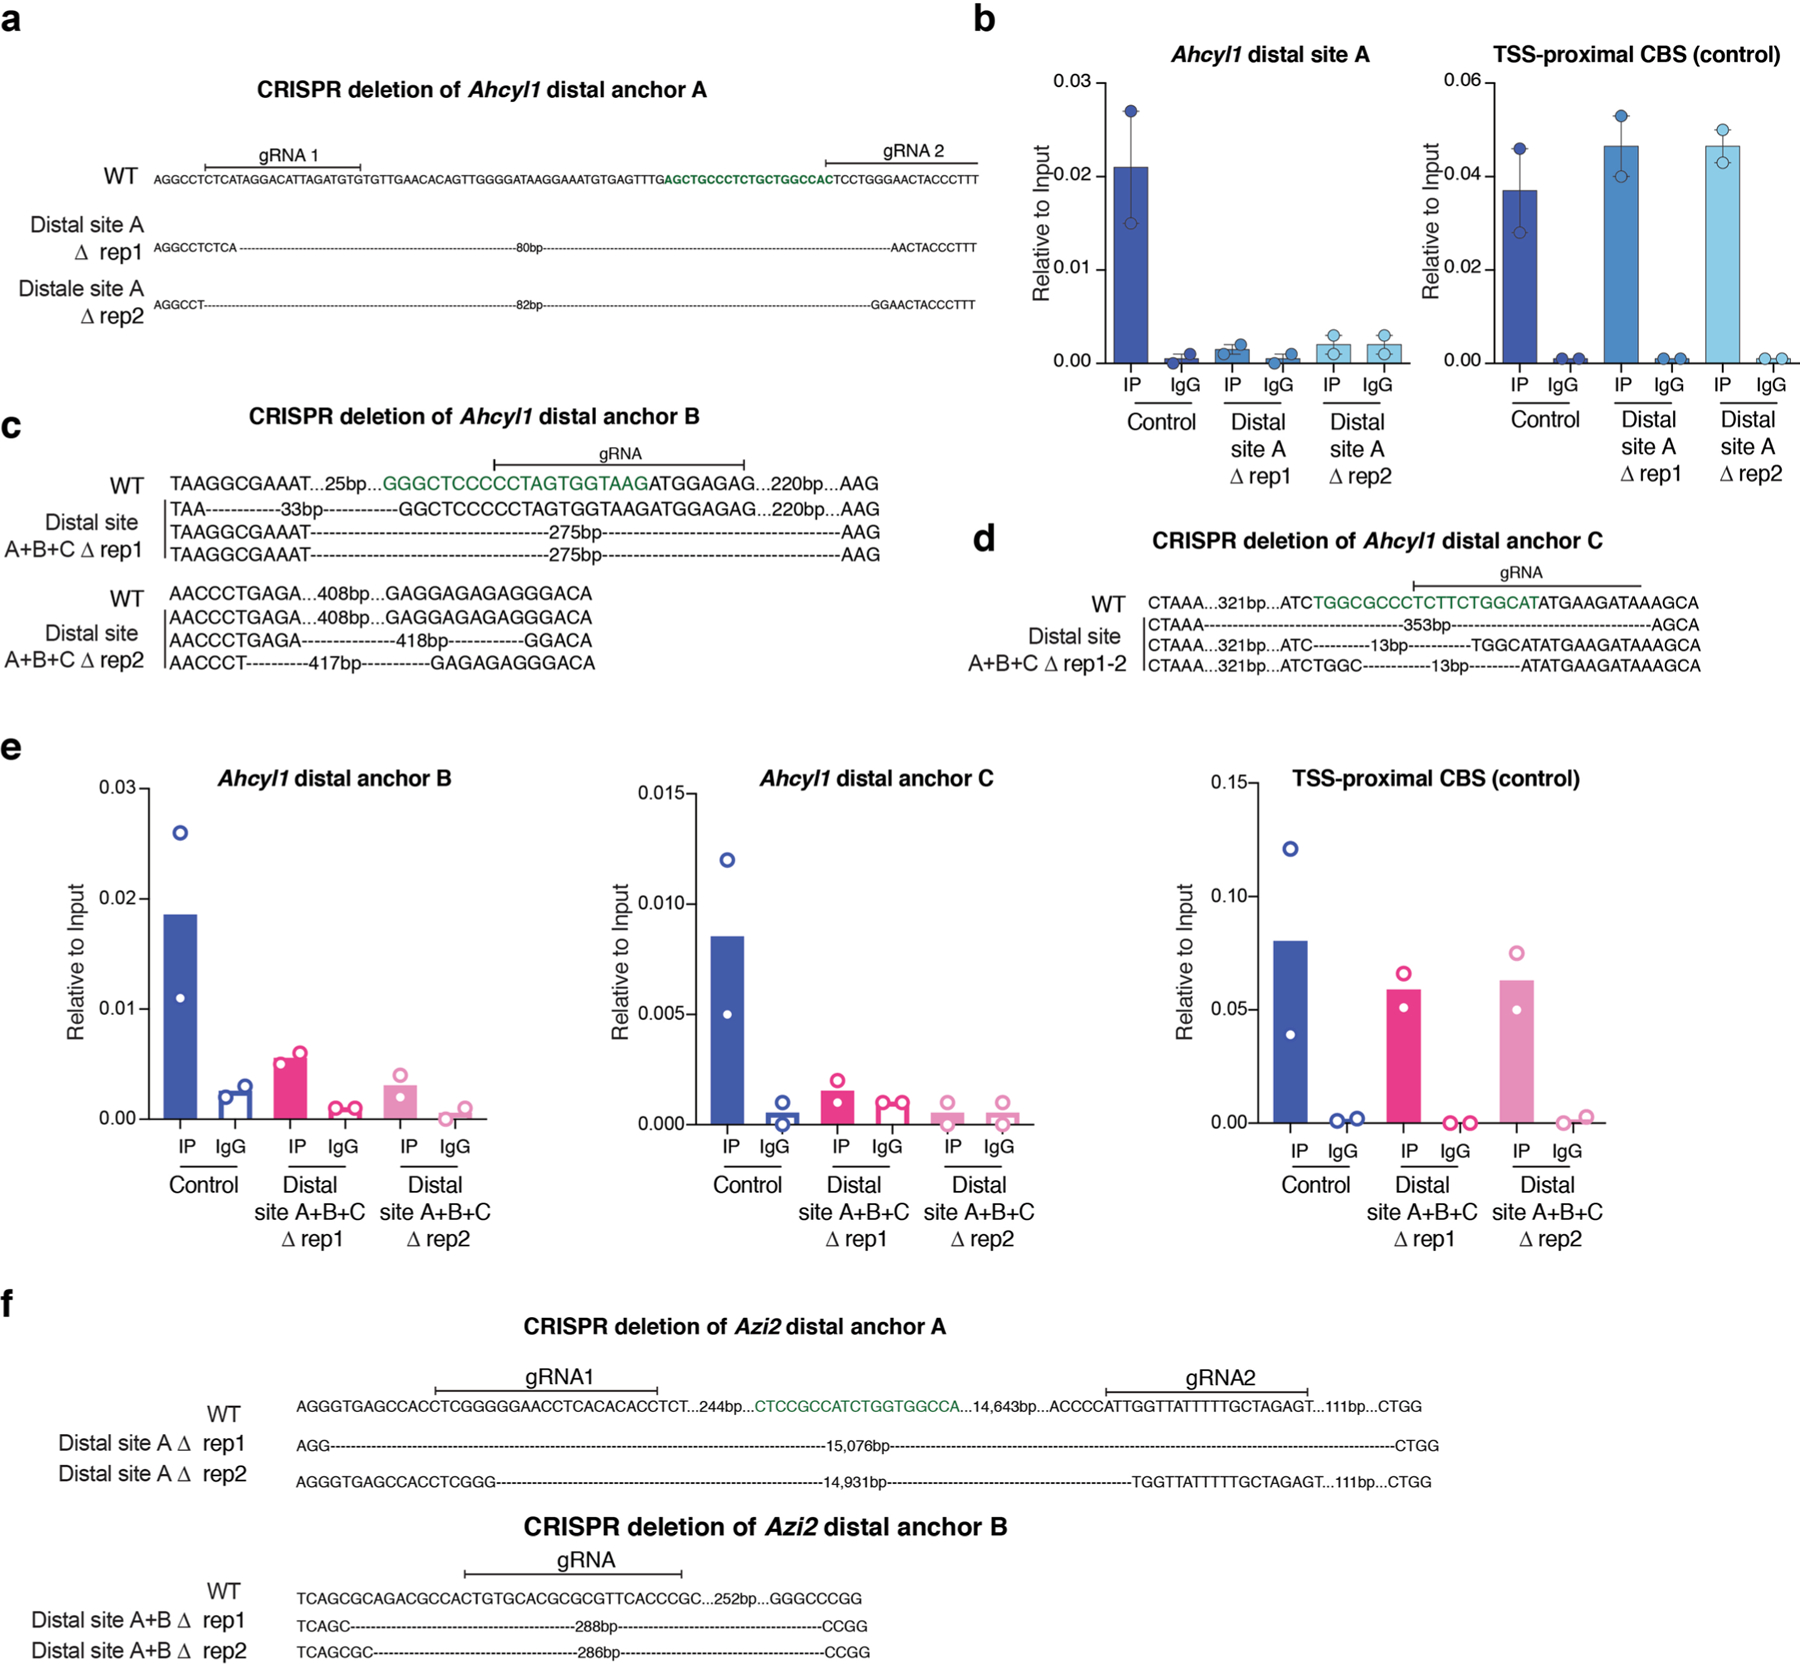
a, Genotype of distal site A edited Ahcyl1 clones shown in Fig. 2c. Predicted CTCF motif is highlighted in green. b, Left, CTCF ChIP-qPCR showing abrogation of CTCF binding at distal anchor A in clones distal site A rep1 and 2 shown in Fig. 2c (error bar: SEM; n = 2). Right, proximal CBS served as a control for ChIP efficiency (error bar: SEM; n = 2). c, Same as in (a) for Ahcyl1 distal site B. d, same as in (a) for Ahcyl1 distal site C. e, same as in (b) for Ahcyl1 distal site B and C. f, Genotype of distal site A and B edited Azi2 clones.
Extended Data Fig. 6 |. Removal of chromatin-bound cohesin does not recapitulate CTCF-induced uasTrx changes.
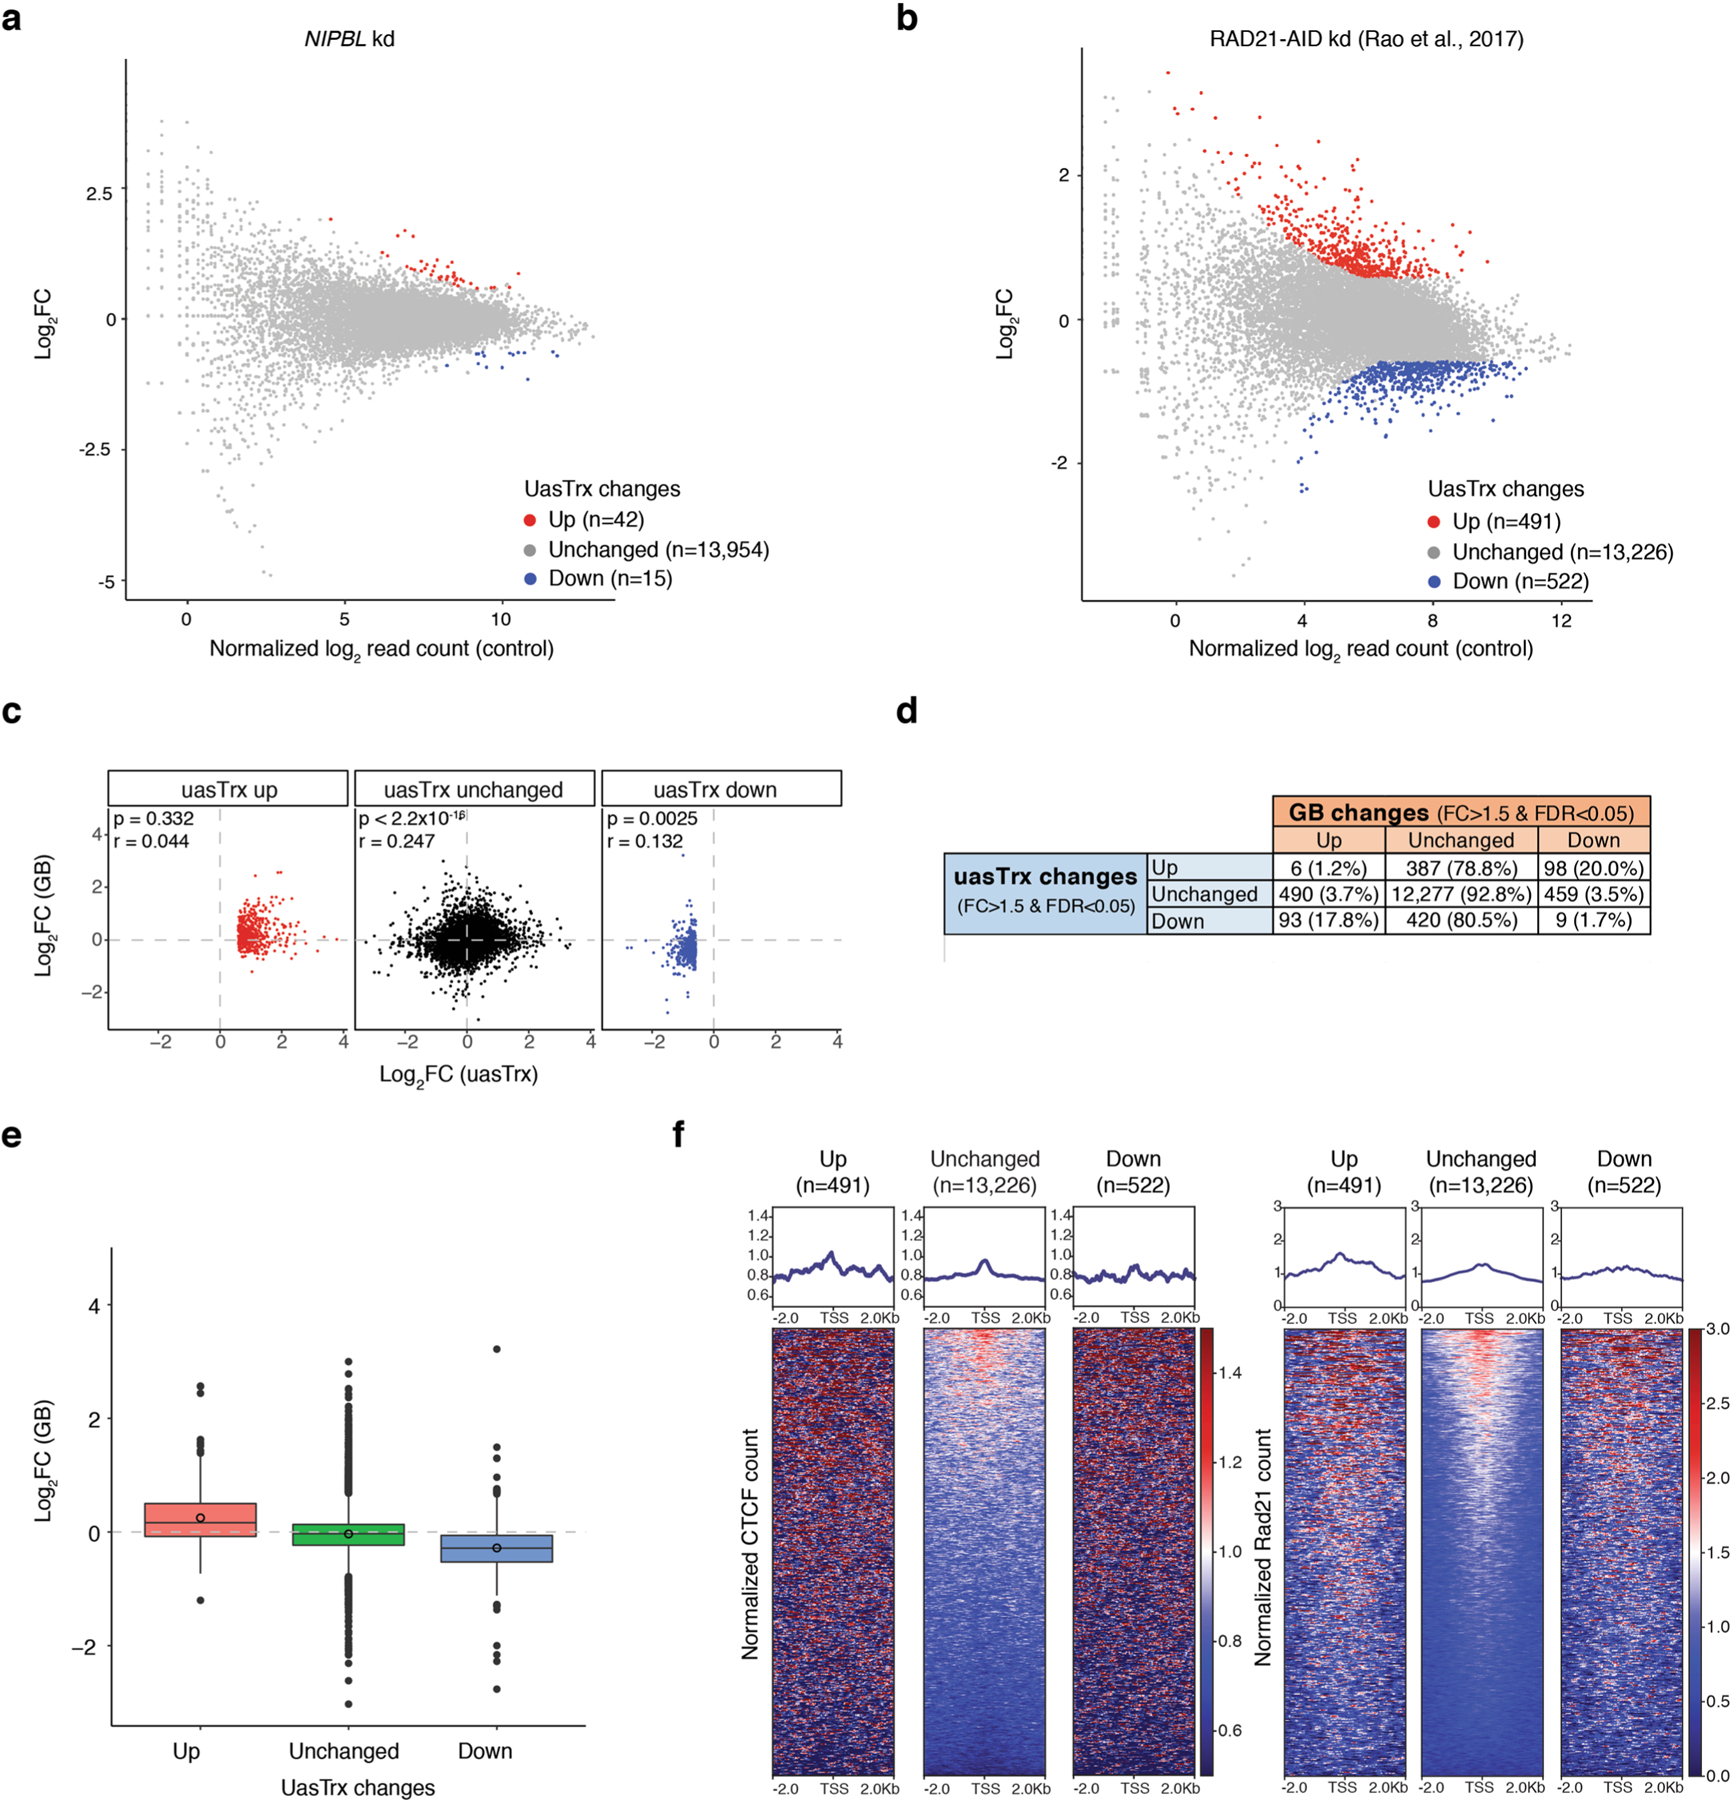
a, PRO-seq MA plot of control versus NIPBL-depleted HCT-116 cells on uasTrx expression (−1000 bp to +200 relative to annotated TSS). Differentially expressed transcripts highlighted in color. b, Same as (a) but of RAD21-depleted HCT-116 cells. c, Scatterplot comparing log-transformed 5’ PRO-seq fold changes in uasTrx and GB. P value was calculated by Spearman rank correlation test; r is the correlation coefficient. d, Table showing the number and percentage of uasTrx and GB changes after RAD21 depletion in HCT-116 cells. e, Box plot showing log-transformed PRO-seq fold changes in GBs after RAD21 depletion in HCT-116 cells. Lower and upper box ends represent the first and third quartiles with the median indicated as a horizontal line within the box. Mean is indicated by a circle within the box. Whiskers define the smallest and largest values within 1.5 times the interquartile range below the first or above the third quartile, respectively. Outliers are plotted as individual dots. f, Left, row-linked heatmap showing CTCF occupancy at active promoters, grouped by uasTrx changes after RAD21 depletion, sorted by occupancy levels, and shown with respect to sense orientation. Right, same as left, but plotting RAD21 occupancy. Note that neither CTCF nor RAD21 is enriched at genes with upregulated uasTrx.
Extended Data Fig. 7 |. CTCF inhibits antisense burst fraction; sense/antisense co-bursting is disfavored.
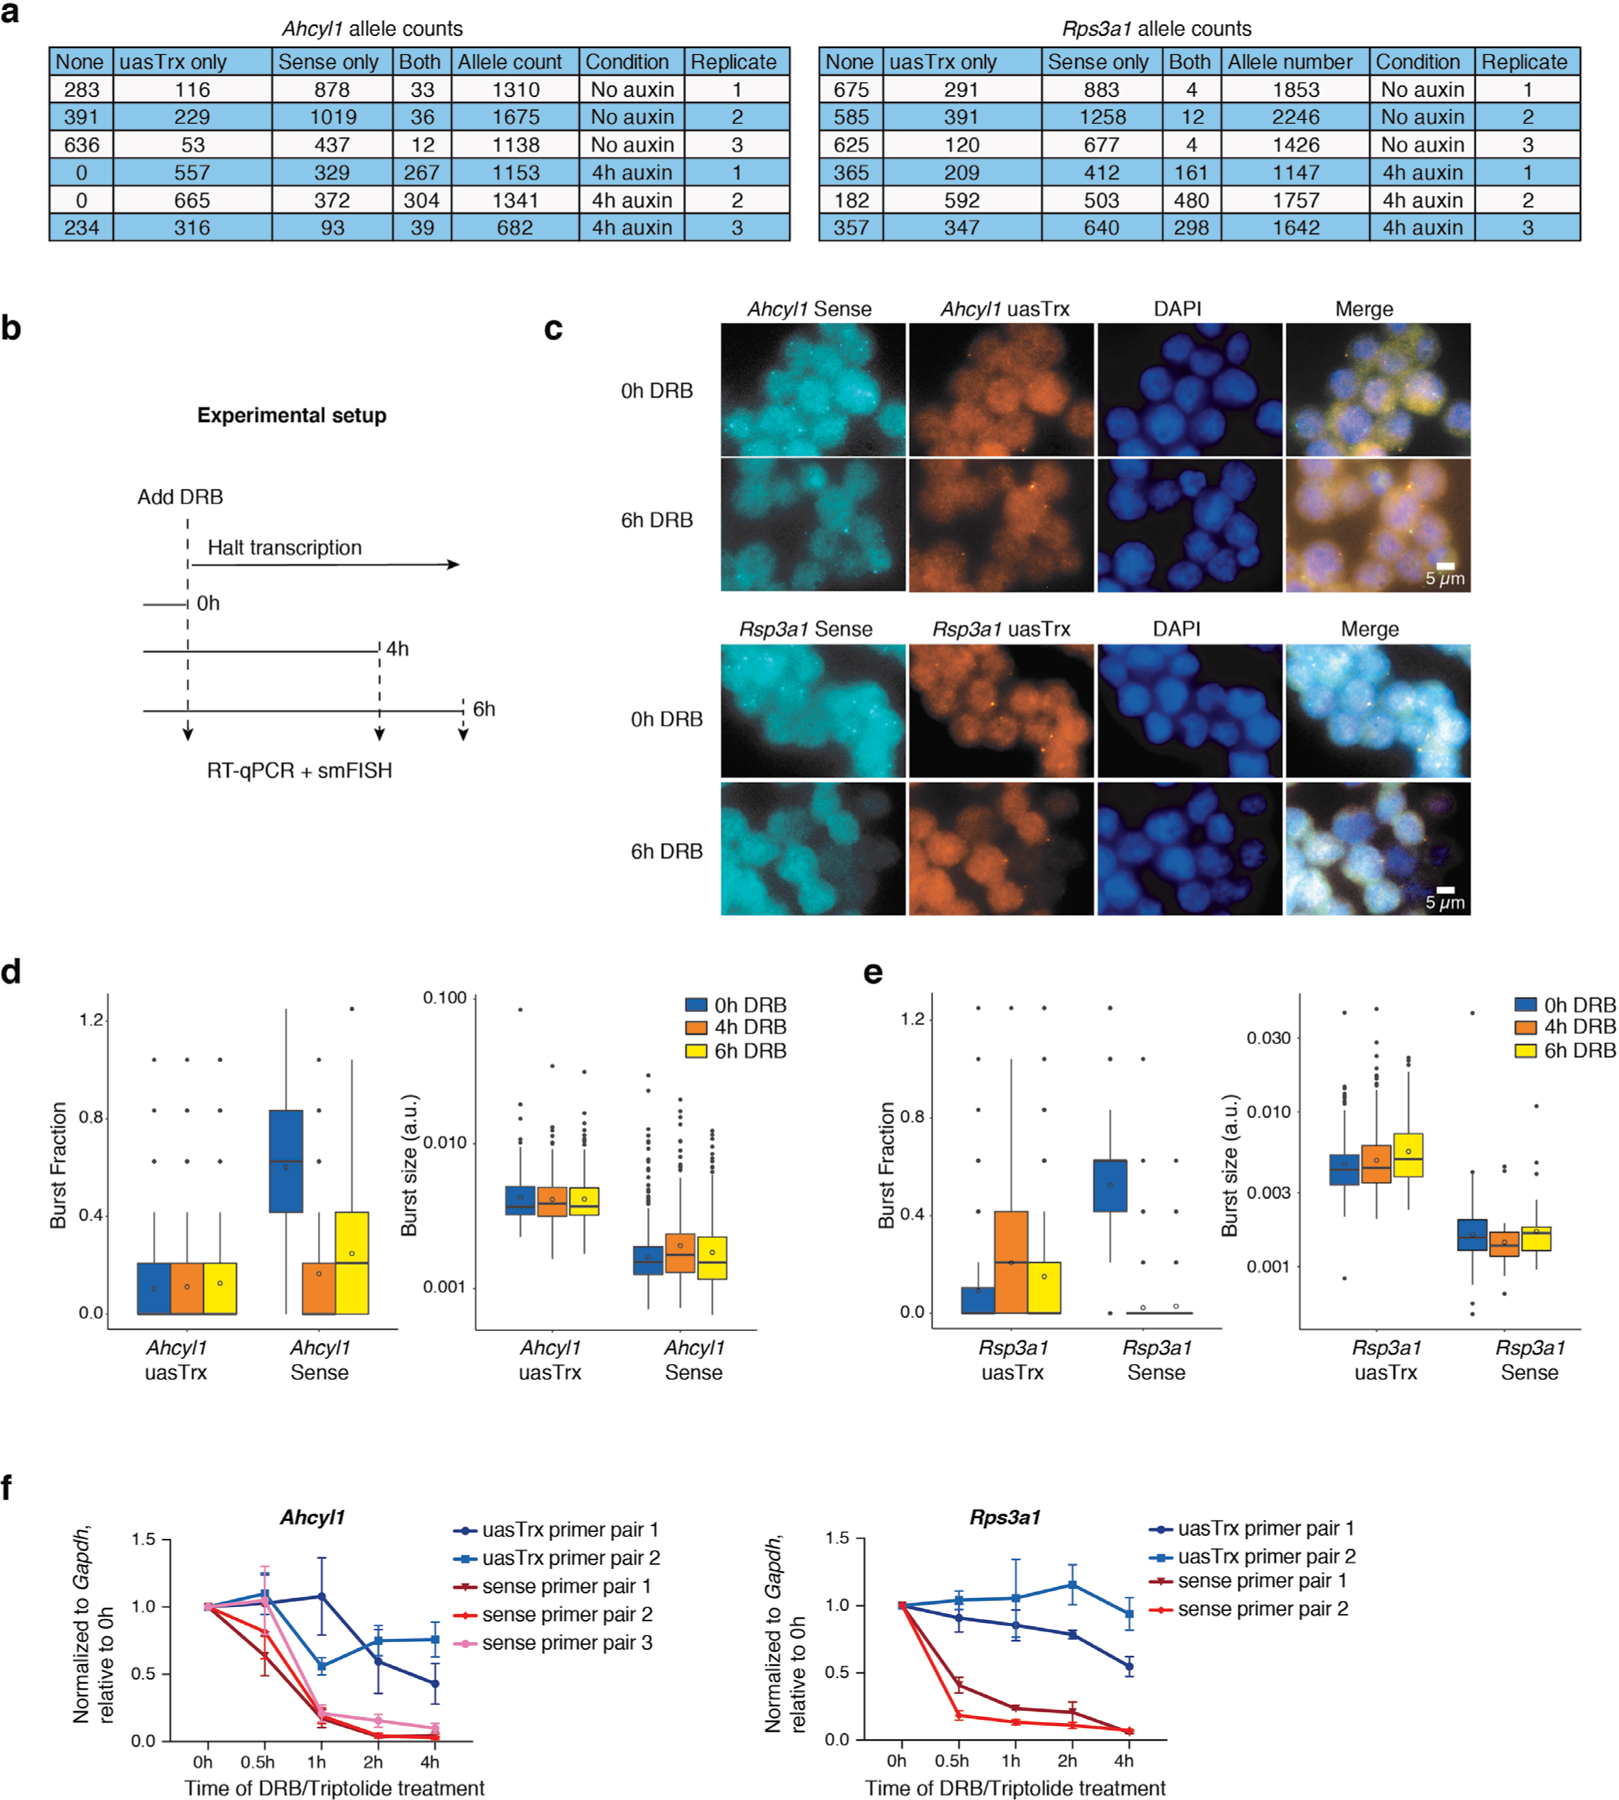
a, Table showing raw smFISH allele counts. b, Experimental outline for RNA half-life estimation. c, Representative smFISH images of 3 independent replicates before and after DRB treatment at Ahcyl1 and Rps3a1. d, Left, box plot showing uasTrx and sense burst fractions at Ahcyl1 before and after DRB treatment. Right, same as left but quantifying burst sizes. Lower and upper box ends represent the first and third quartiles with the median indicated as a horizontal line within the box. Mean is indicated by a circle within the box. Whiskers define the smallest and largest values within 1.5 times the interquartile range below the first or above the third quartile, respectively. Outliers are plotted as individual dots. P values were calculated by two-sample t-test. e, Same as (d) but for Rps3a1. f, RT–qPCR measuring nascent sense and uasTrx levels at Ahcyl1 and Rps3a1 before and after DRB treatment. Transcripts were normalized to Gapdh and plotted relative to time 0 h (error bar: SEM; n = 4).
Extended Data Fig. 8 |. CTCF inhibits antisense transcription initiation through precise positioning.
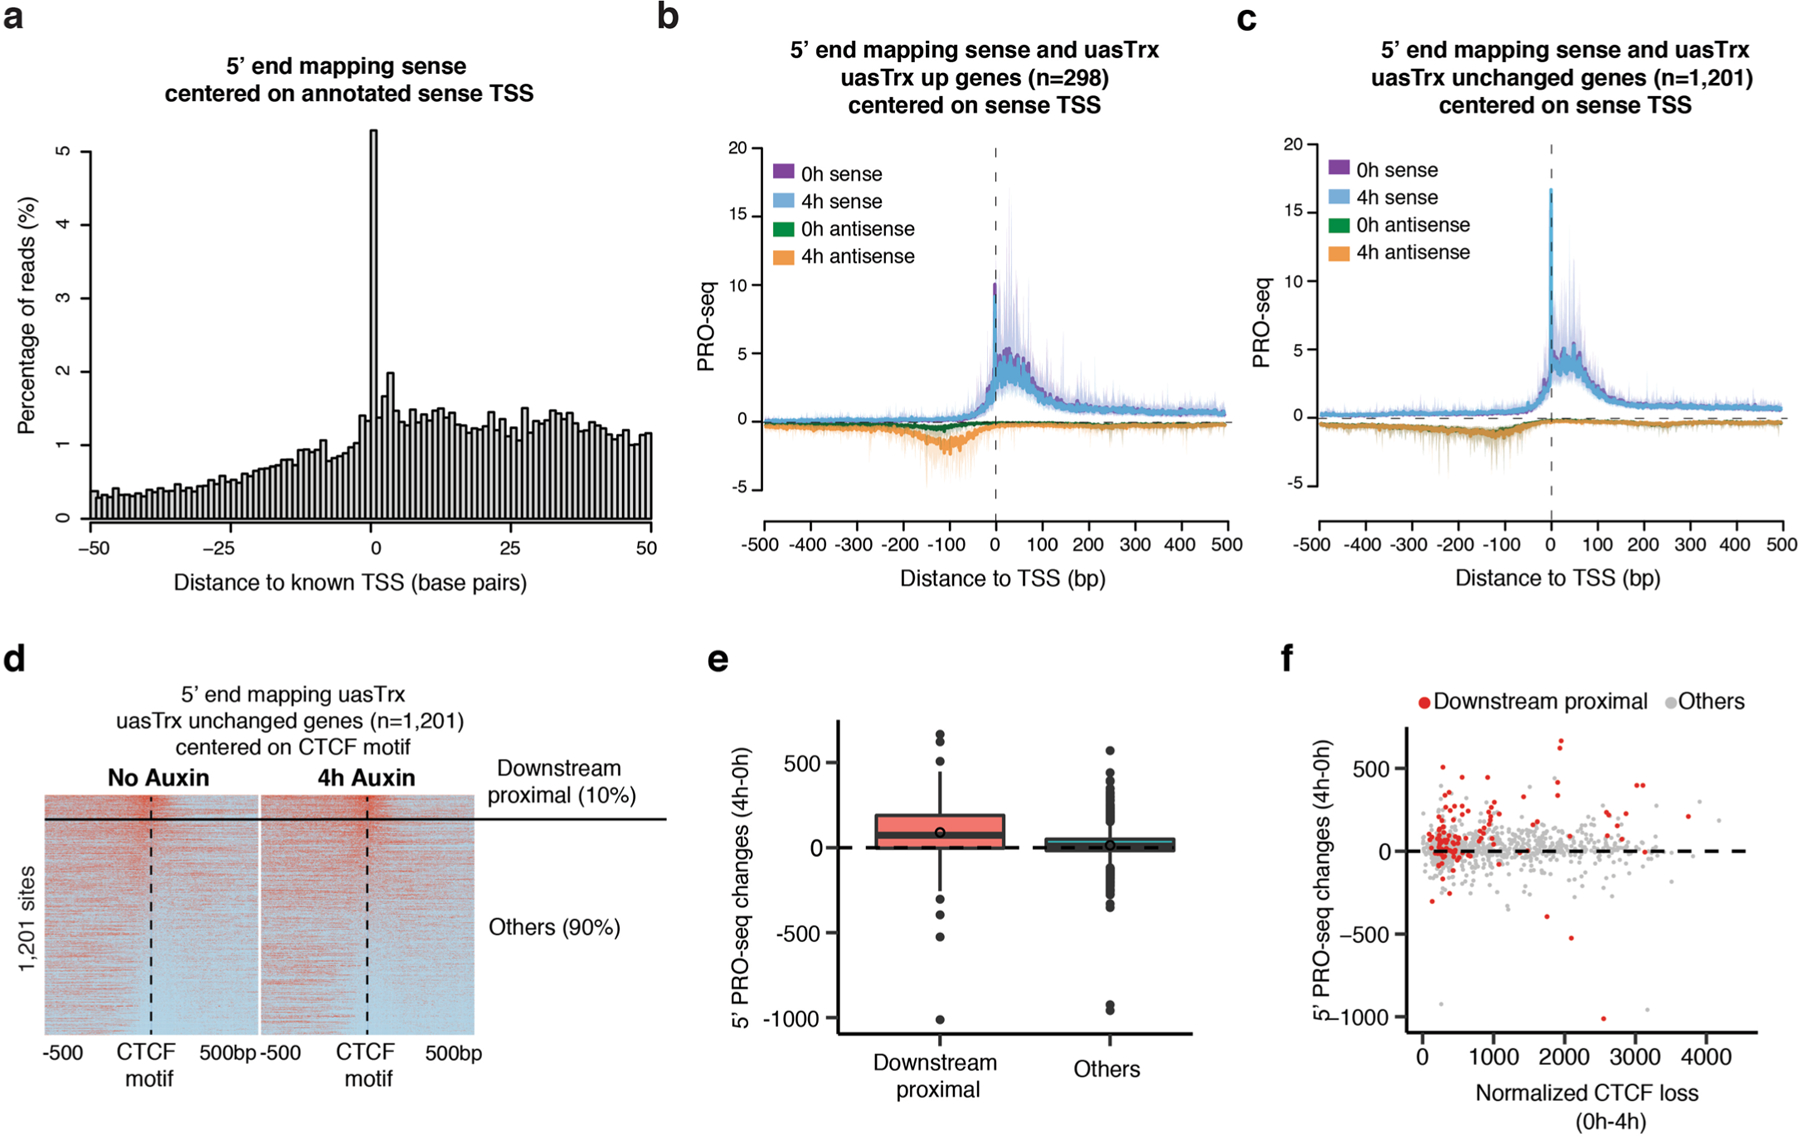
a, 5’ end mapping in a 100 bp window of sense reads on a training set of 1,395 TSSs with the highest PRO-seq reads mapped to ±50 bp around the TSS and no other start sites within 1000 base pairs. b, Metaplot of sense and antisense 5’ end PRO-seq mapping, centered at annotated sense TSSs and plotted with respect to sense orientation for genes with upregulated uasTrx. Solid lines and shades show average signals and the 12.5/87.5 percentiles, respectively. c, Same as in (b) for unchanged uasTrx genes. d, heatmap of 5’ end mapping at unchanged promoters with a portion of sites (10%; ‘downstream proximal’) manually picked from the rest (‘others’), which demonstrates a CTCF distribution similar to that at uasTrx up genes. e, Related to (d), plotting PRO-seq changes in uasTrx at unaffected promoters, grouped based on CTCF positioning relative to 5’ PRO-seq signals. Lower and upper box ends represent the first and third quartiles with the median indicated as a horizontal line within the box. Whiskers define the smallest and largest values within 1.5 times the interquartile range below the first or above the third quartile, respectively. Outliers are plotted as individual dots. f, Related to (d), comparing uasTrx changes and CTCF binding loss at unaffected promoters, grouped based on CTCF positioning relative to 5’ PRO-seq signals.
Extended Data Fig. 9 |. Sense transcription initiation mostly unaffected upon uasTrx increase.
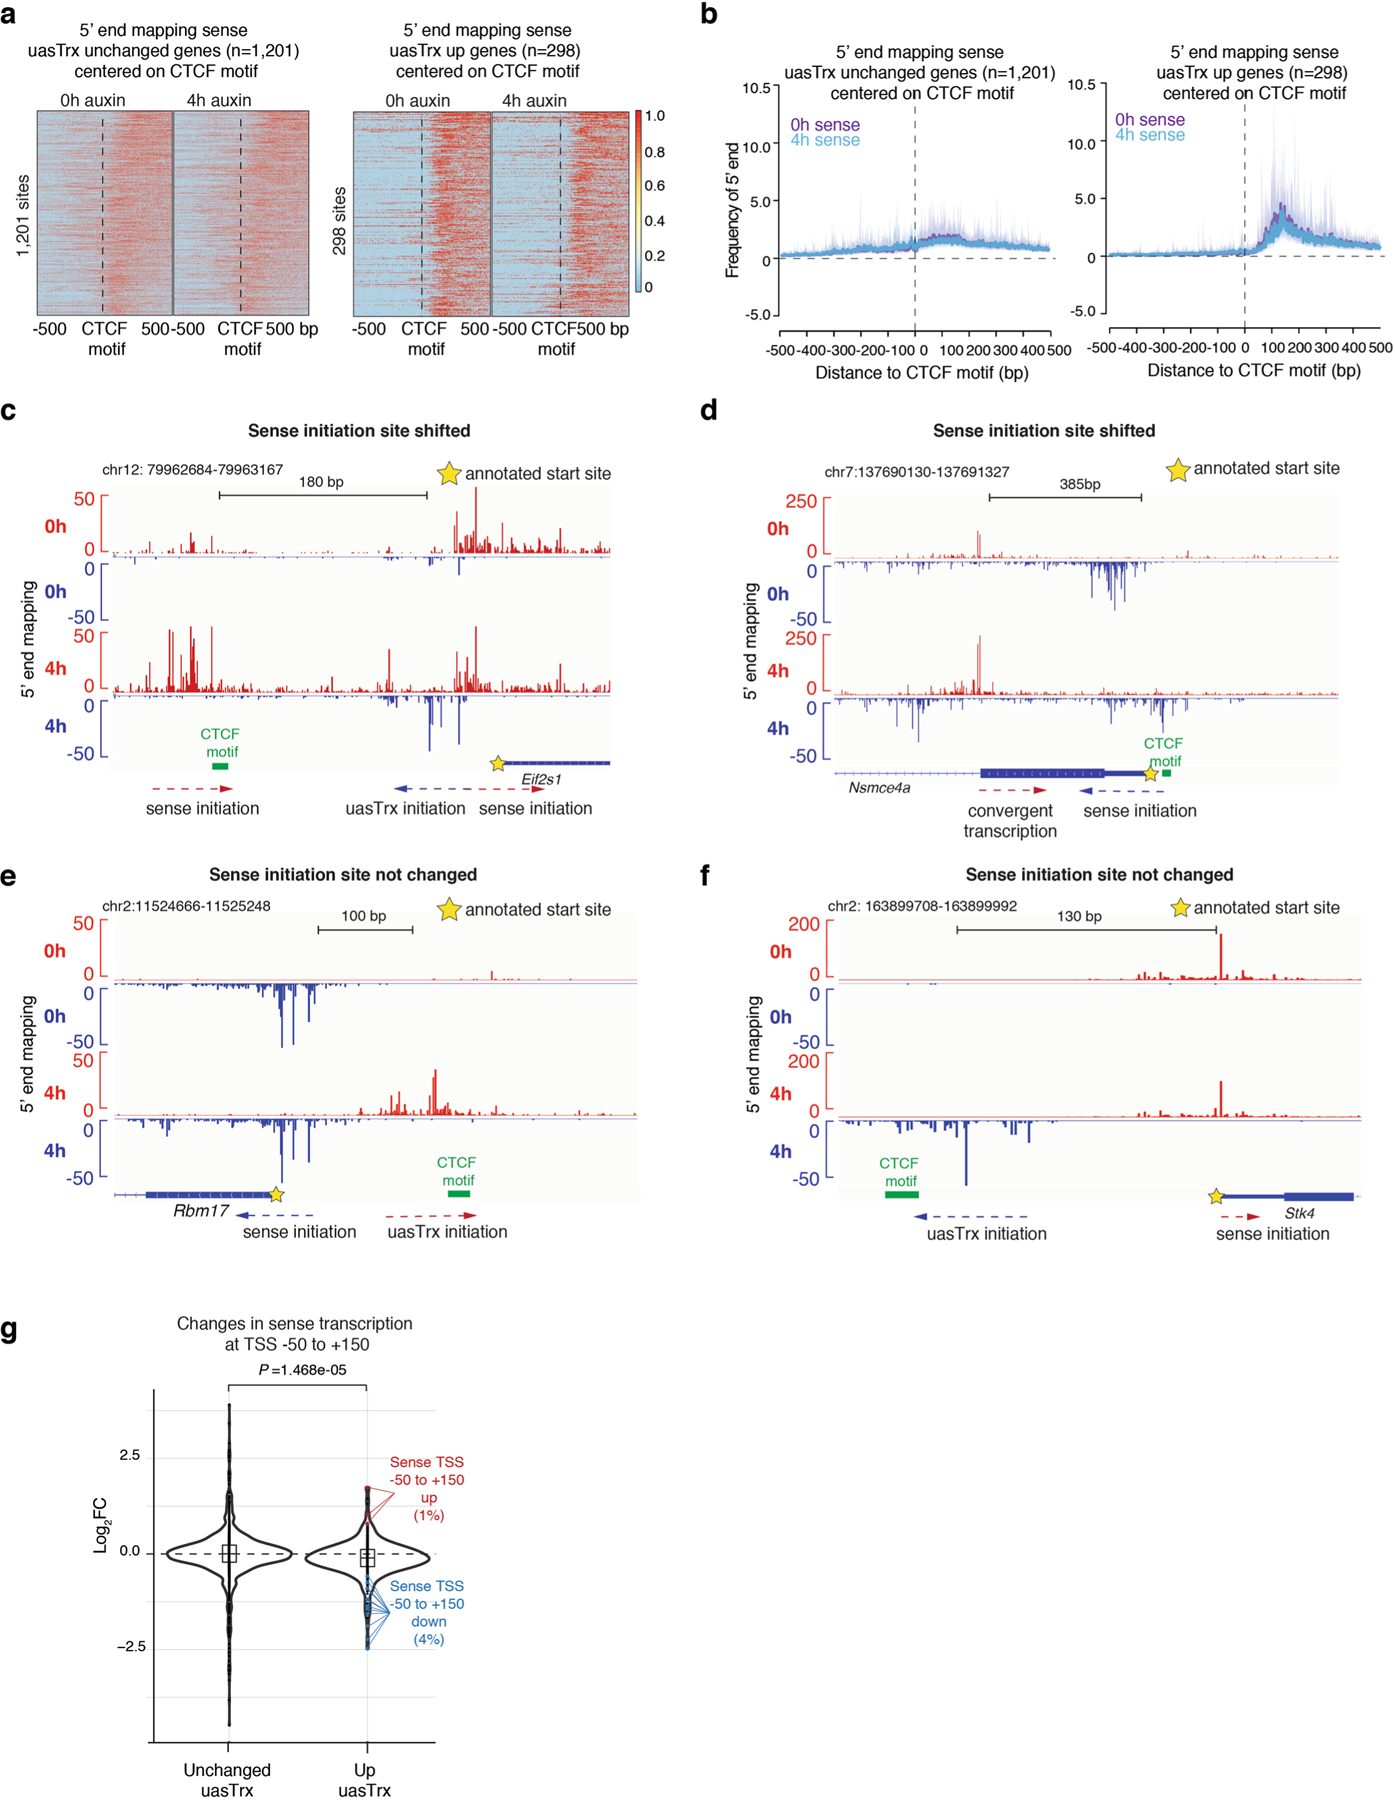
a, Heatmap of 5’ end mapping at genes with unchanged uasTrx (n = 1,201) that exhibit proximal CTCF binding and high-confidence CTCF motif(s) (motif prediction score>75), centered on CTCF motifs, sorted by mean antisense signal densities over the center 200 bp and shown with respect to sense orientation. Black line highlights CTCF motif locations. b, Metaplot of data in (a). c, 5’ end mapping of sense and uasTrx transcription at the Eif2s1 gene. Yellow star indicates annotated sense TSS, CTCF motif indicated in green. d, Same as in (c) for Nsmce4a. e, Same as in (c) for Rbm17. f, Same as in (c) for Stk4. g, Violin plot showing sense changes at TSS −50 to +150 bp. P value comparing conditions was calculated using a Wilcoxon rank sum test. Significant differentially enriched TSSs are indicated in colors. Boxes within violins represent first and third quartiles with the median indicated as an horizontal line within the box. Whiskers define 1.5× the interquartile range. Outliers are plotted as individual dots.
Supplementary Material
Acknowledgements
We are grateful to Hardison, Raj, Lis and Blobel laboratories for insightful discussions. We thank the staff at the flow cytometry core of The Children’s Hospital of Philadelphia. This work was supported by NIH grants no. R01 DK58044 to G.A.B., R24 DK106766 to G.A.B. and R.C.H., T32 HL07439 to C.M.S., R01GM121613 to R.C.H. and U01 DK127405 to G.A.B. and A.R., an EMBO long-term fellowship (ALTF 540-2018) to M.W.V. and an American Heart Association postdoctoral fellowship 836074 to M.W.V. The funders had no role in study design, data collection and analysis, decision to publish or preparation of the manuscript.
Footnotes
Competing interests
The authors declare no competing interests.
Extended data is available for this paper at https://doi.org/10.1038/s41594-022-00855-y.
Supplementary information The online version contains supplementary material available at https://doi.org/10.1038/s41594-022-00855-y.
Code availability
The code used to process PRO-seq data is available at https://github.com/zhezhangsh/PROseqR.
Online content
Any methods, additional references, Nature Research reporting summaries, source data, extended data, supplementary information, acknowledgements, peer review information; details of author contributions and competing interests; and statements of data and code availability are available at https://doi.org/10.1038/s41594-022-00855-y.
Data availability
Sequencing data of ChIP-seq and PRO-seq experiments are deposited in the Gene Expression Omnibus (GEO) under accession no. GSE173444. CTCF ChIP-seq and RAD21 ChIP-seq data were obtained from GEO under accession no. GSE150418 by Luan et al.27 (https://doi.org/10.1016/j.celrep.2021.108783). RNA-seq and ChIP-seq data are from GEO under accession no. GSE104334 by Rao et al.43 (https://doi.org/10.1016/j.cell.2017.09.026) and no. GSE98671 by Nora et al.32 (https://doi.org/10.1016/j.cell.2017.05.004). Source data are provided with this paper.
References
- 1.Seila AC et al. Divergent transcription from active promoters. Science 322, 1849–1851 (2008). [DOI] [PMC free article] [PubMed] [Google Scholar]
- 2.Core LJ, Waterfall JJ & Lis JT Nascent RNA sequencing reveals widespread pausing and divergent initiation at human promoters. Science 322, 1845–1848 (2008). [DOI] [PMC free article] [PubMed] [Google Scholar]
- 3.Preker P et al. RNA exosome depletion reveals transcription upstream of active human promoters. Science 322, 1851–1854 (2008). [DOI] [PubMed] [Google Scholar]
- 4.Bagchi DN & Iyer VR The determinants of directionality in transcriptional initiation. Trends Genet. 32, 322–333 (2016). [DOI] [PMC free article] [PubMed] [Google Scholar]
- 5.Murray SC et al. Sense and antisense transcription are associated with distinct chromatin architectures across genes. Nucleic Acids Res. 43, 7823–7837 (2015). [DOI] [PMC free article] [PubMed] [Google Scholar]
- 6.Seila AC, Core LJ, Lis JT & Sharp PA Divergent transcription: a new feature of active promoters. Cell Cycle 8, 2557–2564 (2009). [DOI] [PubMed] [Google Scholar]
- 7.Xu Z et al. Bidirectional promoters generate pervasive transcription in yeast. Nature 457, 1033–1037 (2009). [DOI] [PMC free article] [PubMed] [Google Scholar]
- 8.Wyers F et al. Cryptic Pol II transcripts are degraded by a nuclear quality control pathway involving a new poly(A) polymerase. Cell 121, 725–737 (2005). [DOI] [PubMed] [Google Scholar]
- 9.van Dijk EL et al. XUTs are a class of Xrn1-sensitive antisense regulatory non-coding RNA in yeast. Nature 475, 114–117 (2011). [DOI] [PubMed] [Google Scholar]
- 10.Rhee HS & Pugh BF Genome-wide structure and organization of eukaryotic pre-initiation complexes. Nature 483, 295–301 (2012). [DOI] [PMC free article] [PubMed] [Google Scholar]
- 11.Scruggs BS et al. Bidirectional transcription arises from two distinct hubs of transcription factor binding and active chromatin. Mol. Cell 58, 1101–1112 (2015). [DOI] [PMC free article] [PubMed] [Google Scholar]
- 12.Andersson R, Sandelin A & Danko CG A unified architecture of transcriptional regulatory elements. Trends Genet. 31, 426–433 (2015). [DOI] [PubMed] [Google Scholar]
- 13.Duttke SHC et al. Human promoters are intrinsically directional. Mol. Cell 57, 674–684 (2015). [DOI] [PMC free article] [PubMed] [Google Scholar]
- 14.Marquardt S et al. A chromatin-based mechanism for limiting divergent noncoding transcription. Cell 158, 462 (2014). [DOI] [PubMed] [Google Scholar]
- 15.Kapranov P et al. RNA maps reveal new RNA classes and a possible function for pervasive transcription. Science 316, 1484–1488 (2007). [DOI] [PubMed] [Google Scholar]
- 16.Trinklein ND et al. An abundance of bidirectional promoters in the human genome. Genome Res. 14, 62–66 (2004). [DOI] [PMC free article] [PubMed] [Google Scholar]
- 17.Core LJ et al. Analysis of nascent RNA identifies a unified architecture of initiation regions at mammalian promoters and enhancers. Nat. Genet 46, 1311–1320 (2014). [DOI] [PMC free article] [PubMed] [Google Scholar]
- 18.Phillips JE & Corces VG CTCF: master weaver of the genome. Cell 137, 1194–1211 (2009). [DOI] [PMC free article] [PubMed] [Google Scholar]
- 19.Khoury A et al. Constitutively bound CTCF sites maintain 3D chromatin architecture and long-range epigenetically regulated domains. Nat. Commun 11, 54 (2020). [DOI] [PMC free article] [PubMed] [Google Scholar]
- 20.Kubo N et al. Promoter-proximal CTCF binding promotes distal enhancer-dependent gene activation. Nat. Struct. Mol. Biol 28, 152–161 (2021). [DOI] [PMC free article] [PubMed] [Google Scholar]
- 21.Nora EP et al. Spatial partitioning of the regulatory landscape of the X-inactivation centre. Nature 485, 381–385 (2012). [DOI] [PMC free article] [PubMed] [Google Scholar]
- 22.Thiecke MJ et al. Cohesin-dependent and -independent mechanisms mediate chromosomal contacts between promoters and enhancers. Cell Rep. 32, 107929 (2020). [DOI] [PMC free article] [PubMed] [Google Scholar]
- 23.Wutz G et al. Topologically associating domains and chromatin loops depend on cohesin and are regulated by CTCF, WAPL and PDS5 proteins. EMBO J. 36, 3573–3599 (2017). [DOI] [PMC free article] [PubMed] [Google Scholar]
- 24.Zuin J et al. Cohesin and CTCF differentially affect chromatin architecture and gene expression in human cells. Proc. Natl Acad. Sci. USA 111, 996–1001 (2014). [DOI] [PMC free article] [PubMed] [Google Scholar]
- 25.Busslinger GA et al. Cohesin is positioned in mammalian genomes by transcription, CTCF and Wapl. Nature 544, 503–507 (2017). [DOI] [PMC free article] [PubMed] [Google Scholar]
- 26.Hyle J et al. Acute depletion of CTCF directly affects MYC regulation through loss of enhancer-promoter looping. Nucleic Acids Res. 47, 6699–6713 (2019). [DOI] [PMC free article] [PubMed] [Google Scholar]
- 27.Luan J et al. Distinct properties and functions of CTCF revealed by a rapidly inducible degron system. Cell Rep. 34, 108783 (2021). [DOI] [PMC free article] [PubMed] [Google Scholar]
- 28.Mattick JS & Makunin IV Non-coding RNA. Hum. Mol. Genet 15, R17–R29 (2006). [DOI] [PubMed] [Google Scholar]
- 29.Kwak H, Fuda NJ, Core LJ & Lis JT Precise maps of RNA polymerase reveal how promoters direct initiation and pausing. Science 339, 950–953 (2013). [DOI] [PMC free article] [PubMed] [Google Scholar]
- 30.Bornelöv S, Komorowski J & Wadelius C Different distribution of histone modifications in genes with unidirectional and bidirectional transcription and a role of CTCF and cohesin in directing transcription. BMC Genomics 16, 300 (2015). [DOI] [PMC free article] [PubMed] [Google Scholar]
- 31.Shen Y et al. A map of the cis-regulatory sequences in the mouse genome. Nature 488, 116–120 (2012). [DOI] [PMC free article] [PubMed] [Google Scholar]
- 32.Nora EP et al. Targeted degradation of CTCF decouples local insulation of chromosome domains from genomic compartmentalization. Cell 169, 930–944 (2017). [DOI] [PMC free article] [PubMed] [Google Scholar]
- 33.Fudenberg G et al. Formation of chromosomal domains by loop extrusion. Cell Rep. 15, 2038–2049 (2016). [DOI] [PMC free article] [PubMed] [Google Scholar]
- 34.Sanborn AL et al. Chromatin extrusion explains key features of loop and domain formation in wild-type and engineered genomes. Proc. Natl Acad. Sci. USA 112, E6456–E6465 (2015). [DOI] [PMC free article] [PubMed] [Google Scholar]
- 35.Dixon JR et al. Topological domains in mammalian genomes identified by analysis of chromatin interactions. Nature 485, 376–380 (2012). [DOI] [PMC free article] [PubMed] [Google Scholar]
- 36.Tan-Wong SM et al. Gene loops enhance transcriptional directionality. Science 338, 671–675 (2012). [DOI] [PMC free article] [PubMed] [Google Scholar]
- 37.Simonis M et al. Nuclear organization of active and inactive chromatin domains uncovered by chromosome conformation capture-on-chip (4C). Nat. Genet 38, 1348–1354 (2006). [DOI] [PubMed] [Google Scholar]
- 38.van de Werken HJG et al. Robust 4C-seq data analysis to screen for regulatory DNA interactions. Nat. Methods 9, 969–972 (2012). [DOI] [PubMed] [Google Scholar]
- 39.Krijger PHL, Geeven G, Bianchi V, Hilvering CRE & de Laat W 4C-seq from beginning to end: a detailed protocol for sample preparation and data analysis. Methods 170, 17–32 (2020). [DOI] [PubMed] [Google Scholar]
- 40.Geeven G, Teunissen H, de Laat W & de Wit E peakC: a flexible, non-parametric peak calling package for 4C and Capture-C data. Nucleic Acids Res. 46, e91 (2018). [DOI] [PMC free article] [PubMed] [Google Scholar]
- 41.Ran FA et al. Genome engineering using the CRISPR-Cas9 system. Nat. Protoc 8, 2281–2308 (2013). [DOI] [PMC free article] [PubMed] [Google Scholar]
- 42.Schwarzer W et al. Two independent modes of chromatin organization revealed by cohesin removal. Nature 551, 51–56 (2017). [DOI] [PMC free article] [PubMed] [Google Scholar]
- 43.Rao SSP Cohesin loss eliminates all loop. Cell Domains 4, 24–26 (2017). [DOI] [PMC free article] [PubMed] [Google Scholar]
- 44.Golding I, Paulsson J, Zawilski SM & Cox EC Real-time kinetics of gene activity in individual bacteria. Cell 123, 1025–1036 (2005). [DOI] [PubMed] [Google Scholar]
- 45.Chubb JR, Trcek T, Shenoy SM & Singer RH Transcriptional pulsing of a developmental gene. Curr. Biol 16, 1018–1025 (2006). [DOI] [PMC free article] [PubMed] [Google Scholar]
- 46.Raj A, Peskin CS, Tranchina D, Vargas DY & Tyagi S Stochastic mRNA synthesis in mammalian cells. PLoS Biol. 4, e309 (2006). [DOI] [PMC free article] [PubMed] [Google Scholar]
- 47.Filippova GN et al. An exceptionally conserved transcriptional repressor, CTCF, employs different combinations of zinc fingers to bind diverged promoter sequences of avian and mammalian c-myc oncogenes. Mol. Cell. Biol 16, 2802–2813 (1996). [DOI] [PMC free article] [PubMed] [Google Scholar]
- 48.Shukla S et al. CTCF-promoted RNA polymerase II pausing links DNA methylation to splicing. Nature 479, 74–79 (2011). [DOI] [PMC free article] [PubMed] [Google Scholar]
- 49.Mayer A et al. Native elongating transcript sequencing reveals human transcriptional activity at nucleotide resolution. Cell 161, 541–554 (2015). [DOI] [PMC free article] [PubMed] [Google Scholar]
- 50.Booth GT, Wang IX, Cheung VG & Lis JT Corrigendum: divergence of a conserved elongation factor and transcription regulation in budding and fission yeast. Genome Res. 26, 1010–1011 (2016). [DOI] [PMC free article] [PubMed] [Google Scholar]
- 51.Tome JM, Tippens ND & Lis JT Single-molecule nascent RNA sequencing identifies regulatory domain architecture at promoters and enhancers. Nat. Genet 50, 1533–1541 (2018). [DOI] [PMC free article] [PubMed] [Google Scholar]
- 52.Wu ACK et al. Repression of divergent noncoding transcription by a sequence-specific transcription factor. Mol. Cell 72, 942–954 (2018). [DOI] [PMC free article] [PubMed] [Google Scholar]
- 53.Sansó M et al. Cdk9 and H2Bub1 signal to Clr6-CII/Rpd3S to suppress aberrant antisense transcription. Nucleic Acids Res. 48, 7154–7168 (2020). [DOI] [PMC free article] [PubMed] [Google Scholar]
- 54.Baluapuri A et al. MYC recruits SPT5 to RNA polymerase II to promote processive transcription elongation. Mol. Cell 74, 674–687 (2019). [DOI] [PMC free article] [PubMed] [Google Scholar]
- 55.Xue Y et al. Mot1, Ino80C and NC2 function coordinately to regulate pervasive transcription in yeast and mammals. Mol. Cell 67, 594–607 (2017). [DOI] [PMC free article] [PubMed] [Google Scholar]
- 56.Tan-Wong SM, Dhir S & Proudfoot NJ R-loops promote antisense transcription across the mammalian genome. Mol. Cell 76, 600–616 (2019). [DOI] [PMC free article] [PubMed] [Google Scholar]
- 57.Nojima T et al. Deregulated expression of mammalian lncRNA through loss of SPT6 induces R-loop formation, replication stress and cellular senescence. Mol. Cell 72, 970–984 (2018). [DOI] [PMC free article] [PubMed] [Google Scholar]
- 58.Hou C, Zhao H, Tanimoto K & Dean A CTCF-dependent enhancer-blocking by alternative chromatin loop formation. Proc. Natl Acad. Sci. USA 105, 20398–20403 (2008). [DOI] [PMC free article] [PubMed] [Google Scholar]
- 59.Hsu SC et al. The BET protein BRD2 cooperates with CTCF to enforce transcriptional and architectural boundaries. Mol. Cell 66, 102–116 (2017). [DOI] [PMC free article] [PubMed] [Google Scholar]
- 60.Bartman CR, Hsu SC, Hsiung CC-S, Raj A & Blobel GA Enhancer regulation of transcriptional bursting parameters revealed by forced chromatin looping. Mol. Cell 62, 237–247 (2016). [DOI] [PMC free article] [PubMed] [Google Scholar]
- 61.Lim HM, Lewis DEA, Lee HJ, Liu M & Adhya S Effect of varying the supercoiling of DNA on transcription and its regulation. Biochemistry 42, 10718–10725 (2003). [DOI] [PubMed] [Google Scholar]
- 62.Peter BJ et al. Genomic transcriptional response to loss of chromosomal supercoiling in Escherichia coli. Genome Biol. 5, R87 (2004). [DOI] [PMC free article] [PubMed] [Google Scholar]
- 63.Lee J, Krivega I, Dale RK & Dean A The LDB1 complex co-opts CTCF for erythroid lineage-specific long-range enhancer interactions. Cell Rep. 19, 2490–2502 (2017). [DOI] [PMC free article] [PubMed] [Google Scholar]
- 64.Baniahmad A, Steiner C, Köhne AC & Renkawitz R Modular structure of a chicken lysozyme silencer: involvement of an unusual thyroid hormone receptor binding site. Cell 61, 505–514 (1990). [DOI] [PubMed] [Google Scholar]
- 65.Weiss MJ, Yu C & Orkin SH Erythroid-cell-specific properties of transcription factor GATA-1 revealed by phenotypic rescue of a gene-targeted cell line. Mol. Cell. Biol 17, 1642–1651 (1997). [DOI] [PMC free article] [PubMed] [Google Scholar]
- 66.Luppino JM et al. Cohesin promotes stochastic domain intermingling to ensure proper regulation of boundary-proximal genes. Nat. Genet 52, 840–848 (2020). [DOI] [PMC free article] [PubMed] [Google Scholar]
- 67.Stonestrom AJ et al. Functions of BET proteins in erythroid gene expression. Blood 125, 2825–2834 (2015). [DOI] [PMC free article] [PubMed] [Google Scholar]
- 68.Cong L & Zhang F Genome engineering using CRISPR-Cas9 system. Methods Mol. Biol 1239, 197–217 (2015). [DOI] [PubMed] [Google Scholar]
- 69.Reimer KA, Mimoso C, Adelman K & Neugebauer KM Co-transcriptional splicing regulates 3′ end cleavage during mammalian erythropoiesis. Mol. Cell 81, 998–1012 (2021). [DOI] [PMC free article] [PubMed] [Google Scholar]
- 70.Splinter E, de Wit E, van de Werken HJG, Klous P & de Laat W Determining long-range chromatin interactions for selected genomic sites using 4C-seq technology: from fixation to computation. Methods 58, 221–230 (2012). [DOI] [PubMed] [Google Scholar]
- 71.van de Werken HJG et al. 4C technology: protocols and data analysis. Methods Enzymol. 513, 89–112 (2012). [DOI] [PubMed] [Google Scholar]
- 72.Femino AM, Fay FS, Fogarty K & Singer RH Visualization of single RNA transcripts in situ. Science 280, 585–590 (1998). [DOI] [PubMed] [Google Scholar]
- 73.Love MI, Huber W & Anders S Moderated estimation of fold change and dispersion for RNA-seq data with DESeq2. Genome Biol. 15, 550 (2014). [DOI] [PMC free article] [PubMed] [Google Scholar]
- 74.Langmead B & Salzberg SL Fast gapped-read alignment with Bowtie 2. Nat. Methods 9, 357–359 (2012). [DOI] [PMC free article] [PubMed] [Google Scholar]
- 75.Zhang Y et al. Model-based analysis of ChIP-Seq (MACS). Genome Biol. 9, R137 (2008). [DOI] [PMC free article] [PubMed] [Google Scholar]
- 76.Raj A, Rifkin SA, Andersen E & van Oudenaarden A Variability in gene expression underlies incomplete penetrance. Nature 463, 913–918 (2010). [DOI] [PMC free article] [PubMed] [Google Scholar]
Associated Data
This section collects any data citations, data availability statements, or supplementary materials included in this article.
Supplementary Materials
Data Availability Statement
Sequencing data of ChIP-seq and PRO-seq experiments are deposited in the Gene Expression Omnibus (GEO) under accession no. GSE173444. CTCF ChIP-seq and RAD21 ChIP-seq data were obtained from GEO under accession no. GSE150418 by Luan et al.27 (https://doi.org/10.1016/j.celrep.2021.108783). RNA-seq and ChIP-seq data are from GEO under accession no. GSE104334 by Rao et al.43 (https://doi.org/10.1016/j.cell.2017.09.026) and no. GSE98671 by Nora et al.32 (https://doi.org/10.1016/j.cell.2017.05.004). Source data are provided with this paper.


