

Abstract
BACKGROUND.
Posttreatment recurrence is an unpredictable complication after liver transplant for hepatocellular carcinoma (HCC) that is associated with poor survival. Biomarkers are needed to estimate recurrence risk before organ allocation.
OBJECTIVE.
This proof-of-concept study evaluated the use of machine learning (ML) to predict recurrence from pretreatment laboratory, clinical, and MRI data in patients with early-stage HCC initially eligible for liver transplant.
METHODS.
This retrospective study included 120 patients (88 men, 32 women; median age, 60.0 years) with early-stage HCC diagnosed who were initially eligible for liver transplant and underwent treatment by transplant, resection, or thermal ablation between June 2005 and March 2018. Patients underwent pretreatment MRI and posttreatment imaging surveillance. Imaging features were extracted from postcontrast phases of pretreatment MRI examinations using a pretrained convolutional neural network. Pretreatment clinical characteristics (including laboratory data) and extracted imaging features were integrated to develop three ML models (clinical model, imaging model, combined model) for predicting recurrence within six time frames ranging from 1 through 6 years after treatment. Kaplan-Meier analysis with time to recurrence as the endpoint was used to assess the clinical relevance of model predictions.
RESULTS.
Tumor recurred in 44 of 120 (36.7%) patients during follow-up. The three models predicted recurrence with AUCs across the six time frames of 0.60–0.78 (clinical model), 0.71–0.85 (imaging model), and 0.62–0.86 (combined model). The mean AUC was higher for the imaging model than the clinical model (0.76 vs 0.68, respectively; p = .03), but the mean AUC was not significantly different between the clinical and combined models or between the imaging and combined models (p > .05). Kaplan-Meier curves were significantly different between patients predicted to be at low risk and those predicted to be at high risk by all three models for the 2-, 3-, 4-, 5-, and 6-year time frames (p < .05).
CONCLUSION.
The findings suggest that ML-based models can predict recurrence before therapy allocation in patients with early-stage HCC initially eligible for liver transplant. Adding MRI data as model input improved predictive performance over clinical parameters alone. The combined model did not surpass the imaging model’s performance.
CLINICAL IMPACT.
ML-based models applied to currently underutilized imaging features may help design more reliable criteria for organ allocation and liver transplant eligibility.
Keywords: hepatocellular carcinoma, liver transplantation, local neoplasm recurrence, machine learning, MRI, neoplasm recurrence
Hepatocellular carcinoma (HCC) is the most common primary liver cancer and the fourth most common cause of cancer-related death worldwide [1, 2]. When HCC is diagnosed at early stages (Barcelona Clinic liver cancer [BCLC] stage 0 or A), treatment options are thermal ablation, surgical resection, and orthotopic liver transplant [3]. Liver transplant removes the tumor and treats the underlying liver disease and, among these approaches, has the lowest recurrence rates and the longest overall survival rates [4]. HCC currently represents 15–20% of all indications for liver transplant [5], and transplant rates for HCC are increasing despite a limited number of organ donations [6]. Reported recurrence rates after liver transplant for HCC are as high as 20% [7]. Posttransplant disease recurrence is associated with a median survival of less than 1 year from diagnosis [8], and only 1% of patients with recurrence can be cured [9]. However, recurrence is currently an unpredictable complication, and biomarkers are needed to better estimate the risk of recurrence before organ allocation, representing a current research priority [7]. A means to identify patients with increased risk of recurrence would allow better allocation of limited organs to patients needing a liver transplant and thereby improve clinical outcomes [6].
The current reference standard for patient selection for liver transplant for HCC are the Milan criteria (MC). The MC are based on the size and number of HCCs, macrovascular invasion, and extrahepatic metastases [10]. Recent studies suggest that imaging-based features extracted from HCCs and from the background liver parenchyma may play a role in predicting recurrence [11– 14]. Furthermore, combining imaging features, primarily from MRI, with laboratory (e.g., α-fetoprotein [AFP]) and clinical biomarkers may help predict posttransplant outcome [15]. The imaging features used for predicting recurrence in prior investigations have typically been either qualitative features engineered on the basis of radiologic domain knowledge [11, 16] or quantitative features [12]. All such features could be extracted using advanced image analysis and machine learning (ML). Deep learning (DL), a subset of ML algorithms, has been applied to unstructured data, such as medical images, and can automatically extract informative and nonpredefined features from the provided input to solve specific problems such as outcome prediction [17]. This methodology has been particularly successful in identifying patterns invisible to humans. The evidence supporting use of ML for predicting HCC recurrence remains low, with limited conclusive evidence to date supporting the successful application of DL for this clinical problem. ML can handle structured and unstructured data as well as use supervised statistical and probabilistic approaches to produce high-order interactions between input features for predicting a target variable [11, 12]. ML thus has unique potential to apply available technologies to address the current unmet clinical need of predicting HCC recurrence.
We conducted this proof-of-concept study to evaluate the use of ML to predict tumor recurrence from pretreatment laboratory, clinical, and MRI data in patients with early-stage HCC initially eligible for liver transplant.
Methods
This single-center retrospective study conformed to the ethical guidelines of the 1975 Declaration of Helsinki and was approved by the institutional review board. The requirement for informed consent was waived. The study was compliant with HIPAA.
Patient Cohort
The institution’s enterprise-wide electronic health record was searched for patients with HCC treated by liver transplant, surgical resection, or thermal ablation between June 2005 and March 2018. The medical records of 1145 patients fulfilling these criteria were reviewed. A total of 694 patients were excluded due to the following tumor- and treatment-related reasons: HCC was not confirmed by MRI or by tissue diagnosis (as described later in the Methods) or HCC was not formally eligible for liver transplant according to the MC (n = 537); liver transplant, thermal ablation, or surgical resection was not performed as a stand-alone first-line treatment of HCC (n = 105); there was no complete response after the first-line treatment with absence of any intra- and extrahepatic tumor on imaging at the time of the first follow-up imaging (n = 34); there were active non-HCC comalignancies within the period from the day of diagnosis until the last day of follow-up (n = 13); HCC was not early-stage HCC based on classification as BCLC stage 0 or A according to the most recent BCLC staging system [3] (n = 3); and metastatic HCC or macrovascular invasion was confirmed by pretreatment imaging (n = 2). One patient with disease classified as BCLC stage B met the institution’s extended transplant criteria and received a transplant and was therefore not excluded on the basis of BCLC stage [3, 18]. Of the remaining 451 patients, 331 were excluded due to the following data availability reasons: no contrast-enhanced multiparametric MRI examination performed before treatment was available (n = 166), no posttreatment follow-up was available (n = 141), and artifacts on pretreatment MRI precluded image analysis (n = 24). Figure 1 shows the patient selection process, which resulted in a final study cohort of 120 patients (32 women, 88 men; age ≥ 18 years [median age, 60.0 years]). For the included patients, the final contrast-enhanced MRI performed before treatment was selected for analysis. The median time between the pretreatment MRI and treatment was 2.5 months (IQR, 1.4–12.4 months). The maximum HCC diameter and sum of the diameters of all HCCs on the pretreatment MRI were recorded.
Fig. 1—

Flowchart shows patient selection process that led to final study cohort. HCC = hepatocellular carcinoma, OLT = orthotopic liver transplant, EHR = electronic health record, MC = Milan criteria, BCLC = Barcelona Clinic liver cancer, mpMRI = multiparametric MRI.
Confirmation of the Presence of Hepatocellular Carcinoma
During the previously described patient selection process, pretreatment MRI examinations in potentially eligible patients were reviewed by one of three board-certified radiologists (M.N. with 3 years, K.C. with 2 years, and E.T. with 2 years of posttraining experience in body MRI) to confirm the presence of HCC based on LI-RADS version 2018 criteria [19]. This confirmation process is described further in the Supplemental Methods (available in the online supplement). The LI-RADS categories assigned during this initial selection process were used only to determine study eligibility and were not included in the models or otherwise used further in the investigation.
Determination of Recurrence
Based on institutional protocols, patients were screened for recurrence by contrast-enhanced MRI or CT of the abdomen every 3 months within the 1st year after treatment and every 6 months subsequently, as well as by noncontrast CT of the thorax every 6 months until death or until lost to follow-up. The medical records, including MRI and pathology reports, were reviewed to determine the study’s clinical endpoint of tumor recurrence; images were not reviewed for this purpose. Recurrence was defined as intra- or extrahepatic evidence of new tumor after treatment, confirmed by either LR-5 assessment of a liver lesion on MRI or by histologic assessment of an intra- or extrahepatic abnormality. In patients with recurrence, the recurrence was classified as intrahepatic local (within the liver, at the margin of the original tumor), intrahepatic distant (within the liver, distant from the original tumor), or extrahepatic (outside of the liver), and the time to recurrence (TTR) was calculated as the interval between the day of curative treatment and the day that recurrence was first evident on imaging (even if ultimately diagnosed histologically after the date first detected by imaging). The number of tumors present at the time of recurrence was extracted from the radiology reports.
The risk of recurrence was predicted for six time periods (1, 2, 3, 4, 5, and 6 years) after first-line treatment, leading to determination of six different TTR cutoff points. Separate patient cohorts were defined for the assessment for each time period. For each time period, patients with recurrence were labeled as such if the recurrence occurred within the given time frame and were labeled as no recurrence otherwise, and patients without recurrence were included only if having available follow-up for at least as long as the given time frame. This process resulted in smaller patient cohorts for each subsequent year. For example, the 1-year cohort included all 120 patients, whereas the 6-year cohort included 66 patients.
Clinical and Laboratory Data
The ML model training used a total of 67 pretreatment clinical and laboratory variables, summarized in Table 1 and Tables S1–S3 (available in the online supplement). These pretreatment variables were retrieved from the institution’s clinical database and included BCLC stage, Hong Kong liver cancer stage, Child-Pugh score, model for end-stage liver disease–sodium score, age, sex, cause of liver disease, and laboratory values. The variables also included calculated immune scores such as the neutrophil-to-lymphocyte ratio and platelet-to-lymphocyte ratio [13]. The median time between the collection of laboratory values and treatment was 1.8 months (IQR, 0.8–11.6 months). Values that were not available were treated as missing data, and no data imputation was performed.
TABLE 1:
Pretreatment Patient Characteristics Included in Clinical and Combined Model
| Characteristica | Overall (n = 120) | No HCC Recurrence (n = 76) | HCC Recurrence (n = 44) | p |
|---|---|---|---|---|
| HKLC stageb | > .99 | |||
| I | 68 (58.1) | 38 (51.4) | 30 (69.8) | |
| IIa | 34 (29.1) | 26 (35.1) | 8 (18.6) | |
| IIb | 7 (6.0) | 3 (4.1) | 4 (9.3) | |
| IIIa | 2 (1.7) | 1 (1.4) | 1 (2.3) | |
| Va | 6 (5.1) | 6 (8.1) | 0 (0.0) | |
| BCLC stage | > .99 | |||
| 0 | 36 (30.0) | 21 (27.6) | 15 (34.1) | |
| A | 83 (69.2) | 54 (71.1) | 29 (65.9) | |
| B | 1 (0.8) | 1 (1.3) | 0 (0.0) | |
| Child-Pugh scoreb | > .99 | |||
| A | 76 (65.0) | 42 (56.8) | 34 (79.1) | |
| B | 35 (29.9) | 26 (35.1) | 9 (20.9) | |
| C | 6 (5.1) | 6 (8.1) | 0 (0.0) | |
| MELD-Na score | 9.0 [7.0–12.0] | 10.0 [7.0–13.0] | 8.0 [7.0–10.0] | .59 |
| Age at treatment (y) | 60.0 [55.8–66.2] | 60.0 [55.0–65.0] | 61.0 [56.8–70.0] | > .99 |
| Sex | > .99 | |||
| Female | 32 (26.7) | 21 (27.6) | 11 (25.0) | |
| Male | 88 (73.3) | 55 (72.4) | 33 (75.0) | |
| Cause of liver disease | > .99 | |||
| Hepatitis B | 5 (4.2) | 4 (5.3) | 1 (2.3) | |
| Hepatitis C | 61 (50.8) | 38 (50.0) | 23 (52.3) | |
| Alcohol use | 11 (9.2) | 7 (9.2) | 4 (9.1) | |
| Nonalcoholic steatohepatitis | 14 (11.7) | 10 (13.2) | 4 (9.1) | |
| Hepatitis C and alcohol use | 13 (10.8) | 7 (9.2) | 6 (13.6) | |
| Hepatitis B, hepatitis C, and alcohol use | 1 (0.8) | 0 (0.0) | 1 (2.3) | |
| Other | 15 (12.5) | 10 (13.2) | 5 (11.4) |
Note—Data are expressed as numbers with percentages in parentheses or as medians with IQRs in brackets. The Shapiro-Wilk test was used to assess data distributions for normalcy. Patients with and those without recurrence were compared using the chi-square test (for categoric and ordinal variables), the Mann-Whitney U test (for nonnormally distributed continuous variables), or the t test (for normally distributed continuous variables). Significance level alpha is .05; p values are Bonferroni-corrected.
HCC = hepatocellular carcinoma, HKLC = Hong Kong liver cancer, BCLC = Barcelona Clinic liver cancer, MELD-Na = model for end-stage liver disease–sodium.
Additional patient characteristics are shown in Tables S1–S3 (available in the online supplement).
Data are missing for three patients.
MRI Examinations
Acquisition—
MRI examinations were performed on a range of scanners and using a range of acquisition parameters. Further details about the acquisition parameters are provided in the Supplemental Methods. Only the postcontrast T1-weighted sequences were used for the models in the present investigation.
Image preprocessing—
An open-source software solution (3D Slicer, version 4.10.2) was used for image preprocessing [20]. For each patient, a 3rd-year radiology resident (R.R.) drew a rectangular 3D bounding box around the whole liver using the arterial phase postcontrast images, supervised by two of the previously noted radiologists (K.C., M.N.) who reviewed the placement of bounding boxes in all patients. The x, y, and z coordinates of the bounding boxes’ vertices were transferred to the portal venous and delayed phase images and were then manually adjusted in position as needed, without adjusting the box size (Fig. S1, available in the online supplement). The adapted bounding boxes were used to crop the images for all three phases to include only the liver. The cropped images were resized to a common matrix size of 224 × 224 pixels. Further details of the image preprocessing are provided in the Supplemental Methods. The final dataset per patient for use in the models contained a matrix of 224 × 224 × 3 pixels for each of a reduced number of slices.
Machine Learning Framework
The ML framework was implemented in Python (version 3.7) and consisted of two consecutive parts, with two separate algorithms (Fig. 2). In the first part, a pretrained Visual Geometry Group (VGG)-16 convolutional neural network (CNN) was used to extract numeric MRI features in an unsupervised manner [21] from the network’s penultimate layer (fully connected layer 2).
Fig. 2—
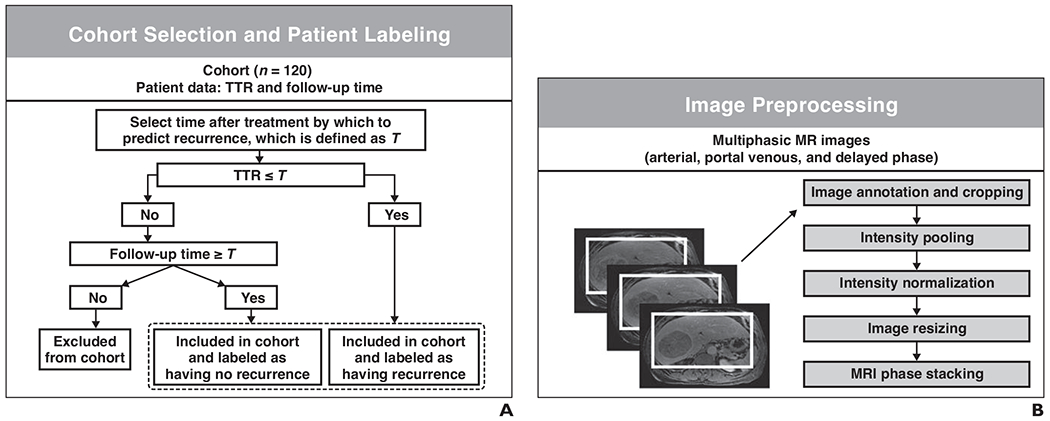
Machine learning (ML) framework.
A, Schematic shows patients were selected and classified in terms of presence of recurrence within each of six time frames used for model-based predictions of recurrence. TTR = time to recurrence.
B, Schematic shows images were preprocessed and used as input for convolutional neural network (Visual Geometry Group [VGG]-16).
C, Schematic shows learned imaging features were extracted from VGG-16 as vectors. Clinical features, shown by symbols and icons in bottom left corner, were encoded into vectors. Vectors were concatenated to be used as input for combined model.
D, Schematic shows tree-based extreme gradient boosting (XGBoost) models predicting hepatocellular carcinoma recurrence were trained and tested within nested cross-validation (CV) consisting of outer loop and inner loop.
E, Schematic shows three models were evaluated by computing AUCs of ROC curves.
A total of 4096 features were extracted per stack (i.e., per 224 × 224 × 3 matrix). All feature vectors for a single patient were averaged to create a single feature vector representing each patient. The VGG-16 model and weights were downloaded from Keras (version 2.3.1) and run on a TensorFlow (version 2.0) back end [22]. The weights were frozen after the initial training process on the ImageNet database [23].
In the second part, an extreme gradient boosting (XGBoost) ML classifier was trained to associate the baseline laboratory, clinical, and VGG-16 DL-extracted MRI features to the binary recurrence outcomes [24]. Three independent training sessions were held to build three different models: a model using clinical data only, a model using imaging data only, and a model using both clinical and imaging data (combined feature sets from both approaches). XGBoost was downloaded from the Python library Scikit-Learn (version 0.22.1). Nested cross-validation (CV) was used, consisting of an outer-loop leave-one-out CV for evaluation of model performance on unseen data examples and an inner-loop Monte Carlo CV for model optimization.
In each iteration of the Monte Carlo CV, all patients—except one patient who was left out as an independent test example in the outer loop—were randomly sampled with replacement, allowing 90% training cohort and 10% validation cohort. Hyperparameters for XGBoost were optimized using a random-search approach based on random selections of values for the hyperparameters out of a predefined search space. The hyperparameters yielding the highest AUC in the inner-loop CV were then used for the independent model validation on the independent test patients from outer-loop leave-one-out CV.
The ML classifier in the second part did not include feature reduction methods among the 67 clinical and laboratory features and the 4096 imaging features. Potential overfitting was managed by the application of constraints to XGBoost’s structural parameters, including the maximum decision tree depth and the subsample ratio of the training instances, as well as other parameters. These constrains controlled the subsample ratio of features used by the model.
The code for the various ML algorithms is available online.
Statistical Analysis
Clinical and laboratory parameters—
The Shapiro-Wilk test was used to test the data distributions. Medians and IQRs were used to summarize nonnormally distributed continuous clinical features, and means and SDs were used to summarize normally distributed continuous features. Patients with and those without recurrence were compared using the chi-square test (for categoric and ordinal variables), the Mann-Whitney U test (for nonnormally distributed continuous variables), and the t test (for normally distributed continuous variables).
Prediction of recurrence—
The three models’ performance for each TTR cutoff point was evaluated by ROC curves. The sensitivity was plotted against 1 – specificity at various threshold settings, and the AUC was calculated. The DeLong method was used to compare the AUC between paired models based on assessment for overlap of 95% CIs. Wilcoxon signed rank tests were used to compare the mean AUC between models. Additionally, the precision value, recall value, F1 score, and accuracy were calculated.
Time to recurrence—
To investigate the three models’ clinical relevance, the recurrence predictions for all six time frames were analyzed by Kaplan-Meier curves. The models’ predictions for each TTR cutoff point were used to stratify patients into groups at low or high risk for recurrence. For each TTR cutoff point, the threshold used for stratifying patients as low or high risk was chosen by dividing the number of patients with recurrence by the total number of patients. These stratifications were used to compute Kaplan-Meier curves, with TTR as the outcome of interest. Two-tailed log rank tests were performed to compare the curves of each TTR cutoff point.
Patient-level analysis—
Patients with recurrence were stratified by their first-line treatment modality. The three models were then evaluated on the basis of the models’ total number of correct predictions for recurrence among patients with recurrence for the given treatment modality. These assessments were based on all recurrences occurring during the 6-year period along with model predictions using the 6-year TTR cutoff points.
General considerations—
Bonferroni correction was used to adjust p values for familywise error rates; p values less than .05 were considered statistically significant. Statistical analyses were performed in Python (version 3.7) using SciPy (version 1.4.1) and R (version 4.1.1) using the library pROC (version 1.18.0).
Results
Study Cohort
Among the 120 patients, the first-line treatment was liver transplant in 59 (49.1%), surgical resection in 32 (26.7%), and thermal ablation in 29 (24.2%) patients. Of the 29 patients who underwent thermal ablation, 19 (65.5%) received radiofrequency ablation; nine (31.0%), microwave ablation; and one (3.5%), a combination of radiofrequency ablation and percutaneous ethanol injection. A total of 102 patients (85.0%) had one HCC, 15 patients (12.5%) had two HCCs, and three patients (2.5%) had three HCCs on the pretreatment MRI. The presence of pretreatment HCC was confirmed by retrospective imaging review showing at least one LR-5 lesion on pretreatment MRI in 93 (77.5%) patients. The remaining 27 (22.5%) patients had LR-3 (n = 7, 5.8%), LR-4 (n = 17, 14.2%), or LR-M (n = 3, 2.5%) lesions. For these 27 patients, HCC was confirmed by biopsy in 17 (14.2%) or by postoperative pathology in 10 (8.3%) patients. Table S4 (available in the online supplement) summarizes the pretreatment LI-RADS category assignments. At baseline, 102 (85.0%) patients had cirrhosis, and 38 (31.7%) had ascites.
Posttreatment Recurrences
Of the 120 patients, 12 (10.0%) experienced recurrence within 1 year, 26 (21.7%) within 2 years, 36 (30.0%) within 3 years, 40 (33.3%) within 4 years, 43 (35.8%) within 5 years, and 44 (36.7%) within 6 years after treatment. The mean TTR was 26.8 ± 20.9 (SD) months. At the time of recurrence, 27 of 120 (22.5%) patients had one recurrent tumor, nine of 120 (7.5%) had two recurrent tumors, and eight of 120 (6.7%) had three recurrent tumors. Of the 44 patients with recurrence, the recurrence was classified as intrahepatic local in 10 (22.7%), intrahepatic distant in 22 (50.0%), extrahepatic in five (11.4%), and at multiple locations in seven (15.9%) patients. Patients with and those without recurrence showed no significant difference in terms of maximum HCC diameter (median, 2.5 vs 2.2 cm [IQR, 1.9–3.3 vs 1.8–2.9 cm]; p > .99) or sum of diameters of all HCCs (median, 2.5 vs 2.3 cm [IQR, 2.0–4.2 vs 2.0–3.5 cm]; p > .99) on pretreatment MRI. Recurrence occurred more often in patients who underwent surgical resection (18/32, 56.3%) or thermal ablation (18/29, 62.1%) than in those who underwent surgical liver transplant (8/59, 13.6%). Pretreatment clinical and laboratory features and corresponding Bonferroni-corrected p values for comparing patients with and those without recurrence are provided in Table 1 and Tables S1–S3. Patients with and those without recurrence showed no significant differences in terms of these pretreatment features (all p > .05) aside from a significantly higher absolute lymphocyte count in patients with recurrence than in those without recurrence (median, 1.6 vs 1.1 × 1000/μL, respectively; p = .049).
Prediction of Recurrence
Each of the three models predicted patients’ probability of recurrence within the six time frames after treatment (at 1, 2, 3, 4, 5, or 6 years). The AUC for classification of performance across the six time frames ranged from 0.60 to 0.78 for the clinical model, 0.71–0.85 for the imaging model, and 0.62–0.86 for the combined model. Across all assessments, the highest AUCs were achieved for the 4- and 6-year time frames, with these two time frames having AUCs of 0.78 (95% CI, 0.68–0.88) and 0.69 (95% CI, 0.54–0.84) for the clinical model, 0.81 (95% CI, 0.71–0.90) and 0.85 (95% CI, 0.75–0.95) for the imaging model, and 0.86 (95% CI, 0.78–0.95) and 0.86 (95% CI, 0.76–0.96) for the combined model, respectively. The DeLong method revealed that the 95% CIs of AUCs were overlapping between models in all investigated TTR time frames, indicating an absence of significant differences between models’ AUCs for the various TTR time frames. Wilcoxon signed rank tests showed that the imaging model had a significantly higher mean AUC than the clinical model (0.76 vs 0.68, respectively; p = .03). No significant differences in AUC were identified between the clinical and combined models or between the imaging and combined models (all p > .05). Table 2 and Figure 3 display a detailed evaluation of the models’ performances.
TABLE 2:
Performance Metrics of Models for Each Investigated Time Frame of HCC Recurrence
| Measure | Time Frame (y) | Mean ± SD | |||||
|---|---|---|---|---|---|---|---|
| 1 | 2 | 3 | 4 | 5 | 6 | ||
| No. of patients | 120 | 116 | 98 | 82 | 74 | 66 | |
| No. of patients with HCC recurrence | 12 | 26 | 36 | 40 | 43 | 44 | |
| Clinical model | |||||||
| AUCa | 0.68 (0.52–0.84) | 0.60 (0.47–0.73) | 0.67 (0.56–0.78) | 0.78 (0.68–0.88) | 0.63 (0.51–0.77) | 0.69 (0.54–0.84) | 0.68 ± 0.06 |
| Accuracyb | 0.77 | 0.79 | 0.56 | 0.68 | 0.66 | 0.73 | 0.70 ± 0.08 |
| F1 scoreb | 0.30 | 0.36 | 0.58 | 0.75 | 0.76 | 0.80 | 0.59 ± 0.22 |
| Recallb | 0.50 | 0.27 | 0.83 | 0.95 | 0.91 | 0.82 | 0.71 ± 0.27 |
| Precisionb | 0.21 | 0.54 | 0.45 | 0.61 | 0.65 | 0.78 | 0.54 ± 0.20 |
| Imaging model | |||||||
| AUCa | 0.71 (0.58–0.85) | 0.75 (0.64–0.86) | 0.71 (0.61–0.82) | 0.81 (0.71–0.90) | 0.75 (0.63–0.87) | 0.85 (0.75–0.95) | 0.76 ± 0.05 |
| Accuracyb | 0.58 | 0.81 | 0.67 | 0.76 | 0.76 | 0.79 | 0.73 ± 0.09 |
| F1 scoreb | 0.26 | 0.54 | 0.63 | 0.74 | 0.81 | 0.82 | 0.63 ± 0.21 |
| Recallb | 0.75 | 0.50 | 0.75 | 0.70 | 0.91 | 0.73 | 0.72 ± 0.13 |
| Precisionb | 0.16 | 0.59 | 0.54 | 0.78 | 0.74 | 0.94 | 0.62 ± 0.27 |
| Combined model | |||||||
| AUCa | 0.75 (0.62–0.89) | 0.72 (0.60–0.85) | 0.62 (0.51–0.73) | 0.86 (0.78–0.95) | 0.74 (0.61–0.86) | 0.86 (0.76–0.96) | 0.76 ± 0.09 |
| Accuracyb | 0.76 | 0.66 | 0.60 | 0.81 | 0.76 | 0.80 | 0.73 ± 0.08 |
| F1 scoreb | 0.33 | 0.49 | 0.53 | 0.83 | 0.81 | 0.83 | 0.64 ± 0.22 |
| Recallb | 0.58 | 0.73 | 0.61 | 0.95 | 0.91 | 0.73 | 0.75 ± 0.15 |
| Precisionb | 0.23 | 0.37 | 0.47 | 0.73 | 0.74 | 0.97 | 0.58 ± 0.28 |
Note—HCC = hepatocellular carcinoma.
The DeLong method was used to determine 95% CIs, which are shown in parentheses. The DeLong test for comparison of paired AUCs found no significant differences in performance between models.
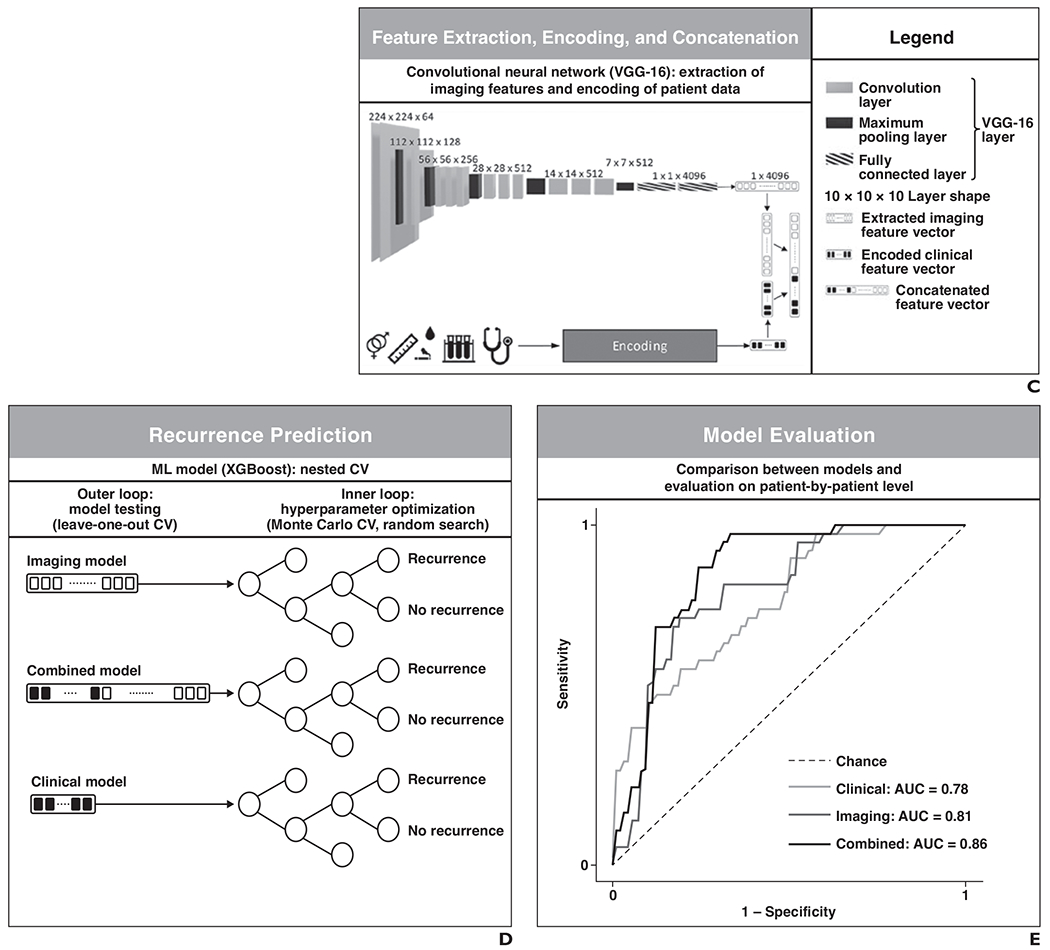
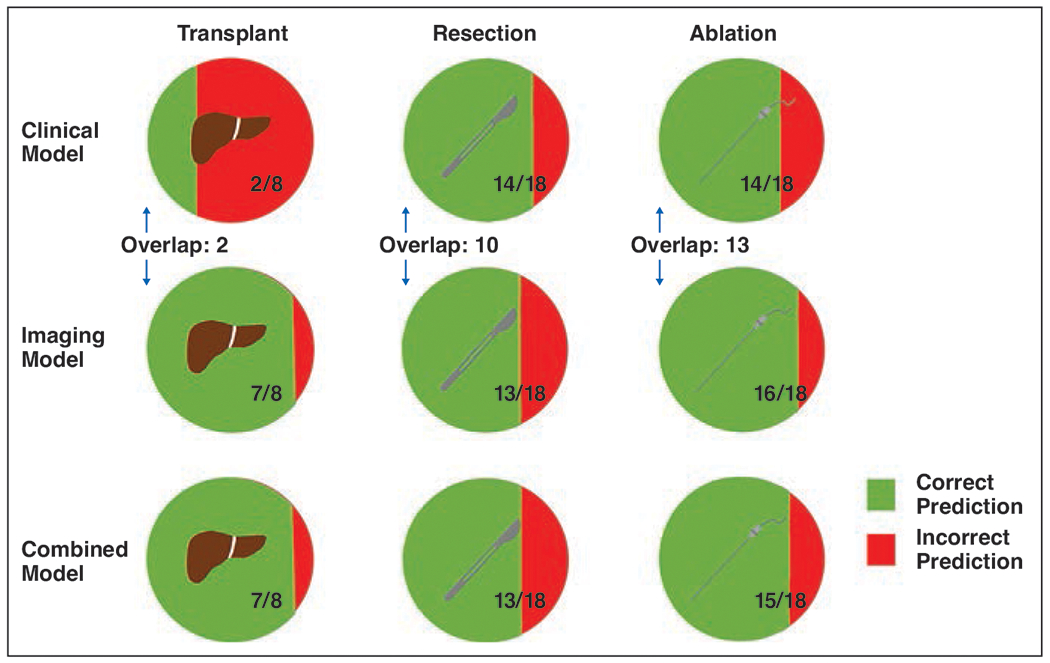
Fig. 3—

ROC curves show AUCs calculated for each model for comparison of performance at each of six time frames after treatment. A–F, Graphs show performance of three models for predicting recurrence at 1 (A), 2 (B), 3 (C), 4 (D), 5 (E), and 6 (F) years after treatment. True-positive rate is defined as follows: [sensitivity = TP / (TP + FN)], where TP is true-positive and FN is false-negative. False-positive rate is defined as follows: [1 – specificity = FP / (FP + TN)], where FP is false-positive, and TN is true-negative. Chance (dashed line) has AUC of 0.50, meaning that algorithm with performance less than or equal to AUC of dashed line would have no predictive value: higher AUC of algorithm, better its diagnostic ability.
Prediction of Time to Recurrence
The Kaplan-Meier curves for TTR among patients predicted by each model to be low or high risk, with corresponding p values comparing the two groups, are shown for early recurrence (defined as years 1 and 2 after treatment) in Figure S2 (available in the online supplement) and for late recurrence (years 3–6) in Figure S3 (available in the online supplement) [25]. Log rank tests revealed that the Kaplan-Meier curves were significantly different between the low-risk and high-risk groups for the clinical, imaging, and combined models for predicting 2-, 3-, 4-, 5-, and 6-year recurrence (all p < .05). The curves were not significantly different between the low-risk and high-risk groups for any model for predicting 1-year recurrence (all p > .05).
Evaluation of Model Predictions on a Patient-By-Patient Level
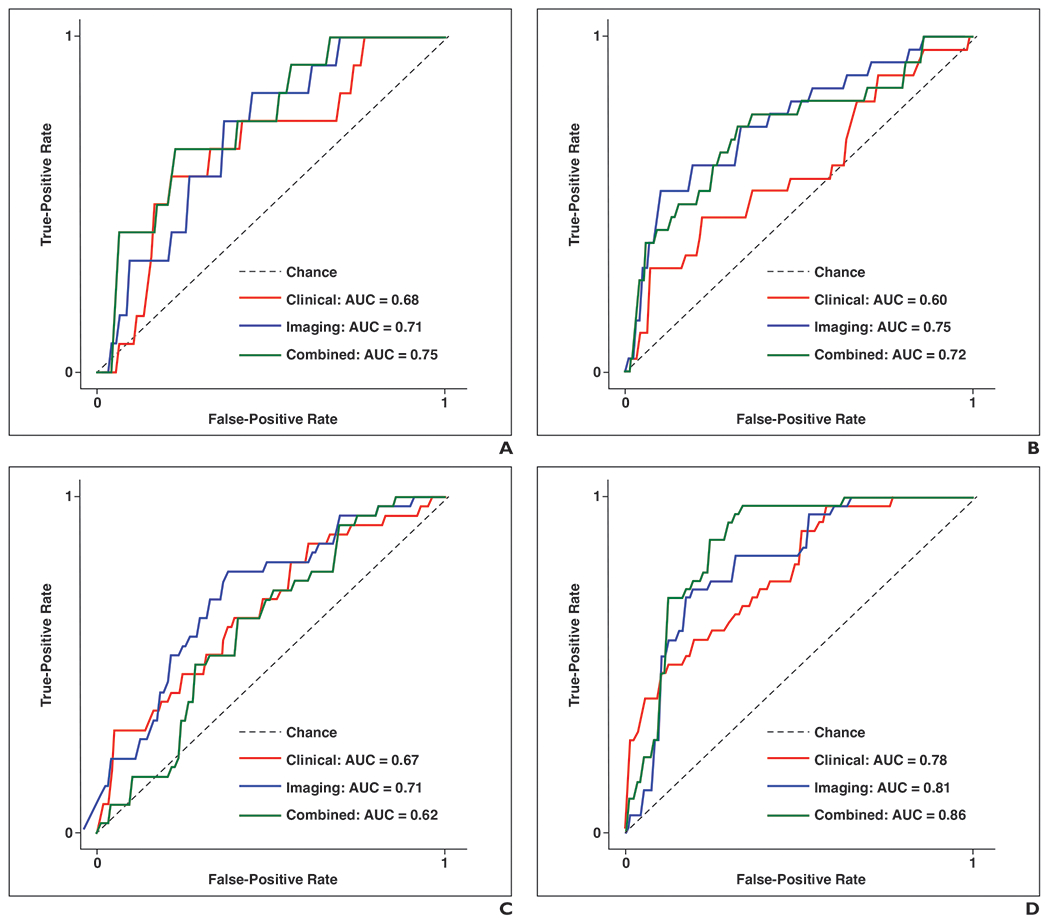
An evaluation of the models’ predictions on a patient-by-patient level is shown in Figure 4. Of the 18 patients with recurrence after resection, the clinical and imaging models correctly predicted recurrence in 14 (77.8%) and 13 (72.2%) patients, respectively. An overlap of the same 10 patients were correctly predicted as having recurrence by both models. The combined model correctly predicted recurrence in 13 of 18 (72.2%) patients. Of the 18 patients with recurrence after ablation, the clinical and imaging models correctly predicted recurrence in 14 (77.8%) and 16 (88.9%) patients, respectively. An overlap of the same 13 patients were correctly predicted as having recurrence by both models. The combined model correctly predicted recurrence in 15 of 18 (83.3%) patients. Of the eight patients with recurrence after liver transplant, the clinical and imaging models correctly predicted recurrence in two (25.0%) and seven (87.5%) patients, respectively. An overlap of the same two patients were correctly predicted as having recurrence by both models. The combined model correctly predicted recurrence in seven of eight (87.5%) patients.
Fig. 4—
Graphic shows comparison of model predictions in patients with recurrent tumor, stratified by treatment modality. Each row of circles corresponds to one of three models. Circles with liver icon (left column), scalpel icon (middle column), and needle icon (right column) represent patients treated by transplant, resection, and ablation, respectively. For fractions in each circle, denominator represents number of patients who had recurrent tumor within 6 years after treatment, and numerator represents number of those patients who were correctly predicted by model to have recurrent tumor. Overlap represents number of patients for given treatment modality for whom both clinical and imaging models correctly predicted recurrence.
Discussion
In this proof-of-concept study, we evaluated the use of ML to predict recurrence of early-stage HCC in patients initially eligible for liver transplant based on a model using clinical data available before treatment allocation, a model using DL-extracted data from pretreatment contrast-enhanced MRI sequences, and a combined model. Across six posttreatment time periods, the models predicted tumor recurrence with moderate-to-high AUC. The MRI data improved predictive performance over laboratory or clinical features alone, while the combined model did not improve performance over the imaging model alone. In Kaplan-Meier analysis for TTR, all models showed significant differences between patients predicted to be at low risk and those predicted to be at high risk in five of six posttreatment time frames. A patient-by-patient level analysis of patients who underwent transplant revealed that the model using imaging data alone correctly predicted more patients with recurrence than the model using clinical data alone. The findings suggest that MRI data contain useful predictive information that may help refine liver transplant criteria.
This work is novel in a variety of aspects. We used a pretrained CNN to automatically extract features from unstructured and essentially unannotated imaging data. This automatic feature extraction may be considered unbiased by human raters compared with approaches that use human annotation, opinion, or prior domain knowledge. In contrast, previous studies mainly focused on imaging features derived by human engineering (e.g., radiomics) and used specific annotations (e.g., segmentations of the liver or HCC) to train algorithms. Ji et al. [26], for example, used radiomics features from contrast-enhanced CT images to predict recurrence of early-stage HCC. The pretrained CNN in the current study was originally designed to classify native images, and the learned features represent the algorithm’s performance of this task. A transfer learning approach allowed leveraging of visual information that was already learned and that appeared to be common in native medical images. Representations of learned features often result in much better task-specific performance than manual or software-extracted features [27]. Thus, the automatically extracted MRI features would be expected to be more useful than human-engineered features for predicting recurrence.
Studies using clinical and laboratory values to predict recurrence have typically evaluated only a limited number of predictive markers at a time. Aside from AFP, potentially useful laboratory markers have low levels of supporting evidence [15]. Nonetheless, various laboratory parameters such as the neutrophil-to-lymphocyte ratio or the platelet-to-lymphocyte ratio have the potential to predict HCC recurrence [13]. In comparison with earlier works, the current study concurrently evaluated the predictive power of many clinical and laboratory features.
The clinical and imaging models predicted recurrence with AUCs across the six time frames ranging from 0.60 to 0.78 and from 0.71 to 0.85, respectively. The model based on imaging features had a significantly higher mean AUC than the model based on clinical features, but clinical features still had predictive performance. No statistically significant difference was observed between paired model AUCs at individual time points. The differences may not have been statistically significant because of the small cohort sizes and the high variances of the models’ AUCs at individual time points that led to overlapping 95% CIs of the AUCs. In addition, performance may not have been significantly different between the combined model and the imaging model because of high mutual information between the clinical and imaging features. Imaging-related information might have also predominated in the models due to the larger number of imaging features than clinical features (4096 vs 67). In Kaplan-Meier analysis for TTR, all models yielded significant differences between patients predicted to be at low and those predicted to be at high risk for all time frames except the 1st year after treatment. The statistical power to identify a difference in the 1st year may have been limited given the small number of patients with recurrence in the 1st year (n = 12) and the resulting imbalance with respect to the much larger number of patients without recurrence (n = 108). The patient-by-patient level evaluation of model predictions revealed similar predictiveness of the clinical and imaging models in patients who underwent thermal ablation and resection, although this evaluation showed a difference between these two models in patients who underwent transplant. In patients who underwent transplant, the clinical model correctly predicted 25.0% of recurrences, whereas the imaging and combined models correctly predicted 87.5% of recurrences, supporting an association between MRI data and HCC recurrence particularly in patients undergoing transplant.
The models’ ability to use MRI information to stratify patients as low or high risk for recurrence before therapy allocation may help satisfy an unmet need for biomarkers that reliably predict posttreatment outcome. The in-depth imaging-related information analyzed by the models may have additional utility with respect to existing transplant criteria, allowing criteria refinement and guiding the selection of eligible patients with HCC for transplant [28, 29]. Such ML-driven models may allow improved allocation of scarce donor organs to patients with disease that is less likely to progress and aid the design of personalized surveillance strategies, including optimization of timing of follow-up imaging to detect recurrence earlier [30]. This study’s assessment of the predictiveness of different feature sets on a patient-by-patient level is an approach that has been well investigated but may also facilitate personalized therapy decisions.
This study has limitations. First, this was a retrospective single-center study with a small sample size. Hence, we could not use a subset of the patients (e.g., 20% of patients) as an independent test set or expose the models to previously unseen data to test the generalizability of performance. For small datasets, nested CV is a reliable method to assign patients into training, validation, and testing partitions to evaluate the ML algorithm [31, 32]. Nested CV, when used for both hyperparameter optimization and evaluation, can reduce bias compared with regular k-fold CV and provides an almost unbiased estimate of the true error [31, 32]. Future studies with larger cohorts may yield different results, and external validation will be required to translate this study’s knowledge into practice. Second, the algorithms at present do not provide interpretable output and do not identify singular features according to the features’ weight in the model’s decision making. Third, the extracted imaging features are based on liver findings only, although other imaging-related information outside of the liver could potentially also predict recurrence. Fourth, the different MRI acquisition parameters introduced heterogeneity and may have biased the models. However, consensus statements for the design of CNNs strongly recommend a vendor-neutral approach to ensure the algorithm’s robustness. Fifth, the models were used to predict recurrences only in patients who had completely treated disease. This approach reflects a view that incomplete tumor response after ablation is an iatrogenic event (e.g., due to an insufficiently sized safety margin rather than a true reflection of tumor biology) and is therefore correctable and unpredictable at baseline. Finally, the overall recurrence rate in the cohort was 36.7%, in contrast to previously reported rates of up to 20% after transplant, reflecting inclusion of patients after resection and thermal ablation [7]. The inclusion criteria were intended to mirror clinical reality rather than apply rigid adherence to staging criteria, as not all patients eligible for transplant ultimately receive a liver due to various medical and social scenarios. These considerations may limit the theoretic value of any predictive model.
In conclusion, this study serves as proof-of-concept that ML-based models can predict recurrence of early-stage HCC in patients initially eligible for liver transplant. The use of MRI data as input parameters substantially improved predictive performance of the ML model over the use of baseline clinical parameters alone, with the combination of both clinical and MRI features providing limited added value. The findings therefore suggest that currently underused imaging properties may help design more reliable criteria for organ allocation and transplant eligibility. Multicenter prospective cohort studies are needed to externally validate such algorithms before clinical use.
Supplementary Material
HIGHLIGHTS.
Key Finding
Machine learning models can predict recurrence after treatment of early-stage HCC from pretreatment clinical data, MRI data, and both combined. Imaging data alone as model input yielded higher prediction performance than clinical data alone; combining both data types did not significantly improve performance over the use of imaging data alone.
Importance
The findings suggest that machine learning–based models applied to currently underutilized imaging features could benefit the organ allocation process.
Acknowledgments
Supported by the NIH/National Cancer Institute (grant R01CA206180) and the Rolf W. Günther Foundation for Radiological Sciences (travel grant to S. Iseke).
Footnotes
An electronic supplement is available online at doi.org/10.2214/AJR.22.28077.
The authors declare that there are no disclosures relevant to the subject matter of this article.
References
- 1.Llovet JM, Kelley RK, Villanueva A, et al. Hepatocellular carcinoma. Nat Rev Dis Primers 2021; 7:6. [DOI] [PubMed] [Google Scholar]
- 2.International Agency for Research on Cancer (IARC) website. Estimated age-standardized incidence rates (World) in 2020, liver, both sexes, all ages. gco.iarc.fr/today/online-analysis-map?v=2020&mode=population&mode_population=continents&population=900&populations=900&key=asr&sex=0&cancer=11&type=0&statistic=5&prevalence=0&population_groupearth&color_palette=default&map_scale=quantile&map_nb_colors=5&continent=0&rotate=%255B10%252C0%255D. Accessed October 22, 2021
- 3.Reig M, Forner A, Rimola J, et al. BCLC strategy for prognosis prediction and treatment recommendation: the 2022 update. J Hepatol 2022; 76:681–693 [DOI] [PMC free article] [PubMed] [Google Scholar]
- 4.Wu L, Swan P, McCall J, et al. Intention-to-treat analysis of liver transplantation, resection and thermal ablation for hepatocellular carcinoma in a single centre. HPB (Oxford) 2018; 20:966–976 [DOI] [PubMed] [Google Scholar]
- 5.Adam R, Karam V, Delvart V, et al. ; All Contributing Centers (www.eltr.org); European Liver and Intestine Transplant Association (ELITA). Evolution of indications and results of liver transplantation in Europe: a report from the European Liver Transplant Registry (ELTR). J Hepatol 2012; 57:675–688 [DOI] [PubMed] [Google Scholar]
- 6.Kwong A, Kim WR, Lake JR, et al. OPTN/SRTR 2018 annual data report: liver. Am J Transplant 2020; 20(suppl s1):193–299 [DOI] [PubMed] [Google Scholar]
- 7.Welker MW, Bechstein WO, Zeuzem S, Trojan J. Recurrent hepatocellular carcinoma after liver transplantation: an emerging clinical challenge. Transpl Int 2013; 26:109–118 [DOI] [PubMed] [Google Scholar]
- 8.Hollebecque A, Decaens T, Boleslawski E, et al. Natural history and therapeutic management of recurrent hepatocellular carcinoma after liver transplantation. Gastroenterol Clin Biol 2009; 33:361–369 [DOI] [PubMed] [Google Scholar]
- 9.Roberts JP. Tumor surveillance: what can and should be done? Screening for recurrence of hepatocellular carcinoma after liver transplantation. Liver Transpl 2005; 11(suppl 2):S45–S46 [DOI] [PubMed] [Google Scholar]
- 10.Mazzaferro V, Regalia E, Doci R, et al. Liver transplantation for the treatment of small hepatocellular carcinomas in patients with cirrhosis. N Engl J Med 1996; 334:693–699 [DOI] [PubMed] [Google Scholar]
- 11.Lee S, Kim KW, Jeong WK, et al. Gadoxetic acid-enhanced MRI as a predictor of recurrence of HCC after liver transplantation. Eur Radiol 2020; 30:987–995 [DOI] [PubMed] [Google Scholar]
- 12.Kim S, Shin J, Kim DY, Choi GH, Kim MJ, Choi JY. Radiomics on gadoxetic acid-enhanced magnetic resonance imaging for prediction of postoperative early and late recurrence of single hepatocellular carcinoma. Clin Cancer Res 2019; 25:3847–3855 [DOI] [PubMed] [Google Scholar]
- 13.Zheng J, Cai J, Li H, et al. Neutrophil to lymphocyte ratio and platelet to lymphocyte ratio as prognostic predictors for hepatocellular carcinoma patients with various treatments: a meta-analysis and systematic review. Cell Physiol Biochem 2017; 44:967–981 [DOI] [PubMed] [Google Scholar]
- 14.Hu B, Yang XR, Xu Y, et al. Systemic immune-inflammation index predicts prognosis of patients after curative resection for hepatocellular carcinoma. Clin Cancer Res 2014; 20:6212–6222 [DOI] [PubMed] [Google Scholar]
- 15.Pommergaard H-C, Burcharth J, Rosenberg J, Rasmussen A. Serologic and molecular biomarkers for recurrence of hepatocellular carcinoma after liver transplantation: a systematic review and meta-analysis. Transplant Rev (Orlando) 2016; 30:171–177 [DOI] [PubMed] [Google Scholar]
- 16.Kim AY, Sinn DH, Jeong WK, et al. Hepatobiliary MRI as novel selection criteria in liver transplantation for hepatocellular carcinoma. J Hepatol 2018; 68:1144–1152 [DOI] [PubMed] [Google Scholar]
- 17.Chartrand G, Cheng PM, Vorontsov E, et al. Deep learning: a primer for radiologists. RadioGraphics 2017; 37:2113–2131 [DOI] [PubMed] [Google Scholar]
- 18.Mehta N, Bhangui P, Yao FY, et al. Liver transplantation for hepatocellular carcinoma: working group report from the ILTS Transplant Oncology Consensus Conference. Transplantation 2020; 104:1136–1142 [DOI] [PubMed] [Google Scholar]
- 19.Chernyak V, Fowler KJ, Kamaya A, et al. Liver Imaging Reporting and Data System (LI-RADS) version 2018: imaging of hepatocellular carcinoma in at-risk patients. Radiology 2018; 289:816–830 [DOI] [PMC free article] [PubMed] [Google Scholar]
- 20.Fedorov A, Beichel R, Kalpathy-Cramer J, et al. 3D Slicer as an image computing platform for the Quantitative Imaging Network. Magn Reson Imaging 2012; 30:1323–1341 [DOI] [PMC free article] [PubMed] [Google Scholar]
- 21.Simonyan K, Zisserman A. Very deep convolutional networks for large-scale image recognition. arXiv website. arxiv.org/abs/1409.1556. Published September 4, 2014. Accessed April 20, 2020 [Google Scholar]
- 22.Abadi M, Agarwal A, Barham P, et al. TensorFlow: large-scale machine learning on heterogeneous distributed systems—preliminary white paper, November 9, 2015. TensorFlow website. download.tensorflow.org/paper/whitepaper2015.pdf. Accessed April 20, 2020 [Google Scholar]
- 23.Russakovsky O, Deng J, Su H, et al. ImageNet large scale visual recognition challenge. arXiv website. arxiv.org/abs/1409.0575. Published September 1, 2014. Accessed April 20, 2020 [Google Scholar]
- 24.Chen T, Guestrin C. XGBoost: a scalable tree boosting system. arXiv website. arxiv.org/abs/1603.02754. Published March 9, 2016. Accessed April 22, 2020 [Google Scholar]
- 25.El-Domiaty N, Saliba F, Vibert E, et al. Early versus late hepatocellular carcinoma recurrence after transplantation: predictive factors, patterns, and long-term outcome. Transplantation 2021; 105:1778–1790 [DOI] [PubMed] [Google Scholar]
- 26.Ji GW, Zhu FP, Xu Q, et al. Radiomic features at contrast-enhanced CT predict recurrence in early stage hepatocellular carcinoma: a multi-institutional study. Radiology 2020; 294:568–579 [DOI] [PubMed] [Google Scholar]
- 27.Bengio Y, Goodfellow I, Courville A. Deep learning. MIT Press, 2017 [Google Scholar]
- 28.Batra RK. Utility of liver transplantation within the bounds of non-futility. Curr Transplant Rep 2020; 7:187–193 [Google Scholar]
- 29.He T, Fong JN, Moore LW, et al. An imageomics and multi-network based deep learning model for risk assessment of liver transplantation for hepatocellular cancer. Comput Med Imaging Graph 2021; 89:101894. [DOI] [PMC free article] [PubMed] [Google Scholar]
- 30.Lee DD, Sapisochin G, Mehta N, et al. Surveillance for HCC after liver transplantation: increased monitoring may yield aggressive treatment options and improved postrecurrence survival. Transplantation 2020; 104:2105–2112 [DOI] [PubMed] [Google Scholar]
- 31.Raschka S. Model evaluation, model selection, and algorithm selection in machine learning. arXiv website. arxiv.org/abs/1811.12808. Published November 13, 2018. Accessed April 23, 2020
- 32.Varma S, Simon R. Bias in error estimation when using cross-validation for model selection. BMC Bioinformatics 2006; 7:91. [DOI] [PMC free article] [PubMed] [Google Scholar]
- 33.Youden WJ Index for rating diagnostic tests. Cancer 1950; 3:32–35 [DOI] [PubMed] [Google Scholar]
- 34.Ruopp MD, Perkins NJ, Whitcomb BW, Schisterman EF. Youden index and optimal cut-point estimated from observations affected by a lower limit of detection. Biom J 2008; 50:419–430 [DOI] [PMC free article] [PubMed] [Google Scholar]
Associated Data
This section collects any data citations, data availability statements, or supplementary materials included in this article.