Figure 1.


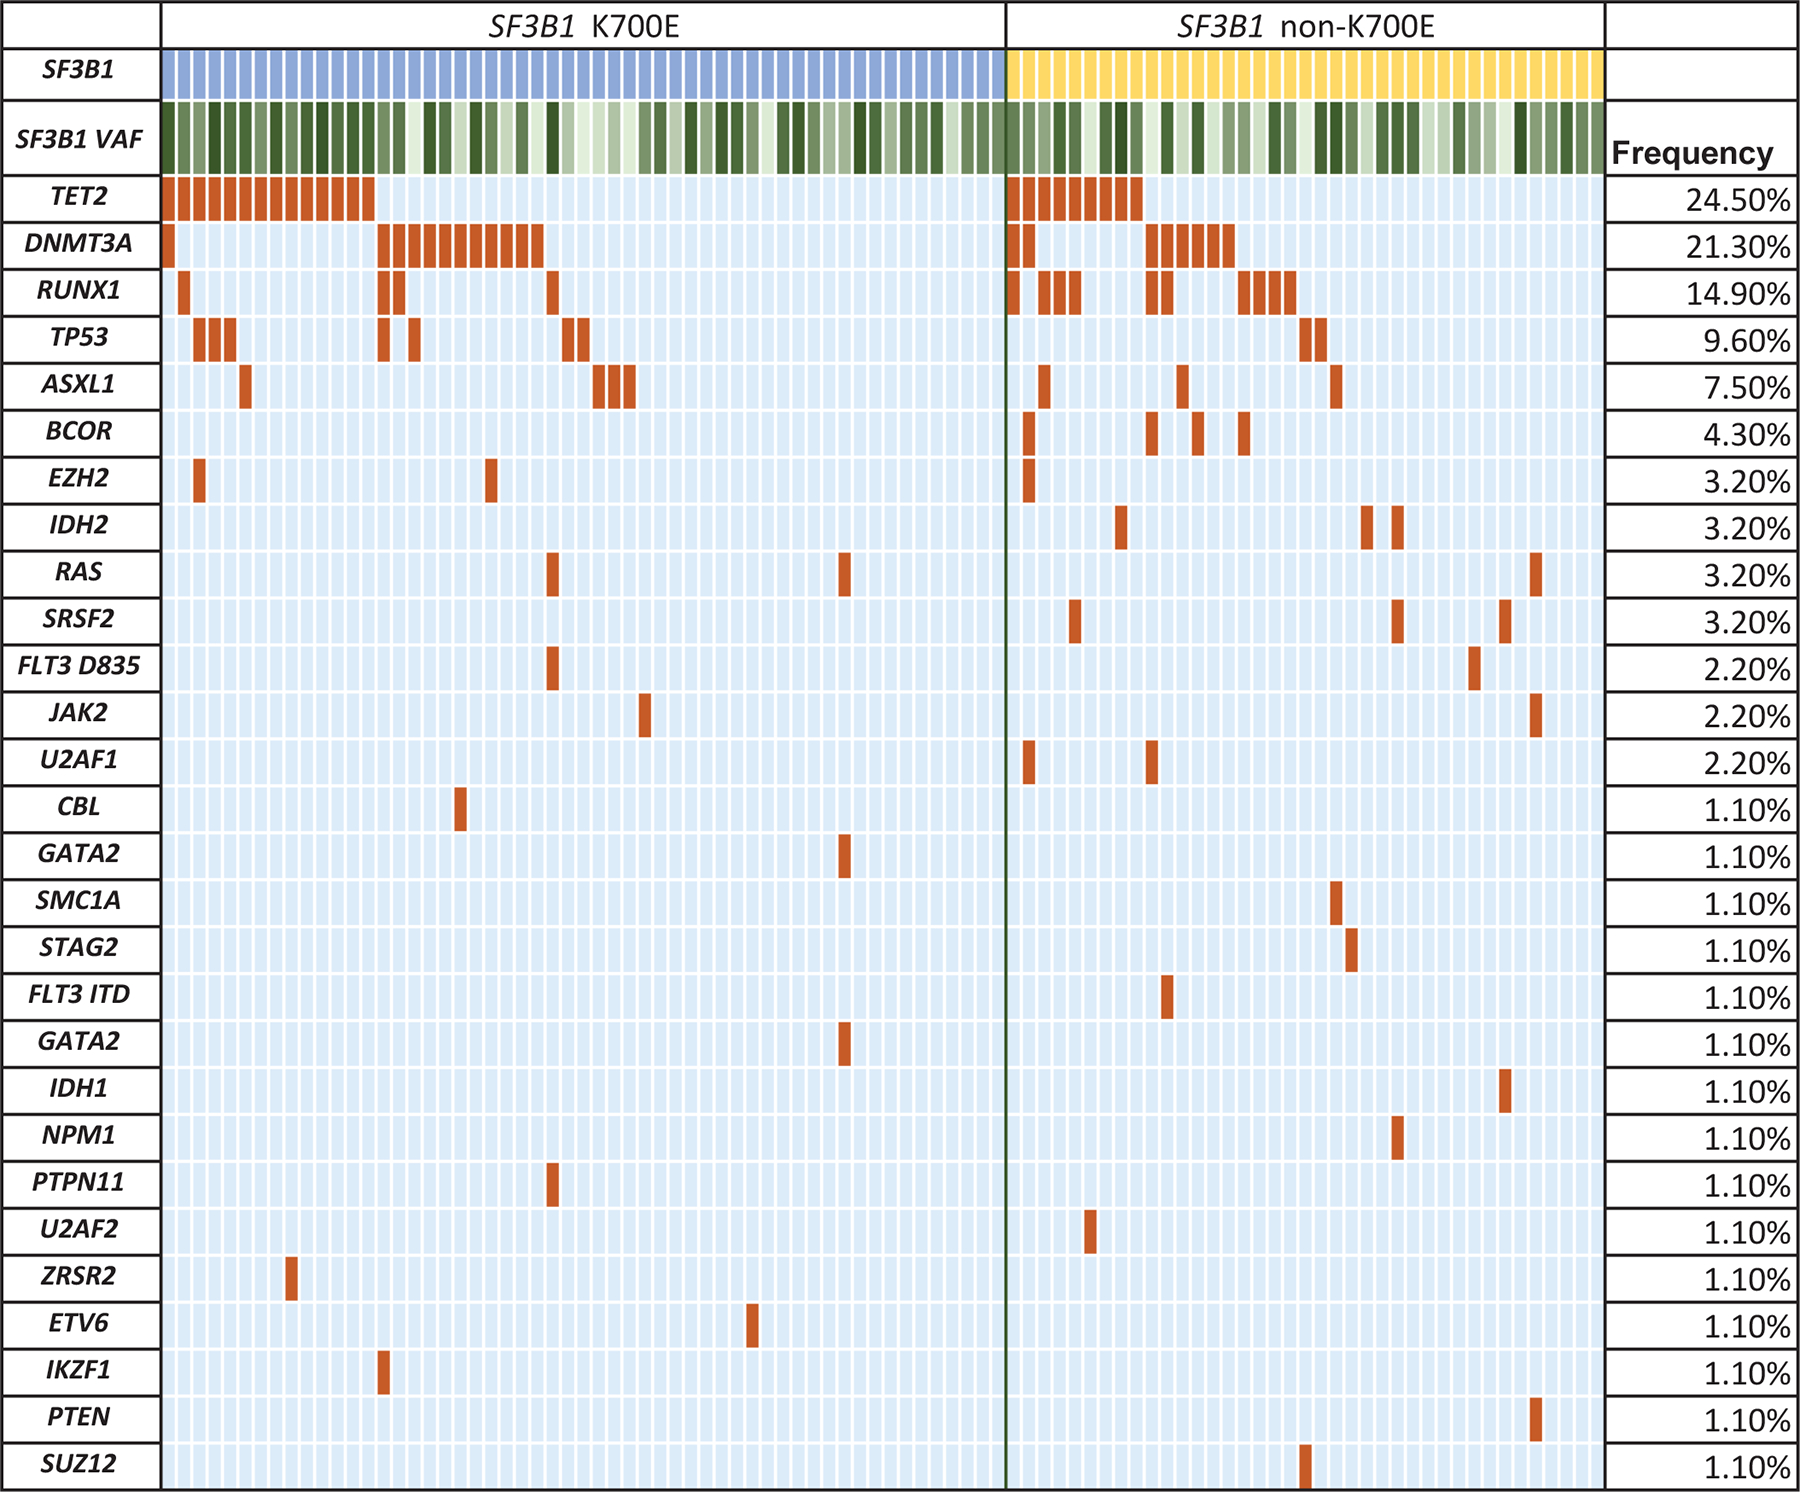
Mutational characteristics. (A) Spectrum of SF3B1 mutations within the coding region of the gene seen in the study group generated using MutationMapper from cbioportal. About ~60% of mutations involved the hotspot K700E, while ~40% involved the non-K700E regions. (B) Mutational landscape of SF3B1 K700E mutated MDS. Comutation plot of 94 SF3B1 mutated MDS patients showing nonsynonymous gene mutations (left), separated by the mutation subtype: K700E (blue) and non-K700E (yellow). Each column represents a patient, and mutations are represented by color. The frequency of gene mutations is shown on the right. Color code: Maroon indicates mutation while blue indicates wild-type. Variant allele frequency of SF3B1 is represented as a color gradient, darker color corresponding to higher VAF.
