

Abstract
We studied the longitudinal effects of approximately 6 months of spaceflight on brain activity and task-based connectivity during a spatial working memory (SWM) task. We further investigated whether any brain changes correlated with changes in SWM performance from pre- to post-flight. Brain activity was measured using functional magnetic resonance imaging while astronauts (n = 15) performed a SWM task. Data were collected twice pre-flight and 4 times post-flight. No significant effects on SWM performance or brain activity were found due to spaceflight; however, significant pre- to post-flight changes in brain connectivity were evident. Superior occipital gyrus showed pre- to post-flight reductions in task-based connectivity with the rest of the brain. There was also decreased connectivity between the left middle occipital gyrus and the left parahippocampal gyrus, left cerebellum, and left lateral occipital cortex during SWM performance. These results may reflect increased visual network modularity with spaceflight. Further, increased visual and visuomotor connectivity were correlated with improved SWM performance from pre- to post-flight, while decreased visual and visual-frontal cortical connectivity were associated with poorer performance post-flight. These results suggest that while SWM performance remains consistent from pre- to post-flight, underlying changes in connectivity among supporting networks suggest both disruptive and compensatory alterations due to spaceflight.
Keywords: cognition, spatial working memory, microgravity, functional connectivity, functional MRI (fMRI)
Introduction
Astronauts aboard the International Space Station (ISS) experience environmental challenges including microgravity, radiation, elevated CO2, as well as psychological stressors such as fatigue, sleep deprivation, and isolation (De la Torre 2014). According to a recent qualitative review of relevant studies, the impact of microgravity on higher cognition of astronauts appears to have no major effects (Mammarella 2020). However, more research is needed due to varying methodology, the multiple domains of cognition under study, and the small populations of relevant participants. Furthermore, the combination of environmental and physiological factors characteristic of space flight may cause deficits in cognitive performance such as spatial disorientation, reduced attention, and concentration (Kanas and Manzey 2008; De la Torre 2014; Clement et al. 2020).
With a rising interest in spaceflight missions, several studies have investigated the effects of spaceflight on cognition and sensorimotor performance. For example, crewmembers show declines in their ability to perform cognitive and motor dual-tasking in-flight (Manzey et al. 1995; Manzey and Lorenz 1998). These studies suggest that motor performance is more cognitively demanding in microgravity. Dual-tasking deficits in astronauts have also been identified while they performed a tracking task by responding and entering numerical codes with their nondominant hand (Moore et al. 2019). A single-subject case study reported decreased accuracy in a visual object learning task, reduced abstract shape matching, and slower cognitive speed for several measures of the National Aeronautics and Space Administration (NASA) cognitive battery in-flight (Garrett-Bakelman et al. 2019). Similarly, five male astronauts were slower and more error-prone during visuospatial task during spaceflight than on Earth (Takacs et al. 2021). In a recent study, we did not observe cognitive performance changes with spaceflight (Tays et al. 2021).
Spatial orientation, mental rotation, and short-term recognition are cognitive abilities that contribute to performance on spatial working memory (SWM) tasks that require a person to imagine how an object would appear if it was rotated away from the presented orientation (Shepard and Metzler 1971). While in space, astronauts use SWM strategies to facilitate the recognition of objects that may appear in varying orientations, and other astronauts’ gestures. Therefore, SWM performance is essential for many aspects of crewmember performance. We have recently reported longitudinal effects of head down tilt bed rest (HDBR) combined with elevated levels of CO2 on SWM performance and associated changes in brain activity (Salazar et al. 2020). While no changes in SWM performance were evident, 30 days of HDBR combined with elevated CO2 was associated with decreasing activation in the right middle frontal gyrus and the cerebellar dentate nucleus during task performance (Salazar et al. 2020). These brain regions are thought to contribute to attention, mental rotation, and reorientation (Thurling et al. 2012; Japee et al. 2015), functions critical for the SWM task.
HDBR is an established spaceflight analog that has also been shown to impact cognitive performance, with extended isolation worsening spatial cognition (Stahn et al. 2019) and resulting in slowed cognitive performance (Basner et al. 2021; Mahadevan et al. 2021). This analog environment has also resulted in spatial orientation changes (Moore et al. 2010), upward brain shift within the cranium (Koppelmans, Bloomberg, et al. 2017a), and intracranial fluid redistribution (Koppelmans, Pasternak, et al. 2017b) similar to those that occur after spaceflight (Roberts et al. 2017; Lee, Koppelmans, et al. 2019b; Jillings et al. 2020). However, whether or how different domains of cognitive function are impacted by spaceflight remains unclear.
Spaceflight is associated with altered sensory inputs (Cheron et al. 2006; Cebolla et al. 2016), changes in cognitive and sensorimotor processes (Bock et al. 2010), and modifications of brain structure (e.g. (Roberts et al. 2017; Koppelmans, Bloomberg, et al. 2017a; Lee, Koppelmans, et al. 2019b; Hupfeld et al. 2020; Jillings et al. 2020; Doroshin et al. 2022) and brain function (Pechenkova et al. 2019; Hupfeld et al. 2022), though only limited prior work has examined changes in cognition or brain function with spaceflight and analogs. For example, Pechenkova et al. (2019) reported no changes in brain activity during plantar stimulation in cosmonauts from before to after long-duration spaceflight; however, they did find pre- to post-flight changes in task-based brain connectivity during foot sole tactile stimulation that mimicked walking patterns. Specifically, they reported that the right posterior supramarginal gyrus (a somatosensory tactile processing region) showed increased connectivity with the rest of the brain while the left and right insular cortices increased their connectivity with each other. The authors also described reduced connectivity among cerebellar, parietal, and vestibular nuclei regions. Our group has recently reported reduced deactivation of somatosensory and visual cortices during vestibular stimulation from pre- to post-flight (Hupfeld et al. 2022). That is, we found that these regions were “upweighted” during vestibular stimulation following spaceflight. Crewmembers who showed greater activity changes in these brain regions also exhibited less post-flight balance declines. Furthermore, findings from EEG studies in-flight and pre- to post-flight suggest sensory reweighting and sensory gating, with increasing reliance on somatosensory processes (Cheron et al. 2006; Cebolla et al. 2016). In combination, these results support that vestibular brain activation and connectivity might be reduced with spaceflight, whereas activity appears to increase in somatosensory and visual cortices (McGregor et al. 2021b). It is not clear whether similar patterns would be observed for brain activity and connectivity during cognitive task performance, as these prior studies recorded functional brain activity either while participants were at rest or receiving sensory stimulation.
Even if cognitive performance is not measurably altered by spaceflight, the brain networks engaged for a given task may show functional changes, potentially in a compensatory fashion (cf. (Hupfeld et al. 2020; Hupfeld et al. 2021). To our knowledge, just a couple of studies have investigated changes in the neural correlates of cognitive processing with spaceflight (Cheron et al. 2014; Takacs et al. 2021). However, the present study is the first to use functional magnetic resonance imaging (MRI) to study the effects of long-duration spaceflight on the neural correlates of SWM performance in astronauts. We addressed 3 aims: (i) to investigate the longitudinal effects of long-duration spaceflight on brain activity during SWM task performance, (ii) to determine whether spaceflight impacts task-based functional connectivity during SWM task performance, and (iii) to determine whether any changes in brain function and connectivity correlate with changes in SWM performance.
Materials and methods
Participants and testing timeline
Fifteen astronauts participated in this study. They were tested at 6 different time points: twice before spaceflight (Launch (L)-180, L-60 days) and 4 times after return (R) to Earth (R + 4, R + 30, R + 90, and R + 180 days) as shown in Fig. 1. The actual R + 4 test date varied slightly across participants; the time between landing and the R + 4 test date was used as a covariate in statistical analyses. Demographic characteristics are depicted in Table 1. The NASA, University of Michigan, and University of Florida Institutional Review Boards approved all procedures, and all astronauts provided written informed consent prior to participation.
Fig. 1.

Testing timeline. At each indicated time point, astronauts completed the SWM task during an fMRI scan, as well as the card rotation and cube rotation tasks (outside of the MRI scanner).
Table 1.
Demographics.
| Sample size | Sex | Age | Mission duration (days) | Experienced flyers |
|---|---|---|---|---|
| 15 | 27% F | 47.5 ± 6.3 | 190.7 ± 57 | 40% |
Note. Values are reported in mean and standard deviation (±). For sex and previous flight experience, we report the percentage of participants. We consider experience flyers those astronauts who had completed at least one previous flight. F, female.
SWM behavioral tasks
Similar to our past work using a spaceflight analog environment (Salazar et al. 2020), we used 3 different working memory tasks to assess astronaut’s SWM performance. Each task is detailed below.
SWM task during fMRI
This task was performed during each of the 6 MRI sessions (fMRI collection). First, astronauts were instructed to view and memorize a 3-target set of dots for 500 ms. Next, they saw a blank screen for 3,000 ms (retention interval). During the retention interval, they were instructed to mentally “connect the dots” and rotate the shape by 30° clockwise. Participants then decided whether a subsequently presented probe set of open circles matched the configuration of the target set they had mentally rotated and made a button press response. This task comprised 2 runs each consisting of 30 trials (Reuter-Lorenz et al. 2000; Anguera et al. 2010).
Astronauts also performed a SWM control task that involved the presentation of the same 3 solid circles for 500 ms, followed by a brief interval (200 ms), and then presentation of a single open circle for 2,500 ms. Participants determined whether the single open circle spatial location matched that of a previously observed dot and made a button press response. This control task consisted of one run with 40 trials. The control task thus encompassed all the processes of the SWM task, except for the retention and mental rotation components (Reuter-Lorenz et al. 2000; Anguera et al. 2010).
Card rotation
During each of the 6 testing sessions, astronauts also performed Thurstone’s 2D card rotation test (Ekstrom et al. 1976) outside of the MRI scanner. This task consists of a 2-dimensional drawing of a card with an abstract shape at the beginning of a row followed by 8 drawings of the same card that were either only rotated or both rotated and mirrored. Participants were instructed to check an “S” box when the cards matched the initial drawing (S = same, i.e. only rotated in 2D space) or a “D” box when the cards were different (D = different, i.e. mirrored rather than rotated).
Cube rotation
Similar to card rotation, the cube rotation task was performed outside of the MRI scanner and during each of the 6 testing sessions. During this task, a 3-dimensional cube assemblage was presented on a computer screen for 3,000 ms, followed by a blank screen for 2,000 ms, and then 2 cube images. One of the 2 cube images shown was a 3-dimensional rotated match to the target and the other was a new cube assemblage (Shepard and Metzler 1988). By pressing a left or right button, participants indicated which cube image matched the initial target image.
fMRI acquisition parameters
Functional MRI images were acquired on a 3 Tesla Siemens Magnetom Verio MRI scanner at the University of Texas Medical Branch at Victory Lakes. fMRI images were collected using a gradient echo T2*-weighted echo-planar imaging sequence with the following parameters: repetition time (TR) = 3,660 ms, echo time (TE) = 39 ms, flip angle = 90°, matrix = 94 × 94, slice thickness = 4 mm, slice gap = 1 mm, voxel size = 2.66 × 2.66 × 5 mm3, 36 slices. Fifty-two volumes were collected during the SWM and 67 volumes for SWM control runs. We also collected T1-weighted scans: magnetization-prepared rapid gradient-echo sequence, TR = 1900 ms, TE = 2.32 ms, flip angle = 9°, slice thickness = 0.9 mm, 176 slices, matrix = 512 × 512, and voxel size = 0.489 × 0.489 × 0.9 = 0.2152 mm3.
fMRI preprocessing
Whole brain
fMRI preprocessing steps are similar to our previous work (Hupfeld et al. 2019; Salazar et al. 2020; Mahadevan et al. 2021; Salazar et al. 2021; McGregor et al. 2021a). Preprocessing and data analyses were performed using the Statistical Parametric Mapping 12 software (SPM12; www.fil.ion.ucl.ac.uk/spm) and the CONN Functional Connectivity Toolbox version 20.b (Whitfield-Gabrieli and Nieto-Castanon 2012) implemented in Matlab 2018b. Preprocessing steps included slice timing correction, realignment, and reslicing to correct for volume-to-volume head motion. We also performed an additional quality check using the Artifact Detection Tool (ART, www.nitrc.org/projects/artifact_detect/). Within each run, a volume was considered an outlier (and covaried out) if the participant’s composite movement was equal to or greater than 0.9 mm and/or if the global mean intensity of the volume was equal to or greater than 5 standard deviations from the mean image intensity of the run (Whitfield-Gabrieli and Nieto-Castanon 2012).
Whole-brain fMRI images were normalized to Montreal Neurologic Institute 152 (MNI152) standard space using Advanced Normalization Tools (ANTs) (Avants et al. 2011) in a multi-step procedure: (i) the T1 images were skull stripped using ImCalc (SPM12); (ii) participant-specific T1 templates were created using ANTs’ AntsMultivariateTemplateConstuction.sh function; (iii) participant-specific mean fMRI templates (again using ANTs’ AntsMultivariateTemplateConstuction.sh function) were created; (iv) the mean fMRI templates were coregistered to the T1 participant-specific templates using AntsRegistration.sh with rigid and affine registration; (v) the T1 templates were normalized to MNI152 standard space using ANTs’ AntsRegistration.sh with rigid, affine, and SyN registration; (vi) we concatenated these warps into a single flowfield using AntsApplyTransforms.sh (preprocessed fMRI native space image to functional template; functional template to structural template; structural template to MNI space); (vii) the resulting warp parameters were applied to each fMRI run to normalize the functional images to standard space (MNI) in one step. After normalization to MNI space, the voxel size was 2 × 2 × 2 mm3; (viii) finally, the normalized fMRI images were spatially smoothed with a 5-mm full-width half-maximum Gaussian kernel.
Cerebellum
Similar to our past work, we applied specialized preprocessing steps to the cerebellum (Hupfeld et al. 2019; Salazar et al. 2020; McGregor et al. 2021a). These separate steps were done to improve the normalization of the cerebellum (Diedrichsen 2006; Diedrichsen et al. 2009). The following steps were performed: (i) to isolate the cerebellum from the whole brain we entered the T1 participant-specific templates into the CEREbellum Segmentation (CERES) pipeline (Romero et al. 2017); (ii) a binary mask from each subject’s CERES cerebellar segmentation was created; (iii) we masked their whole-brain structural template to extract the cerebellum; and (iv) we used antsRegistration.sh with rigid, affine, and SyN registration to warp the extracted cerebellum to the Spatially Unbiased Infratentorial Template (SUIT). SUIT offers greater detail of internal cerebellar structures compared to the whole-brain MNI template, which improves normalization of functional images (Diedrichsen 2006; Diedrichsen et al. 2009). We used a version of the SUIT template with the brainstem removed, as the CERES cerebellar segmentation does not include the brainstem; (v) we warped the brain native space slice timing corrected, realigned, unwarped, and resliced (but not normalized to MNI space) image to the T1 template space; (vi) we masked these whole-brain images in T1 template space by each subject’s CERES cerebellar mask to extract the cerebellum. (vii) We then applied the previously calculated warp to bring these cerebellar time series to SUIT space. After normalization to SUIT space, the voxel size was 2 × 2 × 2 mm3; Finally, (viii) we smoothed the cerebellar data using a 5 mm full-width at half-maximum 3-dimensional Gaussian kernel.
Subject-level statistical analyses were calculated in 3 ways: task-based activity (standard fMRI analyses) in the (i) whole brain and (ii) cerebellum, as well as (iii) task-based brain connectivity. Brain activity was calculated for each participant on a voxel-by-voxel basis for the contrast SWM > SWM control.
fMRI group-level statistical analyses
For each of the statistical models described below, we interpreted only clusters that were larger than 10 voxels for the whole-brain analyses and larger than 5 voxels for the cerebellar analyses. For all analyses, we used the contrast SWM > SWM control. We included mean-centered age, sex, flight duration, and the time between landing and the R + 4 test date as covariates of no interest.
Main effect of SWM
To verify that our SWM task elicited the expected patterns of brain activity, we calculated the main effect (contrasting SWM > SWM control) across all subjects and all sessions thresholded at P < 0.0001 (uncorrected). We used the Sandwich Estimator (SwE) SPM toolbox defaults except for nonparametric wild bootstrap with 999 bootstraps and threshold-free cluster enhancement (TFCE; (Smith and Nichols 2009) to calculate the main effect for the SWM task. TFCE is more sensitive compared to other thresholding methods and does not require an arbitrary cluster-forming threshold (Smith and Nichols 2009). These results are uncorrected, as they do not address our main experimental question but rather provide a sanity check that our SWM task elicited the expected neural response.
Longitudinal changes in the neural correlates of SWM with spaceflight
To test for longitudinal changes in brain activity with spaceflight, we used 2 a priori hypothesized longitudinal contrasts incorporating all 6 time points. These contrast weights tested for brain regions showing stable activity across the 2 pre-flight time points followed by either an increase or a decrease post-flight and then a gradual recovery (a reversal of changes that occurred with flight) to baseline levels during the following months post-flight. These longitudinal models are similar to those used in our previous spaceflight and spaceflight analog fMRI studies (Yuan et al. 2018; Hupfeld et al. 2019; Salazar et al. 2020; McGregor et al. 2021a). For these longitudinal analyses, we assumed independence between subjects and equal variances between and within subjects. We used the SwE toolbox with the TFCE method described above and set statistical significance at peak-level false discovery rate (FDR) <0.05 to correct for multiple comparisons.
Pre- to post-flight changes in brain–behavior correlations
To test for correlations between pre- to post-flight brain changes and pre- to post-flight changes in performance on the SWM, card rotation, and cube rotation tasks, we used the Statistical Non-Parametric Mapping (SnPM version 13; http://warwick.ac.uk/snpm) toolbox. We ran nonparametric permutation tests with 15,000 permutations, variance smoothing = 5 mm kernel for whole-brain analyses and 2 mm kernel for cerebellar analyses. For these analyses, we used a nonparametric threshold of P < 0.05 (FDR corrected).
Task-based connectivity
Preprocessing
We used the CONN Functional Connectivity Toolbox version 20.b (Whitfield-Gabrieli and Nieto-Castanon 2012) for the task-based connectivity preprocessing and statistical analyses. CONN standard procedures were applied to the preprocessed data to account for residual motion artifacts and physiological noise. ART generated a “scrubbing” regressor identifying outlier volumes using the same approach mentioned above (Section 2.3.1.1), i.e. at each run, acquisitions with framewise displacement above 0.9 mm or global blood oxygenation level-dependent (BOLD) signal changes greater than 5 standard deviations were considered as outliers. This agrees with the intermediate default motion thresholds in the CONN toolbox. First, each preprocessed run was denoised by regressing out the confounding effects of head motion (i.e. 6 head motion parameters and their first-order temporal derivatives) and a “scrubbing” regressor, which modeled outlier volumes within the run. The main BOLD signal effects of SWM task and SWM control task were regressed out to restrict the analysis to within-condition connectivity rather than global changes of the correlation evoked by the task onset or offset. We applied linear detrending, and residuals were high-pass filtered using a 0.008 Hz cutoff prior to subject-level analyses. We used 2 approaches for the task-based functional connectivity analysis: data-driven (voxel-to-voxel) and hypothesis-driven (seed-to-voxel and ROI-to-ROI).
Voxel-to-voxel analyses
To obtain the intrinsic connectivity contrast (ICC) values for each voxel in the whole brain, voxel-to-voxel analysis was conducted. ICC was computed as the mean absolute value of the correlations of the time series for a given voxel with all other voxels included in the analysis (Martuzzi et al. 2011). The ICC values for each participant and condition (SWM and SWM control) were used as a between-subjects factor. Testing session (post-flight, pre-flight) was used as a within-subject factor. Results were considered statistically significant at a cluster-level threshold of P < 0.05 (2-tailed), FDR-corrected for multiple comparisons.
Seed-to-voxel analyses
Whole-brain seed-to-voxel analyses were performed using as seeds the regions of interest (ROIs) that demonstrated significant activation effects for the SWM task (i.e. SWM > SWM control) averaged across the 2 baseline time points (L-180, L-60) (i.e. those regions which showed significant activation during the SWM task compared to the control task during the 2 baseline time points). This resulted in 5 seed regions: the left middle occipital gyrus, the right superior occipital gyrus, right inferior occipital gyrus, right inferior frontal gyrus, and right inferior frontal gyrus triangularis portion (Table 2).
Table 2.
ROIs showing activation during baseline and used for seed-to-voxel analyses.
| Extent (k) | MNI coordinates (mm) | |||
|---|---|---|---|---|
| x | y | z | ||
| Frontal | ||||
| R IFG | 114 | 48 | 6 | 24 |
| R IFG (p. triangularis) | 61 | 46 | 34 | 10 |
| Occipital | ||||
| R inferior occipital gyrus | 537 | 38 | −86 | −2 |
| L middle occipital gyrus | 421 | −34 | −88 | 4 |
| R superior occipital gyrus | 67 | 26 | −68 | 34 |
Note. Cortical regions labeled using the AnatomyToolbox atlas via the SPM toolbox BSPMview. L, left; R, right.
In each seed-to-voxel analysis, we used the general psychophysiological interaction model (gPPI) connectivity data computed between the seed region and every brain voxel outside the seed region. The resulting connectivity maps were entered into the second level using a between-subject factor, session (post-flight vs. pre-flight) as a within-subject factor, and mean-centered age, sex, flight duration, and time between landing and the R + 4 test date (as the actual day varied slightly across participants) as covariates of no interest. Identical to the voxel-to-voxel analyses, results were considered statistically significant at a cluster-level threshold of P < 0.05 (two-tailed), corrected for multiple comparisons according to the FDR method, and for the total number of seed-to-voxel analyses (P < 0.05/5 = 0.01).
ROI-to-ROI analysis
An ROI-to-ROI analysis was adopted to test for the possible effects of long-duration spaceflight on networking connectivity related to SWM. We included the same 5 clusters used as seeds in the seed-to-voxel analyses (Table 2). The signal from each ROI was extracted from the gray matter voxels of the unsmoothed functional volumes, to avoid contaminating the data with white matter or CSF signals or with signals from other ROIs. Then, the task modulation of the ROI-to-ROI functional connectivity was assessed for the pre-flight and the post-flight sessions with the individual gPPI (McLaren et al. 2012) for each participant. ROI-to-ROI connectivity values were entered into the second level model using session (post-flight vs. pre-flight) as a within-subject factor, and mean-centered age, sex, flight duration, and time between landing and the R + 4 test date as covariates of no interest. As in the other connectivity analyses, results were considered statistically significant at a cluster-level threshold of P < 0.05 (2-tailed), corrected for multiple comparisons according to the FDR method.
Results
SWM behavioral results
We previously reported the effects of spaceflight on SWM performance in this cohort of astronauts (Tays et al. 2021). Linear mixed effects models revealed no statistically significant effects of spaceflight on accuracy of the SWM (β = 0.101; P = 0.882), card rotation (β = −0.804; P = 0.512), or cube rotation (β = 0.601; P = 0.472) tasks. We only observed practice effects for cube rotation response time, with faster responses post-flight compared to pre-flight (β = −0.673; P = 0.004) (Tays et al. 2021).
Main effect of SWM on brain activation
The main effect of the SWM task contrasted to the control task resulted in activation within expected brain regions consistent with prior studies of SWM (Reuter-Lorenz et al. 2000; Anguera et al. 2010; Salazar et al. 2020). Specifically, we observed bilateral activation in several frontal (i.e. right and left inferior frontal gyri), parietal (i.e. right superior parietal lobe, left inferior parietal lobule, right and left postcentral gyri), temporal (i.e. right fusiform gyrus and right middle occipital gyrus), occipital (i.e. right middle occipital gyrus, left lingual gyrus, and left inferior occipital gyrus), and cerebellar regions (i.e. left crus 1 and left cerebellum VIII) (Table 3; Fig. 2). We also found deactivation in parietal (i.e. right precuneus and right inferior parietal lobule), temporal (i.e. right and left middle temporal gyri, left angular gyrus), and occipital regions (right cuneus; left superior occipital gyrus) (Table 3; Fig. 2).
Table 3.
Brain regions showing activation or deactivation during SWM.
| Extent (k) | Peak t-value | MNI coordinates (mm) | |||
|---|---|---|---|---|---|
| x | y | z | |||
| Activation | |||||
| Frontal | |||||
| R IFG (pars opercularis) | 3,989 | 5.301 | 50 | 7 | 30 |
| R IFG (pars triangularis) | 4,049 | 4.884 | 44 | 30 | 20 |
| L IFG (pars opercularis) | 4,296 | 5.734 | −52 | 8 | 32 |
| L IFG (pars triangularis) | 1,428 | 4.026 | −44 | 30 | 20 |
| L posterior-medial frontal | 1,714 | 4.771 | −6 | 16 | 51 |
| Temporal | |||||
| R fusiform gyrus | 28,771 | 8.009 | 34 | −81 | −8 |
| R middle occipital gyrus | 28,771 | 7.308 | 25 | −92 | 10 |
| Parietal | |||||
| R superior parietal lobule | 13,689 | 6.279 | 27 | −58 | 53 |
| R postcentral gyrus | 13,689 | 5.031 | 54 | −22 | 40 |
| L inferior parietal lobule | 9,058 | 5.087 | −30 | −56 | 59 |
| L postcentral gyrus | 9,058 | 4.886 | −43 | −38 | 51 |
| Occipital | |||||
| R middle occipital gyrus | 28,771 | 7.308 | 25 | −92 | 10 |
| L lingual gyrus | 21,522 | 8.799 | −18 | −92 | −7 |
| L inferior occipital gyrus | 21,522 | 6.725 | −43 | −72 | −9 |
| Cerebellum | |||||
| L cerebellum (Crus 1) | 21,522 | 3.333 | −10 | −77 | −23 |
| L cerebellum (VIII) | 167 | 3.890 | −16 | −68 | −47 |
| Deactivation | |||||
| Temporal | |||||
| R middle temporal gyrus | 2,188 | -5.441 | 58 | −59 | 23 |
| L angular gyrus | 1,094 | -4.144 | −44 | −76 | 39 |
| L middle temporal gyrus | 1,094 | -3.486 | −47 | −56 | 16 |
| Parietal | |||||
| R precuneus | 832 | -3.705 | 3 | −54 | 47 |
| R inferior parietal lobule | 21 | -3.577 | 56 | −59 | 44 |
| Occipital | |||||
| R cuneus | 326 | -4.642 | 12 | −96 | 20 |
| L superior occipital gyrus | 93 | -3.818 | −23 | −92 | 30 |
| L superior occipital gyrus | 23 | -3.553 | −11 | −104 | 15 |
Note. Significance level set at nonparametric TFCE P < 0.0001 (uncorrected) and cluster size k > 10 for all analyses. Cortical regions labeled using the AnatomyToolbox atlas via the SPM toolbox BSPMview. Cerebellar regions labeled using the SUIT atlas. L, left; R, right.
Fig. 2.

Main effect of SWM. The SWM task resulted in widespread activation (red) and deactivation (green). Whole brain results are overlaid onto a MNI standard template, respectively; nonparametric TFCE P < 0.0001 (uncorrected), minimum cluster size: k = 10.
Spaceflight longitudinal changes in the neural correlates of SWM
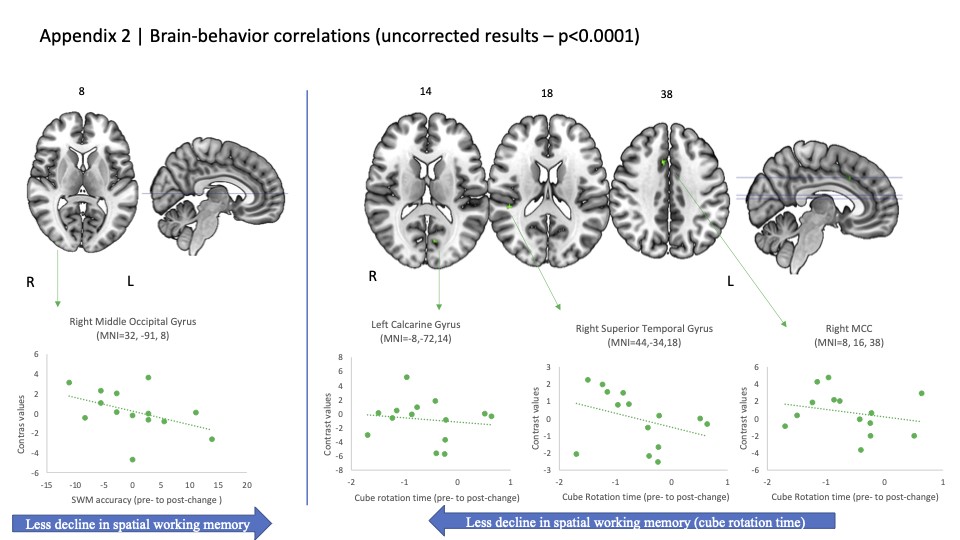
We found no changes in brain activity during SWM from pre- to post-flight. Exploratory uncorrected results (P < 0.001) are shown in the appendix (Appendix Fig. 1, Appendix Table 1).
Pre- to post-flight changes in brain activity–behavior correlations
Analyses yielded no brain–behavior (i.e. change-change) correlations for any of the behavioral measures examined (i.e. SWM performance, card rotation performance, or cube rotation performance). Exploratory uncorrected results (P < 0.0001) are presented in the appendix (Appendix Fig. 2, Appendix Table 2).
Task-based connectivity
Voxel-to-voxel analyses
The whole-brain ICC revealed a cluster in the right superior occipital cortex (peak at coordinates 28, −56, 40) showing a reduction in connectivity with the rest of the brain during the SWM task from pre- to post-flight.
Seed-to-voxel analyses
We used 5 different brain regions from the baseline SWM main effect contrast as seed regions. Our results showed decreased functional connectivity between the seed in left middle occipital gyrus and clusters in the left lateral occipital cortex (spanning superior and inferior divisions) and the left parahippocampal gyrus (Fig. 3 and Table 4). There were no significant connectivity changes with any other seed regions.
Fig. 3.

Seed-to-voxel brain connectivity. Brain regions showing decreased connectivity (pink) with the left middle occipital gyrus seed (green). Cluster-level threshold of P < 0.05 (2-tailed), FDR corrected. R, right; L, left. Results are overlaid onto a MNI standard template.
Table 4.
Seed-to-voxel brain connectivity.
| Seed | Resulting clusters MNI (x, y, z) |
Region labels | Clusters sizes, voxels | Cluster P uncorrected | Cluster P FDR-corrected |
|---|---|---|---|---|---|
| Left middle occipital gyrus | −20, −38, −16 | L parahippocampal gyrus | 16 | <0.0001 | 0.013 |
| L cerebellum | 18 | ||||
| −26, −84, 36 | L lateral occipital cortex, superior division | 44 | <0.0001 | 0.042 |
Note. Significance level set at cluster-level threshold of P < 0.05 (2-tailed), FDR corrected. Minimum cluster size k = 10 for all analyses. Brain regions were labeled using the AAL atlas. Statistical significant values are shown in bold. L, left; R, right.
Pre- to post-flight changes in brain connectivity–behavior correlations
Pre- to post-flight differences in functional connectivity between the same 5 seeds used before and the rest of the brain were tested for correlations with pre- to post-flight differences in SWM performance. We observed positive correlations between pre- to post-flight changes in SWM accuracy and pre- to post-flight differences in functional connectivity between the right superior occipital gyrus seed and the right precentral gyrus. That is, those subjects with greater pre-to post-flight changes in connectivity showed larger improvements in SWM performance after spaceflight. Positive correlations were also found for card rotation time pre- to post-flight differences and pre- to post-flight differences in connectivity between (ii) the left middle occipital gyrus seed and the right insular cortex; (ii) right inferior frontal gyrus (triangularis) seed and the lingual gyrus, left cerebellum 6, left fusiform gyrus, right supramarginal gyrus, and right middle frontal gyrus; (iii) right superior occipital gyrus seed, and cerebellar vermis 4, 5, 6, and left cerebellum 4, 5 (Fig. 4 and Table 5). That is, participants whose SWM performance slowed after spaceflight exhibited reduced functional connectivity from pre- to post-flight.
Fig. 4.
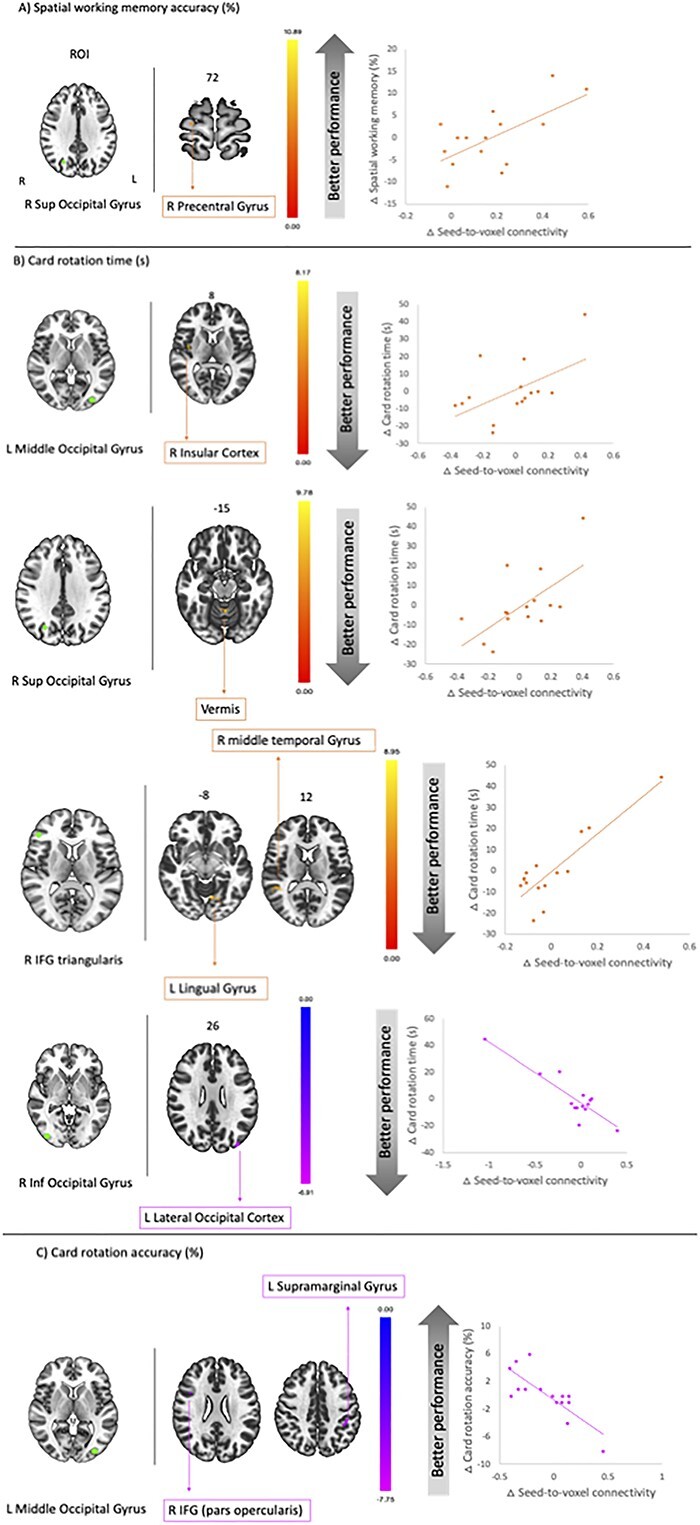
Correlation between seed-to-voxel connectivity and SWM performance. Left. ROIs (seed—Green). A) SWM accuracy; B) card rotation time; C) card rotation accuracy. Clusters in orange depict the positive correlation between pre- to post-flight changes in connectivity and pre- to post-flight changes in performance. Clusters in pink depict the negative correlation between pre- to post-flight changes in connectivity and pre- to post-flight changes in performance. Cluster-level FDR correction: P < 0.05. Minimum cluster size: k = 10 for all analyses. R, right; L, left. Results are overlaid onto a MNI standard template.
Table 5.
Correlation between SWM performance and seed-to-voxel connectivity.
| Seed | Resulting cluster center of mass, MNI | Cluster size | P-uncorrected | P-FDR | Region labels | ||
|---|---|---|---|---|---|---|---|
| x | y | z | |||||
| SWM accuracy (%)—positive correlation | |||||||
| R superior occipital gyrus | 22 | −16 | 70 | 42 | <0.0001 | 0.038 | R precentral gyrus |
| Card rotation time (s)—positive correlation | |||||||
| L middle occipital gyrus | 48 | 0 | 8 | 42 | 0.0005 | 0.027 | R insular cortex |
| R inferior frontal gyrus (triangularis) | −10 | −64 | −4 | 117 | <0.0001 | <0.0001 | L lingual gyrus L cerebellum 6 L fusiform gyrus |
| 44 | −40 | 14 | 53 | <0.0001 | 0.006 | R supramarginal gyrus R middle temporal gyrus |
|
| R superior occipital gyrus | 2 | −58 | −24 | 74 | <0.0001 | 0.001 | Vermis 4 5 Vermis 6 L cerebellum 4 5 |
| Card rotation time (s)—negative correlation | |||||||
| R inferior occipital gyrus | −38 | −84 | 24 | 41 | 0.0004 | 0.025 | L lateral occipital cortex |
| Card rotation accuracy (%)—negative correlation | |||||||
| L middle occipital gyrus | 42 | 12 | 22 | 48 | 0.0003 | 0.018 | R inferior frontal gyrus |
| −44 | −34 | 40 | 41 | 0.0006 | 0.021 | L supramarginal gyrus | |
Note. Cluster-level FDR correction: P < 0.05. Minimum cluster size k = 10 for all analyses. Brain regions were labeled using the AAL atlas. L, left; R, right.
We observed negative correlations between pre- to post-flight changes in card rotation time and changes in functional connectivity between the right inferior occipital gyrus seed and the left lateral occipital cortex. Individuals who had greater changes in functional connectivity between these 2 regions post-flight responded greater improvements in performance speed of the card rotation task.
In addition, changes from pre- to post-flight in card rotation accuracy negatively correlated with differences in connectivity between the left middle occipital gyrus seed and right inferior frontal gyrus and left supramarginal gyrus (Fig. 4 and Table 5). That is, those subjects who showed worse task performance exhibited greater increases in seed-to-voxel connectivity between these brain regions.
ROI-to-ROI connectivity
Our analyses did not reveal any statistically significant ROI-to-ROI connectivity changes between the 5 seed regions.
Discussion
This is the first study to investigate the effects of long-duration spaceflight on brain activation during SWM performance. From pre- to post-flight, there were no group level changes in SWM performance or in brain activity during this task at the time points included in this study. There were, however, changes in task-based brain connectivity during SWM from before to after spaceflight. Some of these changes in functional connectivity correlated with individual differences in changes in SWM performance from pre- to post-flight. The effects largely involved changes in connectivity with visual cortical regions, as elaborated below.
SWM brain activity
The main effect results of SWM resembled the task main effect reported in our previous spaceflight analog study (Salazar et al. 2020) and in other studies using similar tasks (Reuter-Lorenz et al. 2000; Anguera et al. 2010). As expected, we observed widespread activation of frontal, parietal, temporal, occipital, and cerebellar regions. Thus, this task elicited the anticipated pattern of brain activity associated with SWM performance. We did not observe group level brain changes in these patterns from pre- to post- spaceflight. While there have been numerous studies showing changes in brain structure with spaceflight (Koppelmans et al. 2016; Roberts et al. 2017; Lee, Koppelmans, et al. 2019b; Hupfeld et al. 2020), very few studies have examined potential spaceflight impacts on brain functional activity or connectivity. Pechenkova et al. (2019) measured changes in brain functional activity and task-based connectivity acquired while participants received foot sole tactile stimulation pre- and post-flight. Similar to our findings here, they did not observe significant effects of spaceflight on brain activity, but they did report changes in connectivity between task-relevant brain regions with flight. These authors observed increased task-based connectivity between the right posterior supramarginal gyrus with the rest of the brain, as well as reduced task-based connectivity among cerebellar, parietal, and vestibular brainstem regions. We have also reported changes from pre- to post-flight in functional brain activity during vestibular stimulation; visual and somatosensory cortical regions showed patterns suggesting upweighted responses to vestibular stimulation post-flight (Hupfeld et al. 2022). This seemed to be an adaptive response, as crewmembers who exhibited the largest changes in their neural response to vestibular stimulation from pre- to post-flight also showed the smallest post-flight balance declines.
We recently examined changes in brain functional activity with this same SWM task in a spaceflight analog environment (Salazar et al. 2020). Participants spent 30 days in long-duration HDBR, coupled with 0.5% CO2 in the ambient air environment to better simulate the conditions on the ISS (Law et al. 2014). Performance on this same SWM task did not change throughout the course of the bed rest intervention. There were only 11 participants in this pilot HDBR study; therefore, we examined changes in task-based brain activity at an uncorrected statistical threshold. We found that brain activity in the right middle frontal gyrus and the left cerebellum decreased throughout HDBR+CO2 and then subsequently increased to pre-intervention levels approximately 2 weeks post-HDBR (Salazar et al. 2020). As outlined in the Appendix of the current study, at a more liberal, uncorrected statistical threshold, we similarly found functional connectivity changes among several brain regions following spaceflight. It is unclear whether these changes would have passed correction for multiple comparisons if we had had a larger sample of astronauts. However, our sample size was relatively large for a study of this population.
SWM brain connectivity
Changes in task-based brain activity reflect increases or decreases in the functional MRI BOLD signal. Changes in task-based connectivity, in contrast, reflect whether multiple brain regions exhibit altered correlations in BOLD activity during task performance. While we did not observe significant effects of spaceflight on brain activity during SWM task performance, we did find numerous changes in task-based functional connectivity (reviewed below). This generally parallels results reported by Pechenkova et al. (2019) showing post-flight activity changes within brain regions involved in somatosensory processing, as described above.
The ICC analysis that we conducted here allows for a hypothesis-free assessment of task-based connectivity changes over time. We found that the superior occipital gyrus showed reductions in connectivity with the rest of the brain. This region (at MNI coordinates 28, −56, 40) overlaps with the superior occipital gyrus cluster that was activated during SWM performance task pre-flight (MNI: 26, −68, 34). That is, this region has relevance for SWM, and its interaction with other brain regions during SWM performance was suppressed post-flight. This result provides another interesting parallel to the findings of Pechenkova et al. (2019) in which a task-relevant, somatosensory cortical region (superior parietal cortex, involved in multisensory integration) had reduced connectivity with other brain regions during tactile processing post-flight. These converging results raise the possibility that some sensory processing brain regions become less integrated with other brain networks following spaceflight. Of note, our group also found that the lateral superior occipital gyrus showed reductions in “resting-state functional” connectivity (i.e. while at rest with no explicit task being performed) with other brain regions during HDBR (McGregor et al. 2021a), suggesting that reduced integration of sensory regions with the rest of the brain may be a more generalized rather than task-dependent phenomenon.
We also selected seed regions for connectivity analyses from areas that were activated during SWM task performance, averaged across the first 2 pre-flight test sessions. These regions included clusters in the right inferior frontal gyrus, right inferior and superior occipital gyri, and the left middle occipital gyrus. We examined changes in connectivity between each of these seed regions and the rest of the brain from pre- to post-flight. We found that only the left middle occipital gyrus showed significant changes in connectivity patterns; decreased connectivity was observed between this region and the left parahippocampal gyrus, the left cerebellum, and the left lateral occipital cortex during SWM task performance from pre- to post-flight. The parahippocampal gyrus supports configuration learning (Bohbot et al. 2015) and has been shown to exhibit a decrease in gray matter volume following a polar expedition (Stahn et al. 2019). It is unclear whether the isolated environment of the ISS results in similar hippocampal and parahippocampal changes as polar expeditions; ongoing investigations are examining this question (Stahn and Kuhn 2021). It may be that potential neuroplastic changes to this region with spaceflight also impact its task-related connectivity patterns.
The previous 2 functional MRI papers assaying the effects of spaceflight found changes in the functional activity or connectivity of sensory regions (Hupfeld et al. 2019; Pechenkova et al. 2019). This is perhaps not surprising, given that both studies applied sensory stimulation to participants (foot tactile stimulation and vestibular stimulation, respectively). The present study using a cognitive SWM task also identified connectivity changes that were largely restricted to visual cortical regions. This is even though we analyzed our results in relation to a control condition which included similar visual processing demands. It is well established that visual and somatosensory inputs are upweighted post-flight, potentially in response to the altered vestibular inputs that occur in microgravity (Paloski et al. 1992; Black et al. 1995; Ozdemir et al. 2018; Hupfeld et al. 2022). This upweighting may then result in increased modularity of the supporting brain networks, reflected as decreased connectivity with other brain regions. Future analyses may shed light on this issue.
SWM brain connectivity–behavior correlations
Examining brain–behavior correlations informs a functional interpretation of brain changes (cf.(Hupfeld et al. 2021). For instance, it is difficult to infer whether decreased brain connectivity is adaptive or maladaptive without evaluating associations with performance. Even in the absence of group level changes in SWM performance, individual differences in pre- to post-flight performance were correlated with changes in task-based brain connectivity. Even though the superior occipital gyrus showed largely reduced connectivity with the rest of the brain as a function of spaceflight (as described above for the ICC results), crewmembers with increased connectivity between this brain region and the right precentral gyrus post-flight showed post-flight improvements in SWM task accuracy. In addition, astronauts who exhibited increased connectivity between the right inferior occipital gyrus and the lateral occipital cortex post-flight showed greater “improvements” in speed on the card rotation task from pre- to post-flight (this task was administered outside of the scanner). Thus, it may be that spaceflight-associated increases in connectivity between cortical visual regions, and between visual regions and the primary motor cortex, serve a compensatory role in maintaining the efficiency of SWM performance. This finding is similar to compensatory effects observed in aging, in which stronger brain connectivity is associated with better cognitive performance (Behfar et al. 2020).
We also observed some correlations in the opposite direction, in which stronger brain functional connectivity was associated with reductions in performance accuracy or speed following flight. For instance, stronger connectivity between the left middle occipital gyrus and the right insular cortex; stronger connectivity between the right inferior frontal gyrus and the lingual gyrus, the left cerebellum lobule VI, the right supramarginal, and middle frontal gyri; and stronger connectivity between the right superior occipital gyrus and the left cerebellar lobules IV and V were all associated with slower performance on the card rotation test. Higher connectivity between brain regions is not necessarily beneficial and could indicate reduced segregation of distinct brain networks. Here, as higher connectivity among these brain regions was associated with larger performance decrements following spaceflight, we suggest that this indicates neural dedifferentiation (cf. (Cassady, Gagnon, et al. 2020a; Cassady, Ruitenberg, et al. 2020b; Zhang et al. 2021). Our prior work supports that dedifferentiation in the aging brain is mediated by declines in the inhibitory transmitter gamma aminobutyric acid (GABA; (Cassady et al. 2019), although the mechanisms underlying neural dedifferentiation with spaceflight may differ.
It is interesting that the overall effects of both our hypothesis-free and hypothesis-driven analyses implicate changes in task-based visual cortical connectivity and visual–frontal interactions with spaceflight. In our recent HDBR study, hypothesis-free ICC analysis showed that the primary visual cortex changed its resting-state interactivity with the rest of the brain (McGregor et al. 2021a). Understanding the antecedents and consequences of these visual cortical connectivity changes with spaceflight will require future study. Such changes may relate to the apparent downweighting of vestibular inputs, which are altered in-flight, and upweighting of visual and proprioceptive inputs that occur with spaceflight (Hallgren et al. 2016; Hupfeld et al. 2022).
Visual cortical connectivity changes may also relate to the constellation of ocular structural signs known as Spaceflight Associated Neuro-ocular Syndrome (SANS) (McGregor et al. 2021b). We recently reported that HDBR participants that developed signs of SANS increased visual dependency more than those that did not show signs of SANS (Lee, De Dios, et al. 2019a). While it may seem counterintuitive to have ocular declines associated with increased reliance on vision, signs of SANS in the bed rest participants were mild. Increased visual weighting in this subgroup may therefore reflect an early adaptive change to the syndrome. These visual cortical connectivity changes and increased visual reliance with spaceflight are an important focus for further investigation, as greater visual dependency is associated with poorer spatial navigation (Willey and Jackson 2014) and reduced adaptive generalization (Brady et al. 2012).
Limitations
Our sample size of 15 astronauts is relatively small, though astronauts constitute a unique and challenging population to access. We may have lacked sufficient power to observe statistically significant spaceflight-associated changes in brain activity due to the sample size. To assist future investigations of spaceflight effects on cognitive function and brain activity, we included results of analyses that were not corrected for multiple comparisons in the Appendix. These uncorrected results may provide insights into brain regions that could be targeted in future studies for ROI analyses. In fact, to the best of our knowledge, this work includes the largest sample size to date reporting functional brain activity and functional connectivity findings during a cognitive task in astronauts. To address sample size concerns, we used a longitudinal, within-subjects design to allow subjects to serve as their own controls. However, the lack of a ground-based control group is considered a limitation of this study.
Several aspects of the study bear further mention. First, there was some delay and variability in when the first post-flight MRI scan was performed. Because the scan ranged from 1 to 6 days after landing (average = 4.5 days), we included the time elapsed between landing and the first post-flight MRI scan as a covariate in all analyses to account for inter-subject variability in the testing timeline. The delay between landing and the first post-flight scan session may have limited our ability to detect spaceflight-induced changes in SWM or performance and brain functional connectivity before readaptation upon return to Earth. Second, of note, the connectivity changes we report here reflect SWM “task-based” connectivity. Resting-state and task-based connectivity have been shown to be related (cf.(Langan et al. 2010). However, it remains to be determined whether our findings generalize to the effects of spaceflight on patterns of brain connectivity associated with the performance of other task types.
Conclusions
We did not observe significant group-level changes in SWM performance or associated patterns of brain activity with spaceflight in this longitudinal study. We did, however, find significant changes in task-based connectivity patterns from pre- to post-flight. Both the superior occipital and medial occipital gyri showed reduced connectivity with other brain regions. These changes may reflect increased visual network modularity or increased reliance on visual inputs with spaceflight. In some cases, we found that increased visual and visuomotor connectivity with spaceflight were correlated with better SWM performance, and in other cases, decreased visual and visual-frontal cortical connectivity were associated with decreased performance. Further studies in future astronaut cohorts are needed to better understand the causes and functional consequences of these findings, including the range of possible compensatory adjustments in response to spaceflight-induced alterations in sensory processing and associated neural underpinnings.
Supplementary Material
Contributor Information
Ana Paula Salazar, Department of Applied Physiology and Kinesiology, University of Florida, Gainesville, FL, United States.
Heather R McGregor, Department of Applied Physiology and Kinesiology, University of Florida, Gainesville, FL, United States.
Kathleen E Hupfeld, Department of Applied Physiology and Kinesiology, University of Florida, Gainesville, FL, United States.
Nichole E Beltran, KBR, 601 Jefferson Street, Houston, TX 77002, United States.
Igor S Kofman, KBR, 601 Jefferson Street, Houston, TX 77002, United States.
Yiri E De Dios, KBR, 601 Jefferson Street, Houston, TX 77002, United States.
Roy F Riascos, Department of Diagnostic and Interventional Imaging, University of Texas Health Science Center at Houston, 6431 Fannin Street, Houston, TX 77030, United States.
Patricia A Reuter-Lorenz, Department of Psychology, University of Michigan, 530 Church St., Ann Arbor, MI 48109, United States.
Jacob J Bloomberg, NASA Johnson Space Center, 2101 E NASA Parkway, Houston, TX 77058, United States.
Ajitkumar P Mulavara, KBR, 601 Jefferson Street, Houston, TX 77002, United States.
Scott J Wood, NASA Johnson Space Center, 2101 E NASA Parkway, Houston, TX 77058, United States.
RachaelD Seidler, Department of Applied Physiology and Kinesiology, University of Florida, Gainesville, FL, United States; Norman Fixel Institute for Neurological Diseases, University of Florida, Gainesville, FL, United States.
Author contributions
APS analyzed the behavioral and MRI data, created figures and tables, and wrote the first draft of the manuscript. HRM and KEH assisted with fMRI preprocessing and fMRI statistical analyses. NEB collected and analyzed data. ISK participated in project design and software development. YEDD collected and analyzed data. RFR, PAR-L, JJB, APM, SJW, and RDS designed the project, secured funding, and led the interpretation and discussion of the results. All authors participated in revision of the manuscript.
Funding
This work was supported by a grant from the National Aeronautics and Space Administration (NASA; NNX11AR02G to RDS, APM, PAR-L, and JJB). Additionally, during completion of this work, HRM was supported by a Natural Sciences and Engineering Research Council of Canada postdoctoral fellowship and a NASA Human Research Program augmentation grant. KEH was supported by a National Science Foundation Graduate Research Fellowship under grant nos. DGE-1315138 and DGE-1842473, National Institute of Neurological Disorders and Stroke training grant T32-NS082128, and National Institute on Aging fellowship 1F99AG068440.
Conflict of interest statement: The authors declare that the research was conducted in the absence of any commercial or financial relationships that could be construed as a potential conflict of interest.
Data availability
The data sets included in this study will be made available through NASA’s Life Sciences Data Archive (https://lsda.jsc.nasa.gov).
References
- Anguera JA, Reuter-Lorenz PA, Willingham DT, Seidler RD. Contributions of spatial working memory to visuomotor learning. J Cogn Neurosci. 2010:22:1917–1930. [DOI] [PubMed] [Google Scholar]
- Avants BB, Tustison NJ, Song G, Cook PA, Klein A, Gee JC. A reproducible evaluation of ANTs similarity metric performance in brain image registration. NeuroImage. 2011:54:2033–2044. [DOI] [PMC free article] [PubMed] [Google Scholar]
- Basner M, Stahn AC, Nasrini J, Dinges DF, Moore TM, Gur RC, Muhl C, Macias BR, Laurie SS. Effects of head-down tilt bed rest plus elevated CO2 on cognitive performance. J Appl Physiol (1985). 2021:130(4):1235–1246. [DOI] [PMC free article] [PubMed] [Google Scholar]
- Behfar Q, Behfar SK, von Reutern B, Richter N, Dronse J, Fassbender R, Fink GR, Onur OA. Graph theory analysis reveals resting-state compensatory mechanisms in healthy aging and prodromal Alzheimer's disease. Front Aging Neurosci. 2020:12:576627. [DOI] [PMC free article] [PubMed] [Google Scholar]
- Black FO, Paloski WH, Doxey-Gasway DD, Reschke MF. Vestibular plasticity following orbital spaceflight: recovery from postflight postural instability. Acta Otolaryngol Suppl. 1995:520(Pt 2):450–454. [DOI] [PubMed] [Google Scholar]
- Bock O, Weigelt C, Bloomberg JJ. Cognitive demand of human sensorimotor performance during an extended space mission: a dual-task study. Aviat Space Environ Med. 2010:81:819–824. [DOI] [PubMed] [Google Scholar]
- Bohbot VD, Allen JJ, Dagher A, Dumoulin SO, Evans AC, Petrides M, Kalina M, Stepankova K, Nadel L. Role of the parahippocampal cortex in memory for the configuration but not the identity of objects: converging evidence from patients with selective thermal lesions and fMRI. Front Hum Neurosci. 2015:9:431. [DOI] [PMC free article] [PubMed] [Google Scholar]
- Brady RA, Peters BT, Batson CD, Ploutz-Snyder R, Mulavara AP, Bloomberg JJ. Gait adaptability training is affected by visual dependency. Exp Brain Res. 2012:220:1–9. [DOI] [PubMed] [Google Scholar]
- Cassady K, Gagnon H, Lalwani P, Simmonite M, Foerster B, Park D, Peltier SJ, Petrou M, Taylor SF, Weissman DH, et al. Sensorimotor network segregation declines with age and is linked to GABA and to sensorimotor performance. NeuroImage. 2019:186:234–244. [DOI] [PMC free article] [PubMed] [Google Scholar]
- Cassady K, Gagnon H, Freiburger E, Lalwani P, Simmonite M, Park DC, Peltier SJ, Taylor SF, Weissman DH, Seidler RD, et al. Network segregation varies with neural distinctiveness in sensorimotor cortex. NeuroImage. 2020a:212:116663. [DOI] [PMC free article] [PubMed] [Google Scholar]
- Cassady K, Ruitenberg MFL, Reuter-Lorenz PA, Tommerdahl M, Seidler RD. Neural dedifferentiation across the lifespan in the motor and somatosensory systems. Cereb Cortex. 2020b:30:3704–3716. [DOI] [PMC free article] [PubMed] [Google Scholar]
- Cebolla AM, Petieau M, Dan B, Balazs L, McIntyre J, Cheron G. Cerebellar contribution to visuo-attentional alpha rhythm: insights from weightlessness. Sci Rep. 2016:6:37824. [DOI] [PMC free article] [PubMed] [Google Scholar]
- Cheron G, Leroy A, De Saedeleer C, Bengoetxea A, Lipshits M, Cebolla A, Servais L, Dan B, Berthoz A, McIntyre J. Effect of gravity on human spontaneous 10-Hz electroencephalographic oscillations during the arrest reaction. Brain Res. 2006:1121:104–116. [DOI] [PubMed] [Google Scholar]
- Cheron G, Leroy A, Palmero-Soler E, De Saedeleer C, Bengoetxea A, Cebolla AM, Vidal M, Dan B, Berthoz A, McIntyre J. Gravity influences top-down signals in visual processing. PLoS One. 2014:9:e82371. [DOI] [PMC free article] [PubMed] [Google Scholar]
- Clement GR, Boyle RD, George KA, Nelson GA, Reschke MF, Williams TJ, Paloski WH. Challenges to the central nervous system during human spaceflight missions to Mars. J Neurophysiol. 2020:123:2037–2063. [DOI] [PubMed] [Google Scholar]
- De la Torre GG. Cognitive neuroscience in space. Life (Basel). 2014:4:281–294. [DOI] [PMC free article] [PubMed] [Google Scholar]
- Diedrichsen J. A spatially unbiased atlas template of the human cerebellum. NeuroImage. 2006:33:127–138. [DOI] [PubMed] [Google Scholar]
- Diedrichsen J, Balsters JH, Flavell J, Cussans E, Ramnani N. A probabilistic MR atlas of the human cerebellum. NeuroImage. 2009:46:39–46. [DOI] [PubMed] [Google Scholar]
- Doroshin A, Jillings S, Jeurissen B, Tomilovskaya E, Pechenkova E, Nosikova I, Rumshiskaya A, Litvinova L, Rukavishnikov I, De Laet C, et al. Brain connectometry changes in space travelers after long-duration spaceflight. Front Neural Circuits. 2022:16:815838. [DOI] [PMC free article] [PubMed] [Google Scholar]
- Ekstrom RB, French JW, Harman HH. Manual for kit of factor-referenced cognitive tests. Princeton, NJ: Education Testing Service; 1976 [Google Scholar]
- Garrett-Bakelman FE, Darshi M, Green SJ, Gur RC, Lin L, Macias BR, McKenna MJ, Meydan C, Mishra T, Nasrini J, et al. The NASA twins study: a multidimensional analysis of a year-long human spaceflight. Science. 2019:364:1–52. [DOI] [PMC free article] [PubMed] [Google Scholar]
- Hallgren E, Kornilova L, Fransen E, Glukhikh D, Moore ST, Clement G, Van Ombergen A, MacDougall H, Naumov I, Wuyts FL. Decreased otolith-mediated vestibular response in 25 astronauts induced by long-duration spaceflight. J Neurophysiol. 2016:115:3045–3051. [DOI] [PMC free article] [PubMed] [Google Scholar]
- Hupfeld KE, Lee JK, Gadd NE, Kofman IS, De Dios YE, Bloomberg JJ, Mulavara AP, Seidler RD. Neural correlates of vestibular processing during a spaceflight analog with elevated carbon dioxide (CO2): a pilot study. Front Syst Neurosci. 2019:13:80. [DOI] [PMC free article] [PubMed] [Google Scholar]
- Hupfeld KE, McGregor HR, Lee JK, Beltran NE, Kofman IS, De Dios YE, Reuter-Lorenz PA, Riascos RF, Pasternak O, Wood SJ, et al. The impact of 6 and 12 months in space on human brain structure and intracranial fluid shifts. Cereb Cortex Commun. 2020:1:tgaa023. [DOI] [PMC free article] [PubMed] [Google Scholar]
- Hupfeld KE, McGregor HR, Reuter-Lorenz PA, Seidler RD. Microgravity effects on the human brain and behavior: dysfunction and adaptive plasticity. Neurosci Biobehav Rev. 2021:122:176–189. [DOI] [PMC free article] [PubMed] [Google Scholar]
- Hupfeld KE, McGregor HR, Koppelmans V, Beltran NE, Kofman IS, De Dios YE, Riascos RF, Reuter-Lorenz PA, Wood SJ, Bloomberg JJ, et al. Brain and behavioral evidence for reweighting of vestibular inputs with long-duration spaceflight. Cereb Cortex. 2022:32:755–769. [DOI] [PMC free article] [PubMed] [Google Scholar]
- Japee S, Holiday K, Satyshur MD, Mukai I, Ungerleider LG. A role of right middle frontal gyrus in reorienting of attention: a case study. Front Syst Neurosci. 2015:9:23. [DOI] [PMC free article] [PubMed] [Google Scholar]
- Jillings S, Van Ombergen A, Tomilovskaya E, Rumshiskaya A, Litvinova L, Nosikova I, Pechenkova E, Rukavishnikov I, Kozlovskaya IB, Manko O, et al. Macro- and microstructural changes in cosmonauts' brains after long-duration spaceflight. Sci Adv. 2020:6:1–12. [DOI] [PMC free article] [PubMed] [Google Scholar]
- Kanas N, Manzey D. Space psychology and psychiatry. Springer-Verlag New York, LLC; 2008.
- Koppelmans V, Bloomberg JJ, Mulavara AP, Seidler RD. Brain structural plasticity with spaceflight. NPJ Microgravity. 2016:2:2. [DOI] [PMC free article] [PubMed] [Google Scholar]
- Koppelmans V, Bloomberg JJ, De Dios YE, Wood SJ, Reuter-Lorenz PA, Kofman IS, Riascos R, Mulavara AP, Seidler RD. Brain plasticity and sensorimotor deterioration as a function of 70 days head down tilt bed rest. PLoS One. 2017a:12:e0182236. [DOI] [PMC free article] [PubMed] [Google Scholar]
- Koppelmans V, Pasternak O, Bloomberg JJ, Dios YE, Wood SJ, Riascos R, Reuter-Lorenz PA, Kofman IS, Mulavara AP, Seidler RD. Intracranial fluid redistribution but no white matter microstructural changes during a spaceflight analog. Sci Rep. 2017b:7:3154. [DOI] [PMC free article] [PubMed] [Google Scholar]
- Langan J, Peltier SJ, Bo J, Fling BW, Welsh RC, Seidler RD. Functional implications of age differences in motor system connectivity. Front Syst Neurosci. 2010:4:17. [DOI] [PMC free article] [PubMed] [Google Scholar]
- Law J, Van Baalen M, Foy M, Mason SS, Mendez C, Wear ML, Meyers VE, Alexander D. Relationship between carbon dioxide levels and reported headaches on the international space station. J Occup Environ Med. 2014:56:477–483. [DOI] [PubMed] [Google Scholar]
- Lee JK, De Dios Y, Kofman I, Mulavara AP, Bloomberg JJ, Seidler RD. Head down tilt bed rest plus elevated CO2 as a spaceflight analog: effects on cognitive and sensorimotor performance. Front Hum Neurosci. 2019a:13:355. [DOI] [PMC free article] [PubMed] [Google Scholar]
- Lee JK, Koppelmans V, Riascos RF, Hasan KM, Pasternak O, Mulavara AP, Bloomberg JJ, Seidler RD. Spaceflight-associated brain white matter microstructural changes and intracranial fluid redistribution. JAMA Neurol. 2019b:76:412–419. [DOI] [PMC free article] [PubMed] [Google Scholar]
- Mahadevan AD, Hupfeld KE, Lee JK, De Dios YE, Kofman IS, Beltran NE, Mulder E, Bloomberg JJ, Mulavara AP, Seidler RD. Head-down-tilt bed rest with elevated CO2: effects of a pilot spaceflight analog on neural function and performance during a cognitive-motor dual task. Front Physiol. 2021:12:654906. [DOI] [PMC free article] [PubMed] [Google Scholar]
- Mammarella N. The effect of microgravity-like conditions on high-level cognition: a review. Front Astron Space Sci. 2020:7:1–5. [Google Scholar]
- Manzey D, Lorenz B. Mental performance during short-term and long-term spaceflight. Brain Res Brain Res Rev. 1998:28:215–221. [DOI] [PubMed] [Google Scholar]
- Manzey D, Lorenz B, Schiewe A, Finell G, Thiele G. Dual-task performance in space: results from a single-case study during a short-term space mission. Hum Factors. 1995:37:667–681. [DOI] [PubMed] [Google Scholar]
- Martuzzi R, Ramani R, Qiu M, Shen X, Papademetris X, Constable RT. A whole-brain voxel based measure of intrinsic connectivity contrast reveals local changes in tissue connectivity with anesthetic without a priori assumptions on thresholds or regions of interest. NeuroImage. 2011:58:1044–1050. [DOI] [PMC free article] [PubMed] [Google Scholar]
- McGregor HR, Lee JK, Mulder ER, De Dios YE, Beltran NE, Kofman IS, Bloomberg JJ, Mulavara AP, Seidler RD. Brain connectivity and behavioral changes in a spaceflight analog environment with elevated CO2. NeuroImage. 2021a:225:117450. [DOI] [PubMed] [Google Scholar]
- McGregor HR, Lee JK, Mulder ER, De Dios YE, Beltran NE, Kofman IS, Bloomberg JJ, Mulavara AP, Smith SM, Zwart SR, et al. Ophthalmic changes in a spaceflight analog are associated with brain functional reorganization. Hum Brain Mapp. 2021b:42:4281–4297. [DOI] [PMC free article] [PubMed] [Google Scholar]
- McLaren DG, Ries ML, Xu G, Johnson SC. A generalized form of context-dependent psychophysiological interactions (gPPI): a comparison to standard approaches. NeuroImage. 2012:61:1277–1286. [DOI] [PMC free article] [PubMed] [Google Scholar]
- Moore ST, MacDougall HG, Paloski WH. Effects of head-down bed rest and artificial gravity on spatial orientation. Exp Brain Res. 2010:204:617–622. [DOI] [PubMed] [Google Scholar]
- Moore ST, Dilda V, Morris TR, Yungher DA, MacDougall HG, Wood SJ. Long-duration spaceflight adversely affects post-landing operator proficiency. Sci Rep. 2019:9:2677. [DOI] [PMC free article] [PubMed] [Google Scholar]
- Ozdemir RA, Goel R, Reschke MF, Wood SJ, Paloski WH. Critical role of somatosensation in postural control following spaceflight: vestibularly deficient astronauts are not able to maintain upright stance during compromised somatosensation. Front Physiol. 2018:9:1680. [DOI] [PMC free article] [PubMed] [Google Scholar]
- Paloski WH, Reschke MF, Black FO, Doxey DD, Harm DL. Recovery of postural equilibrium control following spaceflight. Ann N Y Acad Sci. 1992:656:747–754. [DOI] [PubMed] [Google Scholar]
- Pechenkova E, Nosikova I, Rumshiskaya A, Litvinova L, Rukavishnikov I, Mershina E, Sinitsyn V, Van Ombergen A, Jeurissen B, Jillings S, et al. Alterations of functional brain connectivity after long-duration spaceflight as revealed by fMRI. Front Physiol. 2019:10:761. [DOI] [PMC free article] [PubMed] [Google Scholar]
- Reuter-Lorenz PA, Jonides J, Smith EE, Hartley A, Miller A, Marshuetz C, Koeppe RA. Age differences in the frontal lateralization of verbal and spatial working memory revealed by PET. J Cogn Neurosci. 2000:12:174–187. [DOI] [PubMed] [Google Scholar]
- Roberts DR, Albrecht MH, Collins HR, Asemani D, Chatterjee AR, Spampinato MV, Zhu X, Chimowitz MI, Antonucci MU. Effects of spaceflight on astronaut brain structure as indicated on MRI. N Engl J Med. 2017:377:1746–1753. [DOI] [PubMed] [Google Scholar]
- Romero JE, Coupe P, Giraud R, Ta VT, Fonov V, Park MTM, Chakravarty MM, Voineskos AN, Manjon JV. CERES: a new cerebellum lobule segmentation method. NeuroImage. 2017:147:916–924. [DOI] [PubMed] [Google Scholar]
- Salazar AP, Hupfeld KE, Lee JK, Beltran NE, Kofman IS, De Dios YE, Mulder E, Bloomberg JJ, Mulavara AP, Seidler RD. Neural working memory changes during a spaceflight analog with elevated carbon dioxide: a pilot study. Front Syst Neurosci. 2020:14:48. [DOI] [PMC free article] [PubMed] [Google Scholar]
- Salazar AP, Hupfeld KE, Lee JK, Banker LA, Tays GD, Beltran NE, Kofman IS, De Dios YE, Mulder E, Bloomberg JJ, et al. Visuomotor adaptation brain changes during a spaceflight analog with elevated carbon dioxide (CO2): a pilot study. Front Neural Circuits. 2021:15:659557. [DOI] [PMC free article] [PubMed] [Google Scholar]
- Shepard RN, Metzler J. Mental rotation of three-dimensional objects. Science. 1971:171:701–703. [DOI] [PubMed] [Google Scholar]
- Shepard S, Metzler D. Mental rotation: effects of dimensionality of objects and type of task. J Exp Psychol Hum Percept Perform. 1988:14:3–11. [PubMed] [Google Scholar]
- Smith SM, Nichols TE. Threshold-free cluster enhancement: addressing problems of smoothing, threshold dependence and localisation in cluster inference. NeuroImage. 2009:44:83–98. [DOI] [PubMed] [Google Scholar]
- Stahn AC, Kuhn S. Brains in space: the importance of understanding the impact of long-duration spaceflight on spatial cognition and its neural circuitry. Cogn Process. 2021:22:105–114. [DOI] [PMC free article] [PubMed] [Google Scholar]
- Stahn AC, Gunga HC, Kohlberg E, Gallinat J, Dinges DF, Kuhn S. Brain changes in response to long Antarctic expeditions. N Engl J Med. 2019:381:2273–2275. [DOI] [PubMed] [Google Scholar]
- Takacs E, Barkaszi I, Czigler I, Pato LG, Altbacker A, McIntyre J, Cheron G, Balazs L. Persistent deterioration of visuospatial performance in spaceflight. Sci Rep. 2021:11:9590. [DOI] [PMC free article] [PubMed] [Google Scholar]
- Tays GD, Hupfeld KE, McGregor HR, Salazar AP, De Dios YE, Beltran NE, Reuter-Lorenz PA, Kofman IS, Wood SJ, Bloomberg JJ, et al. The effects of long duration spaceflight on sensorimotor control and cognition. Front Neural Circuits. 2021:15:723504. [DOI] [PMC free article] [PubMed] [Google Scholar]
- Thurling M, Hautzel H, Kuper M, Stefanescu MR, Maderwald S, Ladd ME, Timmann D. Involvement of the cerebellar cortex and nuclei in verbal and visuospatial working memory: a 7 T fMRI study. NeuroImage. 2012:62:1537–1550. [DOI] [PubMed] [Google Scholar]
- Whitfield-Gabrieli S, Nieto-Castanon A. Conn: a functional connectivity toolbox for correlated and anticorrelated brain networks. Brain Connect. 2012:2:125–141. [DOI] [PubMed] [Google Scholar]
- Willey CR, Jackson RE. Visual field dependence as a navigational strategy. Atten Percept Psychophys. 2014:76:1036–1044. [DOI] [PMC free article] [PubMed] [Google Scholar]
- Yuan P, Koppelmans V, Reuter-Lorenz P, De Dios Y, Gadd N, Wood S, Riascos R, Kofman I, Bloomberg J, Mulavara A, et al. Vestibular brain changes within 70 days of head down bed rest. Hum Brain Mapp. 2018:39:2753–2763. [DOI] [PMC free article] [PubMed] [Google Scholar]
- Zhang H, Gertel VH, Cosgrove AL, Diaz MT. Age-related differences in resting-state and task-based network characteristics and cognition: a lifespan sample. Neurobiol Aging. 2021:101:262–272. [DOI] [PMC free article] [PubMed] [Google Scholar]
Associated Data
This section collects any data citations, data availability statements, or supplementary materials included in this article.
Supplementary Materials
Data Availability Statement
The data sets included in this study will be made available through NASA’s Life Sciences Data Archive (https://lsda.jsc.nasa.gov).