


Abstract
The sequence-based predictors of RNA-binding residues (RBRs) are trained on either structure-annotated or disorder-annotated binding regions. A recent study of predictors of protein-binding residues shows that they are plagued by high levels of cross-predictions (protein binding residues are predicted as nucleic acid binding) and that structure-trained predictors perform poorly for the disorder-annotated regions and vice versa. Consequently, we analyze a representative set of the structure and disorder trained predictors of RBRs to comprehensively assess quality of their predictions. Our empirical analysis that relies on a new and low-similarity benchmark dataset reveals that the structure-trained predictors of RBRs perform well for the structure-annotated proteins while the disorder-trained predictors provide accurate results for the disorder-annotated proteins. However, these methods work only modestly well on the opposite types of annotations, motivating the need for new solutions. Using an empirical approach, we design HybridRNAbind meta-model that generates accurate predictions and low amounts of cross-predictions when tested on data that combines structure and disorder-annotated RBRs. We release this meta-model as a convenient webserver which is available at https://www.csuligroup.com/hybridRNAbind/.
INTRODUCTION
Protein–RNA interactions are instrumental for many cellular processes including gene expression, RNA splicing and regulation, protein synthesis, and post-transcriptional regulation (1–3). Misregulation of these proteins leads to a number of ailments including cancers, diabetes, cardiovascular and neurodegenerative diseases (3). Molecular-level details of protein–RNA interactions can be investigated from data in several resources, such as Protein Data Bank (PDB) (4) that covers atomic-level details, and BioLiP (5) and DisProt (6) that provide residue-level annotations. However, these details are available for only a small fraction of the RNA-binding proteins, motivating the need to develop accurate computational tools.
Many methods have been developed for the prediction of RNA binding in proteins (7–13). They can be divided into two categories depending on their input: structure-based vs. sequence-based. The structure-based predictors are constrained to proteins that have structure or for which structure can be predicted accurately. The sequence-based predictors in principle can be used to characterize RNA-binding in any protein sequence. The sequence-based methods can be further subdivided into those that make predictions at the protein-level (i.e. they predict whether a given protein sequence binds RNA) and residue-level (i.e. they predict RNA-binding amino acids in the sequence). We focus on the residue-level sequence-based predictors because they provide more details compared to the protein-level methods.
Significant majority of the sequence-based predictors of RNA-binding residues (RBRs) utilizes machine learning models (7,8,10,13). These models are computed/parametrized on training datasets to minimize difference between their predictions and the ground truth. Then, the trained models can be applied to predict RNA-binding residues for sequences outside the training datasets. Some of these predictors also utilize template-based modelling where predictions are transferred from similar proteins that are in complex with RNAs (14–16). Based on the training datasets, the sequence-based predictors of RBRs can be divided into two categories: structure-trained predictors vs. disorder-trained predictors. The former use training datasets where annotations of RBRs are extracted from structures of protein-RNA complexes, typically using the PDB and BioLiP databases. The latter apply training datasets where RBRs are localized in the intrinsically disordered regions (IDRs), which can be extracted from the DisProt (6) and MobiDB (17) databases. IDRs are segments in a protein sequence that lack a stable three-dimensional structure under physiological conditions (18–20). They are widely observed in all living organisms, and especially in eukaryotes (21–26). The prevalence and importance of intrinsic disorder to protein–RNA interactions was documented in numerous studies (27–33). Proteins with IDRs are also challenging for the structure-based predictors, further justifying our focus on the sequence-based predictors.
Using a manual literature search and past surveys (7–13), we identified a comprehensive set of 31 sequence-based predictors of RBRs. We found 2 disorder-trained predictors and 29 structure-trained predictors, including 9 predictors that predict both RNA-binding and DNA-binding residues. The 29 structure-trained predictors include (in chronological order) a method by Jeong et al. (34), BindN (35), a method by Jeong and Miyano (36), RNABindR (37), PRINTR (38), RISP (39), Pprint (40), RNAProB (41), BindN+ (42), NAPS (43), PiRaNhA (44), ProteRNA (45), RBRpred (46), PRNA (47), PRBR (48), a method by Choi and Han (49), RNABindRPlus (16), aaRNA (50), SNBRFinder (15), a method by Ren and Shen (51), PRIdictor (52), RNAProSite (53), DRNApred (54), PredRBR (55), NucBind (56), ProNA2020 (57), NCBRPred (58) and MTDsite (59). The disorder-trained predictors are DisoRDPbind (60–62) and DeepDISObind (63). They simultaneously predict RNA, DNA and protein binding residues. Their relatively low number compared to the structure-trained methods can be explained by a sparsity of the annotations of RBRs in IDRs. DisProt, the sole source of these annotations, has included them only in recent years (64). Interestingly, a recent study demonstrates that structure-trained predictors of protein binding residues perform poorly for the disorder-annotated proteins while the disorder-trained predictors of protein binding residues provide inaccurate predictions for the structure-annotated proteins (65). To our knowledge, a similar study that analyzes this problem for the sequence-based predictors of RBRs was not yet undertaken.
Our analysis of the 31 structure- and disorder-trained predictors reveals that none of them uses both structure- and disorder-annotated proteins in their training process. This suggests that the current predictors may provide poor results for the other type of annotations. Moreover, these predictors are always evaluated on their own type of annotations, i.e. the structure-trained predictors were not assessed on the disorder-annotated proteins and vice versa. Furthermore, recent studies identify and discuss a cross-predictions problem, where residues interacting with a given partner type are cross-predicted as interacting with a different partner type, essentially leading to partner-agnostic predictions (54,56,58,65–67). The cross-prediction in our scenario means that the residues that interact with the non-RNA partners (e.g. proteins and/or DNA) are predicted as RBRs. The cross-predictions can be attributed to the fact that predictors are typically developed with training datasets consisting solely of the RNA-binding proteins, with little or no representations of proteins that interact with the non-RNA partners. While a few recent predictors, such as NCBRPred, DRNApred and DisoRDPbind, were designed to reduce the amount of cross-predictions, recent literature suggests that this is a substantial challenge for the current predictors of RBRs (56,58).
To address these unresolved issues, we empirically evaluate a representative collection of disorder and structure-trained predictors on a new and low-similarity benchmark dataset that covers structure- and disordered-annotated proteins that interact with RNA and non-RNA partners. We measure and compare predictive performance, including the cross-predictions, on the whole test dataset and separately on the structure-annotated and disorder-annotated proteins. Moreover, inspired by the results of this empirical evaluation, we design, comparatively assess and release a new HybridRNAbind meta-predictor that combines results produced by the best disorder and structure-trained predictors to generate accurate predictions across all proteins.
MATERIALS AND METHODS
Selection of predictors
We consider a comprehensive set of disorder and structure-trained predictors that are published, available to the end users, and relatively fast. More specifically, we choose predictors that satisfy the following criteria: (i) generate predictions from a protein sequence; (ii) were available as webservers and/or source code as of September 2021 when we collected their predictions; (iii) produce predictions for an average length sequence in <30 min and (iv) generate outputs that include binary predictions (RBR vs. non-RBR) and real-valued propensities (likelihood that are given residue binds RNA). Screening the 31 predictors with these criteria resulted in selection of eight methods including six structure-trained predictors: Pprint (40), BindN+ (42), DRNApred (54), ProNA2020 (57), NCBRPred (58), and MTDsite (59); and two disorder-trained predictors: DisoRDPbind (60) and DeepDISObind (63). These eight tools cover multiple predictors published in the last two years (since 2020) and both disorder-trained methods, arguably representing state-of-the-art in this area. They apply a broad spectrum of predictive models and inputs. They include several relatively simple early tools, such as Pprint (2008) that applies support vector machine model and evolutionary information; BindN+ (2010) that similarly uses support vector machine and evolutionary information while adding inputs that quantify hydrophobicity, pKa and molecular mass/volume; DisoRDPbind (2015) that utilizes logistic regression with an extended set of inputs that include empirically selected physiochemical characteristics of amino acids and putative disorder and secondary structure; and DRNApred (2017) that relies on a two-layer logistic regression model and further extends inputs that cover evolutionary information, empirically selected physiochemical characteristics of amino acids, and putative disorder, secondary structure and disorder. The design of the newest methods focuses on applying more sophisticated predictive models. ProNA2020 (2020) uses a model that combines support vector machine, ProtVec neural network and homology-based prediction. NCBRPred (2021) and MTDsite (2021) apply deep neural networks with bidirectional recurrent units where the former includes a multi-label layer while the latter uses a multi-task layer to address predictions for multiple ligand types. Finally, DeepDISObind (2022) utilizes a hybrid deep neural network with convolutional and feed-forward units and a multi-task layer. We also note that the six structure-trained predictors rely on the training datasets that were extracted solely from PDB while the training datasets of the disorder-trained predictors were collected exclusively from DisProt (Supplementary Table S1).
Benchmark dataset
We develop a new benchmark dataset with the aim to satisfy several key characteristics: (i) it must include a balanced amount of proteins with the structure-annotated and disorder-annotated RBRs; (ii) contains a large number of residues that interact with non-RNA binding partners in order to evaluate cross-predictions; (iii) shares low sequence similarity with the training datasets of the selected predictors and (iv) has a similar rate of binding residues (RBRs and non-RNA binding residues) among structure-annotated versus disorder-annotated proteins. These characteristics ensure that we can reliably compare results from the structure-trained vs. disorder-trained predictors across the structure-annotated and disorder-annotated proteins, and that the methods are assessed fairly since the benchmark proteins share the same low similarity against their training data. With these criteria in mind, we first collect the structure-annotated proteins using PDB as the source database and BioLiP as the means to identify interacting residues. We focus on good-quality structures (i.e. crystal structures with resolution < 3 Å) in complex with RNA and other ligands and we map them into the full protein sequences from the UniProt (68) with SIFTS (69). This allows us to collect the most complete information where binding annotations for a given protein are extracted across all relevant PDB structures. We extract the disorder-based annotations of binding residues using DisProt and the procedure introduced in CAID (70). Finally, we collect the training datasets of the eight selected predictors: Pprint, BindN+, DRNApred, NCBRPred, ProNA2020, MTDsite, DisoRDPbind and DeepDISOBind. We summarize these training datasets in Supplementary Table S1. We cluster the combined set of the training, structure-annotated and disorder-annotated proteins using the NCBI’s BLASTclust with similarity <30% (71). To ensure that proteins used for evaluation share <30% with the training proteins, we develop the benchmark/test dataset using proteins from the clusters that do not include training proteins. As a result, for the smaller set of the disorder-annotated proteins, we obtain 25 RNA binding proteins and 195 proteins with other IDRs that do not include RBRs but may interact with other partners. We match this selection of the disorder-annotated proteins by selecting at random 25 structure-annotated RNA binding proteins and 195 structure-annotated proteins without RBRs. Consequently, the benchmark/test dataset consists of 440 proteins (220 disorder-annotated and 220 structure-annotated) with 175 278 residues that include 15% of binding residues. Detailed breakdown of the test dataset is summarized in Table 1. The dataset, including annotations of binding residues, is available at https://www.csuligroup.com/hybridRNAbind/. We use this benchmark dataset to evaluate predictive performance of the eight selected predictors and a new meta-predictor that we develop in this study. The meta predictor combines predictions generated from selected well-performing methods. It relies on a machine learning model that we train using the training datasets from these three methods. We note that these training datasets share low similarity to the test dataset, based on the above data collection procedure.
Table 1.
Summary of the test dataset
| Number of proteins | Number of residues | |||||
|---|---|---|---|---|---|---|
| Annotation type | All | RNA binding | Non-RNA binding | RNA binding | Binding other ligands | All |
| Structure | 220 | 25 | 195 | 1105 (3%) | 4520 (12%) | 36 740 (15%) |
| Disorder | 220 | 25 | 195 | 3011 (2%) | 18 456 (13%) | 138 538 (15%) |
| All proteins | 440 | 50 | 390 | 4116 (2%) | 22 876 (13%) | 175 278 (15%) |
Evaluation criteria
We use a broad range of metrics to offer a multifaceted analysis of predictive performance. The sequence-based predictors of RBRs output binary predictions (RBR vs non-RBR) and real-valued propensities that quantify likelihood that a given residue interacts with RNA. The binary predictions are typically derived from propensities using a threshold, i.e. residues with propensities ≥ threshold are denoted as RBRs, and otherwise they are labeled as non-RBRs. Inspired by the evaluations performed in several related studies (8,13,56,65,66,72), we assess the binary predictions using:
 |
(1) |
 |
(2) |
 |
(3) |
where TP (true positive) and TN (true negative) are the numbers of residues that are correctly predicted as RBRs and non-RBRs, respectively; FP (false positive) is the number of non-RBRs incorrectly predicted RBRs; FN (false negative) is the number of RBRs incorrectly identified as non-RBRs; and where  is the maximal value
  computed over all thresholds
  . Moreover, we further analyze the FPs to differentiate between residues that bind other types of ligands, which leads to the cross-predictions, and residues that do not bind ligands, which leads to over-predictions. Correspondingly, we use two metrics that were utilized in similar studies to quantify the rate of the cross-predictions and over-predictions (56,58,65,67):
 |
(4) |
 |
(5) |
where  is the number of residues interacting with other partners (i.e. proteins and DNA);
  is the number of residues interacting with other partners that are incorrectly predicted as RBRs;
  is the number of residues that do not interact with ligands; and
  is the number of residues that do not interact with ligands that are incorrectly predicted as RBRs.
We standardize the rate of binary predictions across the considered predictors to facilitate side-by-side comparisons. To do that, we set the thresholds that are used to derive the binary predictions to equalize either the sensitivity (TPR) or the specificity. We use several thresholds to offer multiple points of comparison by fixing TPR to 0.5 and 0.7, and by fixing specificity to 0.9 and 0.95, i.e. all methods are compared using binary predictions that correspond to the same TPR or specificity.
We assess the propensities with the Area Under receiver operating characteristic Curve (AUC), the Area under Cross-Prediction Curve (AUCPC) and the Area under Over-Prediction Curve (AUOPC), which were used in related studies concerning predictions of RBRs and protein-binding residues (58,65,67,73). The ROC curve plots TPRs against FPRs = FP/(FP + TN) that are computed with the thresholds that equal to unique values of propensities generated by a given predictor. The cross-prediction curve plots CPRs against TPRs and the over-prediction curve plots the OPRs against TPRs, which are computed using the same set of thresholds. The resulting AUCPC value evaluates whether residues interacting with non-RNA partners are predicted as RBRs while AUOPC assesses whether the non-interacting residues are predicted to bind RNA. Higher values of AUC indicate higher quality of predictions while lower values of AUCPC and AUOPC mean that the corresponding predictors generate fewer cross-predictions and over-predictions, respectively.
We compute one more metric that accommodates for the imbalanced nature of the test dataset where only ∼2% of residues interact with RNA. AULC quantifies the area under of ROC curve for low FPR values that are ≤ the native rate of the RBRs. This is the left-most part of the ROC curve where the amount of predictions of RBRs does not exceed the true rate of RBRs. Since AULC values are relatively small, we divide them by the AULC of a random predictor. AULCratio ≤1 when a given predictor is equivalent or worse than a random prediction, while AULCratio values >1 denote the rate by which a given method is better than random.
Finally, we measure statistical significance of differences between results produced by different predictors. This analysis aims to investigate whether improvements would hold over a wide range of different datasets. To do that, we randomly select 50% of the test proteins and repeat that 10 times, creating 10 substantially different datasets. Next, we measure performance on each of the 10 datasets and compare the resulting vectors across different predictors. If the measured values of performance are normal, as tested using the Kolmogorov–Smirnov test at the 0.05 P-value, we use the t-test to quantify significance of differences; otherwise, we apply the Wilcoxon rank-sum test.
RESULTS
Predictive performance of the current sequence-based predictors of RBRs
We compare predictive performance of the selected eight sequence-based predictors that include the two disorder-trained methods (DisoRDPbind and DeepDISOBind) and six structure-trained methods (Pprint, BindN+, DRNApred, NCBRPred, ProNA2020 and MTDsite) on the whole test dataset and on the subsets of the structure- and disorder-annotated proteins.
Results on the test set, which are shown at the bottom of Table 2, suggest that the predictive performance is relatively modest, i.e. the AUC values < 0.70. DeepDISObind secures the highest AUC = 0.69 while NCBRPred scores the highest AULCratio = 8.50. The latter suggests that NCBRPred is the best option when predicting with low FPR values, outperforming a random predictor by the 850%. The corresponding ROC curves, shown in Supplementary Figure S1A, indeed show that NCBRPred's curve is the best for FPR <0.15. Moreover, analysis of statistical significance (details are described in Section 2.3) shows that AUC of DeepDISObind is statistically higher that AUCs of all other current methods (P-value < 0.01), however, its AULCratio is significantly lower than the NCBRPred's AULCratio (p-value < 0.01). The binary metrics are similar to the results based on the threshold-free AUC, with NCBRPred, Pprint and DeepDISObind obtaining the highest values of sensitivity (at a given fixed specificity), specificity (as a given fixed sensitivity), and maxF1. Consistent with the AULCratio values, NCBRPred provides the highest sensitivity at the high specificity = 0.95 and 0.90, which correspond to FPR = 0.05 and 0.10, respectively.
Table 2.
Predictive performance of the eight selected sequence-based predictors of RBRs and the meta-predictor, HybridRNAbind, on the test dataset and the two subsets of the dataset that cover the structure-annotated and the disorder-annotated test proteins. The predictor with the highest AUC for each protein set is identified with the bold font. Results of the statistical significance test are shown next to the reported values using the ‘x/y’ format where x represent comparison against the current method with the best AUC (i.e. MTDsite for the structure-annotated proteins, and DeepDISOBind for the disorder-annotated proteins and the complete test set) and y represent comparison against HybridRNAbind; +/ = /− means that the best current predictor or HybridRNAbind is significantly better/not different/significantly worse than another method at p-value < 0.01
| TPR at | Specificity at | ||||||||
|---|---|---|---|---|---|---|---|---|---|
| Dataset | Predictor type | Predictor | AUC | AULCratio | Specificity = 0.90 | Specificity = 0.95 | TPR = 0.5 | TPR = 0.7 | maxF1 |
| Structure-annotated proteins | Structure-trained predictors | Pprint | 0.739+/+ | 8.401+/+ | 0.415+/+ | 0.296+/+ | 0.847+/+ | 0.637+/+ | 0.204+/+ |
| BindN+ | 0.477+/+ | 0.034+/+ | 0.067+/+ | 0.040+/+ | 0.469+/+ | 0.292+/+ | 0.058+/+ | ||
| DRNApred | 0.489+/+ | 3.677+/+ | 0.126+/+ | 0.090+/+ | 0.450+/+ | 0.242+/+ | 0.084+/+ | ||
| NCBRPred | 0.718+/+ | 20.488−/− | 0.507−/− | 0.434−/− | 0.905−/− | 0.581+/+ | 0.366−/− | ||
| ProNA2020 | 0.622+/+ | 15.600−/+ | 0.360+/+ | 0.360−/+ | 0.553+/+ | 0.439+/+ | 0.296−/+ | ||
| MTDsite | 0.762 /= | 10.047 /+ | 0.421 /+ | 0.304 /+ | 0.854 /= | 0.680 /− | 0.220 /+ | ||
| Disorder-trained predictors | DisoRDPbind | 0.681+/+ | 3.522+/+ | 0.276+/+ | 0.163+/+ | 0.735+/+ | 0.540+/+ | 0.123+/+ | |
| DeepDISObind | 0.637+/+ | 5.584+/+ | 0.199+/+ | 0.127+/+ | 0.689+/+ | 0.479+/+ | 0.124+/+ | ||
| Meta predictor | HybridRNAbind | 0.756 = / | 19.809−/ | 0.453−/ | 0.394−/ | 0.854 = / | 0.597+/ | 0.360−/ | |
| Disorder-annotated proteins | Structure-trained predictors | Pprint | 0.608+/+ | 3.954+/+ | 0.220+/+ | 0.133+/+ | 0.665+/+ | 0.436+/+ | 0.083+/+ |
| BindN+ | 0.500+/+ | 0.026+/+ | 0.090+/+ | 0.045+/+ | 0.507+/+ | 0.303+/+ | 0.042+/+ | ||
| DRNApred | 0.595+/+ | 2.696+/+ | 0.152+/+ | 0.092+/+ | 0.616+/+ | 0.443+/+ | 0.058+/+ | ||
| NCBRPred | 0.634+/+ | 3.268+/+ | 0.199+/+ | 0.116+/+ | 0.708+/+ | 0.627−/+ | 0.072+/+ | ||
| ProNA2020 | 0.452+/+ | 1.260+/+ | 0.113+/+ | 0.086+/+ | 0.432+/+ | 0.243+/+ | 0.056+/+ | ||
| MTDsite | 0.600+/+ | 3.332+/+ | 0.216+/+ | 0.129+/+ | 0.651+/+ | 0.419+/+ | 0.079+/+ | ||
| Disorder-trained predictors | DisoRDPbind | 0.558+/+ | 2.593+/+ | 0.153+/+ | 0.076+/+ | 0.545+/+ | 0.347+/+ | 0.057+/+ | |
| DeepDISObind | 0.716 /+ | 5.266 /− | 0.275 /= | 0.175 /= | 0.768 /= | 0.611 /+ | 0.102 /= | ||
| Meta predictor | HybridRNAbind | 0.724−/ | 5.028+/ | 0.276 = / | 0.171 = / | 0.769 = / | 0.653−/ | 0.102 = / | |
| All proteins | Structure-trained predictors | Pprint | 0.643+/+ | 5.331+/+ | 0.272−/+ | 0.172−/+ | 0.719+/+ | 0.442+/+ | 0.109−/+ |
| BindN+ | 0.494+/+ | 0.032+/+ | 0.085+/+ | 0.044+/+ | 0.496+/+ | 0.301+/+ | 0.046+/+ | ||
| DRNApred | 0.567+/+ | 2.916+/+ | 0.145+/+ | 0.092+/+ | 0.586+/+ | 0.394+/+ | 0.062+/+ | ||
| NCBRPred | 0.656+/+ | 8.503−/+ | 0.286−/+ | 0.199−/+ | 0.738 = /+ | 0.617−/+ | 0.132−/+ | ||
| ProNA2020 | 0.500+/+ | 4.519+/+ | 0.179+/+ | 0.160+/+ | 0.491+/+ | 0.294+/+ | 0.099+/+ | ||
| MTDsite | 0.643+/+ | 5.591+/+ | 0.270−/+ | 0.177−/+ | 0.719+/+ | 0.495+/+ | 0.112−/+ | ||
| Disorder-trained predictors | DisoRDPbind | 0.591+/+ | 2.830+/+ | 0.186+/+ | 0.103+/+ | 0.609+/+ | 0.401+/+ | 0.072+/+ | |
| DeepDISObind | 0.691 /+ | 5.629 /+ | 0.254 /+ | 0.165 /+ | 0.740 /+ | 0.577 /+ | 0.103 /+ | ||
| Meta predictor | HybridRNAbind | 0.733−/ | 9.545−/ | 0.328−/ | 0.237−/ | 0.788−/ | 0.673−/ | 0.150−/ | |
Interestingly, results on the structure-annotated and the disorder-annotated proteins are very different compared to the results on the entire test dataset. Table 2 reveals that DeepDISObind that obtains the highest AUC on the entire dataset (AUC = 0.69), secures accurate results on the disorder-annotated proteins (AUC = 0.72) while performing rather poorly on the structure-annotated proteins (AUC = 0.64). At the same time, the method with the best AUC on the structure-annotated proteins, MTDsite (AUC = 0.76), produces much worse results for the disorder-annotated proteins (AUC = 0.60). Supplementary Figure S1D and G shows ROC curves for the eight predictors on the structure-annotated and the disorder-annotated proteins, respectively. Using Table 2 and these figures, we find that only the structure-trained predictors provide accurate results for the structure-annotated proteins, i.e. the methods that secure AUC >0.70 and AULCratio >8.0 for these proteins are all structure-trained (Pprint, NCBRPred and MTDsite). Similarly, only a disorder-trained predictor performs well on the disorder-annotated proteins, with DeepDISObind being the only tool that secures AUC >0.70 and AULCratio >5.0 and all structure-trained predictors having AUC <0.64 and AULCratio <4.0. Analysis of statistical significance shows that values of AUC, AULCratio and maxF1 of the best structure-trained MTDsite are statistically better than the values of these metrics for both disorder-trained predictors on the structure-annotated proteins (P-value < 0.01). Similarly, AUC, AULCratio and maxF1 values of the best disorder-trained DeepDISObind are statistically better when compared to all structure-trained methods on the disorder-annotated proteins (P-value < 0.01).
Additionally, we evaluate these methods on a subset of the 50 RNA-binding proteins from the test dataset. This is in line with previous studies that typically consider datasets composed solely of RNA-binding proteins (7,10,12,40,42,58), which consequently feature higher rates of RBRs. The results on the RNA-binding proteins, which are summarized in Supplementary Table S2, point to similar conclusions as the results on the full test dataset. More specifically, the best result on the combined set of disorder- and structure-annotated RNA binding proteins is generated by DeepDISObind that secures AUC = 0.77. While the best result for the subset of the 25 disorder-annotated RNA binding proteins is secured by the disorder-trained DeepDISObind (AUC = 0.83), this method performs poorly on the 25 structure-annotated RNA binding proteins (AUC = 0.606). On the other hand, the structure-trained predictors that are inaccurate for the disorder-annotated RNA binding proteins (their AUCs range between 0.50 and 0.68), generate high-quality results for the structure-annotated proteins, with ProNA2020 obtaining the highest AUC = 0.75. The corresponding ROC curves are in Supplementary Figure S2A (for all RNA binding proteins), S2B (for the structure-annotated RNA binding proteins), and S2C (for the disorder-annotated RNA binding proteins).
We focus on the false positives, which we divide into the cross-predictions (residues that bind other ligands, such as proteins and DNA, predicted as RBRs) and over-predictions (non-binding residues predicted as RBRs). Table 3 summarizes the corresponding AUCPCs and AUOPCs where higher values indicate larger amounts of cross- and over-predictions, respectively, and values around 0.5 correspond to a near random predictive performance. There are only three methods that obtain AUCPC values < 0.4 on the test dataset, including Pprint, NCBRPred and DisoRDPbind. Black bars in Figure 1 provide further insights by computing ratios of the TPR to CPR. The ratios of around 1 suggest that a given method predicts RBRs among the residues that bind other ligands at rates that are similar to the rates for the native RBRs, essentially indiscriminately predicting all binding residues. Ratios >1 quantify the rate at which the correct predictions of RBRs improve over the CPRs. We find that several methods, such as DRNApred, BindN+, and DeepDISObind, are close to being ligand-agnostic predictors of all binding residues when tested on the test dataset.
Table 3.
Comparative assessment of the cross-predictions and the over-predictions of the eight selected sequence-based predictors of RBRs and the meta-predictor, HybridRNAbind, on the test dataset and the two subsets of the dataset that cover the structure-annotated and the disorder-annotated test proteins. The best results for each column are identified with the bold font. Results of the statistical significance test are shown next to the reported values using the ‘x/y’ format where x represent comparison against the current method with the best AUC (i.e. MTDsite for the structure-annotated proteins, and DeepDISOBind for the disorder-annotated proteins and the complete test set) and y represent comparison against HybridRNAbind; +/ = /− means that the best current predictor or HybridRNAbind is significantly better/not different/significantly worse than another method at P-value < 0.01
| Structure annotated proteins | Disorder annotated proteins | All proteins | |||||
|---|---|---|---|---|---|---|---|
| Predictor type | Predictor | AUCPC | AUOPC | AUCPC | AUOPC | AUCPC | AUOPC |
| Structure-trained | Pprint | 0.319−/+ | 0.253+/+ | 0.417−/+ | 0.387+/+ | 0.388−/+ | 0.351+/+ |
| BindN+ | 0.484+/+ | 0.528+/+ | 0.470+/+ | 0.504+/+ | 0.474+/+ | 0.510+/+ | |
| DRNApred | 0.552+/+ | 0.552+/+ | 0.418 = /+ | 0.402+/+ | 0.449+/+ | 0.429+/+ | |
| NCBRPred | 0.325−/+ | 0.276+/+ | 0.406−/= | 0.359+/+ | 0.385−/+ | 0.336+/+ | |
| ProNA2020 | 0.457+/+ | 0.367+/+ | 0.627+/+ | 0.534+/+ | 0.579+/+ | 0.486+/+ | |
| MTDsite | 0.333 /+ | 0.225 /− | 0.466+/+ | 0.389+/+ | 0.429+/+ | 0.345+/+ | |
| Disorder-trained | DisoRDPbind | 0.338 = /+ | 0.316+/+ | 0.364−/− | 0.453+/+ | 0.355−/− | 0.416+/+ |
| DeepDISObind | 0.333 = /+ | 0.367+/+ | 0.422 /+ | 0.259 /= | 0.419 /+ | 0.292 /+ | |
| Meta | HybridRNAbind | 0.263−/ | 0.242+/ | 0.403−/ | 0.256 = / | 0.368−/ | 0.252 −/ |
Figure 1.

Analysis of the cross-predictions and over-predictions based on TPR/CPR and TPR/OPR ratios measured on the test dataset. The predictions rely on thresholds where the specificity = 0.95. Predictors are sorted by their TPR/CPR values. Results for the disorder- and the structure-annotated proteins are in Supplementary Figure S3.
Next, we analyze the results for the structure-annotated versus disorder-annotated proteins. Black bars in Supplementary Figure S3A and B shows TPR to CPR ratios for the structure-annotated and disorder-annotated proteins, respectively. They reveal that DRNApred and BindN + provide indiscriminate predictions of all binding residues for the structure-annotated proteins (ratios < 1.5), while methods that are capable of selectively predicting RBRs for the disorder-annotated proteins (ratios > 1.5) include DisoRDPbind, DeepDISObind and Pprint. Furthermore, Table 3 demonstrates that Pprint, NCBRPred, MTDsite, DisoRDPbind and DeepDISObind have reasonably low AUCPC values (<0.34) for the structure-annotated proteins. However, only DisoRDPbind has AUCPC <0.4 for the disorder-annotated proteins, which makes it the sole method that provides low levels of cross-predictions across both structure- and disorder-annotated proteins. This reveals a substantial weakness of the other current tools.
Table 3, which measures over-predictions with AUOPC, shows that they are better/lower than the cross-predictions for the methods that make accurate predictions of RBRs in the first place. DeepDISObind secures the best AUOPC <0.3 on the test dataset, with AUOPC = 0.26 for the disorder-annotated proteins and a much higher AUOPC = 0.37 for the structure-annotated proteins, again showing substantially better results for the proteins for which this model was trained. Similarly, the best structure-trained predictors, such as MTDsite, Pprint and NCBRPred, secure AUOPC <0.28 for the structure-annotated proteins, coupled with a substantially worse AUOPCs ranging between 0.36 and 0.39 for the disorder-annotated proteins. We find similar observations using the TRP to OPR ratios that are summarized using gray bars in Figure 1 for the test dataset, and in Supplementary Figure S3A and B for the structure- and disorder-annotated proteins, respectively. The methods that secure the best ratios on the test dataset include NCBRPred, MTDsite, DeepDISObind, and Pprint. More interestingly, the best ratios for the structure-annotated proteins are secured by the structure-trained methods (ProNA2020, NCBRPred, MTDsite and Pprint), while by far the best result for the disorder-annotated proteins is obtained by the disorder-trained DeepDISObind.
To summarize, we observe modest levels of predictive performance on the test dataset. This can be explained by the dichotomy of the current methods that provide accurate results only for the proteins on which they were trained. More specifically, the best disorder-trained method (DeepDISObind) secures relatively strong results on the disorder-annotated proteins, but performs rather poorly for the structure-annotated proteins. On the other hand, the best structure-trained models (Pprint, NCBRPred and MTDsite) generate accurate results for the structure-annotated proteins while making inaccurate predictions for the disorder-annotated proteins. This agrees with recent results that show a similar pattern for the prediction of the protein-binding residues (65). We also observe relatively high levels of the cross-predictions, where some of the methods seem to indiscriminately predict all binding residues.
Residue-level analysis of the best disorder-trained and structure-trained predictors of RBRs
We investigate whether the pattern of structure-trained methods making accurate predictions solely for the structure-annotated proteins and disorder-trained predictors performing well for the disorder-annotated proteins extends across various amino acid types. We compute AUC values for predictions made by the accurate disorder-trained DeepDISObind for each of the 20 amino acid types, separately for the structure-annotated and disorder-annotated proteins. We similarly calculate the 20 AUC values for the averaged predictions produced by the three accurate structure-trained models, Pprint, NCBRPred and MTDsite, on both protein sets. Table 4 compares these results. We find that the disorder-trained predictions are more accurate than the structure-trained predictions across all amino acid types when tested on the disorder-annotated proteins (bold font in the last two columns in Table 4). Similarly, the structure-trained predictions outperform the disorder-trained predictions for virtually all amino acid types when evaluated on the structure-annotated proteins (bold font in the third and fourth columns in Table 4); the only exception is Tryptophan (W) for which both disorder and structure trained predictions are modestly accurate. Altogether, this analysis suggests that the pattern is universal across different residue types.
Table 4.
Comparative analysis of AUC scores produced by the accurate structure-trained and disorder-trained predictions of RBRs for each of the 20 amino acid types in the structure-annotated vs. disorder-annotated test proteins. The structure-trained predictions are computed as the average of the normalized results produced by the three accurate methods: Pprint, NCBRPred and MTDsite. The disorder-trained predictions are produced by the accurate DeepDISObind method. The amino acids are sorted based on their propensity for RNA binding that was estimated from the structure-annotated data, which is listed in the second column. The third column lists propensity for intrinsic disorder based on the TOP-IDP scale. Bold font identifies amino acids for which AUC is higher when comparing structure-trained versus disordered trained predictions for a given protein set
| Structure-annotated test proteins | Disorder-annotated test proteins | |||||
|---|---|---|---|---|---|---|
| Amino acid type | Propensity for RNA binding for structure-annotated data | Propensity for disorder (TOP-IDP scale) | Structure-trained predictions | Disorder-trained predictions | Structure-trained predictions | Disorder-trained predictions |
| R | 1.33 | 0.180 | 0.747 | 0.623 | 0.679 | 0.706 |
| M | 0.55 | -0.397 | 0.795 | 0.724 | 0.677 | 0.762 |
| H | 0.54 | 0.303 | 0.853 | 0.602 | 0.570 | 0.698 |
| K | 0.51 | 0.586 | 0.750 | 0.648 | 0.690 | 0.730 |
| F | 0.41 | -0.697 | 0.809 | 0.576 | 0.542 | 0.713 |
| Y | 0.33 | -0.510 | 0.798 | 0.649 | 0.616 | 0.762 |
| W | 0.30 | -0.884 | 0.599 | 0.668 | 0.596 | 0.662 |
| C | 0.17 | 0.020 | 0.921 | 0.571 | 0.576 | 0.671 |
| I | 0.11 | -0.486 | 0.740 | 0.665 | 0.582 | 0.756 |
| V | 0.06 | -0.121 | 0.780 | 0.740 | 0.530 | 0.661 |
| G | 0.04 | 0.166 | 0.811 | 0.664 | 0.594 | 0.730 |
| N | -0.10 | 0.007 | 0.758 | 0.560 | 0.641 | 0.774 |
| T | -0.10 | 0.059 | 0.801 | 0.635 | 0.588 | 0.717 |
| S | -0.14 | 0.341 | 0.828 | 0.572 | 0.649 | 0.740 |
| Q | -0.17 | 0.318 | 0.821 | 0.549 | 0.636 | 0.683 |
| L | -0.18 | -0.326 | 0.817 | 0.662 | 0.555 | 0.697 |
| A | -0.25 | 0.060 | 0.833 | 0.680 | 0.553 | 0.664 |
| P | -0.26 | 0.987 | 0.725 | 0.639 | 0.614 | 0.703 |
| D | -0.62 | 0.192 | 0.709 | 0.581 | 0.630 | 0.774 |
| E | -0.64 | 0.736 | 0.722 | 0.592 | 0.544 | 0.685 |
Interestingly, we note that the structure-trained predictions perform relatively well (AUC > 0.65) for the disorder-annotated proteins for three amino acids types: Arginine (R), Methionine (M) and Lysine (K); we identify them with underscore in Table 4. Using a recently published propensity scale for RNA binding that was estimated using PDB data (8), and which is available in the second column in Table 4, we find that these three amino acid types have high propensity for RNA binding. We hypothesize that the structure-trained methods can relatively accurately predict these residues in the disorder-annotated proteins since some of the RNA-binding interfaces that are included in their structure-annotated training dataset actually include disordered regions that fold upon interacting with RNA. This claim is supported by a recent analysis of the PDB structures that shows that many of the protein-RNA interfaces are in disordered regions (74). Similarly, we observe that disorder-trained predictions are reasonably accurate (AUC > 0.65) for the structure-annotated proteins for seven amino acids types including Valine (V), Methionine (M), Alanine (A), Tryptophan (W), Isoleucine (I), Glycine (G), and Leucine (L); we underscore them in Table 4. Using a popular TOP-IDP propensity scale for intrinsic disorder (75), which is shown in the third column in Table 4, we find that they exclude amino acids types that have high propensity for disorder (P, E, K, S, Q, and H). This can be explained based on a premise that these seven amino acids are likely to be structured in the disorder-annotated training datasets, and thus the disorder-trained predictors can transfer this part of the model onto the structure-annotated data. Collectively, these results suggest that at least part of these predictive models works across the structure-annotated and disorder-annotated data, supporting an idea to design a meta-predictor.
HybridRNAbind: novel meta-predictor of RBRs
The results summarized in Tables 2 and 3 suggest that none of the current methods works well for the ‘other’ type of annotations. Moreover, we find that DeepDISOBind achieves the best results for the disorder-annotated proteins (AUC > 0.7 and AULCratio > 5 in Table 2), while NCBRPred and MTDsite are the top two predictors for the structure-annotated proteins (AUC > 0.7 and AULCratio > 10 in Table 2). One potential reason why these methods perform well on their datasets is that they rely on the deep convolutional and/or recurrent neural networks that model sequence order information, in contrast to the other predictors that utilize less sophisticated models. This observation is supported by a recent study that empirically demonstrates that deep neural networks outperform other models for a related problem of sequence-based prediction of intrinsic disorder (76). Inspired by these observations, we investigate whether combining the best structure-trained and disorder-trained predictors could produce a meta-predictor that works well across both types of annotations, consequently providing more accurate predictions on the entire test dataset. We aim to combine a small number of the best methods to minimize the computational footprint of the meta-predictor.
To this end, we design a new meta-predictor, HybridRNAbind, that combines predictions of an accurate disorder-trained predictor (DeepDISObind) and an accurate structure-trained predictor (either NCBRPred or MTDsite). First, we normalize the range of propensities produced by each predictor to the unit interval using the min-max approach, where the threshold used to generate the binary predictions is mapped to 0.5. Based on Table 2, we consider two options to set the threshold, based on specificity = 0.9 and 0.95. Next, we fuse the predictions from two best methods (DeepDISObind and NCBRPred vs. DeepDISObind and MTDsite) to generate new scores that can potentially work for both disorder- and structure-annotated proteins.
We consider two alternatives: a simple consensus that combines predictions using heuristic rules and a machine learning model that is generated using training data. We formulate and compare two simple/rule-based consensuses: simple_average where the new score is an average of the two normalized scores; and merge_average where we use average of the two normalized scores if neither method predicts binding in binary and maximum of the two scores if at least one of the methods predicts binding in binary. The merge_average performs logical OR of the binary predictions of the two input methods, effectively merging the putative RBRs that they produce. This results in 2  2
2  2 = 8 configurations given the two types of rules (simple_average vs. merge_average), two pairs of input methods (DeepDISObind and NCBRPred vs. DeepDISObind and MTDsite), and two ways to derive binary predictions and normalization (specificity = 0.9 versus 0.95). The machine learning model-based approach applies three popular algorithms to produce meta-models using training datasets of the input predictors: DeepDISObind, NCBRPred and MTDsite. NCBRPred and MTDsite use the same training dataset (Supplementary Table S1), which we combine with the training dataset of DeepDISObind. We apply a simple logistic regression that implements a weighted average of the predictions and two more advanced algorithms: Random Forest (77) and XGBoost (78). We did not utilize more complex algorithms since the number of inputs features (i.e. predictions) is low. We parametrize Random Forest and XGBoost by performing a grid search based on the 3-fold cross-validation (at the protein level) on the training dataset; logistic regression does not need parametrization. For Random Forest, we consider number of trees = {15, 20, 50, 75, 100, 200} and max tree depth = {3, 4, 5, 6, 7}. For XGBoost we try number of trees = {15, 20, 50, 75, 100, 200}, max tree depth = {3, 4, 5, 6, 7} and learning rate = {0.1, 0.3}. We select parameters that produce the best AUC on the 3-fold cross-validation and in case of a tie we pick parameters that produce the smallest model. The selected parameters for Random Forest include number of trees = 15 and max depth = 5 when combining DeepDISObind and MTDsite, and number of trees = 100 and max depth = 4 when combining DeepDISObind and NCBRPred. For XGBoost, number of trees = 50, max depth = 3 and learning rate = 0.1 for the meta-predictor that ensembles DeepDISObind and MTDsite, and number of trees = 20, max depth = 3 and learning rate = 0.3 for DeepDISObind and NCBRPred. Supplementary Table S3 compares quality of predictions produced by the resulting meta-predictors including the simple/heuristic approaches and the three machine learning models. We find that combining DeepDISObind with NCBRPred generates higher predictive quality (higher AUCs and AULCratios) when compared with using DeepDISObind with MTDsite. For the heuristic meta-models, use of the higher specificity-based threshold slightly reduces over-predictions and, as expected, the merge_average generates more putative RBRs compared to the simple_average, as evidenced by higher AULCratios. XGBoost and Random Forest produce models that offer similar levels of predictive performance, with Random Forest having a small edge when evaluated on the dataset that includes both disorder- and structure-annotated proteins (AUC = 0.733 vs. 0.730 and AULCratio = 9.55 vs. 9.46). Both of these models are better than the simpler logistic regression (AUC = 0.728 and AULCratio = 9.37). The Random Forest model is also modestly more accurate than the best heuristic meta-model (AUC = 0.729 and AULCratio = 9.55). Altogether, these results suggest that the best configuration combines DeepDISObind and NCBRPred using the Random Forest model, which is the version that we use to implement HybridRNApred. Figure 2 shows a flowchart of HybridRNApred.
Figure 2.
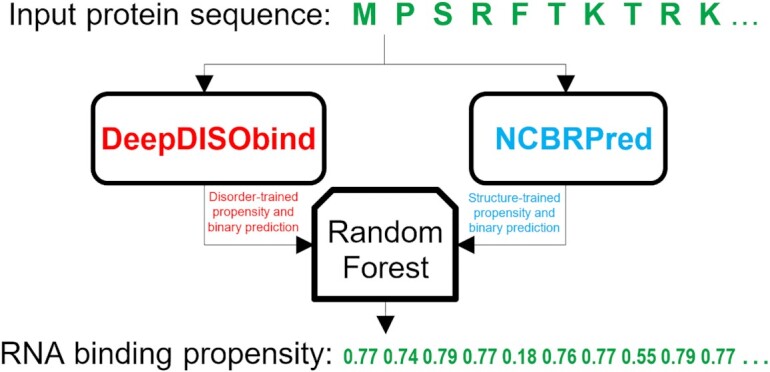
Flowchart of the HybridRNApred method.
Next, we empirically compare HybridRNApred to the current methods. Table 2 demonstrates that the new meta-predictor generates the most accurate results on the test dataset, with AUC = 0.73 and AULCratio = 9.55. These predictions are statistically better than the results of current methods (P-value < 0.01). TPR (i.e. sensitivity) of HybridRNApred reaches 0.33 when specificity is set to 0.9, which is statistically better than the TPRs of current methods that range between 0.09 and 0.29 (P-value < 0.01). We note that the sensitivity values can be raised by lowering the specificity and this relation is described by the ROC curves in Supplementary Figure S1A. Importantly, this figure reveals that HybridRNApred's ROC curve is consistently above the curves of the other tools (i.e. above over the entire range of specificity). We also find that HybridRNApred matches the predictive quality of the best disorder-trained DeepDISObind on the disorder-annotated proteins (AUC = 0.72 versus 0.72; AULCratio = 5.0 versus 5.3) while also having similar predictive performance to the best structure-trained MTDsite on the structure-annotated proteins (AUC = 0.76 versus 0.76; AULCratio = 19.8 versus 10.0). Similarly, when evaluating on the 50 RNA binding proteins from the test dataset (Supplementary Table S2), HybridRNApred obtains AUC = 0.80 and AULCratio = 5.4, which are statistically higher than the results of current methods (p-value < 0.01), with the second best DeepDISObind securing AUC = 0.77 and AULCratio = 4.4. Moreover, HybridRNApred performs similarly well when compared to the best disorder-trained predictor on the 25 disorder-annotated RNA binding test proteins (AUC = 0.83 versus 0.83; AULCratio = 5.2 versus 5.8) and to the best structure-trained predictor on the 25 structure-annotated RNA binding test proteins (AUC = 0.73 versus 0.75; AULCratio = 9.2 versus 7.1). We also perform assessment using precision-recall curves (see Supplement, Supplementary Figure S4, and Tables S4 and S5), and these results are highly correlated with the results based on AUC and AUCratio, producing similar conclusions. The ability to match performance of the best structure-based methods on the structure-annotated data and the best disorder-based methods on the disorder-annotated data stems from the underlying design that merges outputs of the best disorder-trained and structure-trained predictions.
Table 3, which focuses on the cross-predictions and over-predictions, demonstrates that HybridRNApred produces competitive results. For the structure-annotated proteins, HybridRNAbind's AUCPC and AUOPC are <0.3 and their average equals 0.252 versus the average of 0.279 for the second best MTDsite. Our meta-predictor also secures the lowest average of AUCPC and AUOPC for the disorder-annotated proteins (0.329 versus 0.340 of the second-best DeepDISObind) and on the complete test dataset (0.310 versus 0.355 of the second best DeepDISObind). Similar observations can be drawn based on the analysis of the TPR to CPR and the TPR to OPR ratios (Figure 1 and Supplementary Figure S3). Figure 1 demonstrates that HybridRNApred secures the highest TPR to OPR ratio (gray bars) and the second-best TPR to CPR ratio (black bars) on the test dataset. We conclude that HybridRNApred generates predictions with reasonably low cross-prediction and over-predictions rates, which follows from its overall high predictive quality. Altogether, we find that the new meta-predictor significantly outperforms the other methods on the test dataset while matching the results of the best disorder-trained/structure-trained methods on the disorder-annotated/disorder-annotated proteins and providing relatively low levels of cross-predictions.
Comparison with structure-based prediction of RBRs
Motivated by recent transformational advances in the protein structure prediction field (79,80), we compare the sequence-based methods, including HybridRNAbind, against a representative structure-based predictor of RBRs. We select a recently published PST-PRNA (81) since that this tool is readily available, computationally efficient and was shown to outperform other recent structure-based predictors, such as GraphBind (82) and NucleicNet (83). We predict structure of a given test protein sequence using AlphaFold 2 (80) and we use this putative structure as the input to PST-PRNA that predicts RBRs. We modify the test dataset to remove sequences that share >30% sequence similarity with the training dataset of PST-PRNA using the same procedure as we describe in the ‘Benchmark dataset’ section. The resulting test dataset, which shares low sequence similarity to the training data of all sequence-based predictors and PST-PRNA, includes 419 proteins, with 43 RNA-binding proteins. We remove only 21 proteins from the original test dataset. Table 5 summarizes results. The corresponding ROC curves are in Supplementary Figure S5. We find that the structure-based PST-PRNA generates the most accurate results for the structure-annotated proteins (AUC = 85 and AULCratio = 11.2), with HybridRNAbind securing second place (AUC = 0.83 and AULCratio = 32.4). The AUC of PST-PRNA is significantly better (P-value < 0.01) than AUCs of all other methods. This strong result can be attributed to the accurate predictions of structure by AlphaFold 2 combined with the high-quality results generated by PST-PRNA. We also note that HybridRNAbind, NCBRpred and ProNA2020 secure statistically better AULCratio values when compared with PST-PRNA (P-value < 0.01). The latter is due to the fact that these three sequence-based predictors obtain better/higher ROC curves when FPRs < 0.1 (Supplementary Figure S5B). However, PST-PRNA performs only modestly well for the disorder-annotated proteins, with AUC of 0.61 and AULCratio = 3.5, while HybridRNAbind (AUC = 0.71) and DeepDISObind (AUC = 0.70) perform well for these proteins. When using the entire dataset, HybridRNAbind produces the most accurate predictions (AUC = 0.74 and AULCratio = 8.1) when compared to the other methods that include PST-PRNA (AUC = 0.66 and AULCratio = 3.9) and the second-best DeepDISObind (AUC = 0.68 and AULCratio = 4.9) (P-value < 0.01). Altogether, our analysis reveals that the structure-based PST-PRNA offers similarly limited predictive performance as the sequence-based and structure-trained predictors of RBRs for the disorder-annotated proteins. This is because the predicted structure for the disordered regions located in the disorder-annotated proteins may has low quality and/or since PST-PRNA was trained on the structure-annotated proteins and thus it could not learn how to predict the disorder-annotated proteins.
Table 5.
Predictive performance of the eight selected sequence-based predictors of RBRs, HybridRNAbind and the structure-based PST-PRNA on the version of the test dataset that excludes proteins similar to the training dataset of PST-PRNA and the two subsets of this dataset that include the structure-annotated and the disorder-annotated test proteins. The predictor with the highest AUC for each protein set is identified with the bold font. Results of the statistical significance test are shown next to the reported values using the ‘x/y’ format where x represent comparison against the current method with the best AUC (i.e. PST-PRNA for the structure-annotated proteins, DeepDISOBind for the disorder-annotated proteins, and NCBRPred for the complete test set) and y represent comparison against HybridRNAbind; +/ = /– means that the best current predictor or HybridRNAbind is significantly better/not different/significantly worse than another method at P-value < 0.01
| Structure-annotated proteins | Disorder-annotated proteins | All proteins | |||||
|---|---|---|---|---|---|---|---|
| Predictor type | Predictor | AUC | AULCratio | AUC | AULCratio | AUC | AULCratio |
| Structure-trained predictors | Pprint | 0.775+/+ | 8.951+/+ | 0.604+/+ | 3.411+/+ | 0.632+/+ | 4.280+/+ |
| BindN+ | 0.455+/+ | 0.012+/+ | 0.493+/+ | 0.019+/+ | 0.487+/+ | 0.017+/+ | |
| DRNApred | 0.494+/+ | 0.001+/+ | 0.614+/+ | 2.832+/+ | 0.592+/+ | 2.574+/+ | |
| NCBRPred | 0.847 = /= | 32.218−/= | 0.656+/+ | 2.734+/+ | 0.684 /+ | 6.432 /+ | |
| ProNA2020 | 0.598+/+ | 12.509−/+ | 0.413+/+ | 1.129+/+ | 0.440+/+ | 1.895+/+ | |
| MTDsite | 0.787+/+ | 10.017 = /+ | 0.576+/+ | 2.833+/+ | 0.609+/+ | 3.898+/+ | |
| Disorder-trained predictors | DisoRDPbind | 0.664+/+ | 3.323+/+ | 0.520+/+ | 2.980+/+ | 0.536+/+ | 3.061+/+ |
| DeepDISObind | 0.566+/+ | 0.723+/+ | 0.704 /+ | 5.140 /= | 0.683 = /+ | 4.927+/+ | |
| Structure-based predictor | PST-PRNA | 0.851 /− | 11.165 /+ | 0.613+/+ | 3.534+/+ | 0.658+/+ | 3.937+/+ |
| Meta predictor | HybridRNAbind | 0.832+/ | 32.351−/ | 0.713−/ | 4.856 = / | 0.738−/ | 8.097−/ |
Analysis of predicted RBRs
Annotation of RBRs, particularly for the structure-annotated proteins, relies on a somehow arbitrary approach where a given amino acid is assumed to bind RNA if at least one of its atoms is close enough to one of the RNA atoms. For instance, the most-recent structure-trained MTDsite uses the 3.5 Å cutoff for the maximal distance (59), while BioLiP applies a more sophisticated approach where the maximal distance is computed as 0.5 Å plus the sum of the Van der Waal's radii of the two closest atoms, one from protein and one from RNA (5). These discrepancies inevitably lead to slightly different annotations of native RBRs for the same protein. Consequently, we investigate whether predictions are sensitive to these differences by analyzing whether the false positives (incorrectly predicted putative RBRs) are localized nearby the native RBRs. In other words, RBRs predicted for the amino acids adjacent to the native RBRs in the sequence could be driven by the threshold-dependent nature of annotations, and perhaps should not be treated as mistakes.
Figure 3 analyzes the presence of putative RBRs in the vicinity of the native RBRs in the sequence; we cannot perform this analysis using proximity in the structure since some annotations concern disordered regions. The x-axis defines the number of positions between the residues that we analyze and the nearest native RBRs while the y-axis quantifies the corresponding TPRs assuming that the putative RBRs that are within the distance defined by the x-axis are correct. In other words, TPRs for x = 0 are the same as the values reported in Table 2 while for x = 1, 2 and 3 they also count the putative RBRs localized close to the native RBRs as true positives. We cover the best performing predictors (HybridRNAbind, NCBRPred, MTDsite and DeepDISOBind) and define the binary predictions based on the same two thresholds that we apply in Table 2 (i.e. specificity = 0.90 and 0.95).
Figure 3.

TPR values (y-axis) in the function of the number of positions in the sequence between the evaluated residues and the nearest native RBRs (x-axis). TPRs are computed by assuming that putative RBRs that are within a given number of positions away from the native RBR are correct. We cover the best color-coded predictors selected based on Table 2 including HybridRNAbind (black), NCBRPred (orange), MTDsite (green) and DeepDISOBind (purple). The TPRs are based on two specificity-based thresholds of 0.9 (solid lines) and 0.95 (dashed lines).
Interestingly, we find that a substantial number of putative RBRs generated by each of these methods is located immediately adjacent to a native RBR in the sequence. This is apparent based on the substantial increase in the TPRs between x = 0 and x = 1. For instance, TPR measured at specificity = 0.90 for HybridRNApred's TPR grows from 0.33 to 0.40 and for MTDsite from 0.27 to 0.39. The pace of the increase slows considerably for x = 2 and x = 3, i.e. TPR for HybridRNApred grows to 0.44 and 0.46 and for MTDsite to 0.45 and 0.50, respectively. This means that ‘false positives’ in the positions adjacent to the native RBRs are much more frequent than for the positions further away. In turn, this suggests that some of the false positives that we categorize as over-predictions might be caused by the divergent approaches used to annotate binding residues and could in fact correspond to correct predictions. This result concurs with recent studies that similarly found a substantial increase in the ‘false positives’ near the sites of native proteins and nucleic acids binding residues (54,84). The bottom line is that the predictive performance that we quantify in Table 2 is likely an underestimate of the actual quality, given the variability in how RBR are annotated.
Case study
We illustrate predictions generated by the new meta predictor and the two well-performing methods that HybridRNAbind uses as inputs, DeepDISObind and NCBRpred, for one of the test proteins, the 60S ribosomal protein L28 (UniProt ID: P02406). This example, which we visualize in Figure 4A, aims to exemplify differences between the meta-predictions and their inputs. This protein includes multiple RNA-binding regions including the long region at the N-terminus (M1 to K47), a medium-size binding region in the middle of the sequence (K55 to E84), and a couple of short regions towards the C-terminus (L113 to I118 and S131 to L133). A large fragment of the long region (M1 to H39) is intrinsically disordered based on the annotations from the MobiDB database (17). This is likely why the disorder-trained DeepDISObind predicts these residues as RBRs. The medium-size and both short binding regions are located in the structured part of this protein, and correspondingly the structure-trained NCBRPred identifies majority of these RBRs. The new meta predictor combines the results from DeepDISObind and NCBRPred in a way that results in improvements compared to using each of these two methods individually. HybridRNApred mimics the predictions from both input predictors for the long binding region where both methods produce high propensity values; fixes the DeepDISObind's underprediction of the structured medium-size region by using the more accurate results from NCBRPred; and reduces the overprediction of RBRs (i.e. number of false positives) near the C-terminus produced by NCBRpred by utilizing the low scores from DeepDISObind. Figure 4B maps the sequence-based predictions from HybridRNAbind into the structure of the L28 protein in complex with the ribosomal RNA. It shows that the correct predictions of RBRs (true positives that are shown in green) are located along the part of the protein that is embedded into the RNA while the correct predictions of non-RBRs (true negatives in grey) cluster in the fragment of the protein that extends outside. Altogether, this case study demonstrates effectiveness of the approach utilized by our meta-predictor.
Figure 4.

Predictions of RBRs for the 60S ribosomal protein L28 (UniProt ID: P02406). Panel A visualizes the putative propensities and binary predictions where the horizontal axis corresponds to the protein sequence. The black horizontal bar below the axis shows annotations of the native RBRs. Results produced by different predictors are color-coded, where DeepDISOBind and NCBRPred are shown in blue and orange, respectively. Predictions from hybridRNAbind are encoded in green, red, yellow and gray for true positives (TPs), false positives (FPs), false negatives (FNs), and true negatives (TNs), respectively. The plots in the top panel show the putative propensity scores (solid color-coded lines) while the horizontal bars underneath give the corresponding binary predictions. Panel B show two sides of the corresponding structure of this protein in complex with RNA that is available in PDB (PDB ID: 4v88). The structures are drawn using Pymol. RNA is cropped to include all fragments that are in contact with this protein. Predictions from hybridRNAbind are color-coded in the proteins structure (green, red, yellow and gray) using the color schema described for panel A.
Webserver
Motivated by the fact that HybridRNAbind produces favorable predictive quality and given its relatively low computational footprint, we implemented it as a convenient webserver that is freely available at https://www.csuligroup.com/hybridRNAbind/. The server automates the entire prediction process by running DeepDISObind and NCBRPred and combining their predictions using the Random Forest-based model. Users simply need to provide the input protein sequence(s) in FASTA format and collect the resulting residue-level propensities and binary predictions generated by HybridRNApred. Moreover, the webserver allows for batch jobs of up to 10 proteins and provides notifications by email when the requested predictions are ready.
DISCUSSION
Sequence-based predictors of RBRs fall into two distinct sub-groups: those trained on the structure-annotated proteins vs. disorder-annotated proteins. Motivated by a recent study that analyzes predictors of protein binding residues (65), we perform a comprehensive comparative study that investigates a representative collection of both sub-groups of predictors of RBRs using a low-similarity benchmark dataset that covers structure and disorder-annotated proteins.
We find that current predictors of RBRs deliver modest levels of predictive performance. This can be explained by our empirical observation that they provide accurate results only for the proteins that they were trained on. More specifically, the disorder-trained methods perform well on the disorder-annotated proteins, which are consistent with their training dataset, whereas they produce relatively poor-quality predictions for the structure-annotated proteins since structure-annotated proteins were not included in their training datasets. Similarly, the structure-trained methods generate accurate results for the structure-annotated proteins while underperforming for the disorder-annotated proteins. This could be potentially fixed by developing new tools that are trained on both structure-annotated and disorder-annotated proteins. We find that their predictions are characterized by relatively high levels of cross-predictions, with some methods indiscriminately predicting residues that bind any ligand type. Moreover, we show that a representative structure-based predictor of RBRs that relies on putative structures generated by AlphaFold 2 produces accurate results on the structure-annotated proteins, while underperforming for the disorder-annotated proteins.
We devise a solution to these problems by designing, testing and deploying the HybridRNAbind meta-predictor that combines results produced by the best structure- and disorder-trained methods. HybridRNAbind statistically outperforms the current methods, including the structure-based predictor, and provides relatively low levels of cross-predictions. It matches results of the best disorder-trained predictors on the disorder-annotated proteins and the best structure-trained predictors on the structure-annotated proteins. We release HybridRNAbind as a convenient and freely available webserver at https://www.csuligroup.com/hybridRNAbind/.
Moreover, our empirical analysis of the results produced by the current methods and the new meta-model finds that false positives are much more frequent in the sequence positions adjacent to the native RBRs when compared to the positions further away in the sequence. Given the somehow arbitrary (i.e. threshold-dependent) nature of annotations of binding residues, this result suggests that some of these false positives might correspond to correct predictions. This agrees with similar analyses done for the prediction of the protein and nucleic acids binding residues (54,84), and indicates that the measured predictive performance likely underestimates the actual performance.
DATA AVAILABILITY
The datasets are available at https://www.csuligroup.com/hybridRNAbind/.
Supplementary Material
Contributor Information
Fuhao Zhang, Hunan Provincial Key Lab on Bioinformatics, School of Computer Science and Engineering, Central South University, Changsha 410083, China.
Min Li, Hunan Provincial Key Lab on Bioinformatics, School of Computer Science and Engineering, Central South University, Changsha 410083, China.
Jian Zhang, School of Computer and Information Technology, Xinyang Normal University, Xinyang 464000, China.
Lukasz Kurgan, Department of Computer Science, Virginia Commonwealth University, Richmond, VA 23284, USA.
SUPPLEMENTARY DATA
Supplementary Data are available at NAR Online.
FUNDING
National Natural Science Foundation of China [61832019, in part]; 111 Project [B18059]; Science and Technology Innovation Program of Hunan Province [2021RC0048]; Hunan Provincial Science and Technology Program [2019CB1007]; L.K. was supported in part by the Robert J. Mattauch Endowed Chair funds. Funding for open access charge: National Natural Science Foundation of China.
Conflict of interest statement. None declared.
REFERENCES
- 1. Charoensawan V., Wilson D., Teichmann S.A.. Genomic repertoires of DNA-binding transcription factors across the tree of life. Nucleic Acids Res. 2010; 38:7364–7377. [DOI] [PMC free article] [PubMed] [Google Scholar]
- 2. Glisovic T., Bachorik J.L., Yong J., Dreyfuss G.. RNA-binding proteins and post-transcriptional gene regulation. FEBS Lett. 2008; 582:1977–1986. [DOI] [PMC free article] [PubMed] [Google Scholar]
- 3. Kelaini S., Chan C., Cornelius V.A., Margariti A.. RNA-Binding proteins hold key roles in function, dysfunction, and disease. Biology (Basel). 2021; 10:366. [DOI] [PMC free article] [PubMed] [Google Scholar]
- 4. wwPDB consortium Protein data bank: the single global archive for 3D macromolecular structure data. Nucleic Acids Res. 2019; 47:D520–D528. [DOI] [PMC free article] [PubMed] [Google Scholar]
- 5. Yang J., Roy A., Zhang Y.. BioLiP: a semi-manually curated database for biologically relevant ligand–protein interactions. Nucleic Acids Res. 2012; 41:D1096–D1103. [DOI] [PMC free article] [PubMed] [Google Scholar]
- 6. Quaglia F., Meszaros B., Salladini E., Hatos A., Pancsa R., Chemes L.B., Pajkos M., Lazar T., Pena-Diaz S., Santos J.et al.. DisProt in 2022: improved quality and accessibility of protein intrinsic disorder annotation. Nucleic Acids Res. 2022; 50:D480–D487. [DOI] [PMC free article] [PubMed] [Google Scholar]
- 7. Yan J., Friedrich S., Kurgan L.. A comprehensive comparative review of sequence-based predictors of DNA-and RNA-binding residues. Brief. Bioinf. 2016; 17:88–105. [DOI] [PubMed] [Google Scholar]
- 8. Zhang J., Ma Z., Kurgan L.. Comprehensive review and empirical analysis of hallmarks of DNA-, RNA- and protein-binding residues in protein chains. Brief. Bioinform. 2019; 20:1250–1268. [DOI] [PubMed] [Google Scholar]
- 9. Zhao H., Yang Y., Zhou Y.. Prediction of RNA binding proteins comes of age from low resolution to high resolution. Mol. Biosyst. 2013; 9:2417–2425. [DOI] [PMC free article] [PubMed] [Google Scholar]
- 10. Walia R.R., Caragea C., Lewis B.A., Towfic F., Terribilini M., El-Manzalawy Y., Dobbs D., Honavar V.. Protein-RNA interface residue prediction using machine learning: an assessment of the state of the art. BMC Bioinf. 2012; 13:89. [DOI] [PMC free article] [PubMed] [Google Scholar]
- 11. Puton T., Kozlowski L., Tuszynska I., Rother K., Bujnicki J.M.. Computational methods for prediction of protein-RNA interactions. J. Struct. Biol. 2012; 179:261–268. [DOI] [PubMed] [Google Scholar]
- 12. Si J., Cui J., Cheng J., Wu R.. Computational prediction of RNA-binding proteins and binding sites. Int. J. Mol. Sci. 2015; 16:26303–26317. [DOI] [PMC free article] [PubMed] [Google Scholar]
- 13. Wang K., Hu G., Wu Z., Su H., Yang J., Kurgan L.. Comprehensive survey and comparative assessment of RNA-Binding residue predictions with analysis by RNA type. Int. J. Mol. Sci. 2020; 21:6879. [DOI] [PMC free article] [PubMed] [Google Scholar]
- 14. Su H., Liu M., Sun S., Peng Z., Yang J.. Improving the prediction of protein–nucleic acids binding residues via multiple sequence profiles and the consensus of complementary methods. Bioinformatics. 2019; 35:930–936. [DOI] [PubMed] [Google Scholar]
- 15. Yang X., Wang J., Sun J., Liu R.. SNBRFinder: a sequence-based hybrid algorithm for enhanced prediction of nucleic acid-binding residues. PLoS One. 2015; 10:e0133260. [DOI] [PMC free article] [PubMed] [Google Scholar]
- 16. Walia R.R., Xue L.C., Wilkins K., El-Manzalawy Y., Dobbs D., Honavar V.. RNABindRPlus: a predictor that combines machine learning and sequence homology-based methods to improve the reliability of predicted RNA-binding residues in proteins. PLoS One. 2014; 9:e97725. [DOI] [PMC free article] [PubMed] [Google Scholar]
- 17. Piovesan D., Necci M., Escobedo N., Monzon A.M., Hatos A., Micetic I., Quaglia F., Paladin L., Ramasamy P., Dosztanyi Z.et al.. MobiDB: intrinsically disordered proteins in 2021. Nucleic Acids Res. 2021; 49:D361–D367. [DOI] [PMC free article] [PubMed] [Google Scholar]
- 18. Uversky V.N., Gillespie J.R., Fink A.L.. Why are “natively unfolded” proteins unstructured under physiologic conditions?. Proteins Struct. Funct. Bioinf. 2000; 41:415–427. [DOI] [PubMed] [Google Scholar]
- 19. Oldfield C.J., Uversky V.N., Dunker A.K., Kurgan L.. Salvi N. Intrinsically Disordered Proteins. 2019; Academic Press; 1–34. [Google Scholar]
- 20. Lieutaud P., Ferron F., Uversky A.V., Kurgan L., Uversky V.N., Longhi S.. How disordered is my protein and what is its disorder for? A guide through the ‘dark side’ of the protein universe. Intrinsically Disord. Proteins. 2016; 4:e1259708. [DOI] [PMC free article] [PubMed] [Google Scholar]
- 21. Xue B., Dunker A.K., Uversky V.N.. Orderly order in protein intrinsic disorder distribution: disorder in 3500 proteomes from viruses and the three domains of life. J. Biomol. Struct. Dyn. 2012; 30:137–149. [DOI] [PubMed] [Google Scholar]
- 22. Ward J.J., Sodhi J.S., McGuffin L.J., Buxton B.F., Jones D.T.. Prediction and functional analysis of native disorder in proteins from the three kingdoms of life. J. Mol. Biol. 2004; 337:635–645. [DOI] [PubMed] [Google Scholar]
- 23. Peng Z., Yan J., Fan X., Mizianty M.J., Xue B., Wang K., Hu G., Uversky V.N., Kurgan L.. Exceptionally abundant exceptions: comprehensive characterization of intrinsic disorder in all domains of life. Cell. Mol. Life Sci. 2015; 72:137–151. [DOI] [PMC free article] [PubMed] [Google Scholar]
- 24. Yan J., Mizianty M.J., Filipow P.L., Uversky V.N., Kurgan L.. RAPID: fast and accurate sequence-based prediction of intrinsic disorder content on proteomic scale. Biochim. Biophys. Acta. 2013; 1834:1671–1680. [DOI] [PubMed] [Google Scholar]
- 25. Zhao B., Katuwawala A., Uversky V.N., Kurgan L.. IDPology of the living cell: intrinsic disorder in the subcellular compartments of the human cell. Cell Mol. Life Sci. 2020; 78:2371–2385. [DOI] [PMC free article] [PubMed] [Google Scholar]
- 26. Kurgan L. Resources for computational prediction of intrinsic disorder in proteins. Methods. 2022; 204:132–141. [DOI] [PubMed] [Google Scholar]
- 27. Zhao B., Katuwawala A., Oldfield C.J., Hu G., Wu Z., Uversky V.N., Kurgan L.. Intrinsic disorder in human RNA-Binding proteins. J. Mol. Biol. 2021; 433:167229. [DOI] [PubMed] [Google Scholar]
- 28. Balcerak A., Trebinska-Stryjewska A., Konopinski R., Wakula M., Grzybowska E.A.. RNA-protein interactions: disorder, moonlighting and junk contribute to eukaryotic complexity. Open Biol. 2019; 9:190096. [DOI] [PMC free article] [PubMed] [Google Scholar]
- 29. Wang C., Uversky V.N., Kurgan L.. Disordered nucleiome: abundance of intrinsic disorder in the DNA- and RNA-binding proteins in 1121 species from eukaryota, bacteria and archaea. Proteomics. 2016; 16:1486–1498. [DOI] [PubMed] [Google Scholar]
- 30. Basu S., Bahadur R.P.. A structural perspective of RNA recognition by intrinsically disordered proteins. Cell. Mol. Life Sci. 2016; 73:4075–4084. [DOI] [PMC free article] [PubMed] [Google Scholar]
- 31. Varadi M., Zsolyomi F., Guharoy M., Tompa P.. Functional advantages of conserved intrinsic disorder in RNA-binding proteins. PLoS One. 2015; 10:e0139731. [DOI] [PMC free article] [PubMed] [Google Scholar]
- 32. Calabretta S., Richard S.. Emerging roles of disordered sequences in RNA-Binding proteins. Trends Biochem. Sci. 2015; 40:662–672. [DOI] [PubMed] [Google Scholar]
- 33. Chowdhury S., Zhang J., Kurgan L.. In silico prediction and validation of novel RNA binding proteins and residues in the human proteome. Proteomics. 2018; 18:e1800064. [DOI] [PubMed] [Google Scholar]
- 34. Jeong E., Chung I.-F., Miyano S.. A neural network method for identification of RNA-interacting residues in protein. Genome Informatics. 2004; 15:105–116. [PubMed] [Google Scholar]
- 35. Wang L., Brown S.J.. BindN: a web-based tool for efficient prediction of DNA and RNA binding sites in amino acid sequences. Nucleic Acids Res. 2006; 34:W243–W248. [DOI] [PMC free article] [PubMed] [Google Scholar]
- 36. Jeong E., Miyano S.. Transactions on Computational Systems Biology IV. 2006; Springer; 123–139. [Google Scholar]
- 37. Terribilini M., Sander J.D., Lee J.-H., Zaback P., Jernigan R.L., Honavar V., Dobbs D. RNABindR: a server for analyzing and predicting RNA-binding sites in proteins. Nucleic Acids Res. 2007; 35:W578–W584. [DOI] [PMC free article] [PubMed] [Google Scholar]
- 38. Wang Y., Xue Z., Shen G., Xu J.. PRINTR: prediction of RNA binding sites in proteins using SVM and profiles. Amino Acids. 2008; 35:295–302. [DOI] [PubMed] [Google Scholar]
- 39. Tong J., Jiang P., Lu Z.-h.. RISP: a web-based server for prediction of RNA-binding sites in proteins. Comput. Methods Programs Biomed. 2008; 90:148–153. [DOI] [PubMed] [Google Scholar]
- 40. Kumar M., Gromiha M.M., Raghava G.P.S.. Prediction of RNA binding sites in a protein using SVM and PSSM profile. Proteins Struct. Funct. Bioinf. 2008; 71:189–194. [DOI] [PubMed] [Google Scholar]
- 41. Cheng C.-W., Su E.C.-Y., Hwang J.-K., Sung T.-Y., Hsu W.-L.. Predicting RNA-binding sites of proteins using support vector machines and evolutionary information. BMC Bioinf. 2008; 9(Suppl. 12):S6. [DOI] [PMC free article] [PubMed] [Google Scholar]
- 42. Wang L., Huang C., Yang M.Q., Yang J.Y.. BindN+ for accurate prediction of DNA and RNA-binding residues from protein sequence features. BMC Syst. Biol. 2010; 4:S3. [DOI] [PMC free article] [PubMed] [Google Scholar]
- 43. Carson M.B., Langlois R., Lu H.. NAPS: a residue-level nucleic acid-binding prediction server. Nucleic Acids Res. 2010; 38:W431–W435. [DOI] [PMC free article] [PubMed] [Google Scholar]
- 44. Murakami Y., Spriggs R.V., Nakamura H., Jones S.. PiRaNhA: a server for the computational prediction of RNA-binding residues in protein sequences. Nucleic Acids Res. 2010; 38:W412–W416. [DOI] [PMC free article] [PubMed] [Google Scholar]
- 45. Huang Y.-F., Chiu L.-Y., Huang C.-C., Huang C.-K.. BMC Genomics. 2010; 11:Springer; 1–11. [DOI] [PMC free article] [PubMed] [Google Scholar]
- 46. Zhang T., Zhang H., Chen K., Ruan J., Shen S., Kurgan L.. Analysis and prediction of RNA-binding residues using sequence, evolutionary conservation, and predicted secondary structure and solvent accessibility. Curr. Protein Pept. Sci. 2010; 11:609–628. [DOI] [PubMed] [Google Scholar]
- 47. Liu Z.-P., Wu L.-Y., Wang Y., Zhang X.-S., Chen L.. Prediction of protein–RNA binding sites by a random forest method with combined features. Bioinformatics. 2010; 26:1616–1622. [DOI] [PubMed] [Google Scholar]
- 48. Ma X., Guo J., Wu J., Liu H., Yu J., Xie J., Sun X.. Prediction of RNA-binding residues in proteins from primary sequence using an enriched random forest model with a novel hybrid feature. Proteins Struct. Funct. Bioinf. 2011; 79:1230–1239. [DOI] [PubMed] [Google Scholar]
- 49. Choi S., Han K.. Bmc Bioinformatics. 2011; 12:BioMed Central; 1–12. [DOI] [PMC free article] [PubMed] [Google Scholar]
- 50. Li S., Yamashita K., Amada K.M., Standley D.M.. Quantifying sequence and structural features of protein–RNA interactions. Nucleic Acids Res. 2014; 42:10086–10098. [DOI] [PMC free article] [PubMed] [Google Scholar]
- 51. Ren H., Shen Y.. RNA-binding residues prediction using structural features. BMC Bioinf. 2015; 16:249. [DOI] [PMC free article] [PubMed] [Google Scholar]
- 52. Tuvshinjargal N., Lee W., Park B., Han K.. PRIdictor: protein–RNA interaction predictor. Biosystems. 2016; 139:17–22. [DOI] [PubMed] [Google Scholar]
- 53. Sun M., Wang X., Zou C., He Z., Liu W., Li H.. Accurate prediction of RNA-binding protein residues with two discriminative structural descriptors. BMC Bioinf. 2016; 17:231. [DOI] [PMC free article] [PubMed] [Google Scholar]
- 54. Yan J., Kurgan L.. DRNApred, fast sequence-based method that accurately predicts and discriminates DNA- and RNA-binding residues. Nucleic. Acids. Res. 2017; 45:e84. [DOI] [PMC free article] [PubMed] [Google Scholar]
- 55. Tang Y., Liu D., Wang Z., Wen T., Deng L.. A boosting approach for prediction of protein-RNA binding residues. BMC Bioinf. 2017; 18:465. [DOI] [PMC free article] [PubMed] [Google Scholar]
- 56. Su H., Liu M., Sun S., Peng Z., Yang J.. Improving the prediction of protein-nucleic acids binding residues via multiple sequence profiles and the consensus of complementary methods. Bioinformatics. 2019; 35:930–936. [DOI] [PubMed] [Google Scholar]
- 57. Qiu J., Bernhofer M., Heinzinger M., Kemper S., Norambuena T., Melo F., Rost B.. ProNA2020 predicts protein–DNA, protein–RNA, and protein–protein binding proteins and residues from sequence. J. Mol. Biol. 2020; 432:2428–2443. [DOI] [PubMed] [Google Scholar]
- 58. Zhang J., Chen Q., Liu B.. NCBRPred: predicting nucleic acid binding residues in proteins based on multilabel learning. Brief Bioinform. 2021; 22:bbaa397. [DOI] [PubMed] [Google Scholar]
- 59. Sun Z., Zheng S., Zhao H., Niu Z., Lu Y., Pan Y., Yang Y.. To improve the predictions of binding residues with DNA, RNA, carbohydrate, and peptide via multi-task deep neural networks. IEEE/ACM Trans. Comput. Biol. Bioinf. 2021; 19:3735–3743. [DOI] [PubMed] [Google Scholar]
- 60. Peng Z., Kurgan L.. High-throughput prediction of RNA, DNA and protein binding regions mediated by intrinsic disorder. Nucleic Acids Res. 2015; 43:e121. [DOI] [PMC free article] [PubMed] [Google Scholar]
- 61. Oldfield C.J., Peng Z., Kurgan L.. Disordered RNA-binding region prediction with disordpbind. Methods Mol. Biol. 2020; 2106:225–239. [DOI] [PubMed] [Google Scholar]
- 62. Peng Z., Wang C., Uversky V.N., Kurgan L.. Prediction of disordered RNA, DNA, and protein binding regions using disordpbind. Methods Mol. Biol. 2017; 1484:187–203. [DOI] [PubMed] [Google Scholar]
- 63. Zhang F., Zhao B., Shi W., Li M., Kurgan L.. DeepDISOBind: accurate prediction of RNA-, DNA-and protein-binding intrinsically disordered residues with deep multi-task learning. Brief. Bioinf. 2022; 23:bbab521. [DOI] [PubMed] [Google Scholar]
- 64. Piovesan D., Tabaro F., Micetic I., Necci M., Quaglia F., Oldfield C.J., Aspromonte M.C., Davey N.E., Davidovic R., Dosztanyi Z.et al.. DisProt 7.0: a major update of the database of disordered proteins. Nucleic Acids Res. 2016; D1:D219–D227. [DOI] [PMC free article] [PubMed] [Google Scholar]
- 65. Zhang J., Ghadermarzi S., Kurgan L.. Prediction of protein-binding residues: dichotomy of sequence-based methods developed using structured complexes versus disordered proteins. Bioinformatics. 2020; 36:4729–4738. [DOI] [PubMed] [Google Scholar]
- 66. Zhang F., Shi W., Zhang J., Zeng M., Li M., Kurgan L.. PROBselect: accurate prediction of protein-binding residues from proteins sequences via dynamic predictor selection. Bioinformatics. 2020; 36:i735–i744. [DOI] [PubMed] [Google Scholar]
- 67. Zhang J., Kurgan L.. Review and comparative assessment of sequence-based predictors of protein-binding residues. Brief. Bioinform. 2018; 19:821–837. [DOI] [PubMed] [Google Scholar]
- 68. UniProt C. UniProt: the universal protein knowledgebase in 2021. Nucleic Acids Res. 2021; 49:D480–D489. [DOI] [PMC free article] [PubMed] [Google Scholar]
- 69. Dana J.M., Gutmanas A., Tyagi N., Qi G., O’Donovan C., Martin M., Velankar S.. SIFTS: updated structure integration with function, taxonomy and sequences resource allows 40-fold increase in coverage of structure-based annotations for proteins. Nucleic Acids Res. 2019; 47:D482–D489. [DOI] [PMC free article] [PubMed] [Google Scholar]
- 70. Necci M., Piovesan D., Tosatto S.C.. Critical assessment of protein intrinsic disorder prediction. Nat. Methods. 2021; 18:472–481. [DOI] [PMC free article] [PubMed] [Google Scholar]
- 71. Altschul S.F., Madden T.L., Schäffer A.A., Zhang J., Zhang Z., Miller W., Lipman D.J.. Gapped BLAST and PSI-BLAST: a new generation of protein database search programs. Nucleic Acids Res. 1997; 25:3389–3402. [DOI] [PMC free article] [PubMed] [Google Scholar]
- 72. Necci M., Piovesan D., Predictors C., DisProt C., Tosatto S.C.E.. Critical assessment of protein intrinsic disorder prediction. Nat. Methods. 2021; 18:472–481. [DOI] [PMC free article] [PubMed] [Google Scholar]
- 73. Zeng M., Zhang F., Wu F.-X., Li Y., Wang J., Li M.. Protein–protein interaction site prediction through combining local and global features with deep neural networks. Bioinformatics. 2020; 36:1114–1120. [DOI] [PubMed] [Google Scholar]
- 74. Wu Z., Hu G., Yang J., Peng Z., Uversky V.N., Kurgan L.. In various protein complexes, disordered protomers have large per-residue surface areas and area of protein-, DNA- and RNA-binding interfaces. FEBS Lett. 2015; 589:2561–2569. [DOI] [PubMed] [Google Scholar]
- 75. Campen A., Williams R.M., Brown C.J., Meng J., Uversky V.N., Dunker A.K.. TOP-IDP-scale: a new amino acid scale measuring propensity for intrinsic disorder. Protein Pept. Lett. 2008; 15:956–963. [DOI] [PMC free article] [PubMed] [Google Scholar]
- 76. Zhao B., Kurgan L.. Deep learning in prediction of intrinsic disorder in proteins. Comput. Struct. Biotechnol. J. 2022; 20:1286–1294. [DOI] [PMC free article] [PubMed] [Google Scholar]
- 77. Breiman L. Random forests. Mach Learn. 2001; 45:5–32. [Google Scholar]
- 78. Chen T.Q., Guestrin C.. XGBoost: a scalable tree boosting system. Kdd'16: Proceedings of the 22nd Acm Sigkdd International Conference on Knowledge Discovery and Data Mining. 2016; 785–794. [Google Scholar]
- 79. AlQuraishi M. AlphaFold at CASP13. Bioinformatics. 2019; 35:4862–4865. [DOI] [PMC free article] [PubMed] [Google Scholar]
- 80. Jumper J., Evans R., Pritzel A., Green T., Figurnov M., Ronneberger O., Tunyasuvunakool K., Bates R., Zidek A., Potapenko A.et al.. Highly accurate protein structure prediction with alphafold. Nature. 2021; 596:583–589. [DOI] [PMC free article] [PubMed] [Google Scholar]
- 81. Li P., Liu Z.P.. PST-PRNA: prediction of RNA-binding sites using protein surface topography and deep learning. Bioinformatics. 2022; 38:2162–2168. [DOI] [PubMed] [Google Scholar]
- 82. Xia Y., Xia C.Q., Pan X., Shen H.B.. GraphBind: protein structural context embedded rules learned by hierarchical graph neural networks for recognizing nucleic-acid-binding residues. Nucleic Acids Res. 2021; 49:e51. [DOI] [PMC free article] [PubMed] [Google Scholar]
- 83. Lam J.H., Li Y., Zhu L.Z., Umarov R., Jiang H.L., Heliou A., Sheong F.K., Liu T.Y., Long Y.K., Li Y.F.et al.. A deep learning framework to predict binding preference of RNA constituents on protein surface. Nat. Commun. 2019; 10:4941. [DOI] [PMC free article] [PubMed] [Google Scholar]
- 84. Zhang J., Kurgan L.. SCRIBER: accurate and partner type-specific prediction of protein-binding residues from proteins sequences. Bioinformatics. 2019; 35:i343–i353. [DOI] [PMC free article] [PubMed] [Google Scholar]
Associated Data
This section collects any data citations, data availability statements, or supplementary materials included in this article.
Supplementary Materials
Data Availability Statement
The datasets are available at https://www.csuligroup.com/hybridRNAbind/.