

Abstract

For decades now, low salinity water flooding (LSWF) oil recovery has emerged as an environmentally benign and cost-effective method for improved oil recovery, where research findings have reported pH and interfacial tension effects. Considering the effect of oil chemistry on interfacial tension and the potential of this chemistry to have a direct relationship with LSWF, we measured the interfacial tension of four crude oils with composition varying from those of conventional to unconventional ones. We also characterized the crude oil samples using infrared spectroscopy and a wet chemistry method based on asphaltene precipitation. Our research approach has enabled us to relate the composition of crude oil to the interfacial tension trend at pH encountered in improved oil recovery schemes. Our research methodology, based on an integrated approach to using infrared spectroscopy and interfacial tensiometry, has also enabled us to propose a more robust theoretical explanation for current observations in LSWF related to pH and interfacial tension. In this regard, oil–water interfacial tension depends on the concentration of polar components, such that the higher the concentration of polar groups in crude oil, the higher the interfacial tension at a given pH of aqueous solution. We have also shown that the acid-base behavior of polar groups at the oil–water interface provides a theoretical interpretation of the explicit relationship between oil–water interfacial tension and the electrostatic components of interfacial tension as given by the energy additivity theory.
1. Introduction
Crude oil is a naturally occurring hydrocarbon consisting of a complex mixture of coexisting hydrocarbons and polar organic compounds,1,2 and their physical properties are found to be dependent on the chemical composition.3 The composition of a crude oil is classified subject to its SARA content (saturates, aromatics, resins, and asphaltenes) where waxes make up around 14%, with branched and cyclical (naphthenic) compounds accounting for 16 and 30%, respectively, while aromatics make up around 30% and asphaltenes and resins 10%.4,5 Consequently, the polar fractions of crude oils have been determined using ambient mass spectrometry and gas chromatography mass spectrometry.1 The polar components, such as asphaltenes, have also been studied based on Terahertz spectroscopy, which has a feature for measuring the amplitude and time delay and consequently the refractive index and absorption coefficient spectra simultaneously.6 In light of their nonsolubility in lower-molecular-weight paraffins, the asphaltene content of crude oils has been fractionated using n-hexane.7,8
Apart from impacting the bulk physicochemical properties of oils, the polar components have been found to be related to several physicochemical processes. For instance, the asphaltene content has been found to stabilize water-in-oil emulsion, which forms upstream during the production of crude oil from petroleum reservoirs, introducing technical challenges relating to quality.9,10 Wettability evolution in siliciclastic petroleum reservoirs due to reversible adsorption of asphaltenes has also been reported11 as it has effects on both wettability and permeability.12 Alvarado et al. (2014)13 have shown that a good relationship exists between polar component contents and interfacial viscoelasticity, and consequently with oil recovery factor, in smart water flooding oil recovery.
The interfacial tension (IFT) between oil and water is a fundamental parameter arising from intermolecular interactions at the interface14,15 that controls capillary forces, wettability, and oil recovery in secondary oil recovery schemes.16 Among the intermolecular forces are van der Waals and non-van der Waals or apolar components, with the latter components being electrostatic in nature.17 Therefore, the energy additivity theory of IFT explicitly links the IFT between oil and water to the van der Waals and non-van der Waals contributions.14 Non-van der Waals components are electrostatic in origin, and therefore ionization of the polar components of crude oil at the oil–water interface18 as well as the pH dependency19 of this ionization will provide electrostatic contribution to the oil–water IFT. Accordingly, Abdel-Wali (1996)20 has investigated the effect of polar fractions and salinity on oil–water IFT and wettability characteristics of rock/oil/brine systems. In this study, the concentration of polar compounds in the crude oil was varied by adding different amounts of oleic acid and octadecylamine to the crude oil. His results showed that the IFT between crude oil and brine was lowered to a minimum value when oleic acid concentrations of 0.028 g mol/L and brine salinity of 40,000 ppm NaCl were used. One type of crude oil and core samples from Safaniya formation in Saudi Arabia were used in the study. Apart from asphaltenes, the surface-active components of crude oils, such as naphthenic acids (NAs) play a crucial role in controlling IFT behavior at the oil/water interface in addition to stabilizing in situ emulsions that pose operational challenges. Mahavadi et al. (2022)21 have used 22 crude oil samples from different fields to develop a model that can potentially be used for downhole IFT measurements, which is expected to improve saturation height function modeling and enable more informed decisions on field development planning for newly drilled wells. In line with their polar nature, asphaltene molecules are similar to water molecules and are interfacially affected by water while they are absorbed at the interface, and this effect has been investigated using deionized water and dead-crude oil samples.22 The results show that oil/water IFT changes with pressure, exhibiting oscillations. Such an oscillating behavior of IFT trends was related to asphaltene surface activity as the oil samples used did not contain other impurities.
Bai et al. (2010)23 have studied the interaction between heavy oil components and petroleum sulfonate (NPS) where the effects of pH, NaCl concentration, and NPS on the oil–water IFT of Gudao crude oil and its polar components were investigated. They concluded that the amount of NPS required to obtain lower IFT was less than the critical micelle concentration, and this is a synergetic effect between NPS and the active substances of crude and its components. In addition, they demonstrated that in a simulated system of crude and polar components with 0.1 wt % NPS, at higher pH conditions, the acidic substances in the polar components create naphthenates (sodium salts of NAs), leading to lower IFT. However, while the effect of polar components on oil–water interfacial behavior has been studied, emphases have been on specific aspects rather than on the effect of bulk components. For instance, the research work of Mahavadi et al. (2022)21 was specifically designed to investigate the effect of NA. The study by Bai et al. (2010)23 was also designed to investigate the effect of naphthenates formed from NA. Also, while Moghadasi et al. (2018)22 studied the effect of asphaltene on interfacial behavior, the emphasis was on adsorption at the oil–water interface. Recently, a new surface complexation model of the oil–water interface was proposed, taking into consideration the effect of oil chemistry (Bonto et al., 2019).24 Validation of the optimized model against different experimental data sets shows good performance in predicting the surface charge of oil in different brines with different pHs. Most importantly, they showed the role of the acid and base components of crude oils in determining surface complexation which has a bearing on IFT. Similar to Bonto et al. (2019)24 who contend that previous surface complexation models did not consider the chemistry of crude oil, we also contend that studies of the effect of polar component fractions have not considered the combined effects of such components as mentioned above. In this research work, we show the effect of the concentration of polar components of crude oils, notably acidic, basic, and asphaltene contents, on IFT trends under pH conditions encountered in petroleum reservoirs and smart water flooding schemes. Accordingly, we measured oil–water IFT of four oil samples, with API gravity varying from those of light oil to those of heavy oil under different pH conditions in addition to using infrared spectroscopic data to correlate polar fraction absorbances data with IFT trends.
Andersen et al. (2016)25 showed through an infrared spectroscopic analysis of the crude oil/water interfacial film that the concentration of carboxylic acids is higher at the interface. In this study, we correlated infrared spectroscopy data with asphaltene, basic, and carboxylic acid absorbance. The approach enabled us to perform two noble tasks, namely, explanation of the pH dependence of the oil–water IFT and the explanation of this trend in accordance with the energy additivity theory.14 Recently, low salinity enhanced oil recovery (LSOR) has emerged as an environmentally benign and cost-effective alternative for improved oil recovery. Two experimental observations of LSOR include the IFT and pH effects on improved oil recovery. Our approach in this research work has also enabled us to theoretically explain these two effects.
2. Background Theory
2.1. Relationship of Oil Quality with Oil–Brine IFT
The IFT between two immiscible phases is the thermodynamic work required to create unit interfacial area at a given temperature and composition of the phases,26 and the work reflects the force of attraction between the molecules at the interface.27 Some of these forces are intermolecular in origin, being electrodynamic and consisting of randomly oriented dipole interactions, randomly oriented dipole-induced dipole interactions called Debye interaction, and fluctuating dipole-induced dipole or dispersion interaction described by London (Oss, 2006).28 Dispersion interaction is universal. The first two were later found to be similar to the third one following which the three electrodynamic forces have been jointly called Lifshitz–van der Waals (LW) forces.28 In addition to van der Waals intermolecular forces, non-van der Waals forces arising from hydrogen-bonding and non-hydrogen-bonding components called acid-base or electron acceptor and electron donor components,29 respectively, contribute relatively to the magnitude of surface tension or IFT. Consequently, the molecular composition of the surface/interface which reflects the bulk plays a vital role in IFT quantification. For the crude oil–brine interface, intermolecular forces result predominantly from two sources: the attractive van der Waals forces of the two phases and the acid-base contributions due to the interaction between polar hydrogen bonding of brine and ionizable acid and base components of crude oil, which constitute the heteroatom fractions.
Since NAs are hydrophilic, they tend to adsorb at the crude oil–brine interface and dissociate in water. The partitioning phenomenon of NAs through equilibrium reactions can be described as30
| 1 |
where  represents neutral NA species in crude
oil,
represents neutral NA species in crude
oil,  is the aqueous form of NA,
  is the deprotonated form of NA, and
  is the hydrogen ion.
In the context of our paper, we consider protonated or deprotonated species of NA to be on the surface of crude oil and presenting its electrostatic non-van der Waals interaction to brine at the interface. Therefore, eq 1 will be written as
| 2 |
where  indicates a species on the surface of oil
For basic nitrogen groups, the following dissociation reaction is possible31
| 3 |
Accordingly, eq 3 can be written for surface species as
| 4 |
The acid-base contribution to IFT from brine results in the measurable electronegativity differences between hydrogen and oxygen atoms which leads to molecular polarity causing partial positive and negative charges.32
The surface free energy or IFT of a chemically heterogeneous surface is often treated as an approximate additive quantity through the Cassie equation,14,33 and this is applicable to IFT. Accordingly, the energy additivity theory of IFT links the IFT between two immiscible phases as15
| 5 |
in which  is the IFT between phase one and phase
2,
is the IFT between phase one and phase
2,  is the dispersion force contribution to
IFT due to phase 1,
is the dispersion force contribution to
IFT due to phase 1,  is the dispersion force contribution to
IFT due to phase 2,
is the dispersion force contribution to
IFT due to phase 2,  is the electron acceptor contribution to
IFT due to phase 1,
is the electron acceptor contribution to
IFT due to phase 1,  is the electron donor contribution to IFT
due to phase 2.
is the electron donor contribution to IFT
due to phase 2.
For oil–brine system, eq 5 can be written as
| 6 |
In eq 6, the subscripts o and w refer to oil and water, respectively.
Sulfur content and weight are the two qualities that generally determine the quality of crude oil,34 such that high-sulfur, heavy oils are the lowest quality and the least expensive on the global market. On the other hand, crude oils can be further divided on the basis of sulfur and acid contents, given the relationship of acid content to corrosivity.35 Consequently, in light of the effect of asphaltene content on the weight of crude oil and its heteroatomic nature, the different components of surface tension/IFT discussed above have direct correlations with the quality of crude oil, and the theoretical basis will be discussed in the following section.
2.2. Relationship of Oil Quality to Oil–Brine IFT
The quality of crude oil depends on the extent of biodegradation which targets lower-molecular-weight fractions, as has been confirmed by stable isotope studies,36 resulting in higher concentration of heteroatom molecules and lower quality.37 Considering the ionizable group model, ionization of acidic or basic groups of crude oil will lead to surface complexation at the oil–brine interface.38 Consequently, the number density of acid and basic sites of crude oil will regulate surface complexation at the interface for a given chemistry of brine.39 The number density of acidic and basic sites is given as
 |
7 |
where  [#/nm2] and
  [#/nm2] are the number densities
of acidic and basic sites, respectively,
[#/nm2] are the number densities
of acidic and basic sites, respectively,  [mg/g] and
  [mg/g] are the total acid and base numbers,
respectively,
[mg/g] are the total acid and base numbers,
respectively,  is the specific surface area of oil [m2g–1], and
  [g/mol] is the molar mass of potassium
hydroxide.
[g/mol] is the molar mass of potassium
hydroxide.
Since electrostatic phenomena at the oil–water interface depend on heteroatom fractions, their number densities given by eq 7 will control the interfacial coverage of electron donor and electron acceptor component contribution to IFT given by eq 6 at a given pH, brine chemistry, and surface complexation scenario.24 Consequently, correlation of crude oil–brine IFT with crude oil quality, which depends on heteroatom fractions, is a possibility which is the focus of our paper. In the following section, we outline the detailed methodology of our study based on experimental work on four crude oil samples of varying oAPI gravity.
3. Materials and Methods
3.1. Crude Oil Samples
Arab Heavy oil was obtained from Saudi Aramco of Saudi Arabia. Oil sample from Terra Nova was supplied by Suncor. The oil sample from Gullfaks field was supplied by Equinor, while that of Mesa 30 was supplied by Mesa Petroleum. These samples were supplied with their corresponding oAPI gravity.
3.2. Reagents
n-Hexane with a purity of 99% was purchased from Sigma-Aldrich and used without further purification. A stock solution of hydrochloric acid originally prepared using hydrochloric acid of purity 37% purchased from Sigma-Aldrich was to control the pH of brine, which was measured using a VRW electronic-based pH meter.
4. Experimentation
4.1. Characterization of Oil Samples
4.1.1. Asphaltene Precipitation
The asphaltene fraction of a crude oil is the most polar and is defined as the fraction that is insoluble in low-boiling-point paraffin hydrocarbons40,41 but soluble in carbon tetrachloride and benzene.42 Achugasim and Idongesit (2015)42 have shown that the weight of asphaltenes obtained at different solvent precipitating ratios was the highest when 100% n-pentane was used. Therefore, n-hexane was used in this study based on a volume ratio of 40:1 (hexane/oil).43 Accordingly, 80 cm3 of n-hexane per 2 cm3 of oil sample was used. The crude oil/n-alkane mixture in different conical flasks were stoppered and mechanically agitated for 45 min using a G10 Gyrotory Shaker manufactured by New Brunswick Scientific Company Inc. of USA and allowed to stand overnight. The resultant solution was subsequently filtered using Whatman filter paper (24 cm diameter) to retain the asphaltene precipitant on the paper. After filtration, the papers with the precipitants were dried at room temperature for 3 months. Prior to filtration, the average weight of Whatman paper was determined using a random sample of 10 papers. The weight of asphaltene precipitated was determined by weighing the Whatman paper with the precipitant and subtracting the original weight from it.
4.1.2. Density Determination
To apply the correction factor relating to the theory of ring tensiometry,44 the densities of model brine and crude oil samples were determined at experimental temperature (room temperature) using a Fisher Scientific density bottle (pycnometer) in accordance with ASTM-D1217.
4.1.3. Infrared Spectra of Crude Oils
The infrared spectra of crude oils were acquired using a Nicole total attenuated reflectance Fourier infrared spectrometer manufactured by Fisher Scientific. Sixteen scans were acquired per sample using a resolution of 4 cm–1.45 Three spectra were taken per sample for repeatability, and all were found to be the same.
4.1.4. Experimental Brine
To theoretically and meaningfully pursue our objective, we consider conventional water flooding designed to achieve reservoir pressure maintenance46−48 from the start of field production, where bottom water drive is nonexistent. The initial water content is that of irreducible water left after oil migration and entrapment in the reservoir.49,50 We will further assume a water injection scenario offshore, where seawater is the ideal low-salinity injection brine. In this regard, we assume that produce water after injection water breakthrough in producing wells is cleaned in accordance with strict environmental regulations and reinjected. Consequently, IFT between crude oil samples and model brine was determined.
4.1.5. IFT Measurement Using Ring Tensiometry
Figure 1 shows a picture of the Fisher Surface Tensiomat model 21 used in this study.
Figure 1.

Picture of a Fisher Tensiomat model 21 with du Nouy ring and experimental brine (courtesy of Andrew Gracie).
Measurement of surface tension with the Fisher Surface Tensiomat model 21 involves lowering the sample liquid dish, in effect raising the du Nouy ring (initially immersed in the liquid) above the formerly plane surface until the membrane breaks, and the maximum force required is read off a scale that registers the twist in the torsion balance wire. The relationship between the maximum force on platinum−iridium du Nouy rings (before the surface membrane releases) and surface tension S was carefully investigated by Harkins and Jordan,44 and quantified parametrically by Zuidema and Waters,51 taking the form
| 8 |
where
| 9 |
S is the surface tension/IFT in mN/m; R is the torsion balance scale reading in mN/m; and Dd is the difference in density between the lower and upper phases. The three parameters in F are Ao[1] = 0.7250; Ao[2] = b × (4/C)2 where b = 0.0009075, and C is the mean circumference of the ring in cm; Ao[3] = 0.04534–1.679/ρ where ρ is the ratio of ring mean diameter, Dbar, to wire diameter, dw. The numerical values above were claimed by Zuidema and Waters to be constant for all rings made of platinum–iridium. The du Nouy ring used in this work was made with nichrome wire with a slender milled brass bar that connected the ring struts to the hanger hook; see Figure 1 & Table 5 (nichrome was used because of its resistance to corrosion and heat and its retention of formed shape). For this ring, with C = 6.095 cm, ρ = 38.00, and assuming that the Ao parameters apply, Ao[1] = 0.7250, Ao[2] = 0.0003910, and Ao[3] = 0.001156.
Table 5. du Nouy Ring.
| material | nchrome wire, 24 AWG & slender milled brass bar |
|---|---|
| diameter of wire (dw) | 0.5105 mm |
| ring mean diameter (Dbar) | 1.940 cm |
| assembly | silver solder |
| mass | 1.33 g |
After calibration, before each measurement, the Tensiomat was zeroed with the cleaned ring immersed in the liquid. The ring was cleaned by rinsing in benzene, a second rinse in methyl ethyl ketone, followed by drying with a heat gun. A plot of S/R versus R/Dd for repeated measurements for 11 liquids commonly used for reference (www.surface-tension.de)52 is shown in Figure 9 where error bars are indicated by black dots adjacent to each datum. S is the literature value for the liquid, R is the mean of repeated scale readings, and Dd is computed from liquid density and that of a saturated mixture of air and liquid vapor53 (KDB correlation equation). Saturation of the mixture in the upper phase was facilitated by dangling the ring hanger through a small hole in a cover over the truncated beaker in which the liquid was held on the Tensiomat platform. The inside diameter of the beaker was 83 mm, great enough to avoid distortion of the ring-formed membrane.54 The plot shows the points to lie generally above the F versus R/Dd curve, which motivates an attempt at refining the fit with adjustable parameters A = [A[1], A[2], and A[3]].
where F = A[1] + sqrt(A[2] × R/Dd + A[3]) may be rewritten as
or setting x = R/Dd and y = S/Dd, it reads
| 10 |
where y is a nonlinear function of x. The Levenberg–Marquardt algorithm is used to compute successive increments in the parameters A (starting with Ao) that seeks the minimum of χ2 (see e.g., P. R. Bevington “Data Reduction and Error Analysis for the Physical Sciences”, 1969).55 Because the original data readings R have been replaced by R/Dd in the fitting function, the weighting of each datum in the expression for χ2 is (Dd/s)2 where s is the standard deviation in the corresponding R. It is assumed that the uncertainty in S and Dd is rather less than s in each case. Concern over the appearance in Figure 9 of several points far off the F curve prompted inclusion of the Chauvenet datum rejection criterion in the fitting process (see e.g., Pugh & Winslow “The Analysis of Physical Measurements”, 1966).56 Only one datum is rejected if the criterion is met, and the current iteration continues to completion before the next worst candidate is considered. The y versus x fit for Ao is displayed in Figure 10 and that for the adjusted parameters A is displayed in Figure 11, where the F-curve more closely fits the experimental points. The Fo curve together with the fitted curve F and the S/R points are shown in Figure 12. The result of the fit in a broader context appears in Figure 13 where the F-curve parameters A that describe its parabolic shape better represent the reference data for use in the determination of IFT for oil/brine samples.
Figure 9.
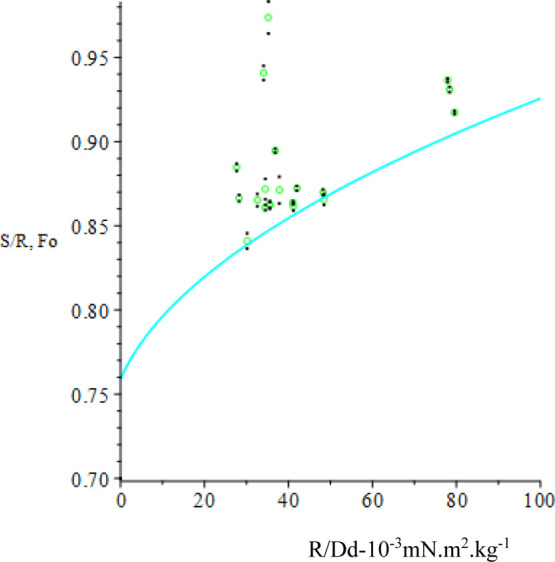
S/R vs R/Dd. S/R: green; Fo: cyan.
Figure 10.
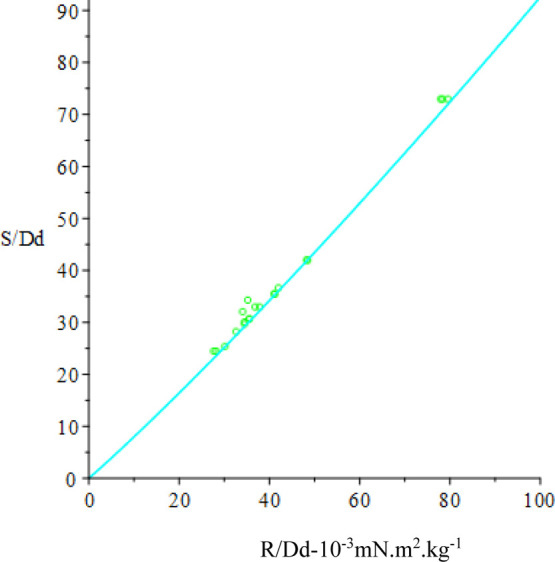
S/Dd (10–3 mN·m2·kg–1) vs R/Dd. S/Dd: green; Sc/Dd: cyan.
Figure 11.

S/Dd (10–3mN·m2·kg–1) vs R/Dd. Green: fitted data; red: rejected data; magenta: fitted curve.
Figure 12.
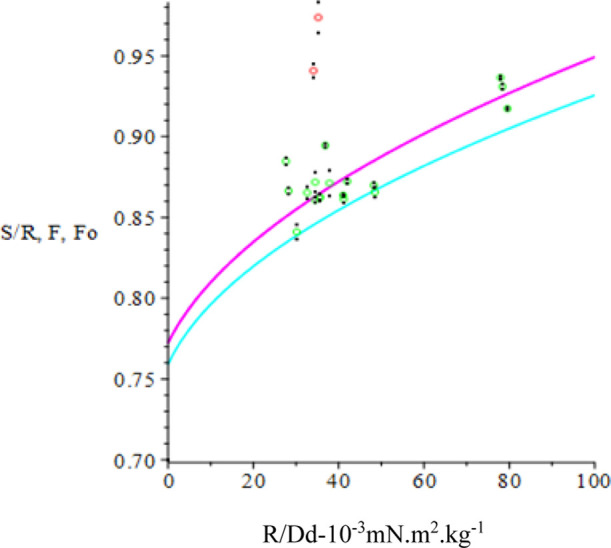
S/R, F, Fo vs R/Dd. S/R: green; F: magenta; Fo: cyan.
Figure 13.

Figure 6.

Infrared spectra of Mesa 30 crude oil sample.
Measurement of interfacial surface tension may be done with the instrument in two possible ways: (1) by “raising” the ring from the more dense liquid through the interface into the less dense liquid, the maximum force required read off the same scale as above or (2) by “lowering” the ring from the less dense liquid through the interface into the more dense liquid until the membrane breaks, the maximum force determined by reading the torsion balance wire twist off a second scale on the instrument. In the case of an oil–brine interface, it is more convenient to measure interfacial surface tension by use of the second approach, which was done in this work. IFT was measured for the four crude oil samples (Gullfaks, Arab Heavy, Terra Nova, and Mesa 30) over brine at three pH values (4.25, 7.43, and 8.59). In all cases, the viscoelastic property of the oil had a significant influence on the measurement procedure; for Mesa 30 oil, for example, following a tiny raise of the dish (∼0.25 mm), a delay of 5–10 s was required for the pointer to come to equilibrium. Subsequent adjustment of the torsion wire twist to align the balance needle with the fiduciary mark on the mirror required similar allowance of time to equilibrate, it not being possible to maintain the alignment as the primary adjustment was being made. Maximum force on the ring was inferred to have been passed by observation of slight relocation of the needle image below the reference mark. Careful repeated attempts were made to refine the determination. Gullfaks sample was similarly difficult, with the added presence of tiny “lumps” in the oil that protruded through the oil–brine interface. Effort was made to sweep such irregularities away from the ring region. The Terra Nova sample exhibited a faster approach to equilibrium, requiring about 4 s. The overshoot that indicated the maximum force had been passed for this oil was very subtle. The interfacial membrane was translucent with a somewhat “granular” appearance. The Arab Heavy oil sample was relatively easy to measure, the membrane appearing dark and opaque.
The correction factor F is a function of x = R/Dd, where R is the scale reading and Dd is the difference in density between the lower and upper phases. For the liquids used to determine F, the parameter Dd varied in the range 0.62 ≲ Dd ≲ 1.49, while for the oil–brine samples, Dd varied in the range 0.096 ≲ Dd ≲ 0.15, about 10 times less. Thus, in the case of the relatively small values of R found in the interfacial surface tension measurements, their R/Dd values were such that the two fell below the range covered by the calibrating liquids, six lie in the covered range, and four (for pH = 4.25) lie above the covered range (see Figure 14). However, the parameterization of F in terms of R/Dd and ring dimensions by Zuidema and Waters (1941),51 optimized for our ring and choice of reference liquids, is designed to instill confidence in the (modest) extrapolations.
Figure 14.

4.1.6. Determination of the Basic Groups of Oil Samples
A strong correlation between the asphaltene content and the total base number (TBN) has been found based on a data set of 20 crude oils.57 The correlation coefficient using a polynomial fit was excellent for TBN ranging from 0.15 to 4.14 mg KOH/g oil and asphaltene contents of 0.4–25 mg/g oil. We plotted the experimental data of Barth et al. (2005)57 that links the TBN to asphaltene concentration as found in Figure 2. Accordingly, we deduced TBN of different crude oils using the data on asphaltene content.
Figure 2.

Fitting of a polynomial curve to the data of Barth et al. (2005).57
5. Results and Discussion
5.1. Experimental Evidence from Characterization
Figure 3 shows the snapshots of asphaltene precipitation for different crude oil samples, the extent of darkness increasing in magnitude as Gullfaks < Terra Nova, Mesa 30 < Arab Heavy. In line with the effect of asphaltene concentration on crude oil density and API gravity, Table 1 shows the oAPI gravity and sulfur contents and the measured specific gravity of crude oils measured using the density bottle. In this study, all experiments were conducted at room temperature. Column 3 of Table 1 shows a good correlation between specific gravity and oAPI gravity of crude oils where the higher the specific gravity, the lower the oAPI (IEA, 2017).
Figure 3.

(a) Gullfaks crude oil asphaltene on Whatman paper, (b) Arab Heavy crude oil asphaltene on Whatman paper, (c) Mesa 30 crude oil asphaltene on Whatman paper, and (d) Terra Nova oil asphaltene on Whatman paper.
Table 1. API Gravity and Sulfur Content of Oil Samples.
| oil sample | oAPI gravity (McKinsey, 2022) | sulfur content % | specific gravity at 20 °C |
|---|---|---|---|
| Gullfaks | 36.0 | 0.26 | 0.863 |
| Arab Heavy | 28.0 | 2.80 | 0.916 |
| Terra Nova | 33.2 | 0.48 | 0.890 |
| Mesa 30 | 30.0 | 0.90 | 0.918 |
Table 2 shows the asphaltene contents from fractionation experiments using n-hexane and the TBNs based on Figure 2. In Table 2, Arab Heavy has the highest asphaltene content with the highest corresponding TBN (5.19 mgKOH/g). Mesa 30 has the second highest asphaltene content with the corresponding second highest TBN. The trends of asphaltene concentration for the rest of the oils also reflect this trend of TBN.
Table 2. TBN of Crude Oil Samples.
| oil sample | API gravity (McKinsey, 2022) | asphaltene concentration-mg g–1 | total base number TBN-mgKOH g–1 |
|---|---|---|---|
| Gullfaks | 36.0 | 10.77 | 2.66 |
| Arab Heavy | 28.0 | 37.77 | 5.19 |
| Terra Nova | 33.2 | 12.75 | 2.92 |
| Mesa 30 | 30.0 | 22.28 | 3.94 |
Figures 4–7 show the infrared spectra of crude oil samples. Generally, asphaltene has very strong bands corresponding to methyl group (−CH3) and methylene group (−CH2) stretching and bending vibrations at 2916.4 and 2847.9 and 1450 and 1370 cm–1, respectively. The broad peak at 1593.1 cm–1 can be assigned to the aromatic stretching vibration. The absorption peak at 1021.4 cm–1 corresponds to a sulfoxide functional group.58 A peak at 803.7 cm–1 is related to aromatic C–H out-of-plane deformation of a single adjacent hydrogen atom, and a peak at 721–726 cm–1 corresponds to an alkyl chain longer than 4 methylene units58,59 or C=C–H cis bending vibration.60 All these peaks are visible in the spectra of oils.
Figure 4.

Infrared spectra of Gullfaks crude oil sample.
Figure 7.

Infrared spectra of Terra Nova crude oil sample.
In all spectra, the absorption frequencies characteristic of the symmetrical and asymmetrical vibrations (2965–2862 cm–1) of (C–H), CH2, and CH3 aliphatic groups from the alkyl of asphaltenes similar to triglycerides61 are found in all figures. The hydroxyl bond of the asphaltene sample in the region of 3000–3500 cm–1 is visible in all.62 Hydrogen bonding in the asphaltic residue has been studied by Petersen (Petersen, 1967),63 who showed the stretching vibration of OH and NH bands in infrared spectroscopy and demonstrated that phenolic and alcoholic type of OH and pyrrolic type of NH groups are present in a strongly hydrogen bonded form. Non-hydrogen-bonded free phenolic OH group in asphaltenes appear as a sharp peak at 3610 cm–1 which is not visible, but hydrogen-bonded OH appears as a broad band centered between 3100 and 3350 cm–1, which is a characteristic feature of hydrogen-bonded phenols (Figures 5–7).
Figure 5.

Infrared spectra of Arab Heavy crude oil sample.
The absorbance region located at 1335–1250 cm–1 indicates the presence of stretching vibrations of C–N groups. The region at 3390–3 150 cm–1 is mainly due to the N–H stretching vibrations. The region shown around 910–665 cm–1 is due to NH2 bending vibrations.64
NAs that can have either a cyclo or benzene ring or both moieties is a generic term for all carboxylic acids in crude oils,65 and they show broad and sharp peak frequencies for OH and C=O stretching vibrations of the carboxylic acid group.66 Considering the presence of the benzene ring double bonds in asphaltenes and NAs as well as in basic components of crude oil67 and the occurrence of the OH group in asphaltene, we used spectroscopic information specific to the carboxyl group absorption of NAs to obtain information about the relative concentration of the acid in different crude oils. We also used absorbance related to the C–N bond vibration of basic components68 to obtain information about the relative concentrations of this component in different crude oils. The C–N group also occurs in asphaltene,69 and such an approach gives a lumped information. Table 3 shows the corresponding absorbance for crude oils. In this study, we did not consider the carbon-to-carbon double bonds present in the benzene ring structure of NA because we regard the concentration of acid having this structure to be negligible compared to those with the cyclo-ring.70,71
Table 3. Infrared Absorptions for Basic and Acidic Sites of Oil Samples.
| oil sample | API gravity (McKinsey, 2022) | asphaltene concentration-mg g–1 | absorption of C–N group (1250 cm–1) | absorption of carboxyl group (1376 cm–1) |
|---|---|---|---|---|
| Gullfaks | 36.0 | 10.77 | 0.050 | 0.075 |
| Arab Heavy | 28.0 | 37.77 | 0.080 | 0.145 |
| Terra Nova | 33.2 | 12.75 | 0.065 | 0.095 |
| Mesa 30 | 30.0 | 22.28 | 0.072 | 0.130 |
On the basis of asphaltene contents of crude oil absorbances for oils (Table 3), the carboxyl concentration should be in the order of decreasing magnitude as Arab Heavy > Mesa 30 > Terra Nova > Gullfaks. This is exactly the trend revealed in Table 3 and in accordance with organic geochemical theory where the extent of biodegradation increases the acid content of crude oil72 as well as its asphaltene content.73 The trend in basic group absorption also reflects asphaltene and carboxyl group absorbances.
Figure 8 shows the plots of IFT versus pH for oil samples, while Table 4 gives measured IFTs of crude oils versus pH with their standard deviation. In this study, the effect of pH on IFT was investigated for two reasons: First, to correlate observations of IFT trend with pH with the acid-base components of crude oils that have the potential to contribute to intermolecular forces at the oil–water interface, thereby affecting IFT. The second reason for the investigation was to aid discussion of our experimental findings in relationship to recent observations regarding the pH effect of low salinity water flooding (LSWF) oil recovery as found in the literature.
Figure 8.

Variation of IFT with pH of seawater, [“Gullfaks (red)”, “Arab Heavy (coral)”, “Terra Nova (green)”, and “Mesa 30 (blue)”].
Table 4. Measured IFTs of Oil Samples and Their Corresponding Standard Deviations.
| 4.24 | 7.43 | 8.59 | |
|---|---|---|---|
| pH | IFT | IFT | IFT -mN m–1 |
| Gullfaks | 11.5 ± 0.3 | 2.5 ± 0.3 | 2.63 ± 0.14 |
| Arab Heavy | 13.05 ± 0.16 | 6.6 ± 0.3 | 6.49 ± 0.05 |
| Terra Nova | 12.85 ± 0.14 | 2.85 ± 0.04 | 3.57 ± 0.05 |
| Mesa 30 | 14.2 ± 0.4 | 5.45 ± 0.17 | 3.8 ± 0.7 |
Figure 8 shows a general trend of oil–water IFT reduction with pH of seawater consistent with the observations of Zaker et al. (2021)74 and Buckley & Fan (2005).75 Trends in IFT correlate with asphaltene concentration and carboxyl group absorption of NA. Accordingly, Gullfaks has the lowest asphaltene concentration and has the lowest value of oil–water IFT at a given pH of seawater. Terra Nova ranks third with asphaltene and acid content and has the second lowest IFT trend with pH. However, on the basis of acid content and carboxyl group spectroscopic data, one would expect Mesa 30 to have lower IFT at a given pH compared to Arab Heavy, but this trend is not completely observed within the pH region studied in this paper. Figure 8 shows that at pH values less than 6, the IFT for Mesa 30 oil is higher than that of Arab Heavy, while the opposite is true for pH above 6. Lowering the pH from 7.2 to 6.2 protonates the histidine residues in the oleosins, which are basic groups found in proteins. Further decrease of the pH to 5.0 also protonates the free fatty acids and produces positively charged organelles.76 On the basis of the response of acidic and basic groups of protein which are also found in crude oils, the concentration of positive and negative charges of basic and acid groups of Mesa 30 and Arab Heavy will not be the same at pH below 6 and above 6. For instance, Arab Heavy has more acid concentration and will develop more negative charges at pH above 6 compared to Mesa 30. Therefore, in light of the energy additivity theory on IFT (see eq 6) the IFT will be higher than that of Mesa 30, and the opposite must be true at pH below 6. However, in all cases, the IFTs at a given pH for the two oils are higher than those of other oil samples, testifying to their higher concentrations of acid and asphaltene contents. The trend also confirms the relationship between the asphaltene content and properties of the interface where crude oils with higher asphaltene content showed higher elastic and viscous moduli and an increased IFT (Moradi et al. (2013).30
5.2. Implications of Spectroscopic Absorbance Data for Basic and Acidic Group Contents of Crude Oil
Equation 7 links the number density of acidic and basic groups to the oil–water interfacial area, acid number (AN), base number (BN), and molecular weight of oil. Therefore, knowledge of AN and BN can be correlated with the number density of acid and basic sites, respectively. In this regard, Takeya et al. (2019)77 and Lu et al. (2017)78 have correlated AN and BN with the total acid and base sites, respectively, and the determination of these crude oil quality parameters, experimentally or otherwise, enables site densities of groups to be determined. Accordingly, information on spectroscopic data that can be directly correlated with BN can also shed light on the trend of BN densities of oil samples. Consequently, based on the order of magnitudes of basic group absorption data of Table 3, BN sites in decreasing order are Arab Heavy > Mesa 30 > Terra Nova > Gullfaks, similar to those of AN and BN. Accordingly, we expect the acidic site number density to be the same. The extent of oxidation and biodegradation reflect the API gravity and the total acid number (TAN) of crude oils.79 Consequently, the acid content of crude oil will reflect the extent of oxidation as will the asphaltene content reflect biodegradation, which confirms our anticipation.
5.3. Relationship of Polar Content of Crude Oils to the Energy Additivity Theory of IFT
The energy additivity theory of Fowkes holds that intermolecular force components of surface tension or IFT are pairwise additive,80,81 and eq 7 explicitly links the IFT of two immiscible phases to the polar apolar contributions. The polar contributions also called electron donor and contribution components of surface tension/IFT result from electrostatic phenomena associated with hydrogen bonding and protonation and deprotonation of reactions of surface ionizable groups. In this regard, oil contains ionizable species. Crude oils, indeed, contain such species in concentrations usually characterized by the TAN and the TBN where NAs are among the most abundant in crude oils.82 Asphaltene also possesses acidic and basic groups which were identified using different potentiometric titration methods in nonaqueous polar solvents.83 For instance, the ionizable (in aqueous solution) carboxylic and hydroxyl groups present on the asphaltene molecule lead to its charging processes, which has been demonstrated using zeta potential measurement as a function of parameters such as pH.84 Based on the zeta potential measurement, the isoelectric point of asphaltene has been determined to be 4 .85,86 The isoelectric point is the pH at which the net charge on an amphoteric surface is zero.87 It develops positive charge below this pH and negative charge above it.88 Therefore, at pH equal to 4.5 in Figure 8, the net surface charge of asphaltene will be zero. Polar contribution of asphaltene to IFT will be negligible. From the figure, electrostatic contributions will be solely due to basic nitrogen groups, which will generally be protonated to yield positive interfacial charges. The implication is that the first and fourth terms in the second bracket on the right-hand side of eq 6 will disappear leading to the following equation
| 11 |
As pH increases above 4 (isoelectric point), deprotonation reactions of the acidic group of asphaltenes will generate interfacial negative charge while reducing interfacial positive charge due to basic nitrogen groups. The implication is that comparing eq 7 to 11, more negative terms exist in eq 7 and that causes IFT to be less than that at lower pH. Therefore, as pH increases, oil–water IFT decreases due to the amphoteric nature of the polar components of crude oils, and trends in IFT between crude oil and brine can be theoretically accounted for considering the energy additivity theory. The concept of electrically charged surface states is well known in semiconductor physics and substantially connected with the thermodynamics of charged interfaces as developed in colloid science and electrochemistry.89 Therefore, since the additivity theory is related to intermolecular forces at interfaces, the electrostatic effect on IFT as found in electrochemistry should have a link to its acid-base theory, and our IFT data in this research work capture the underlying physics of intermolecular forces.
5.4. Implications of Polar Components of Crude Oils for the pH and IFT Effect of LSWF
Considering its environmentally friendly and cost-effective aspects, LSWF oil recovery has emerged as an attractive option that is pushing the boundaries of improved oil recovery schemes, both practically and academically. To date, field experience and experimental observations necessitate citing two effects as being responsible for the immense success, namely the pH effect90−92 and the IFT effect.93,94 However, experimental data regarding these effects are not consistent albeit their positive effects.95 The temperature- and salinity-dependent water ionization,96 where water dissociates more at a higher temperature and low salinity, plays a key role in causing disequilibrium conditions in low salinity water injection. Thus, under temperature conditions encountered in petroleum reservoirs and at low salinity, the concentration of hydrogen and hydroxyl ions will increase. In this regard, pH increase as reported in LSWF is caused by hydrogen-ion exchange for cations adsorbed on rock surfaces, where sandstone is the target reservoir rock94 leading to hydroxyl ion/pH and cations increase.90 However, pH decrease has also been reported,97 and lack of evidence of its increase has also been reported.98 Also, while there is evidence that supports increased oil recovery during LSWF due to a decrease in IFT,99 it is reported elsewhere that a lower oil recovery was observed due to IFT increase at lower salinities.100 Moreover, the condition required for IFT increase in LSWF is emulsification and sufficiently high pH, which is generally not met, given reported pH ranges in LSWH research that range from 6.5 to 8.9.101 Therefore, the pH and IFT effects deserve explanation based not only on experimental data but also on the chemistry of crude oil, where the polar fractions can play critical roles, given their pH-dependent electrostatic behavior that can impact interfacial intermolecular interactions. Consequently, based on our research, we provide a more realistic and robust explanation of the effects as follows:
Within the framework of interfacial thermodynamics, the IFT /surface tension is a reversible thermodynamic work.102 The work is governed by intermolecular interactions which consist of electrostatic, charge transfer, polarization, exchange-repulsion, dispersion, and coupling components95 as summed up by the energy additivity theory (eq 6). These interactions form the basis for the surface tension/IFT theory involving LW and the short-range acid-base or donor–acceptor interaction. To meaningfully account for the IFT effect, the relationship of the short-range components to the polar fraction of crude oil is essential. Assuming the basic nitrogen group and the carboxyl group of acid components of crude oil are the significant species at the oil–water interface, the following geochemical speciation of the oil–water interface at a given pH can be written based on the theory of Tian and Wang (2017)103
Considering the ionic composition of brine, surface complexation (Ayirala et al., 2018)104 occurs as follows
where  and
and  are the anion and cation, respectively.
In light of eq 7,
the surface species  ,
,  ,
,  , and
, and  make short-range electrostatic contributions
to IFT. Consequently, their magnitude will depend on their number
densities as found in eq 7, the pH of the aqueous phase in contact with crude oil, and salinity,
given the requirement of ions for surface complexation reactions.
Fundamental to the intermolecular theory of interfaces/surface are
cohesive and adhesive intermolecular interactions. The term cohesive
energy is a generic term for the collective intermolecular forces
that comprise electrostatic bonding and van der Waals forces.105 In eq 6,
make short-range electrostatic contributions
to IFT. Consequently, their magnitude will depend on their number
densities as found in eq 7, the pH of the aqueous phase in contact with crude oil, and salinity,
given the requirement of ions for surface complexation reactions.
Fundamental to the intermolecular theory of interfaces/surface are
cohesive and adhesive intermolecular interactions. The term cohesive
energy is a generic term for the collective intermolecular forces
that comprise electrostatic bonding and van der Waals forces.105 In eq 6,  and
and  are the cohesive electrostatic interaction
between oil molecules, between water molecules, and adhesive interactions
between the two, respectively, which depend on the site density of
surface species at the oil/water interface as a function of pH.106 For the pH range typically encountered in LSWF
(6–8.9), site density of the protonated basic group will be
less than that of the deprotonated carboxyl group. In this regard,
the electrostatic short-range contributions are the appropriate components
to rely on in explaining the IFT effect. Equation 6 for this component becomes
are the cohesive electrostatic interaction
between oil molecules, between water molecules, and adhesive interactions
between the two, respectively, which depend on the site density of
surface species at the oil/water interface as a function of pH.106 For the pH range typically encountered in LSWF
(6–8.9), site density of the protonated basic group will be
less than that of the deprotonated carboxyl group. In this regard,
the electrostatic short-range contributions are the appropriate components
to rely on in explaining the IFT effect. Equation 6 for this component becomes
Here,  is the electrostatic contribution to the
total IFT, and the last two terms in the bracket are the cohesive
interactions between water and oil. For higher salinity brine, the
surface complexes
is the electrostatic contribution to the
total IFT, and the last two terms in the bracket are the cohesive
interactions between water and oil. For higher salinity brine, the
surface complexes  and
and  are higher compared to low salinity brine.
The effect of these complexes is to reduce cohesive intermolecular
interaction by reducing the electron donor (
are higher compared to low salinity brine.
The effect of these complexes is to reduce cohesive intermolecular
interaction by reducing the electron donor ( ) and acceptor components (
 ), respectively. Therefore, for LSWF, the
average lower concentration of ions at the LSWF pH range means that
there is stronger cohesive interaction which corresponds to lower
thermodynamic work required to create unit interfacial area between
oil and water. Also, in the context of electrostatic/surface charge
density effect on IFT, the interfacial potential difference, which
in this case arises from interfacial negative and positive charges
of polar groups, is experimentally reported to be related to the IFT
in a manner consistent with Poisson–Boltzmann theory that is
inspired by Frenkel and Verwer-Overbeek (Vis et al., 2015).17 The implication is that lower surface complexation
in LSWF means higher interfacial charge density/potential which leads
to lower IFT. In this regard, our interpretation of the IFT effect
can be extended in a robust manner by considering the relative proportions
of acid or basic groups in crude oil. Thus, for low acidic composition,
interfacial site density of deprotonated carboxyl group will not be
sufficient to render surface complexation and surface charge density
sufficient for IFT reduction. Therefore, our theory satisfactorily
explains the reason behind the IFT reduction in published research
works related to LSWF. Since basic site densities are limited at LSWF
pH conditions, crude oils with less acidic groups may not show any
change in IFT, and this has also been reported. We regard our theory
to be more applicable to the inconsistency related to IFT effect in
LSWF compared to saponification and emulsion theories (Katende and
Sagala, 2019)94 for which the in situ condition
of higher pH of LSWF cannot make them feasible. Our explanation is
supported by Bonto et al. (2019)24 who
have correlated the carboxylic sites linearly with the AN by specifying
a minimum site density of Ns>COOH of
0.5/nm2 corresponding to an AN of 0.05 and a maximum Ns>COOH of 2.5/nm2 corresponding
to an AN of
3. We turn our attention to the inconsistent pH effect as follows:
), respectively. Therefore, for LSWF, the
average lower concentration of ions at the LSWF pH range means that
there is stronger cohesive interaction which corresponds to lower
thermodynamic work required to create unit interfacial area between
oil and water. Also, in the context of electrostatic/surface charge
density effect on IFT, the interfacial potential difference, which
in this case arises from interfacial negative and positive charges
of polar groups, is experimentally reported to be related to the IFT
in a manner consistent with Poisson–Boltzmann theory that is
inspired by Frenkel and Verwer-Overbeek (Vis et al., 2015).17 The implication is that lower surface complexation
in LSWF means higher interfacial charge density/potential which leads
to lower IFT. In this regard, our interpretation of the IFT effect
can be extended in a robust manner by considering the relative proportions
of acid or basic groups in crude oil. Thus, for low acidic composition,
interfacial site density of deprotonated carboxyl group will not be
sufficient to render surface complexation and surface charge density
sufficient for IFT reduction. Therefore, our theory satisfactorily
explains the reason behind the IFT reduction in published research
works related to LSWF. Since basic site densities are limited at LSWF
pH conditions, crude oils with less acidic groups may not show any
change in IFT, and this has also been reported. We regard our theory
to be more applicable to the inconsistency related to IFT effect in
LSWF compared to saponification and emulsion theories (Katende and
Sagala, 2019)94 for which the in situ condition
of higher pH of LSWF cannot make them feasible. Our explanation is
supported by Bonto et al. (2019)24 who
have correlated the carboxylic sites linearly with the AN by specifying
a minimum site density of Ns>COOH of
0.5/nm2 corresponding to an AN of 0.05 and a maximum Ns>COOH of 2.5/nm2 corresponding
to an AN of
3. We turn our attention to the inconsistent pH effect as follows:
Disequilibrium conditions resulting from LSWF that causes exchange of hydrogen ions in solution for cations on rock surfaces can only impact pH where there are divalent cations in solution and the concentration of acidic groups of crude oil is sufficiently high. In this regard, adsorption of divalent cations will substitute for hydrogen ions, and the only way pH will increase is where adsorption of hydrogen ions at the oil/water interface can lead to a measurable reduction of its activity in solution, which corresponds to pH increase. Once again, this will be possible if the concentration of acidic groups of crude oil is sufficient, otherwise negligible adsorption of hydrogen ions at the oil–water interface will not yield a measurable pH increase as reported in research works, and this explanation is consistent with the observation of Zhang et al. (2007)107 who observed only a slight pH change in LSWF (Table 6).
Table 6. χ2 Minimization.
| Ao | 0.7250 | 0.0003910 | 0.001156 |
| A computed | 0.728625692361057 | 0.000465467262495810 | 0.00265078403401627 |
| uncertainty | 0.000206111879409201 | 0.00000210541640516250 | 0.000141510166083810 |
| A used | 0.7286 ± 0.0002 | 0.000465 ± 0.000003 | 0.00265 ± 0.00015 |
6. Conclusions
In this research work, we studied the IFT for the oil–brine system using seawater and crude oil samples with varying concentrations of polar components that undergo protonation and deprotonation reactions in response to pH change of the aqueous phase. The development of interfacial electric charge due to ionization of polar groups of the oil phase represents non-van der Waals contribution to the IFT.108 In such systems, the interfacial electric potential difference has been experimentally found to decrease the IFT in a way consistent with the Poisson–Boltzmann theory inspired by Frenkel and Verwey–Overbeek.17 Moreover, we studied oil samples with significant concentrations of asphaltenes which are polar components of crude oils that behave amphoterically at the oil–water interface,18,109 and reduction of oil–water IFT by model asphaltenes has also been reported in the literature110 The implication is that by varying the pH of the aqueous phase to achieve varying degrees of interfacial ionization and electric fields and given that the salinity of seawater is lower than that of normal reservoir brine, our IFT values are expected to be generally lower that those encountered under normal conditions as found in the literature. One reason behind this trend of IFT is that under normal reservoir conditions, surface complexation reactions at the oil–water interface24 involve high concentrations of ions which have the net effect of reducing the interfacial electrostatic potential compared to seawater where the effect is minimal. Our experimental methodology is in line with the research objective of showing the effect of polar component concentrations on IFT.
The IFT between crude oil and brine plays a vital role in enhanced oil recovery schemes, being detrimental to useful viscous drive forces in water flooding in addition to producing dissipative capillary forces (Aghaeifar et al. 2019).111 Given the heterogeneity in crude oil chemical composition, where heteroatomic molecules such as the basic nitrogen group and acidic groups exhibit amphoteric behavior at the oil–water interface, the IFT will depend on the concentration of such polar groups in crude oils, implying that the quality of crude oils will impact the interfacial chemistry of the oil–water interface. Consequently, the brine concentration, which determines interfacial complexation, will equally affect IFT and can be directly linked to technical issues relating to LSWF. In this research work, we have measured the IFTs of crude oils with carrying proportions of polar groups, and in so doing, we have correlated the concentrations of the polar groups with this thermophysical property. We have also theoretically accounted for current observations in LSWF based on the composition of these polar groups as revealed in our research work. The following sums up the conclusion:
-
1.
Oil–water IFT depends on the concentration of polar components,
-
2.
As pH increases, the IFT decreases in a manner that reflects the concentration of polar groups,
-
3.
The higher the concentration of polar groups in crude oil, the higher the IFT at a given pH of aqueous solution,
-
4.
At pH normally encountered in water flooding oil recovery, the most significant contribution to IFT from an electrostatic point of view will come from deprotonation reactions of NA at the oil–water interface,
-
5.
The acid-base behavior of polar groups at the oil–water interface provides a theoretical interpretation of the explicit relationship between oil–water IFT and the electrostatic components of IFT as given by the energy additivity theory,
-
6.
The concentration of polar groups of crude oil enables a more robust theoretical interpretation of current observations in LSWF related to IFT and pH change.
Acknowledgments
We wish to greatly acknowledge the Research Office of Cape Breton University for their relentless effort in supporting the research through internal grants without which this research work would not have been possible. The Documentary Delivery services of Cape Breton University Library also deserve our profound acknowledgement for the timely delivery of pertinent literature.
The authors declare no competing financial interest.
References
- Cheng C.-N.; Lai J.-H.; Huang M.-Z.; Oung J.-N.; Shiea J.. Analysis of Polar Components in Crude Oil-Composition Stability and Characterization. Crude Oil Emulsions; InTech Open, 2012; pp 1–120. [Google Scholar]
- Donaldson E. C.; Crocker M. E.. Characterization of the Crude Oil Polar Compound Extract; Department of Energy, Bartlesville Energy Technology Center: Bartlesville, OK (USA), 1980. [Google Scholar]
- Sørbø I. G.Polar Components in Crude Oils and Their Correlation to Physiochemical Properties. Master Thesis, University of Bergen, Bergen, 2016. [Google Scholar]
- Thomas J. E.Fundamentos De Engenharia De Petróleo Capa comum – 1 janeiro; Capa Comum Rio de Janeiro: Capa Comum, 2001. [Google Scholar]
- Ahmed R. A. Physical properties as indication for chemical composition of petroleum fraction of Hassira and Khurmala crude oil. Int. J. Adv. Eng. Sci. Appl. Math. 2016, 9, 21–26. [Google Scholar]
- Matoug M. M.; Gordon R. Crude Oil Asphaltenes Studied by Terahertz Spectroscopy. ACS Omega 2018, 3, 3406–3412. 10.1021/acsomega.8b00017. [DOI] [PMC free article] [PubMed] [Google Scholar]
- Pinto F. E.; Barros E. V.; Tose L. V.; Souza L. M.; Terra L. A.; Poppi R. J.; et al. Fractionation of asphaltenes in n-hexane and on adsorption onto CaCO3 and characterization by ESI(+)FT-ICR MS: Part I. 2017802, 210, 790–802. 10.1016/j.fuel.2017.09.028 [DOI] [Google Scholar]
- Sun D. A Simple Scheme for Extraction of Asphaltenes from Asphalt at Room Temperature. Coatings 2022, 12, 407–12. 10.3390/coatings12030407. [DOI] [Google Scholar]
- Johan S.; Hemmingsen P. V.; Kallevik H.. The Role of Asphaltenes in Stabilizing Water-in-Crude Oil Emulsions; Springer, 2007. [Google Scholar]
- Czarnecki J.; Tchoukov P.; Dabros T. Possible Role of Asphaltenes in the Stabilization of Water-in-Crude Oil Emulsions. Energy Fuels 2012, 26, 5782–5786. 10.1021/ef300904a. [DOI] [Google Scholar]
- Buckley J. S.; Liu Y.; Xie X.; Morrow N. R. Asphaltenes and Crude Oil Wetting—The Effect of Oil Composition. SPE 1997, 2, 107–119. 10.2118/35366-pa. [DOI] [Google Scholar]
- Mohammed I.; Mahmoud M.; El-Husseiny A.; Al Shehri D. A.; Al-Garadi K.; Kamal M. S.; et al. Impact of Asphaltene Precipitation and Deposition on Wettability and Permeability. ACS Omega 2021, 6, 20091–20102. 10.1021/acsomega.1c03198. [DOI] [PMC free article] [PubMed] [Google Scholar]
- Alvarado V.; Garcia-Olvera G.; Hoyer P.; Lehmann T. E.. Impact of Polar Components on Crude Oil-Water interfacial Film Formation: A Mechanisms for Low-Salinity Waterflooding. SPE Annual Technical Conference and Exhibition 2014, p SPE-170807-MS. [Google Scholar]
- Fowkes F. M. additivity of intermolecular forces at interfaces.determination of the contribution to surface and interfacial tensions of dispersion forces in various liquids1. J. Phys. Chem. 1962, 66, 382. 10.1021/j100808a524. [DOI] [Google Scholar]
- Oss C. J.; Good R. J.; Chaudhury K. Additive and Nonadditive Surface Tension Components and the Interpretation of Contact Angles. Langmuir 1988, 4, 884–891. 10.1021/LA00082A018. [DOI] [Google Scholar]
- Masalmeh S. K.; Oman S. T. Impact of capillary forces on residual oil saturation and flooding experiments for mixed to oil-wet carbonate reservoirs. SCA 2012, 11, 1–14. [Google Scholar]
- Vis M.; Peters V. F.; Blokhuis E. M.; Lekkerkerker H. N.; Erné B. H.; Tromp R. H. Effects of Electric Charge on the Interfacial Tension between Coexisting Aqueous Mixtures of Polyelectrolyte and Neutral Polymer. Macromolecules 2015, 48, 7335–7345. 10.1021/acs.macromol.5b01675. [DOI] [Google Scholar]
- Mokhtari R.; Ayatollahi S. Dissociation of polar oil components in low salinity water and its impact on crude oil–brine interfacial interactions and physical properties. Petrol. Sci. 2019, 16, 328–343. 10.1007/s12182-018-0275-5. [DOI] [Google Scholar]
- Marinova K. G.; Alargova R. G.; Denkov N. D.; Velev O. D.; Petsev D. N.; Ivanov I. B.; et al. Charging of Oil-Water Interfaces Due to Spontaneous Adsorption of Hydroxyl Ions. Langmuir 1996, 12, 2045–2051. 10.1021/la950928i. [DOI] [Google Scholar]
- Abdel-Wali A. Effect of Simple Polar Compounds and Salinity on Interfacial Tension and Wettability of Rock/Oil/Brine System. J. King Saud Univ., Eng. Sci. 1996, 8, 153–162. 10.1016/s1018-3639(18)30655-x. [DOI] [Google Scholar]
- Mahavadi S. C.; Al Hamad M. A.; Ma S. M.; Abdallah W. Role of Polar Species in Determining the Interfacial Tension of a Crude Oil/Water System. Energy Fuels 2022, 36, 8769–8777. 10.1021/acs.energyfuels.2c00557. [DOI] [Google Scholar]
- Moghadasi R.; Moghadasi J.; Kord S. An Experimental Investigation of Water Effects on Asphaltene Surface Behavior through Interfacial Tension Measurements. Iran. J. Oil Gas Sci. Technol. 2018, 7, 45. 10.22050/ijogst.2018.108233.1422. [DOI] [Google Scholar]
- Bai J.-M.; Fan W.-Y.; Nan G.-Z.; Li S.-P.; Yu B.-S. Influence of Interaction Between Heavy Oil Components and Petroleum Sulfonate on the Oil–Water Interfacial Tension. J. Dispersion Sci. Technol. 2010, 31, 551–556. 10.1080/01932690903167475. [DOI] [Google Scholar]
- Bonto M.; Eftekhari A. A.; Nick H. M. An overview of the oil-brine interfacial behavior and a new surface complexation model. Sci. Rep. 2019, 9, 6072. 10.1038/s41598-019-42505-2. [DOI] [PMC free article] [PubMed] [Google Scholar]
- Andersen S. I.; Chandra S. C.; Chen J.; Zeng B. Y.; Zou F.; Mapolelo M. M.; et al. Detection and Impact of Carboxylic Acids at the Crude Oil-Water Interface. Energy Fuels 2016, 30, 4475–4485. 10.1021/acs.energyfuels.5b02930. [DOI] [Google Scholar]
- Drelich J.; Fang C.; White C.. Measurement of interfacial tension. Encyclopedia of Surface and Colloid Science; Marcel Dekker, Inc, 2002; pp 3152–3166. [Google Scholar]
- Speight J.Shale Oil and Gas Production Processes; Gulf Professional Publishing, 2019. [Google Scholar]
- Oss C. J.Interfacial Forces in Aqueous Media, 2nd ed.; Taylor and Fracncis: New York, 2006. [Google Scholar]
- Liang H.; Xu R.; Favis B. D.; Schreiber H. P. Interfacial tension and acid-base approaches to polymer interactions. J. Polym. Sci., Part B: Polym. Phys. 2000, 38, 2096–2104. . [DOI] [Google Scholar]
- Moradi M.; Topchiy E.; Lehmann T. E.; Alvarado V. Impact of ionic strength on partitioning of naphthenic acids in water–crude oil systems – Determination through high-fieldNMR spectroscopy. Fuel 2013, 112, 236–248. 10.1016/j.fuel.2013.05.024. [DOI] [Google Scholar]
- Ivan-Dario P.-T.; Aleksandr M.; Tina P.; Skule S. The role of polar organic components in dynamic crude oil adsorption on sandstones and carbonates. Cienc., Tecnol. Futuro 2020, 10, 5–16. 10.29047/01225383.251. [DOI] [Google Scholar]
- Hermansson K.; Alfredsson M. Molecular polarization in water chains. J. Chem. Phys. 1999, 111, 1993. 10.1063/1.479468. [DOI] [Google Scholar]
- Cassie A. B. D. Contact angles. Discuss. Faraday Soc. 1948, 3, 11–16. [Google Scholar]
- Rentar . What is the Best Crude Oil in the World and Why Are Some Crude Oils Better than Others?, 2018. Retrieved from Fuel Catalyst. https://rentar.com/best-crude-oil-world-crude-oils-better-others/#:~:text=Sulfur%20content%20and%20weight%20are,are%20of%20the%20highest%20quality (accessed 20/08/2022).
- Yoon Y.; Kosacki I.; Srinivasan S.. Naphthenic Acid and Sulfur Containing Crude Oil Corrosion: A Comparative Review. CORROSION 2016; OnePetro: Vancouver, British Columbia, Canada, 2016. [Google Scholar]
- Vieth A.; Wilkes H.. Stable Isotopes in Understanding Origin and Degradation Processes of Petroleum. Handbook of Hydrocarbon and Lipid Microbiology; Springer, 2022; pp 97–111. [Google Scholar]
- Wenger L.; Davis C.; Isaksen G.. Multiple controls on petroleum biodegradation and impact on oil quality oil. 2001 SPE Annual Technical Conference and Exhibition Volume: 5; PE Reservoir Evaluation & Engineering, 2001.
- Takamura K.; Chow R. S. The electric properties of the bitumen/water interface Part II. Application of the ionizable surface-group mode. Colloids Surf. 1985, 15, 35–48. 10.1016/0166-6622(85)80053-6. [DOI] [Google Scholar]
- Boampong L. O.; Rafati R.; Sharifi Haddad A. S. A calibrated surface complexation model for carbonate-oil-brine interactions coupled with reservoir simulation - Application to controlled salinity water flooding. J. Petrol. Sci. Eng. 2022, 208, 109314. 10.1016/j.petrol.2021.109314. [DOI] [Google Scholar]
- Mullins O. C.; Sheu E. Y.; Hammami A.; Marshall A. G.. Asphaltenes, Heavy Oils and Petroelomics; Schlumberger Limited, 2007. [Google Scholar]
- Goual L.; Sedghi M.; Zeng H.; Mostowfi R.; McFarlane O. C.; Mullins O. C. On the formation and properties of asphaltene nanoaggregates and clusters by DC Conductivity and centrifugation. Fuel 2011, 90, 2480–2490. 10.1016/j.fuel.2011.02.025. [DOI] [Google Scholar]
- Achugasim O.; Idongesit E. Precipitation of Heavy Organics (Asphaltenes) from Crude Oil Residue Using Binary Mixtures of n-Alkanes. Adv. Chem. Eng. Sci. 2015, 05, 96–101. 10.4236/aces.2015.51010. [DOI] [Google Scholar]
- Tharanivasan A. K.Asphaltene Precipitation from Crude Oil Blends, Conventional Oils, and Oils with Emulsified Water: Calgary, 2012. Retrieved from. https://www.ucalgary.ca/eng/ENCH/AER/theses/2012%20PhD%20Thesis%20Asok%20Tharanivasan.pdf (accessed 20/08/2022).
- Harkins W. D.; Jordan H. F. A method for the determination of surface and interfacial tension from the maximum pull on a ring. J. Am. Chem. Soc. 1930, 52, 1751–1772. 10.1021/ja01368a004. [DOI] [Google Scholar]
- Moraes L. G.; Rocha R. S.; Menegazzo L. M.; Araújo E. B.; Yukimito K.; Moraes J. C. Infrared spectroscopy: a tool for determination of the degree of conversion in dental composites. J. Appl. Oral Sci. 2008, 16, 145–149. 10.1590/s1678-77572008000200012. [DOI] [PMC free article] [PubMed] [Google Scholar]
- Horner W. L.Pressure Maintenance By Water Injection, Midway Field, Arkansas. Paper Presented at the Drilling and Production Practice; SPE: New York, 1945.
- Archer J. S.; Wall C. G.. Secondary Recovery and Pressure Maintenance. Petroleum Engineering; Springer, 1986; pp 173–190. [Google Scholar]
- Mahmood T.; Saddique M. T.; Naeem A.; Westerhoff P.; Mustafa S.; Alum A. Comparison of Different Methods for the Point of Zero Charge Determination of NiO. Ind. Eng. Chem. Res. 2011, 50, 10017–10023. 10.1021/ie200271d. [DOI] [Google Scholar]
- Su Y.-L.; Fu J.-G.; Li L.; Wang W.-D.; Zafar A.; Zhang M.; et al. A new model for predicting irreducible water saturation in tight gas reservoirs. Petrol. Sci. 20202020, 17, 1087–1100. 10.1007/s12182-020-00429-x. [DOI] [Google Scholar]
- Goda H. M.; Behrenbruch P.; Maier H. R. Alternative modelling approaches for the estimation of irreducible water saturation: Australian hydrocarbon basins. J. Petrol. Sci. Eng. 2007, 57, 60–69. 10.1016/j.petrol.2005.10.013. [DOI] [Google Scholar]
- Zuidema H.; Waters G. W. Ring Method for the Determination of Interfacial Tension. Ind. Eng. Chem. 19411941, 13, 312–313. 10.1021/i560093a009. [DOI] [Google Scholar]
- www.surface-tension.de (accessed 20/08/2022).
- CEMRIC . Cherici. Retrieved from Chemical Engineering and Materials Engineering Research Information Center, 1995, https://www.cheric.org/research/kdb/hcprop/showcoef.php?prop=PVP (accessed 20/08/2022).
- Huh C.; Mason S. A rigorous theory of ring tensiometry. Colloid Polym. Sci. 1977, 255, 460–467. 10.1007/bf01536462. [DOI] [Google Scholar]
- Bevington P. R.Data Reduction and Error Analysis for the Physical Sciences; McGraw-Hill, 1969. [Google Scholar]
- Pugh E. M.; Winslow G. H.. The Analysis of Physical Measurements; Addison Wesley, 1966. [Google Scholar]
- Barth T.; Høiland S.; Fotland P.; Askvik K. M.; Myklebust R.; Erstad K. Relationship between the Content of Asphaltenes and Bases in Some Crude Oils. Energy Fuels 2005, 19, 1624–1630. 10.1021/ef049750a. [DOI] [Google Scholar]
- Pérez-Hernández R.; Mendoza-Anaya D.; Mondragón-Galicia G.; Espinosa M. E.; Rodríguez-Lugo V.; Lozada M.; et al. Microstructural study of asphaltene precipitated with methylene chloride and n-hexane. Fuel 2003, 82, 977–982. 10.1016/s0016-2361(02)00359-9. [DOI] [Google Scholar]
- Peksoz A.; Akay S. K.; Kaya Y.; Ovalioglu H.; Kaynak G.; Yalciner A. Analytical Information on the Asphaltenes from a Few Standard Characterization Techniques , Part A. Energy Sources 2011, 33, 1474–1481. 10.1080/15567030903397909. [DOI] [Google Scholar]
- van der Weerd J.; Loon A. v.; Boo J. J. FTIR Studies of the Effects of Pigments on the Aging of Oil. Stud. Conserv. 2005, 50, 3–22. 10.1179/sic.2005.50.1.3. [DOI] [Google Scholar]
- Alexa E.; Dragomirescu A.; Pop G.; Jianu C.; Dragoş D. The use of FT-IR spectroscopy in the identification of vegetable oils adulteration. J. Food Agric. Environ. 2009, 7, 20–24. [Google Scholar]
- Liu D.; Kong X.; Li M.; Wang Z. Study on the Aggregation of Residue-Derived Asphaltene Molecules. Energy Fuels 2010, 24, 3624–3627. 10.1021/ef100189a. [DOI] [Google Scholar]
- Petersen J. C. Infrared study of hydrogen bonding in asphalt. Fuel 1967, 46, 295. [Google Scholar]
- Jingyan L.; Xiaoli C.; Songbai T.; Wanzhen L. Research on Determination of Nitrogen Content in Petroleum Using Mid-infrared Spectroscopy. China Pet. Process. Petrochem. Technol. 2011, 13, 1–7. [Google Scholar]
- Chakravarthy R.; Naik G. N.; Savalia A.; Sridharan U.; Saravanan C.; Das A. K.; et al. Determination of Naphthenic Acid Number in Petroleum Crude Oils and Their Fractions by Mid-Fourier Transform Infrared Spectroscopy. Energy Fuels 2016, 30, 8579–8586. 10.1021/acs.energyfuels.6b01766. [DOI] [Google Scholar]
- Green J.; Hoff R.; Woodward P.; Stevens L. Separation of liquid fossil fuels into acid, base and neutral concentrates: 1. An improved nonaqueous ion exchange method. Fuel 1984, 63, 1290–1301. 10.1016/0016-2361(84)90440-x. [DOI] [Google Scholar]
- Shi Q.; Zhao S.; Xu Z.; Chung K. H.; Zhang Y.; Xu C. Distribution of Acids and Neutral Nitrogen Compounds in a Chinese Crude Oil and Its Fractions: Characterized by Negative-Ion Electrospray Ionization Fourier Transform Ion Cyclotron Resonance Mass Spectrometry. Energy Fuels 2010, 24, 4005–4011. 10.1021/ef1004557. [DOI] [Google Scholar]
- Bao M.; Chen Q.; Li Y.; Jiang G. Biodegradation of partially hydrolyzed polyacrylamide by bacteria isolated from production water after polymer flooding in an oil field. J. Hazard. Mater. 2010, 184, 105–110. 10.1016/j.jhazmat.2010.08.011. [DOI] [PubMed] [Google Scholar]
- Zojaji I.; Esfandiarian A.; Taheri-Shakib J. Toward molecular characterization of asphaltene from different origins under different conditions by means of FT-IR spectroscopy. Adv. Colloid Interface Sci. 2021, 289, 102314. 10.1016/j.cis.2020.102314. [DOI] [PubMed] [Google Scholar]
- Zhu S.; Li M.; Gamal El-Din M. The roles of pH and draw solute on forward osmosis process treating aqueous naphthenic acids. J. Membr. Sci. 2018, 549, 456–465. 10.1016/j.memsci.2017.12.029. [DOI] [Google Scholar]
- Barros E. V.; Dias H. P.; Pinto F. E.; Gomes A. O.; Moura R. R.; Neto A. C.; et al. Characterization of Naphthenic Acids in Thermally Degraded Petroleum by ESI(−)-FT-ICR MS and 1H NMR after Solid-Phase Extraction and Liquid/Liquid Extraction. Energy Fuels 2018, 32, 2878–2888. 10.1021/acs.energyfuels.7b03099. [DOI] [Google Scholar]
- Meredith W.; Kelland S. J.; Jones D. M. Influence of biodegradation on crude oil acidity and carboxylic acid composition. Org. Geochem. 2000, 31, 1059–1073. 10.1016/s0146-6380(00)00136-4. [DOI] [Google Scholar]
- Liao Y.; Geng A.; Huang H. The influence of biodegradation on resins and asphaltenes in the Liaohe Basin. Org. Geochem. 2000, 40, 312–320. 10.1016/j.orggeochem.2008.12.006. [DOI] [Google Scholar]
- Zaker S.; Parvizi R.; Ghaseminejad E.; Moradi I.; Moradi A. Effect of brine type and pH on the interfacial tension behavior of carbonated brine/crude oil. J. Dispersion Sci. Technol. 2021, 42, 1184–1195. 10.1080/01932691.2020.1735409. [DOI] [Google Scholar]
- Buckley J. S.; Fan T. Crude oil/brine interfacial tensions. Petrophysics 2007, 48, 1–12. [Google Scholar]
- Tzen J.; Lie G.; Huang A. Characterization of the charged components and their topology on the surface of plant seed oil bodies. J. Biol. Chem. 1992, 267, 15626–15634. 10.1016/s0021-9258(19)49582-3. [DOI] [PubMed] [Google Scholar]
- Takeya M.; Shimokawara M.; Elakneswaran Y.; Nawa T.; Takahashi S. Predicting the electrokinetic properties of the crude oil/brine interface for enhanced oil recovery in low salinity water fooding. Fuel 2019, 235, 822–831. 10.1016/j.fuel.2018.08.079. [DOI] [Google Scholar]
- Lu Y.; Najafabadi N. F.; Firoozabadi A. Efect of Temperature on Wettability of Oil/Brine/Rock Systems. Energy Fuel. 2017, 31, 4989–4995. 10.1021/acs.energyfuels.7b00370. [DOI] [Google Scholar]
- Wenger L.; Davis C.; Isaksen G.. Multiple controls on petroleum biodegradation and impact on oil quality oil.2001 SPE Annual Technical Conference and Exhibition Volume: 5; PE Reservoir Evaluation & Engineering, 2001.
- Li J.; Wang F. Pairwise-additive force fields for selected aqueous monovalent ions from adaptive force matching. J. Chem. Phys. 2015, 143, 194505. 10.1063/1.4935599. [DOI] [PMC free article] [PubMed] [Google Scholar]
- Li C.; Li Y.; Pu H. Molecular simulation study of interfacial tension reduction and oil detachment in nanochannels by Surface-modified silica nanoparticles. Fuel 2021, 292, 120318. 10.1016/j.fuel.2021.120318. [DOI] [Google Scholar]
- Hughey C. A.; Minardi C. S.; Galasso-Roth S. A.; Paspalof G. B.; Mapolelo M. M.; Rodgers R. P.; et al. Naphthenic acids as indicators of crude oil biodegradation in soil, based on semi-quantitative electrospray ionization Fourier transform ion cyclotron resonance mass spectrometry. Rapid Commun. Mass Spectrom. 2008, 22, 3968–3976. 10.1002/rcm.3813. [DOI] [PubMed] [Google Scholar]
- Dutta P.; Holland R. Acid-base characteristics of petroleum asphaltenes as studied by non-aqueous potentiometric titrations. Fuel 1984, 63, 197–201. 10.1016/0016-2361(84)90036-x. [DOI] [Google Scholar]
- Das S.; Thundat T.; Mitra S. K. Analytical model for zeta potential of asphaltene. Fuel 2013, 108, 543–549. 10.1016/j.fuel.2013.01.002. [DOI] [Google Scholar]
- Rodriguez-Abreu C.; Delgado-Linares J.; Bullion J. Properties of Venezueln Asphaltenes in the Bulk and Dispursed States. J. Oleo Sci. 2006, 55, 563–571. 10.5650/jos.55.563. [DOI] [Google Scholar]
- Zheng J.; Shao J.; Powers S. E. Asphaltenes from Coal Tar and Creosote: Their Role in Reversingthe Wettability of Aquifer Systems. J. Colloid Interface Sci. 2001, 244, 365–371. 10.1006/jcis.2001.7934. [DOI] [Google Scholar]
- Mahmoud M.; Elkatatny S.; Abdelgawad K. Z. Using high- and low-salinity seawater injection to maintain the oil reservoir pressure without damage. J. Pet. Explor. Prod. Technol. 2017, 7, 589–596. 10.1007/s13202-016-0279-x. [DOI] [Google Scholar]
- Lowe B. M.; Skylaris C.-K.; Green N. G. Acid-base dissociation mechanisms and energetics at the silica–water interface: An activationless process. J. Colloid Interface Sci. 2015, 451, 231–244. 10.1016/j.jcis.2015.01.094. [DOI] [PubMed] [Google Scholar]
- Sparnaay M. On the electrostatic contribution to the interfacial tension of semiconductor/gas and semiconductor/electrolyte interfaces. Surf. Sci. 1964, 1, 213–224. 10.1016/0039-6028(64)90028-7. [DOI] [Google Scholar]
- Chen Y.; Ubaidah A.; Yogarajah E.; Niasar V. J.; Xie Q. Detecting pH and Ca2+ increase during low salinity waterflooding in carbonate reservoirs: Implications for wettability alteration process. J. Mol. Liq. 2020, 317, 114003. 10.1016/j.molliq.2020.114003. [DOI] [Google Scholar]
- Al-Saedi H. N.; Alhuraishawy ·. A.; Flori ·. R.; Brady P. V. Sequential injection mode of high-salinity/low-salinity waterin sandstone reservoirs: oil recovery and surface reactivity tests. J. Pet. Explor. Prod. Technol. 2019, 9, 261–270. 10.1007/s13202-018-0466-z. [DOI] [Google Scholar]
- Neog D. Effect of temperature on the pH of water flood effluents and irreducible water saturation: A study with reference to the Barail sandstone outcrop of the upper Assam Basin. J. Pet. Explor. Prod. Technol. 2022, 12, 1129–1145. 10.1007/s13202-021-01384-y. [DOI] [Google Scholar]
- Chai R.; Liu Y.; He M. C.; Cai J.; Zhang F.; Liu L.; Xue L. Effects and Mechanisms of Acidic Crude Oil–Aqueous Solution Interaction in Low-Salinity Waterflooding. Energy Fuels 2021, 35, 9860–9872. 10.1021/acs.energyfuels.1c00654. [DOI] [Google Scholar]
- Katende A.; Sagala F. A Critical review of Low Salinity Water Flooding: Mechanism, Laboratory and Field Application. J. Mol. Liq. 2019, 278, 627–649. 10.1016/j.molliq.2019.01.037. [DOI] [Google Scholar]
- Hamon G. Low salinity water flooding: facts, inconsistencies and way forward. Petrophysics 2016, 57, 41–50. [Google Scholar]
- Bandura A. V.; Lvov S. N. The Ionization Constant of Water over Wide Ranges of Temperature and Density. J. Phys. Chem. Ref. Data 2006, 35, 15–30. 10.1063/1.1928231. [DOI] [Google Scholar]
- Al-Attar H. H.; Mahmoud M. Y.; Zekri A. Y.; Almehaideb R.; Ghannam M. Low-salinity flooding in a selected carbonate reservoir:experimental approach. J. Pet. Explor. Prod. Technol. 2013, 3, 139–149. 10.1007/s13202-013-0052-3. [DOI] [Google Scholar]
- Shehata A. M.; Nasr-El-Din H. Laboratory investigations to determine the effect of connate-water composition on low salinity waterflooding in sandstone reservoirs. SPE Reservoir Eval. Eng. 2017, 20, 059–076. 10.2118/171690-pa. [DOI] [Google Scholar]
- Ayirala S. C.; Yousef A. A.; Li Z.; Xu Z. Coalescence of Crude Oil Droplets in Brine Systems: Efect of Individual Electrolytes. Energy Fuel. 2018, 32, 5763–5771. 10.1021/acs.energyfuels.8b00309. [DOI] [Google Scholar]
- Salehi M. M.; Omidvar P.; Naeimi F. Salinity of injection water and its impact on oil recovery, absolute permeability, residual oil saturation, interfacial tension and capillary pressure. Egypt. J. Pet. 2017, 26, 301–312. 10.1016/j.ejpe.2016.05.003. [DOI] [Google Scholar]
- Al-Saedi H. N.; Alhuraishawy ·. A.; Flori ·. R.; Brady P. V. Sequential injection mode of high-salinity/low-salinity waterin sandstone reservoirs: oil recovery and surface reactivity tests. J. Pet. Explor. Prod. Technol. 2019, 9, 261–270. 10.1007/s13202-018-0466-z. [DOI] [Google Scholar]
- Calvimontes A. The measurement of the surface energy of solids using a laboratory drop tower. npj Microgravity 2017, 3, 1–14. 10.1038/s41526-017-0031-y. [DOI] [PMC free article] [PubMed] [Google Scholar]
- Tian H.; Wang M. Electrokinetic mechanism of wettability alternation at oil-water-rock interface. Surf. Sci. Rep. 2017, 72, 369–391. 10.1016/j.surfrep.2018.01.001. [DOI] [Google Scholar]
- Ayirala S. C.; Al-Yousef A. A.; Li Z.; Xu Z. Water Ion Interactions at Crude-Oil/Water Interface and Their Implications for Smart Waterflooding in Carbonates. SPE J. 2018, 23, 1817–1832. 10.2118/183894-pa. [DOI] [Google Scholar]
- Guttmann R.; Hoja J.; Lechner C.; Maurer R. J.; Sax A. F. Adhesion, forces and the stability of interfaces. Beilstein J. Org. Chem. 2019, 15, 106–129. 10.3762/bjoc.15.12. [DOI] [PMC free article] [PubMed] [Google Scholar]
- Xie Q.; Sari A.; Pu W.; Chen Y.; Brady P. V.; Al Maskari N.; et al. pH effect on wettability of oil/brine/carbonate system: Implications for low salinity water flooding. J. Petrol. Sci. Eng. 2018, 168, 419–425. 10.1016/j.petrol.2018.05.015. [DOI] [Google Scholar]
- Zhang Y.; Xie X.; Morrow N.. Waterflood performance by injection of brine with different salinity for reservoir cores. Proceedings of the SPE Annual Technical Conference and Exhibition. Conference and Exhibition Anaheim, California, 11–14 November; Society of Petroleum Engineer: USA, 2007; pp 1217–1228).
- Kallio T.; Laine J.; Stenius P. Intermolecular Interactions and the Adhesion of Oleic Acid. J. Dispersion Sci. Technol. 2009, 30, 222–230. 10.1080/01932690802500719. [DOI] [Google Scholar]
- Verruto V. J.; Le R. K.; Kilpatrick P. K. Adsorption and Molecular Rearrangement of Amphoteric Species at Oil–Water Interfaces. J. Phys. Chem. B 2009, 113, 13788–13799. 10.1021/jp902923j. [DOI] [PubMed] [Google Scholar]
- Jian C.; Poopari M. R.; Liu Q.; Zerpa N.; Zeng H.; Tang T. Reduction of Water/Oil Interfacial Tension by Model Asphaltenes: The Governing Role of Surface Concentration. J. Phys. Chem. B 2016, 120, 5646–5654. 10.1021/acs.jpcb.6b03691. [DOI] [PubMed] [Google Scholar]
- Aghaeifar Z.; Strand S.; Puntervold T. Significance of Capillary Forces during Low-Rate Waterflooding. Energy Fuels 2019, 33, 3989. 10.1021/acs.energyfuels.9b00023. [DOI] [Google Scholar]