Abstract
OBJECTIVE
The T1GER (A Study of SIMPONI to Arrest β-Cell Loss in Type 1 Diabetes) study showed many metabolic benefits of the tumor necrosis factor-α blocker golimumab in children and young adults with type 1 diabetes (T1D). Off-therapy effects are reported.
RESEARCH DESIGNS AND METHODS
T1GER was a phase 2, placebo-controlled, randomized trial in which golimumab or placebo was administered for 52 weeks to participants 6–21 years old diagnosed with T1D within 100 days of randomization. Assessments occurred during the 52-week on-therapy and 52-week off-therapy periods.
RESULTS
After treatment was stopped, C-peptide area under the curve (AUC) remained greater in the treatment versus control group. At weeks 78 and 104, the golimumab group had lower reductions in the 4-h C-peptide AUC baseline than the placebo group, where specifically the golimumab group had reductions of 0.31 and 0.41 nmol/L, and the placebo group had reductions of 0.64 and 0.74 nmol/L. There were also trends in less insulin use, higher peak C-peptide levels and those in partial remission, and higher peak C-peptide levels in the golimumab group. Golimumab responders, defined as having an increase or minimal loss of C-peptide AUC and/or being in partial remission at week 52, showed even greater improvements in most metabolic parameters on and off therapy and had less hypoglycemia during the off-therapy period versus placebo. Adverse events, including infections, were similar between the groups during all time periods of the study.
CONCLUSIONS
In children and young adults with new-onset T1D, golimumab preserved endogenous β-cell function and resulted in other favorable metabolic parameters on and off therapy. A subpopulation had disease stabilization while on therapy, with improved metabolic parameters off therapy.
Graphical Abstract
Introduction
Type 1 diabetes (T1D) is the result of a coordinated autoimmune attack on pancreatic β-cells by many components of the immune system. Although cellular components of the immune system, in particular T and B lymphocytes and cells from the innate immune system (i.e., neutrophils) are considered the key participants in this process, proinflammatory cytokines also appear to play a critical role in the initiation and propagation of β-cell autoimmunity (1–3).
One of the cytokines that appears critical in the diabetogenic process is tumor necrosis factor-α (TNF-α). TNF-α activates and accentuates immune responses by enhancing inflammation and promoting lymphocyte activation and activity (4). In addition, TNF-α can directly cause β-cell injury through endoplasmic reticulum stress pathways (5–7). As such, TNF-α may contribute to β-cell dysfunction and death in T1D by both enhancing destructive autoimmunity and direct β-cell toxicity (4–7).
Golimumab is a human IgG1-κ monoclonal antibody that binds and neutralizes human TNF-α. It is a member of the class of TNF-α antagonists that have been used as a long-term therapy for a variety of autoimmune conditions in adults and children, with a clinical experience of more than a quarter of a century. Golimumab was first approved in 2013. It is now approved for adults with rheumatoid arthritis, psoriatic arthritis, ankylosing spondylitis, nonradiographic axial spondyloarthritis, and ulcerative colitis, and in children, ≥2 years old, with polyarticular juvenile idiopathic arthritis and psoriatic arthritis (8,9). Golimumab is most frequently dosed subcutaneously and can be self-administered.
The T1GER (A Study of SIMPONI to Arrest β-Cell Loss in Type 1 Diabetes) study examined TNF-α blockade in human T1D (10). It was a phase 2, multicenter, randomized, placebo-controlled clinical trial in children and young adults 6–21 years old with new-onset T1D. Participants received golimumab or placebo for 52 weeks and were observed for an additional 52 weeks off therapy. The week 52 on-therapy results of the T1GER trial showed golimumab resulted in significant preservation of endogenous insulin production, with improvements in other metabolic parameters (10). It was well tolerated and there were no new safety signals. In order to continue to monitor for safety and metabolic effects, the study included a 52-week off-therapy observation period, detailed herein.
RESEARCH DESIGN AND METHODS
Study Design
Details of the T1GER study design and week 52 results have been previously reported (10). The primary objective of this study was to determine whether golimumab can preserve β-cell function in children and young adults with newly diagnosed T1D and was assessed according to the area under the concentration–time curve (AUC) for C-peptide level in response to a 4-h mixed-meal tolerance test (MMTT) at week 52. Secondary objectives were to evaluate the impact, and off-therapy durability, of golimumab on measures of diabetes control through the treatment period (week 52) and 1-year posttreatment (week 104). The trial was registered with ClinicalTrials.gov (NCT02846545).
Briefly, entry criteria included individuals being 6–21 years old at the time of randomization, having received a diagnosis of T1D within 100 days of randomization, being positive for one of five T1D autoantibodies, and having a peak C-peptide level of at least 0.2 nmol/L after a MMTT. Per protocol, all participants agreed to follow a multiple daily injection regimen or continuous subcutaneous insulin infusion to strive toward their American Diabetes Association–recommended glycemic targets at the time of study start, which were an HbA1c target of <7.5% in children ≤17 years old and <7% in those ≥18 years old. Blood glucose (BG) monitoring was by fingerstick BG assessment and/or continuous glucose monitoring at the discretion of the local investigator. If the participant used fingerstick BG assessments, glucose levels were to be checked at least four times daily.
Participants received two subcutaneous induction doses of study treatment 2 weeks apart and then subcutaneously every 2 weeks for 52 weeks. Those <45 kg received induction doses of 60 mg/m2 and maintenance doses of 30 mg/m2, while those ≥45 kg received induction doses of 100 mg and maintenance doses of 50 mg. After training at the study site, participants or caregivers could administer the study treatment at home. The last injection was at week 52, and there were off-therapy follow-up visits at weeks 78 and 104.
Throughout the study, clinical, metabolic, laboratory, and safety assessments were conducted. At key visits, a 4-h MMTT was performed, HbA1c was assessed, and insulin use and data on hypoglycemia were recorded.
Responder Definitions
C-peptide and/or partial-remission responders were defined based on week 52 data. C-peptide responders were defined as having an increase in or a decrease of ≤5% in the week 52 C-peptide AUC compared with baseline. The partial-remission responder definition was met if the participants had an insulin dose–adjusted A1C (IDAA1C) value of ≤9 at week 52 (11).
Single Patient Investigational New Drug and Open-Label Extension Participants
Continuation of golimumab after week 52 was not planned in this study. However, one patient withdrew after the week 52 visit and entered into a Single Patient Investigational New Drug (SPIND; NCT03945903) after having been confirmed as receiving the study drug through week 52 and meeting specific entry criteria defined in the SPIND. In the interest of extending the same opportunity to participants remaining in the study, an Open-Label Extension (OLE) was incorporated to the protocol where golimumab could be restarted if participants met the following criteria: had received golimumab during the active treatment period, were still enrolled in the off-therapy (i.e., weeks 52–104) portion of the study, were C-peptide responders, as defined above during a 4h MMTT, C-peptide AUC, and/or were in partial T1D remission, as defined above, at their most recent visit and prior to week 104. Participants who did not meet the responder criteria, or met the responder criteria but declined participation in the OLE, or were in the placebo group, continued to be monitored per protocol.
Statistical Analyses
The sample size calculation and primary and secondary statistical analyses have been published (10). For the analyses presented herein, the 4-h C-peptide AUC, insulin use, HbA1c, peak C-peptide, IDDA1C scores, and percentage of participants in T1D partial mission (or with a peak C-peptide ≥0.2 nmol/L) were longitudinally assessed across the totality of the study, inclusive of both the treatment and off-therapy periods. The lag time of C-peptide degradation was based on previous analyses (12,13). Hypoglycemia, in terms of events per patient-year, was assessed during the treatment period, off-therapy period, and the totality of the study. Participants with missing data were not included in these analyses.
Results
Participant Numbers, Characteristics, and Adverse Events
A total of 84 participants were randomized, and 56 (67%) received golimumab and 28 (33%) placebo. The retention details until week 52 have been published, and the weeks 52–104 findings are summarized in Supplementary Fig. 1. Between weeks 52 and 104, seven participants left the study, five in the golimumab group and two in the placebo group.
In the golimumab group, one participant continued golimumab in a SPIND program and left the study at week 52. Five entered the OLE program due to a favorable response to golimumab, two between week 78 and 104 and three after week 104 (Supplementary Fig. 1). Those who participated in the SPIND or OLE equaled 11% of the initial golimumab group. Others in the golimumab group left for being lost to follow-up. The placebo participants left, either due to being lost to follow-up or to nonadherence with the protocol (Supplementary Fig. 1).
There were no major imbalances between treatment groups or subgroups described below (Supplementary Table 1).
Key safety events during the off-therapy period and the total study are summarized in Table 1 and Supplementary Table 2. Adverse events, including infections, were similar between the groups. There were no serious or opportunistic infections, neoplasms, or deaths in either group.
Table 1.
Overview of adverse events in golimumab- and placebo-treated participants
| Week 0–52 | Week 52–104 | Week 0–104 | ||||
|---|---|---|---|---|---|---|
| Placebo | Golimumab | Placebo | Golimumab | Placebo | Golimumab | |
| Analysis set: safety, n | 28 | 56 | 25 | 49 | 28 | 56 |
| Average duration of follow-up (weeks) | 50.15 | 49.99 | 52.29 | 53.56 | 96.84 | 96.85 |
| Any adverse event | 23 (82.1) | 51 (91.1) | 19 (76.0) | 38 (77.6) | 25 (89.3) | 54 (96.4) |
| Leading to discontinuation | 0 | 2 (3.6) | 0 | 0 | 0 | 2 (3.6) |
| Related to trial agent | 12 (42.9) | 24 (42.9) | 2 (8.0) | 9 (18.4) | 12 (42.9) | 24 (42.9) |
| Any serious adverse event | 1 (3.6) | 1 (1.8) | 1 (4.0) | 4 (8.2) | 2 (7.1) | 5 (8.9) |
| Death | 0 | 0 | 0 | 0 | 0 | 0 |
| Pregnancy | 0 | 0 | 0 | 1 (2.0) | 0 | 0 |
| Any infection | 17 (60.7) | 40 (71.4) | 13 (52.0) | 17 (34.7) | 19 (67.9) | 42 (75.0) |
| Serious infection | 0 | 0 | 0 | 0 | 0 | 0 |
| Opportunistic infection | 0 | 0 | 0 | 0 | 0 | 0 |
| Active tuberculosis | 0 | 0 | 0 | 0 | 0 | 0 |
| Malignancy | 0 | 0 | 0 | 0 | 0 | 0 |
| Injection site reaction | 8 (28.6) | 12 (23.2) | 0 | 0 | 8 (28.6) | 13 (23.2) |
| New or worsening autoimmune disease | 1 (3.6) | 0 | 0 | 2 (4.1) | 1 (3.6) | 2 (3.6) |
Data are presented as n (%) or as indicated otherwise. Incidence is based on the number of subjects experiencing at least one adverse event. Week 0–52 summarizes adverse events with onset through week 52, including the last day of the treatment period, while week 52–104 summarizes adverse events with onset after week 52 through week 104.
Efficacy Analyses
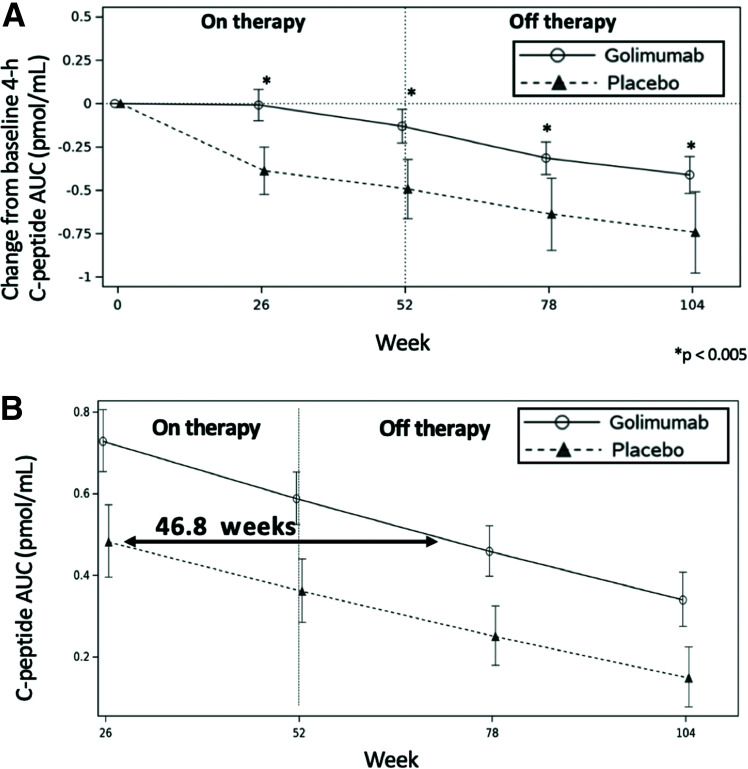
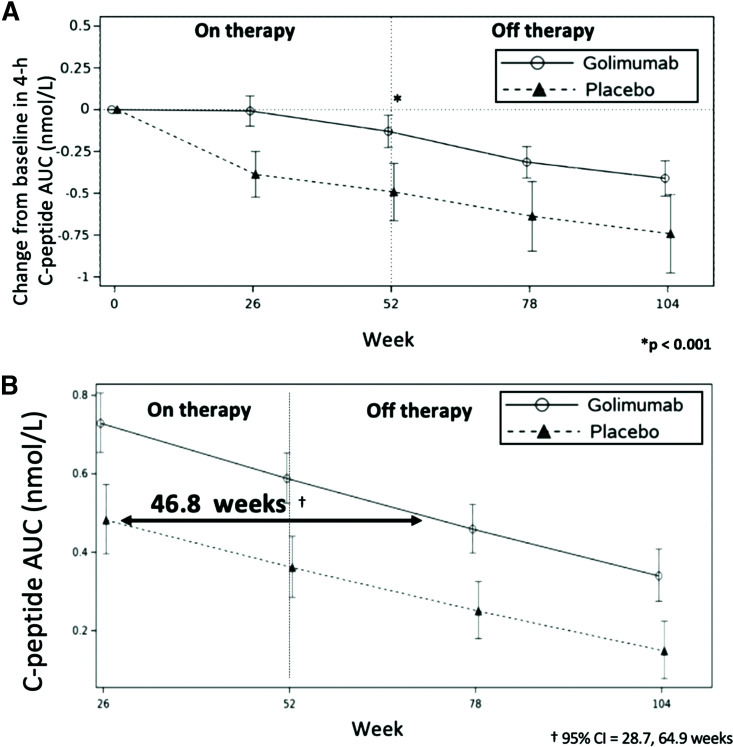
As shown in Fig. 1A, following the discontinuation of treatment at week 52, the golimumab-treated participants continued to have preservation of endogenous insulin production (as demonstrated by the 4-h MMTT C-peptide AUC) throughout the off-therapy period. At weeks 78 and 104, the golimumab group had 4-h C-peptide AUC reductions from baseline of 0.31 and 0.41 nmol/L, respectively, while the placebo group had a greater reduction in the 4-h C-peptide AUC at weeks 78 and 104 of 0.64 and 0.74 nmol/L, respectively.
Figure 1.
Change in the 4-h C-peptide AUC over time and lag time of C-peptide decline in those treated with golimumab or placebo over 52 weeks on therapy and observed for an additional 52 weeks off therapy. A: Mean change in AUC of the 4-h C-peptide from baseline over time by treatment group. B: Comparative rate of fall (slope) in the C-peptide AUC by treatment group as a whole.
When data from the entirety of the study were used to estimate the impact of treatments on delaying the decline of C-peptide, the lag time of C-peptide decline in the golimumab versus placebo participants was 46.8 weeks (with a 95% CI of 28.7 to 64.9 months) (Fig. 1B) (12,13).
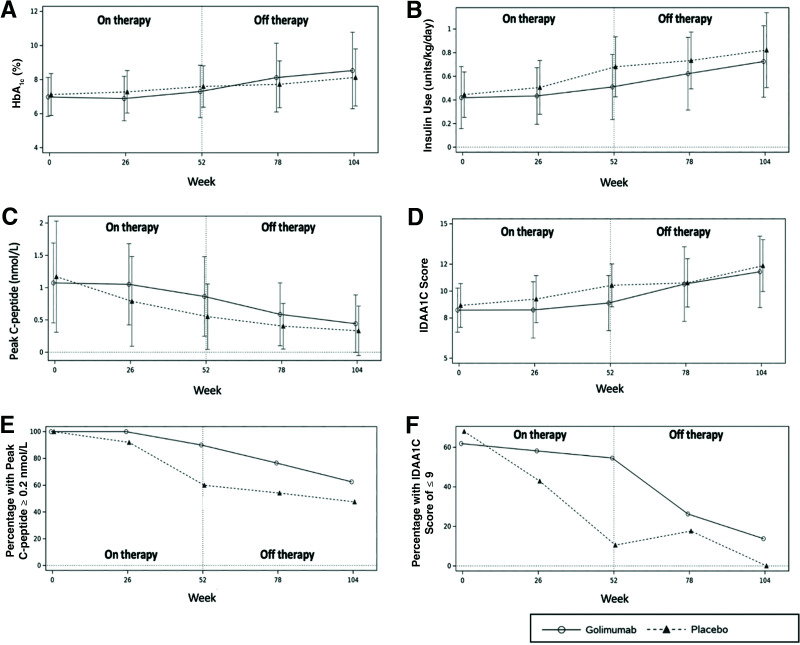
The golimumab group had trends to better metabolic parameters at weeks 78 and 104 than the placebo group (Fig. 2). These included lower insulin use, higher peak C-peptide levels, and peak C-peptide levels ≥0.2 nmol/L.
Figure 2.
Additional metabolic analyses in the in golimumab group as a whole vs. the placebo group from baseline to week 104. HbA1c (A), exogenous insulin use (B), peak C-peptide levels (C), and IDAA1C score (D). E: Percentage of participants with C-peptide ≥0.2 nmol/L. F: Percentage of participants in T1D partial remission, defined as an IDAA1c score of ≤9.
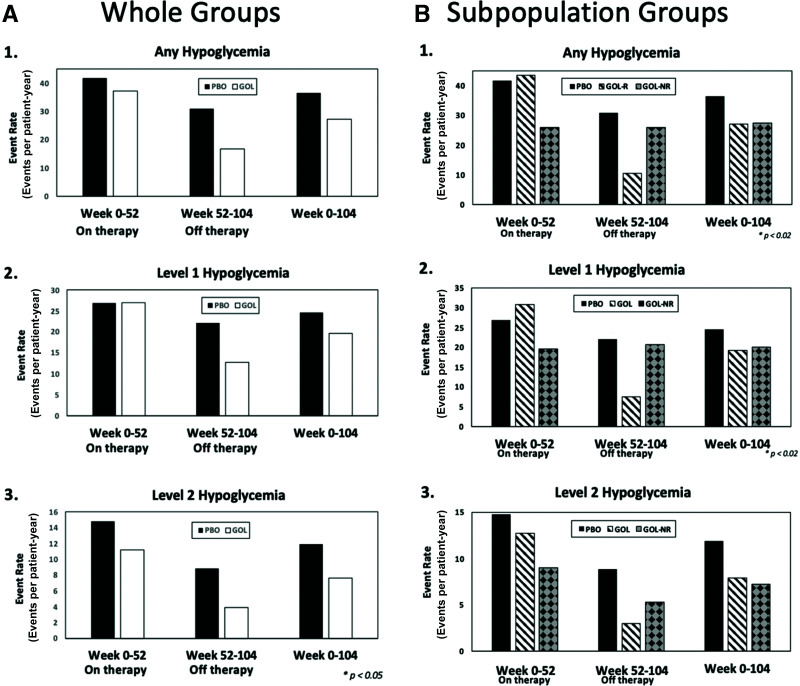
As shown in Fig. 3A, off-therapy rates of any hypoglycemia (BG <70 mg/dL) and level 1 hypoglycemia (BG <70 but ≥54 mg/dL) were ∼40–50% lower than the rates observed in the placebo group. Level 2 (BG <54 mg/dL) off-therapy hypoglycemic event rates in the golimumab group exceeded a 50% reduction from placebo (14). During the totality of the study (weeks 0–104), the rates of any hypoglycemia and level 1 hypoglycemia were similar between groups, yet again with a lower event rate of level 2 hypoglycemia in the golimumab group compared with the placebo group (7.65 vs. 11.93 events/patient-year, respectively). No level 3 (symptomatic) hypoglycemic events were reported in either arm throughout the course of the study (14).
Figure 3.
Hypoglycemia in the whole (A) and subpopulation (B) treatment groups. 1: Annualized event rates (events per patient-year) of BG levels <70 mg/dL during the on-therapy period (week 0–52), off-therapy period (week 52–104), and the entirety of the study (week 0–104). 2: Annualized event rates (events per patient-year) of BG levels <70 mg/dL but ≤54 mg/dL during the on-therapy period (week 0–52), off-therapy period (week 52–104), and the entirety of the study (week 0–104). 3: Annualized event rates (events per patient-years) of BG levels <54 mg/dL during the on-therapy period (weeks 0–52), off-therapy period (weeks 52–104), and the entirety of the study (week 0–104). GOL, golimumab group (as a whole); GOL-NR, golimumab nonresponder subgroup; GOL-R, golimumab responder subgroup; PBO, placebo group.
As an additional noteworthy observation, at the end of the treatment period, clinically relevant values for IDAA1C scores and peak C-peptide were better in the golimumab group than in the placebo group. An IDAA1C of ≤9 defines a period of partial T1D remission, known as the “honeymoon period,” where good glycemic control with low insulin use is experienced (11). Although not an absolute cutoff, a peak C-peptide of ≥0.2 nmol/L is strongly associated with improved mid- and long-term clinical outcomes, including those of microvascular disease (15–17). More golimumab participants met these criteria at week 52 than placebo participants, 43% vs. 7% (P = 0.0008) for partial remission and 80% vs. 54% (P = 0.008) for peak C-peptide of ≥0.2 nmol/L, respectively.
Responder Analyses
The study had two predefined responder definitions for clinically meaningful metabolic stabilization: one was based on the extent of C-peptide preservation, and the other was based on IDAA1C scores, both at week 52. In the natural history of T1D in most individuals, there is progressive β-cell end organ dysfunction and failure and resultant substantial decline of endogenous insulin production after a year from diagnosis as assessed by C-peptide levels. As such, a C-peptide responder was defined as an individual who had an increase or minimal loss (≤5%) of the C-peptide AUC at week 52 compared with baseline (10). The mean change from baseline at week 52 for the MMTT-stimulated 4-h C-peptide AUC (pmol/mL) was −0.13 (95% CI −0.23 to −0.03) for the golimumab group and −0.49 (95% CI −0.66 to −0.32) for the placebo group.
The second responder definition was an IDAA1C value of ≤9, indicating partial T1D remission (11). The IDAA1C score incorporates both exogenous insulin use and HbA1c and is calculated as four times the insulin dose in units/kg/day + the HbA1c %. The percentage of individuals in partial remission peaks at ∼40–70% 3–4 months after diagnosis and is ∼30% or less after 12 months (11). The mean IDAA1C score at week 52 was 9.1 (SD = 1.6) for the golimumab group and 10.4 (SD = 2.0) for the placebo group.
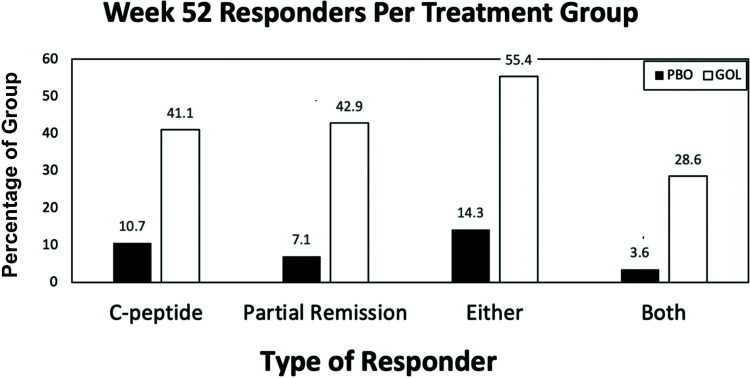
Taking into consideration both responder definitions, participants were categorized as C-peptide responders, partial-remission responders, or either, both, or neither (nonresponders). As shown in Fig. 4, more than half (∼55%) of the golimumab group met either criterion, fourfold greater than the placebo group. Almost one-third (∼29%) of the golimumab group met both criteria compared with <5% in the placebo group, accounting for almost a sixfold difference.
Figure 4.
Percentages of responders by treatment group. Percentages of participants in the golimumab or placebo groups who had C-peptide levels ≥5% loss from baseline at week 52 (C-peptide), an IDAA1C score of ≤9 at week 52 (partial remission), either or both at week 52. GOL, golimumab group; PBO, placebo group.
There were no obvious distinguishing baseline characteristics between groups (Supplementary Table 2).
Owing to small numbers and the concept that both of the responder criteria are clinically relevant, readily accessible, and actionable, the metabolic parameters of both golimumab-responder groups were combined and assessed over time.
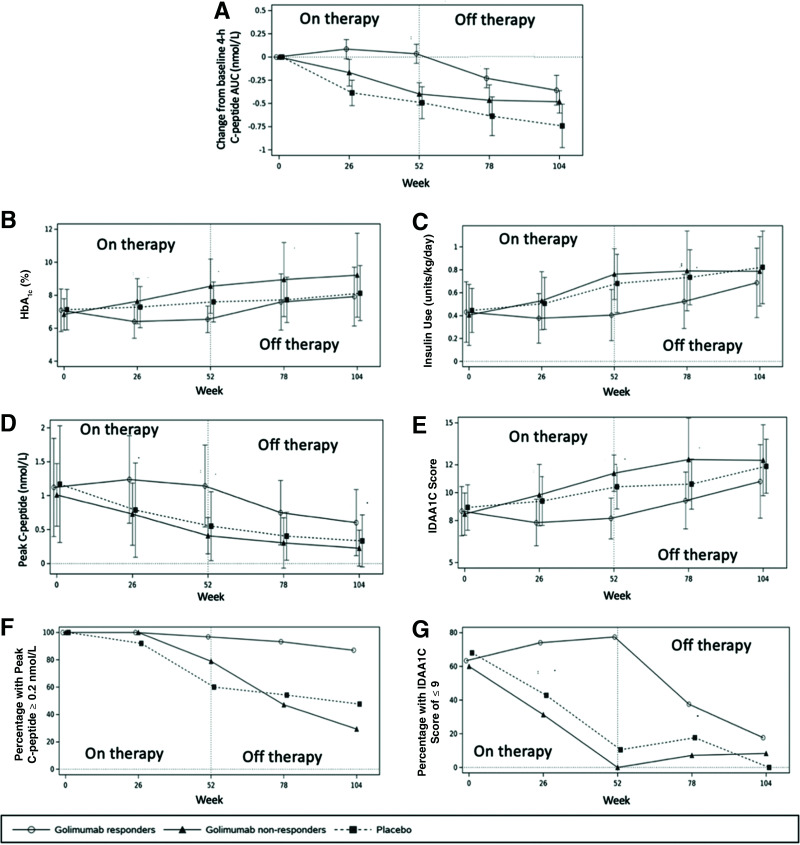
During the on-therapy period, from baseline to week 52, all but one of the glycemic parameters numerically improved in the golimumab responders (Fig. 5). The only value that “worsened” was the percentage of those with a peak C-peptide ≥0.2 nmol/L, which decreased 3.2%, from 100 to 96.8%, representing just one patient in the golimumab-responder population (Fig. 5G).
Figure 5.
Metabolic analyses in the in golimumab subgroups vs. the placebo group from baseline to week 104. A: Mean change in AUC of 4-h C-peptide from baseline over time. HbA1c (B), exogenous insulin use (C), peak C-peptide levels (D), and IDAA1C score (E). F: Percentage of participants with C-peptide ≥0.2 nmol/L. G: Percentage of participants in T1D partial remission, defined as an IDAA1C score of ≤9.
In responders, golimumab modified the natural progression of T1D and improved every assessed metabolic parameter compared with placebo (Fig. 5). At week 52, the golimumab-responder group had better metabolic parameters than the placebo group: higher C-peptide AUCs, lower HbA1c values, lower insulin use, lower IDDA1C scores, higher peak C-peptide levels, more participants in T1D partial remission, and more with a peak C-peptide of ≥0.2 nmol/L. As shown in Fig. 5, a number of these benefits lasted well beyond discontinuation of therapy.
Golimumab responders also had lower rates of hypoglycemia during the off-therapy period compared with placebo. Rates of any hypoglycemia were 10.56 vs. 30.9 events/patient-year, level 1 hypoglycemia rates were 7.55 vs. 22.06, and level 2 rates were 3.01 vs. 8.85 in the golimumab-responder group and the placebo group, respectively. There were numerically lower rates of level 2 hypoglycemia in the golimumab-responder versus placebo group during the entirety of the study, with rates of 7.92 vs. 11.93 events/patient-year, respectively (Fig. 3B).
Conclusions
The management of T1D has not changed conceptually in a century. The mainstay of treatment is insulin and disease management guided by BG monitoring and measurement of HbA1c. Neither of these addresses the underlying autoimmune pathoetiology of the disease. In the past decade, there have been significant advances in the development of insulin products and delivery and methods for improved glycemic monitoring, including the advent of closed-loops systems (“artificial pancreases”). Even with these advances, metabolic control in many demographics is not improving (19, 20). There are immediate and long-term disease and insulin-associated morbidities and mortalities. In this era of medicine and health care and advances in diabetes management, those with T1D have twice the mortality than matched control subjects and have a life expectancy reduced by almost two decades (20,21).
At the clinical presentation of T1D, there may be >20% of baseline glucose-sensing and insulin-secreting β-cells (22). Many of those newly diagnosed with T1D experience partial remission (i.e., the “honeymoon” period) due to temporary rejuvenation of these cells. These residual β-cells can participate in and can ease care and improve the management of T1D (11).
T1D is member of a small group of autoimmune diseases for which there are currently no approved disease-modifying therapies. Investigation of therapies to help maintain β-cell function in T1D is the cornerstone of decades of research (1–3). In the dozens of trials that have been conducted, only a few have shown the ability to preserve endogenous insulin production, and these all have been agents that target immune system processes/pathways. This supports and confirms the autoimmune basis of the disease. Mechanisms that have shown success include T-cell and B-cell modulators and, with this study, the proinflammatory cytokine TNF-α (1–3).
This report extends the findings of our study showing that the TNF-α blockader golimumab improves the metabolic and clinical course of T1D (10). At week 52 while on therapy, there was little degradation of β-cell function in the golimumab group as a whole. It is notable that after 6 months of nearly complete C-peptide AUC stabilization, there is loss in the C-peptide AUC in the golimumab group as a whole thereafter. The timing of this loss is similar to other trials using rituximab, abatacept, and low-dose anti-thymocyte globulin (12, 13, 18). It is notable that with 12 months of therapy, there was almost an 11-month delay in the loss of endogenous insulin production. This equates to a delay of ∼27 days of disease progression for every 30 days of treatment and is longer than that reported for any disease modifier (12,13).
In the golimumab-responder group, there was a slight increase in the C-peptide AUC at 1 year compared with baseline, which is very different from the natural history of disease where, during this time frame, there is typically a loss of at least one-third of β-cell function (23). Additional natural history studies have shown <30% of individuals are in partial remission at 1 year; however, in this study, at ∼14.5 months after diagnosis, about half (52%) of the golimumab group were in partial remission versus ∼10% of the placebo group. Among responders, more than two-thirds (70%) were in partial remission. All study participants had clinically relevant peak C-peptide levels of ≥2 nmol/L at study entry; this dropped to 60% of the placebo group after 1 year, whereas 90% and 97% of the golimumab total group and golimumab responders, respectively, met this clinically relevant criterion at 1 year.
TNF-α is a key mediator in a number of autoimmune diseases, and agents that target TNF-α arguably have had some of the broadest and longest success and experience in autoimmunity and have been used as a long-term therapy in these conditions. In this study, when golimumab was stopped, there was a decay in endogenous insulin production, but even after 1 year off therapy, there were still positive effects, including higher endogenous insulin production, lower hypoglycemic rates, and trends to improvement in other metabolic parameters compared with placebo.
During the conduct of this study, five golimumab-responsive participants were excluded from week 104 analysis either as part of a SIND or because they were elected to enter into an OLE. It is possible that the analysis here therefore underestimates the effects as these patients all met “responder criteria” at the time they were excluded from further analysis. This may be the first report of an interventional study in T1D where there was such an array of benefits interpreted by investigators that the sponsor developed programs to continue therapy in an open-label manner.
More than half of those who received golimumab had a positive on-therapy response, defined as an increase or little degradation of endogenous insulin production and/or continuing to be in partial disease remission at 1 year (“golimumab responders”). The C-peptide and IDAA1C scores are evaluations that can be assessed routinely by endocrinologists. There were no routine clinical or demographic criteria assessed at study entry that would a priori identify golimumab responsiveness in a given individual.
Golimumab responders appear to have minimal or no disease progression for >1 year while on therapy. At 1 year, on average, C-peptide levels increased and insulin use, HbA1c, and IDDA1C scores decreased. Those in partial remission or who had peak C-peptide levels of ≥0.2 nmol/L were substantially higher than placebo and from natural history reports. In these responders, clinically assessed T1D disease progression was arguably arrested.
While those in the responder group(s) had definitive improvements in many metabolic parameters on and off golimumab therapy, those in the nonresponder groups had no obvious detrimental impacts on their metabolic parameters, supporting the general known safety profile of golimumab and raising no T1D disease-specific concerns.
One of the more interesting findings of this study was that while on golimumab therapy, there was little impact on any hypoglycemia compared with placebo; however, during the off-therapy period, the golimumab-responder group showed a substantial and consistent reduction across all levels of hypoglycemic events compared with the placebo group. It is not known whether these lower rates are due to physiologic/metabolic mechanisms (i.e., sparing of counterregulatory responses) and/or due to a longer time for patients to acclimatize to disease management. But these findings are reminiscent of those from the study of alefacept in T1D, in which there was a significant inverse association between the 4-h AUC at 1 year and of the number of hypoglycemic events during the following 12 months (24).
Although our study defined responsiveness after 1 year of therapy, our data suggest that this could be determined earlier. Like other approaches that modify the new-onset T1D course, no clinical or demographic parameters were able to predefine those who could be identified as responders. If there is a therapy that has efficacy on a specific subpopulation of those with T1D that cannot be identified a priori, it could be imagined that a patient with newly diagnosed T1D is started on the therapy and medically (metabolically) monitored. If there is progression of disease (substantial loss of C-peptide AUC or no longer in partial remission), therapy should be stopped; if there are benefits, therapy could be continued.
In summary, golimumab is one of a few investigational approaches that appear to modify T1D progression. Even following 1 year off therapy, there continued to be potential benefits. A significant portion of golimumab-treated participants identified using routine clinical assessments had disease stabilization while on therapy and had metabolic benefits after stopping therapy.
Article Information
Acknowledgments. The sponsor would like to thank participants, their families, site principal investigators (listed in Supplementary Material 1), and their teams who helped make this a successful study.
Duality of Interest. This study was supported by The Janssen Pharmaceutical Companies of Johnson & Johnson, Research and Development. M.R.R., B.H., Y.L., F.V., and J.A.H. are employees of Janssen Pharmaceuticals and receive salary from and hold equity in the company. T.Q. is or has been a principal investigator in clinical trials from Janssen, Opko, Pfizer, ProventionBio, Novo Nordisk, and Ascendis, and has been a paid consultant of Janssen, Merck, and ProventionBio.
Author Contributions. M.R.R., Y.L., F.V., J.A.H., and T.Q. contributed to the study design. M.R.R., Y.L., F.V., J.A.H., and T.Q. contributed to study conduct and data collection. M.R.R. and J.A.H. developed the research idea. M.R.R., B.H., Y.L., F.V., J.A.H., and T.Q. contributed to data review, manuscript writing, review and editing, and approved the final version of the manuscript. T.Q., who is independent of the sponsor, is the guarantor of this work and, as such, had full access to all the data in the study and takes responsibility for the integrity of the data and the accuracy of the data analysis.”
Footnotes
Clinical trial reg. no. NCT02846545, clinicaltrials.gov
This article contains supplementary material online at https://doi.org/10.2337/figshare.21685397.
This article is featured in a podcast available at diabetesjournals.org/journals/pages/diabetes-core-update-podcasts.
References
- 1. Atkinson MA, Eisenbarth GS, Michels AW. Type 1 diabetes. Lancet 2014;383:69–82 [DOI] [PMC free article] [PubMed] [Google Scholar]
- 2. van Belle TL, Coppieters KT, von Herrath MG. Type 1 diabetes: etiology, immunology, and therapeutic strategies. Physiol Rev 2011;91:79–118 [DOI] [PubMed] [Google Scholar]
- 3. Rigby MR, Ehlers MR. Targeted immune interventions for type 1 diabetes: not as easy as it looks! Curr Opin Endocrinol Diabetes Obes 2014;21:271–278 [DOI] [PMC free article] [PubMed] [Google Scholar]
- 4. Lee LF, Xu B, Michie SA, et al. The role of TNF-alpha in the pathogenesis of type 1 diabetes in the nonobese diabetic mouse: analysis of dendritic cell maturation. Proc Natl Acad Sci U S A 2005;102:15995–16000 [DOI] [PMC free article] [PubMed] [Google Scholar]
- 5. Kim HE, Choi SE, Lee SJ, et al. Tumour necrosis factor-alpha-induced glucose-stimulated insulin secretion inhibition in INS-1 cells is ascribed to a reduction of the glucose-stimulated Ca2+ influx. J Endocrinol 2008;198:549–560 [DOI] [PubMed] [Google Scholar]
- 6. Stephens LA, Thomas HE, Ming L, et al. Tumor necrosis factor-alpha-activated cell death pathways in NIT-1 insulinoma cells and primary pancreatic beta cells. Endocrinology 1999;140:3219–3227 [DOI] [PubMed] [Google Scholar]
- 7. Atkinson MA, Bluestone JA, Eisenbarth GS, et al. How does type 1 diabetes develop?: the notion of homicide or β-cell suicide revisited. Diabetes 2011;60:1370–1379 [DOI] [PMC free article] [PubMed] [Google Scholar]
- 8. SIMPONI (golimumab) injection, for subcutaneous use [package insert]. Horsham, PA, Janssen Biotech, Inc., September 2019 [Google Scholar]
- 9. SIMPONI (golimumab). [European summary of product characteristics]. Leiden, the Netherlands, Janssen Biologics, 2019. Accessed 21 December 2022. Available from https://www.ema.europa.eu/en/medicines/human/EPAR/simponi
- 10. Quattrin T, Haller MJ, Steck AK, et al.; T1GER Study Investigators . Golimumab and beta-cell function in youth with new-onset type 1 diabetes. N Engl J Med 2020;383:2007–2017 [DOI] [PubMed] [Google Scholar]
- 11. Mortensen HB, Hougaard P, Swift P, et al.; Hvidoere Study Group on Childhood Diabetes . New definition for the partial remission period in children and adolescents with type 1 diabetes. Diabetes Care 2009;32:1384–1390 [DOI] [PMC free article] [PubMed] [Google Scholar]
- 12. Orban T, Bundy B, Becker DJ, et al.; Type 1 Diabetes TrialNet Abatacept Study Group . Costimulation modulation with abatacept in patients with recent-onset type 1 diabetes: follow-up 1 year after cessation of treatment. Diabetes Care 2014;37:1069–1075 [DOI] [PMC free article] [PubMed] [Google Scholar]
- 13. Pescovitz MD, Greenbaum CJ, Bundy B, et al.; Type 1 Diabetes TrialNet Anti-CD20 Study Group . B-lymphocyte depletion with rituximab and β-cell function: two-year results. Diabetes Care 2014;37:453–459 [DOI] [PMC free article] [PubMed] [Google Scholar]
- 14. International Hypoglycaemia Study Group . Glucose concentrations of less than 3.0 mmol/L (54 mg/dL) should be reported in clinical trials: a joint position statement of the American Diabetes Association and the European Association for the Study of Diabetes. Diabetes Care 2017;40:155–157 [DOI] [PubMed] [Google Scholar]
- 15. Lachin JM, McGee P; DCCT/EDIC Research Group . Impact of C-peptide preservation on metabolic and clinical outcomes in the Diabetes Control and Complications Trial. Diabetes 2014;63:739–748 [DOI] [PMC free article] [PubMed] [Google Scholar]
- 16. The Diabetes Control and Complications Trial Research Group . Effect of intensive therapy on residual beta-cell function in patients with type 1 diabetes in the diabetes control and complications trial. A randomized, controlled trial. Ann Intern Med 1998;128:517–523 [DOI] [PubMed] [Google Scholar]
- 17. Kuhtreiber WM, Washer SL, Hsu E, et al. Low levels of C-peptide have clinical significance for established Type 1 diabetes. Diabet Med 2015;32:1346–1353 [DOI] [PMC free article] [PubMed] [Google Scholar]
- 18. Haller MJ, Long SA, Blanchfield JL, et al.; Type 1 Diabetes TrialNet ATG-GCSF Study Group . Low-dose anti-thymocyte globulin preserves C-peptide, reduces HbA1c, and increases regulatory to conventional T-cell ratios in new-onset type 1 diabetes: two-year clinical trial data. Diabetes 2019;68:1267–1276 [DOI] [PMC free article] [PubMed] [Google Scholar]
- 19. Foster NC, Beck RW, Miller KM, et al. State of type 1 diabetes management and outcomes from the T1D Exchange in 2016-2018. Diabetes Technol Ther 2019;21:66–72 [DOI] [PMC free article] [PubMed] [Google Scholar]
- 20. Lind M, Svensson AM, Kosiborod M, et al. Glycemic control and excess mortality in type 1 diabetes. N Engl J Med 2014;371:1972–1982 [DOI] [PubMed] [Google Scholar]
- 21. Rawshani A, Sattar N, Franzén S, et al. Excess mortality and cardiovascular disease in young adults with type 1 diabetes in relation to age at onset: a nationwide, register-based cohort study. Lancet 2018;392:477–486 [DOI] [PMC free article] [PubMed] [Google Scholar]
- 22. Chen C, Cohrs CM, Stertmann J, Bozsak R, Speier S. Human beta cell mass and function in diabetes: recent advances in knowledge and technologies to understand disease pathogenesis. Mol Metab 2017;6:943–957 [DOI] [PMC free article] [PubMed] [Google Scholar]
- 23. Greenbaum CJ, Beam CA, Boulware D, et al.; Type 1 Diabetes TrialNet Study Group . Fall in C-peptide during first 2 years from diagnosis: evidence of at least two distinct phases from composite Type 1 Diabetes TrialNet data. Diabetes 2012;61:2066–2073 [DOI] [PMC free article] [PubMed] [Google Scholar]
- 24. Pinckney A, Rigby MR, Keyes-Elstein L, Soppe CL, Nepom GT, Ehlers MR. Correlation among hypoglycemia, glycemic variability, and C-peptide preservation after alefacept therapy in patients with type 1 diabetes mellitus: analysis of data from the Immune Tolerance Network T1DAL Trial. Clin Ther 2016;38:1327–1339 [DOI] [PMC free article] [PubMed] [Google Scholar]


