

Abstract
OBJECTIVE
Combined low-risk lifestyle behaviors (LRLBs) have been associated with a reduction in type 2 diabetes risk. This relationship has not been systematically quantified.
RESEARCH DESIGN AND METHODS
A systematic review and meta-analysis was conducted to assess the association of combined LRLBs with type 2 diabetes. Databases were searched up to September 2022. Prospective cohort studies reporting the association between a minimum of three combined LRLBs (including healthy diet) with incident type 2 diabetes were included. Independent reviewers extracted data and assessed study quality. Risk estimates of extreme comparisons were pooled using a random-effects model. Global dose-response meta-analysis (DRM) for maximum adherence was estimated using a one-stage linear mixed model. The certainty of the evidence was assessed using GRADE (Grading of Recommendations, Assessment, Development and Evaluations).
RESULTS
Thirty cohort comparisons (n = 1,693,753) involving 75,669 incident type 2 diabetes cases were included. LRLBs, with author-defined ranges, were healthy body weight, healthy diet, regular exercise, smoking abstinence or cessation, and light alcohol consumption. LRLBs were associated with 80% lower risk of type 2 diabetes (relative risk [RR] 0.20; 95% CI 0.17–0.23), comparing the highest with lowest adherence. Global DRM for maximum adherence to all five LRLBs reached 85% protection (RR 0.15; 95% CI 0.12–0.18). The overall certainty of the evidence was graded as high.
CONCLUSIONS
There is a very good indication that a combination of LRLBs that includes maintaining a healthy bodyweight, healthy diet, regular exercise, smoking abstinence or cessation, and light alcohol consumption is associated with a lower risk of incident type 2 diabetes.
Graphical Abstract

Introduction
Type 2 diabetes is an epidemic with a global (diagnosed and undiagnosed) prevalence of 9.3% (463 million 20- to 79-year-old people), which is expected to rise to 11% by the year 2045 (1). A number of low-risk lifestyle behaviors (LRLBs), i.e., habits of daily routine, have been associated with lower risk of developing diabetes. These include achieving and maintaining healthy weight (2,3), healthy dietary pattern (4,5), regular physical activity (6), smoking abstinence or cessation (7), and light alcohol intake. The extent to which adherence to these LRLBs is additive has been investigated in various prospective cohort studies (8–10); however, these risk reductions have not been systematically quantified across populations using all available data.
To inform the development of new clinical practice guidelines for nutrition therapy, the Diabetes and Nutrition Study Group (DNSG) of the European Association for the Study of Diabetes (EASD) commissioned two systematic reviews and meta-analyses to evaluate LRLB evidence in randomized controlled trials (11) and in prospective cohort studies. We present the systematic review and meta-analysis of prospective cohort studies of the association between adherence to multiple LRLBs and incident type 2 diabetes using GRADE (Grading of Recommendations, Assessment, Development and Evaluations) to assess the certainty of the evidence.
Research Design and Methods
We conducted a systematic review and meta-analysis according to the Cochrane Handbook for Systematic Reviews of Interventions (12), MOOSE (Meta-analysis Of Observational Studies in Epidemiology) (13), and PRISMA (Preferred Reporting Items for Systematic Reviews and Meta-Analyses) guidelines (14). The study protocol was registered (ClinicalTrials.gov identifier, NCT03234101).
Data Sources and Searches
The search strategy is outlined in Supplementary Table 1. MEDLINE, Embase, and Cochrane Library databases were searched until 7 September 2022. A manual search of the reference lists from included studies supplemented the database search. Google Scholar was used to identify any studies not captured by the above methods.
Study Selection
Titles and abstracts, followed by full-text reports, were reviewed by two reviewers in parallel. The inclusion criteria were prospective cohort studies examining the relationship between a combination of at least three LRLBs, including a healthy dietary pattern, with type 2 diabetes incidence in individuals from all health backgrounds with a minimum of 1-year follow-up duration. The other LRLBs could include achieving and maintaining a healthy body weight, regular physical activity, smoking abstinence or cessation, and light alcohol consumption. We did not prespecify cutoffs for the LRLBs but used study authors’ own definitions. We excluded clinical trials and those cohort studies that did not report diet and/or combined lifestyle behaviors with clinical biomarkers of cardiometabolic risk.
Data Extraction and Quality Assessment
Two reviewers extracted relevant data from the selected reports and assessed the study quality using the Newcastle-Ottawa Scale (NOS) (15,16). Up to 9 points were awarded based on cohort selection (representativeness, selection of nonexposed cohort, exposure assessment, outcome not present at baseline), ascertainment of outcome (follow-up length, adequacy of follow-up, outcome assessment), and comparability (controlling for one prespecified primary [age] and four of six secondary confounding variables [sex, adiposity, smoking, family history, energy intake, physical activity]). These confounding variables were selected based on their association with diabetes risk (17,18). If a confounding variable was present as an exposure variable in the model, it was determined to be accounted for and not penalized, as outlined in Supplementary Table 2. Cohorts were adjudged high (score ≥7), moderate (score = 6) or low (score ≤5) study quality.
Data Synthesis and Analysis
All analyses were performed using Stata 16 software (StataCorp). Extreme contrast risk ratios (relative risk or RRs) comparing the maximum (three or more) versus minimum (zero, one, or two) combinations of LRLBs from the most adjusted model were used in the pairwise meta-analysis. Pooled RR was estimated using natural log-transformed RRs with DerSimonian and Laird random effects model (19). Heterogeneity was assessed by Cochrane Q statistic and quantified by the I2 statistic, with I2 ≥ 50% and PQ < 0.1 denoting substantial heterogeneity (20,21). We computed prediction intervals to assess clinical heterogeneity (22,23). Sources of heterogeneity were explored using influence analysis (systematic removal of each study) and a priori subgroup analysis. Subgroup analyses (≥10 studies) were assessed for by sex, number of participants, follow-up duration, number of LRLBs, inclusion of alcohol intake, age, race/ethnicity, continent, study quality (NOS scale), and funding source using Q test of homogeneity (24). Comparison within categories was performed using meta-regression if the subgroup analysis showed significance at P < 0.1 (25). We also computed the E-value to ascertain the effect of an unmeasured or uncontrolled confounder on the exposure-outcome relationship (26).
We performed a dose-response meta-analysis (DRM) using a one-stage random-effects model (27,28). Each cohort’s LRLBs score ranged from 0 to 5 depending on the number of LRLBs included, with a minimum score of 3. If a cohort gave different score to LRLBs (e.g., counting some LRLBs, such as diet, as 2 points), these were rescaled to match the number of LRLBs included. The linear DRM was reported per-1-LRLB score, and the global DRM was assessed using the nonlinear association at the highest global population adherence of LRLBs. Global adherence was calculated by the percentage of people in each LRLB compared with the total people studied in all of the included cohorts.
If ≥10 cohort comparisons were available, we assessed publication bias by funnel plot and Egger and Begg tests with significance adjudged at P < 0.1. (29,30). We used the trim-and-fill method to assess the likely impact of missing studies (31).
Grading of the Evidence
We assessed the certainty and strength of the overall pooled evidence using GRADE (32). Included observational studies started as low and could be downgraded or upgraded based on established criteria. Criteria to downgrade included study quality (weight of studies show low study quality by NOS), inconsistency (substantial unexplained heterogeneity, I2 > 50%, PQ < 0.10), indirectness (presence or absence of factors that limit generalizability based on populations, exposures, and outcomes), imprecision (95% CIs cross the minimally important difference of 5%), and publication bias (evidence of small study effects). Criteria to upgrade included a large magnitude of effect (large [RR < 0.5 or RR > 2] or very large [RR < 0.2 or RR > 5] in the absence of plausible confounders), a dose-response gradient, and attenuation by plausible confounders (33).
Results
Search Results
Figure 1 outlines our systematic search. We included 19 reports (with 1 conference abstract [34]) containing 22 prospective cohort studies, with 30 cohort comparisons involving 1,693,753 participants and 75,669 incident type 2 diabetes cases in our analyses (8–10,34–49).
Figure 1.

Systematic search and article selection.
Study Characteristics
Table 1 describes the included cohort studies. Participants were a median age of 54 years (range 20–98), with a median follow-up of 12 years (range 5–34). The cohort populations included those with men only (n = 3 cohorts) (37,38,46,47), women only (n = 5) (35,37,38,46,47), and mixed (n = 14) (8–10,39–42,44,45,48,49). Incident diabetes cases were ascertained by medical records (n = 10) (8,34,36,37,39,43,44,48,49), self-report (n = 7) (35,37,38,40,45,46), and biochemical ascertainment using an oral glucose tolerance test (n = 5) (9,10,41,42,48). Participants were from the U.S. (n = 8) (37,38,40,41,43,46), followed by China (36,45,47) (n = 4), Finland (10,34), the U.K. (n = 2) (44,49), France (35), Netherlands (39), Germany (8), Sweden (9), Spain (48) and Australia (42) (n = 1 each). Fifteen cohorts included five LRLBs (9,34–41,43,45,46,48,49), while the remaining cohorts contained four (excluding light alcohol intake) (8,39,42) and three behaviors, respectively (excluding smoking cessation and alcohol intake) (10,44,47). Variable criteria were used by the included studies for defining healthy body weight (BMI <23 kg/m2 to <30 kg/m2, or waist circumference of <80 to <88 cm in women or <92 to <94 cm in men, or 5% weight reduction), healthy diet (daily intake of vegetables only to upper-2-quintiles of healthy dietary pattern scores that included higher intake of vegetables, fruits, nuts and legumes, whole grains, and polyunsaturated fatty acids, and lower intake of sugar-sweetened beverages, fruit juice, red/processed meat, trans fat, and sodium), regular physical activity (exercising twice per week to >30 min of moderate to vigorous exercise per day), smoking abstinence or cessation (never smoked to smoking cessation >6 months), and light alcohol consumption (0–30 g/day).
Table 1.
Cohort study characteristics investigating the association between a combinations of LRLBs and type 2 diabetes incidence
| Cohort | Country | Predominant race/ethnicity | Sex | No.a | T2D cases | Age (years)b | Duration of study, year | Healthy dietary patternc | Healthy body-weight (BMI, kg/m2)c | Regular physical activityc | Smoking abstinence or cessationc | Light alcohol intake (g/day)c |
|---|---|---|---|---|---|---|---|---|---|---|---|---|
| Australian Diabetes, Obesity and Lifestyle Study (42) | Australia | Caucasian | Mixed | 6,242 | 376 | 50 ± 12.5 | 12 | Adherence to recommended intakes (includes high intake of fruits, vegetables, grains, dairy, proteins, no alcohol) | Waist circumference <94 cm for men; <80 cm for women | Physical activity ≥150 min/week | Nonsmoker | N/A |
| Cardiovascular Health Study (41) | U.S. | Caucasian | Mixed | 4,883 | 337 | 72.7 ± 5.5 | 9 | Diet score in upper 2 quintiles (includes high intake of fiber, PUFA-to- SFA ratio; lower intake of high glycemic index foods, trans fat) | <25 or waist circumference <92 cm for men; <88 cm for women | Total physical activity score ≥than median | Never smoked | >0 |
| China Kadoorie Biobank (36) | China | Chinese | Men; women | 189,153; 272,058 | 3,259; 5,525 | 30–79 | 9 | Daily use of vegetables, fruits, wheat; less than daily use of red meat | 18.5–23.9 and/or waist-to-hip ratio <0.90 | Top quartile of physical activity based on METs | Nonsmoker | >0–30 |
| Dongfeng-Tongji Cohort (45) | China | Chinese | Mixed | 19,005 | 1,555 | 63.2 | 4.6 | Vegetables and fruits every day; meat less than daily | 18.5–23.9 and/or waist circumference <85 cm for men, <80 cm for women | >20 min per time and ≥7 h/week | Never smoked or stopped for >6 months | 0 |
| EPIC-E3N (35) | France | Caucasian | Women | 74,522 | 2,692 | 43–68 | 18 | ≥5 servings/day of fruits and vegetables | 18.5–25.0 | ≥20 MET-h/week of physical activity | Never smoked | ≤10 |
| EPIC-NL (39) | Netherlands | Caucasian | Mixed | 10,758 | 796 | 20–70 | 14 | DASH diet score in upper 2 quintiles (includes high intake of fruits, vegetables (except potatoes and legumes), nuts and legumes, low-fat dairy products, whole grains; lower intake of sodium, sugar-sweetened beverages, red/processed meats) in teetotalers | <25 | >30 min/day | Nonsmoker | N/A |
| EPIC-Norfolk (44) | U.K. | Caucasian | Mixed | 24,155 | 394 | 40–79 | 5 | Fat intake <30% of total energy; saturated fat intake <10% of total energy; fiber intake ≥15 g/day | <25 | Walking, cycling or light exercise >4 h/week | N/A | N/A |
| EPIC-Potsdam (8) | Germany | Caucasian | Mixed | 23,153 | 871 | 49.3 ± 8.8 | 12 | Above the median sum z score (higher intake of fruits and vegetables, whole grain bread; lower intake of red meat) | <30 | >3.5 h/week. | Never smoked | N/A |
| FINRISK Study (34) | Finland | Caucasian | Men; women | 18,649; 20,052 | 950; 759 | 35–55 | 20 | Daily use of vegetables | <25 | Regular physical activity | Nonsmoker | Moderate intake |
| Finnish Diabetes Prevention Study (10) | Finland | Caucasian | Mixed | 522 | 130 | 55 ± 7.0 | 16 | Fat intake <30% of total; saturated fat intake <10% of total energy; fiber intake >15 g/1,000 kcal | Weight reduction of 5% from baseline z score | >4 h of physical activity/week | N/A | N/A |
| Health Professionals Follow-up Study (38,46) | U.S. | Caucasian | Men | 38,366 | 1,400 | 40–75 | 28 | Alternate healthy eating index 2010 – top 40% of distribution (includes high intake of vegetables, fruits, nuts and legumes, whole grains, long-chain fats, and PUFA; low intake of sugar-sweetened beverages, fruit juice, red/processed meat, trans fat, and sodium) | 18.5–24.9 | Moderate-to-vigorous exercise >30 min/day | Nonsmoker | 5–30 |
| Hortega Study (48) | Spain | Caucasian | Mixed | 830 | 51 | 48.5 | 13 | Alternate Mediterranean Diet – top 40% of distribution | 18.5–24.9 | ≥600 METs-min/week performing moderate to vigorous activity | Never smokers | 5–15 for women and 5–30 for men |
| Multiethnic Cohort (43) | U.S. | Caucasian Hawaiian Japanese | Men; women | 36,075; 38,895 | 4,532; 4,010 | 45–75 | 12 | Lowest quintile of processed red meat and dietary fiber intake | Overweight or obese (for Japanese American BMI <23) | Physical activity >4 h/week | Nonsmoker | ≥0.4 |
| NIH-AARP Diet and Health Study (40) | U.S. | Caucasian | Men; women | 114,996; 92,483 | 11,031; 6,969 | 50–71 | 11 | Upper 2 quantiles of diet score (includes foods with high fiber, PUFA-to-SFA ratio; low intake of foods with high glycemic index, trans fat) | <25 | Physical activity >20 min 3 times/week. | Never smoked or ≥10 years nonsmoker | 5–30 |
| Nurses’ Health Study I (38, 46) | U.S. | Caucasian | Women | 73,196 | 4,494 | 30–55 | 34 | Alternate healthy eating index 2010—top 40% of distribution (includes high intake of vegetables, fruits, nuts and legumes, whole grains, long-chain fats, and PUFA; low intake of sugar-sweetened beverages, fruit juice, red/processed meat, trans fat, and sodium) | 18.5–24.9 | Moderate-to-vigorous exercise >30 min/day | Nonsmoker | 5–15 |
| Nurses’ Health Study II (38) | U.S. | Caucasian | Women | 74,336 | 4,117 | 25–42 | 20 | Alternate healthy eating index 2010 – top 40% of distribution (includes high intake of vegetables, fruits, nuts and legumes, whole grains, long chain fats, and PUFA; low intake of sugar-sweetened beverages, fruit juice, red/processed meat, trans fat, and sodium) | <25 | Moderate-to-vigorous exercise >30 min/day | Nonsmoker | 5–15 |
| Physicians’ Health Study (37) | U.S. | Caucasian | Men | 20,915 | 2,096 | 53.5 | 26 | Upper 2 quintiles of sex-specific diet score (includes low intake of eggs and breakfast cereals) | <25 | Exercise >2 times/week. | Never smoked | 0–28 |
| Shanghai Men’s Health Study (47) | China | Chinese | Men | 56,691 | 3,315 | 40–74 | 9 | Upper half of Chinese Food Pagoda Score (includes grains; vegetables and fruit; dairy products and beans and bean products; meat and poultry, fish and shrimp and eggs; and fats and oils and salt) | <24 and waist circumference <90 cm | Upper half of physical activity level | N/A | N/A |
| Shanghai Women’s Health Study (47) | China | Chinese | Women | 70,849 | 5,952 | 40–70 | 14 | Upper half of Chinese Food Pagoda Score (includes grains; vegetables and fruits; dairy products and beans and bean products; meat and poultry, fish and shrimp and eggs; and fats and oils and salt) | <24 and waist circumference <85 cm | Upper half of physical activity level | N/A | N/A |
| UK Biobank Study (49) | U.S. | Caucasian | Mixed | 321,225 | 5,368 | 40–70 | 9 | Consumption of ≥4 of 7 commonly eaten diet components (including fruits ≥3 servings/day; vegetables ≥3 servings/day; fish ≥2 servings/week; processed meats ≤1 serving/week; unprocessed red meats ≤1.5 servings/week; whole grains ≥3 servings/day; refined grains ≤1.5 servings/day) | ≥18.5 and <25 and waist circumference ≤102 cm for men and ≤88 cm for women | ≥150 min/week moderate or ≥75 min/week vigorous or 150 min/week mixed (moderate + vigorous) activity or moderate ≥5 days/week or vigorous once/week | Nonsmoker | 0–28 for men and 0–14 for women |
| Västerbotten Intervention Programme (9) | Sweden | Caucasian | Mixed | 32,120 | 2,211 | 35–55 | 23 | Fiber intake >15 g; fat intake <30% total of energy intake | <25 | >34 MET-h/week for men >51 MET-h/week for women | Nonsmoker | >0–20 |
| Women’s Health Study (37) | U.S. | Caucasian | Women | 36,594 | 2,390 | 54.6 | 26 | Upper 2 quintiles of sex-specific diet score (includes foods with high dietary fiber, high PUFA, low cholesterol, low trans-fat, low glycemic index) | <25 | Top 2 quintiles of energy expenditure (MET-h/week.) | Never smoked | 0–14 |
DASH, Dietary Approaches to Stop Hypertension; EPIC, European Prospective Investigation into Cancer and Nutrition; E3N, Etude Epidémiologique Auprès des Femmes de la Mutuelle Générale de l’Education Nationale; FINRISK, Finland Cardiovascular Risk Study; NIH-AARP, National Institutes of Health–American Association of Retired Persons; N/A, not available; SFA, saturated fatty acids; T2D, type 2 diabetes.
aNo. represents number of people followed up in the cohort. bBaseline age is represented as mean, mean (SD), or range as presented in the original article. cCutoffs for each LRLB goal in the studies.
The incidence rates were <10% in all studies reporting odds ratios (40,44) and hazard ratios (8,34–36,39,41,42,45–47,49) and thus were assumed to be equal to RRs (50), except for one cohort (10) for which the hazard ratio was converted to RR (51). One study used incidence rates (37), while another reported population-attributable risk (43) for the combination of LRLBs; we converted these to RRs (52).
Diet was measured using food frequency questionnaires (n = 21) (8,9,34–49) or a food record (n = 1) (10). BMI was obtained through self-report (n = 10) (34–38,40,46) or direct measurement (n = 12) (8–10,39,41–45,47–49). Physical activity was measured by self-report (interview/questionnaire) (n = 12) (8,34–38,40,42–45) or by a validated questionnaire (n = 10) (9,10,39,41,46–49). Smoking and alcohol consumption were ascertained from self-report in all cohorts. When reporting extreme comparisons, 12 cohorts compared maximum adherence of all available LRLBs to none (8,10,36,37,41,44,46,47), while 10 cohorts compared maximum behaviors to a minimum of combination that was higher than zero (i.e., one, two, or three LRLBs) (9,34,35,38–40,42,43,45,48,49).
All studies received funding from an agency (8,9,35–49), with one study receiving partial funding through a mix of agency and industry (10); however, the authors maintained the sponsors had no role in the study or its publication. One study did not report its funding source (34).
Supplementary Table 2 shows the covariate adjustments. Of the 22 cohorts, 20 adjusted for the prespecified primary confounding variable of age (8–10,35–41,44–49), and a separate 20 adjusted (or were included in the model as part of a LRLB score) for at least four of six of the important secondary confounding variables: sex, adiposity, smoking, energy intake, family history of type 2 diabetes, and physical activity (8–10,35–42,44–49).
Study Quality Assessment
Supplementary Table 3 shows the NOS quality scores. No study was rated as low quality; however, for one study, the ascertainment of quality was not possible and was determined to be of low quality (34).
LRLBs and Type 2 Diabetes Risk
Figure 2 outlines the relationship between LRLBs and incident type 2 diabetes. Adherence to the maximum combination of LRLBs compared with the minimum reported (zero, one, two, or three) was associated with an 80% reduction in type 2 diabetes incidence (RR 0.20; 95% CI 0.17–0.23), with evidence of heterogeneity (I2 = 87%; 95% CI 82–90; P < 0.001).
Figure 2.

Forest plot of the association of multiple low-risk lifestyle behaviors with type 2 diabetes incidence with highest number (three or more) vs. lowest number of behaviors (three or less). The individual study relative risk (RR) estimates are indicated by blue squares; the size is proportional to its weight. The blue horizontal lines represent CIs. The overall pooled estimate is represented by the green diamond. Estimates <1.0 indicate protective association and RRs >1.0 indicate an adverse association. Comparison is between highest vs. lowest number of LRLBs. EPIC, European Prospective Investigation into Cancer and Nutrition; E3N, Etude Epidémiologique Auprès des Femmes de la Mutuelle Générale de l’Education Nationale; FINRISK, Finland Cardiovascular Risk Study; NIH-AARP, National Institutes of Health–American Association of Retired Persons; M, males/men; F, females/women.
DRMs
Figure 3 shows the global adherence and the dose-response relationship between the number of LRLBs and diabetes incidence. Adherence was highest to one (24%), two (35%), and three (18%) LRLBs, while only 2% of the population adhered to all five LRLBs. There was an inverse linear association for adherence to multiple LRLBs and type 2 diabetes incidence in the linear DRM model, with 33% relative reduction per additional LRLB (RR 0.67; 95% CI 0.64–0.70; Plinear < 0.001), with the global DRM showing that the highest adherence to LRLBs over the global range of scores was associated with a 85% lower risk diabetes (RR 0.15; 95% CI 0.12–0.18). There was evidence of a nonlinear association (P < 0.001), with a minor deviation from linearity indicating slightly lower RR compared with linear as the LRLBs dose increased (Supplementary Fig. 1).
Figure 3.

Dose-response plot of the association of the number of LRLBs with incident type 2 diabetes. The black boxes with vertical bars represent the aggregate relative risks (RRs) and 95% CIs for each LRLBs. Compared with adherence to no LRLBs, the estimated RRs were 0.70 (95% CI 0.64–0.78) for adherence to one LRLB, 0.49 (95% CI 0.42–0.57) for two combined LRLBs, 0.33 (95% CI 0.28–0.40) for three combined LRLBs, 0.22 (95% CI 0.19–0.27) for four-combined LRLBs, and 0.15 (95% CI 0.12–0.18) for all five combined LRLBs (global DRM at the highest adherence to global range of scores).
Sensitivity and Subgroup Analyses
Supplementary Table 4 shows the sensitivity analysis. Systematic removal of each cohort comparison did not alter the association (significance and direction) between combined LRLBs and incident diabetes.
Figure 4 shows the subgroup analyses. Within-subgroup analyses revealed a significant difference between the RR for combinations of lifestyle behaviors (extreme comparisons) and incident type 2 diabetes when stratifying by cohort size, race/ethnicity, age, funding, and time of exposure measurement. Increasing size of the study indicated more benefit (P = 0.07), although there was no difference with follow-up duration (P = 0.16). Younger baseline age was associated with more benefit (RR 0.14 [95% CI 0.10–0.21] for <50 years) compared with cohorts with older baseline age (RR 0.22 [95% CI 0.19–0.26] for ≥50 years; Pdifference = 0.03). Cohorts that updated exposure measurements during follow-up and had unknown funding sources indicated more benefit (P = 0.03 and P = 0.05, respectively). Meta-regression did not show any significant differences between any two races/ethnicities (P > 0.05). There were no significant differences when stratifying by sex (P = 0.21), follow-up period (P = 0.16), number of reported LRLBs (P = 0.81), inclusion of alcohol (P = 0.60), NOS score (P = 0.73), continent of study (P = 0.10), and dietary assessment type (P = 0.63).
Figure 4.
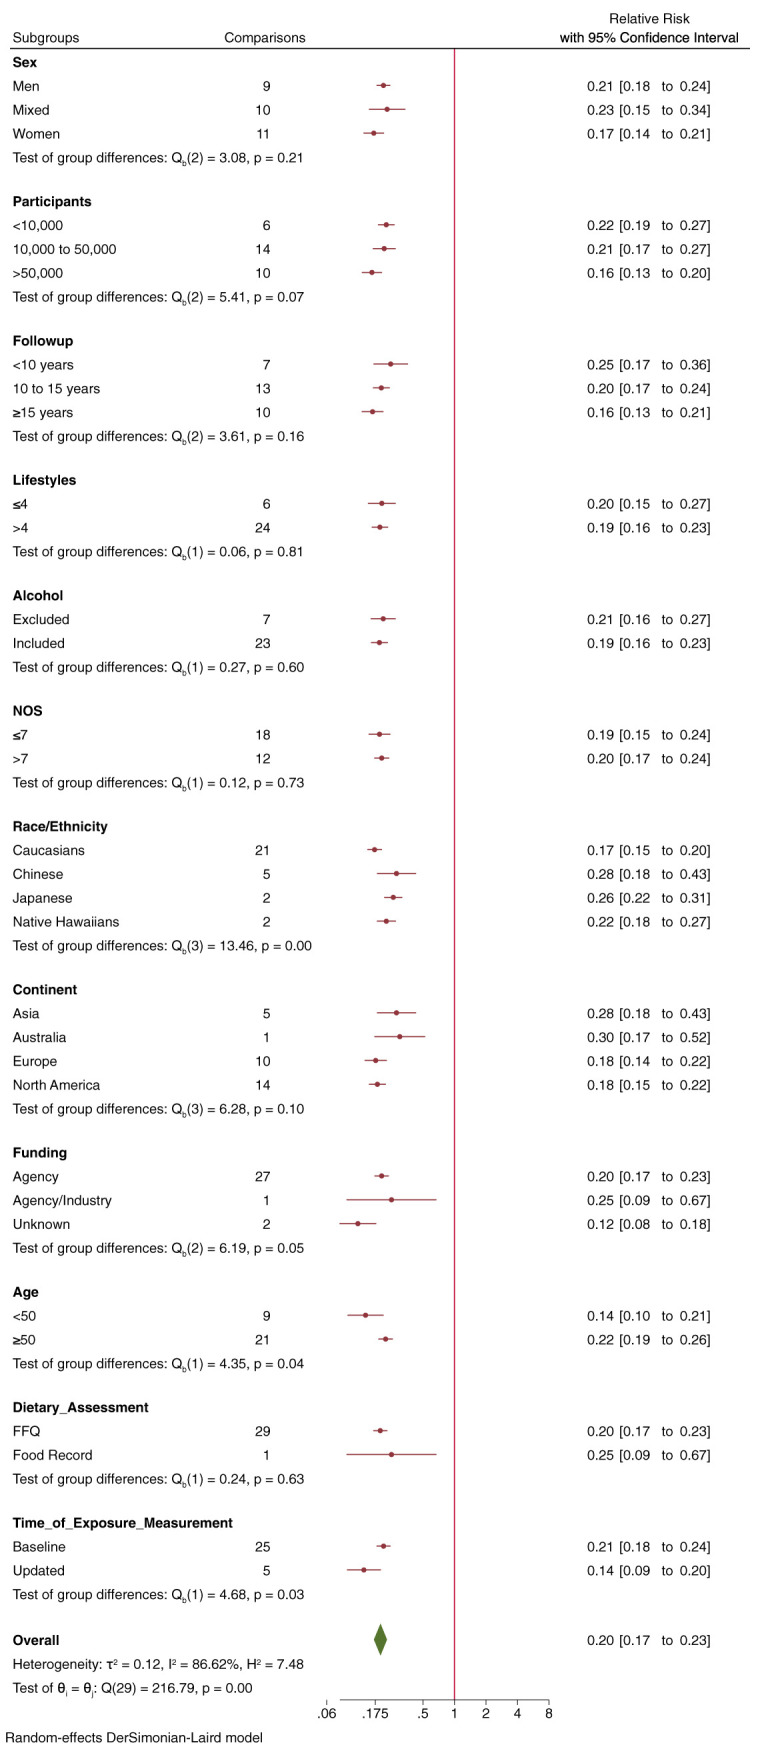
Subgroup analyses by sex, number of participants, duration of follow-up, number of LRLBs, exclusion of alcohol, NOS score, predominant race/ethnicity, continent, funding source, age, dietary assessment type, and time of exposure measurement with the relative risk of incident type 2 diabetes. Estimates at each subgroup level (red circles) indicate pooled effect estimates. The pooled effect estimate for the overall analysis is represented by the green diamond. Interstudy heterogeneity unexplained by the subgroup is represented by the residual I2 value.
We assessed the robustness of association to potential unmeasured and uncontrolled confounding using E-values. It showed that any potential confounding variable needed an RR of 9.47 (E-value) for the point estimate and 8.16 (E-value) for the CI, with both the exposure and outcome to explain away the highest versus lowest LRLBs association.
Publication Bias Analyses
Supplementary Fig. 2 shows the funnel plot. There was no evidence of publication bias on visual inspection or by formal testing with Begg test though Egger test showed some indication of small study effect (P = 0.06). However, trim and fill analysis (Supplementary Fig. 3) did not impute any missing studies.
GRADE Assessment
Supplementary Table 5 shows the GRADE assessment. The certainty of evidence for the association of multiple LRLBs and type 2 diabetes was graded as “high” due to no downgrades for any of the domains (no serious risk of bias due to low study quality, inconsistency, imprecision, or publication bias), a double upgrade for a very large magnitude of effect (RR of 0.196 was less than threshold of 0.2), and a single upgrade for a significant dose-response gradient (Plinear < 0.001).
Conclusions
We performed a systematic review and DRM of 30 prospective cohort study comparisons involving 1,693,753 participants with 75,669 incident type 2 diabetes cases with a median follow-up of 12 years to quantify and evaluate the relationship between adherence to multiple LRLBs and incident type 2 diabetes. Our synthesis showed that adherence to a combination of LRLBs that included achieving and maintaining healthy body weight, healthy diet, regular physical activity, smoking abstinence or cessation, and light or no alcohol consumption was associated with an 80% lower incidence of type 2 diabetes. Furthermore, we found a strong inverse dose-response relationship, with each additional LRLB associated with a 33% RR reduction in diabetes, reaching a global reduction of 85% with maximum adherence to all five LRLBs.
Findings in the Context of the Literature
Two previous systematic reviews and meta-analyses showed a 75–78% lower risk of incident type 2 diabetes with adherence to a healthy lifestyle (53,54). However, one review included studies that did not exclude cases of prevalent diabetes at baseline (54), and both included biomarkers of cardiometabolic risk (e.g., blood lipids, blood glucose, and blood pressure) as part of lifestyle factors. As biomarkers are not “lifestyle behaviors,” we excluded articles that combined biomarkers with lifestyle factors (Supplementary Table 6).
In our recent systematic review and meta-analysis of the available randomized trials of intensive lifestyle intervention programs (11), we showed that targeting up to three of five LRLBs (weight loss, a healthy dietary pattern, and regular physical activity) reduced incident type 2 diabetes by 47% in high-risk individuals with prediabetes (11). While smoking cessation and light alcohol intake were not part of any of the interventions, the weight reduction programs in such trials included alcohol reduction to reduce energy intake, and smoking prevalence was generally low. The smaller number of LRLBs targeted, the modest weight loss in these trials, shorter follow-up duration, and inclusion of only high-risk individuals may explain the difference in type 2 diabetes risk reduction from our results from observational studies (47% vs. 80%). The trials also showed that better adherence to lifestyle changes resulted in a lower incidence of type 2 diabetes, as an almost 80% reduction in the risk of type 2 diabetes was not unusual among the most adherent individuals in some trials (55–58). The evidence from the available randomized controlled trials of intensive lifestyle intervention programs, therefore, can be seen to fit well with our present synthesis of the prospective cohort studies.
Achieving and maintaining a healthy body weight (59,60), healthy dietary patterns (5,61), regular physical activity (62), and smoking cessation (7) have all been shown to be independently associated with lower risk of type 2 diabetes. Some meta-analyses of prospective cohort studies have observed a 30% lower diabetes incidence in individuals with moderate alcohol intake compared with nonconsumers (63–65), although recent Mendelian randomization studies have caused some doubt regarding the beneficial effect of alcohol intake (66,67).
There are biologically plausible mechanisms supporting the observed associations with lower risk of type 2 diabetes. Healthier diets that focus on fruits, vegetables, fiber consumption, nuts, polyunsaturated fatty acids (PUFAs), and low glycemic index foods have been associated with improved glycemic control, improved serum lipids, and weight loss (68,69). Weight reduction is associated with improved insulin sensitivity in the liver and peripheral tissues, blood pressure, serum lipids, and low-grade inflammation (60). Physical activity can improve serum lipids, peripheral insulin sensitivity, lower blood pressure, lower inflammation, and lead to weight loss (70–74). Smoking can impair pancreatic β-cell function and insulin sensitivity, induce inflammation, and can increase visceral adiposity compared with nonsmokers (75,76).
Although our findings show that light alcohol consumption as part of a combination of LRLBs is associated with a lower risk of type 2 diabetes, our subgroup analysis suggested no difference between studies that included alcohol as an LRLBs and those that did not. Owing to the potential harmful effects of alcohol consumption in disease (77) and public health outcomes (78,79), our results do not support the initiation of alcohol consumption in nonconsumers or the increase of alcohol consumption in existing consumers.
Strengths and Limitations
Strengths of our synthesis include the identification of all prospective cohorts, quantitative syntheses, and using GRADE to assess certainty of the evidence. The available prospective cohort studies provided a large sample size, long duration of follow-up, and adjustment for relevant confounders. We also upgraded the certainty of the evidence twice for a very large magnitude of RR reduction (RR < 0.2) and once for a significant linear dose-response gradient (33).
There were several limitations of our synthesis. Although prospective cohort studies represent the highest quality observational studies, the inability to remove residual confounding is inherent in all observational studies. Therefore, the GRADE assessment starts as low for observational studies. Although we showed substantial statistical heterogeneity in the pooled estimate, we did not downgrade for serious inconsistency due to the well demonstrated issue of increasing I2 with the size of the studies due to nonoverlapping narrow CIs (80). Additionally, homogenous direction of study estimates, narrow 95% prediction intervals (0.10–0.40) (Supplementary Fig. 4), and robustness of the overall estimate to influence analysis demonstrated that the apparent statistical heterogeneity did not reflect clinical heterogeneity. Our studies adjusted for differing confounding variables, however, which did not reflect in a low score in NOS. In addition, we measured the E-values for our association, which is defined as the minimum strength of association on the RR scale that an unmeasured confounder would need to have with both the exposure and the outcome to fully explain away a specific exposure-outcome association (26,81). In our study, the very large E-values meant that confounding associations were very unlikely to explain the association, and thus, our results are robust to unmeasured or uncontrolled confounding. Our analysis also did not include other emerging LRLBs that may have further contributed to lower diabetes incidence, including adequate sleep (82) and good dental hygiene (83), due to the small number of studies, none of which met our inclusion criteria.
Weighing the strengths and limitations, the certainty of the evidence was graded as high, suggesting that the true association is likely to be close to this estimate and that further research is unlikely to change the very large magnitude of the pooled estimate.
Implications
Individual LRLBs were unweighted in our analysis as each contributed a single dose; this was based on the original aggregate data from prospective cohort studies. An inherent additive assumption is presumed, but whether this is accurate biologically is unclear (e.g., Does regular exercise carry the same weight as healthy eating?). Such analysis requires individual patient data on each LRLB. So, while an assumption of a monotonic additive relationship can be considered a constraint, from the public health perspective, it is immensely practical to score each LRLB equally and focus on their implementation as a group set. Another important question that can be asked is: Do the LRLBs cluster and is there individual synergy between some of these LRLBs? Our study, while unable to answer the question of clustering, showed a small nonlinear association indicating a possible synergistic effect as the number of LRLBs cluster.
In addition, we were not able to assess the contribution of individual LRLBs from the LRLBs score as the cohort studies provided aggregate estimates of combined lifestyle behaviors (Supplementary Table 7). A minority of prospective cohort studies in our analysis also reported individual LRLBs and their association with type 2 diabetes (9,35,36,39–44), although this information was independent from the LRLBs score and could not be further assessed. Despite the constraints associated with aggregate data, the large reductions per lifestyle score in our dose-response relationship demonstrated the importance of combined behaviors for optimal risk reduction of type 2 diabetes.
Most of the participants adhered to up to three LRLBs (84%), while 13% adhered to four LRLBs, and only 2% achieved adherence to all five LRLBs in the included prospective cohort studies. This decreasing prevalence to achieve adherence to multiple LRLBs underscores the challenges in implementation and maintenance of a healthy lifestyle in an obesogenic environment. Similarly, population surveys from the U.K. (84,85), Germany (86,87), and other European countries (88–90) indicate that fewer than half of the people maintain adequate physical activity, more than half are former or nonsmokers, and only a quarter maintain a healthy body weight or eat a healthy dietary pattern. These data suggest an immense opportunity to improve adherence to LRLBs in Europe and worldwide to address the epidemic of type 2 diabetes and its downstream complications. Our results suggest that interventions need not target adherence to all five LRLBs, as benefits can be accrued in a dose-dependent manner such that the addition of each LRLB is associated with a 33% RR reduction. Furthermore, an incremental approach that targets one LRLB at a time may lead to the adoption of multiple LRLBs over the long-term (91). Our results also suggest that the five LRLBs can be defined differently depending on the population, with the RR reductions shown to be robust to variable criteria with no evidence of effect modification by region or ethnicity.
Conclusion
The findings from our systematic review and meta-analysis confirm that adherence to a combination of lifestyle behaviors that includes achieving and maintaining a healthy body weight, healthy dietary pattern, regular physical activity, smoking abstinence or cessation, and light alcohol intake can have a substantial impact, lowering the overall risk of developing type 2 diabetes by 85%. Our certainty in the evidence is highly based on the very large magnitude of the risk reduction and presence of a dose-response gradient, with further studies unlikely to change our confidence in the estimate. Taken together with the evidence from randomized controlled trials of intensive lifestyle interventions (11), this evidence provides a strong rationale for clinical and public health programs that target these LRLBs for the primary prevention of diabetes. With so few individuals engaging in multiple LRLBs, strategies to drive adherence, especially in those at high risk for type 2 diabetes, is imperative. As alcohol has been associated with increased net harm, it might be prudent to focus more on the promotion of the other four LRLBs. Future research is needed to assess the association of LRLBs minus the inclusion of alcohol intake with diabetes risk and assess any added benefit of including adequate sleep along with other emerging LRLBs.
Article Information
Funding. The Diabetes and Nutrition Study Group (DNSG) of the European Association of the Study of Diabetes (EASD) commissioned this systematic review and meta-analysis and provided funding and logistical support for meetings as part of the development of the EASD Clinical Practice Guidelines for Nutrition Therapy. This work was also supported by the Canadian Institutes of Health Research (funding reference number, 129920) through the Canada-wide Human Nutrition Trialists’ Network (NTN). The Diet, Digestive tract, and Disease (three-dimensional) Centre, funded through the Canada Foundation for Innovation (CFI) and the Ministry of Research and Innovation’s Ontario Research Fund (ORF), provided the infrastructure for the conduct of this project. J.L.S. was funded by a PSI Graham Farquharson Knowledge Translation Fellowship, the Diabetes Canada Clinician Scientist Award, the Canadian Institutes of Health Research Institute of Nutrition, Metabolism and Diabetes/Canadian Nutrition Society New Investigator Partnership Prize, and the Banting & Best Diabetes Centre Sun Life Financial New Investigator. He has received research support from the Canadian Foundation for Innovation, Ontario Research Fund, Province of Ontario Ministry of Research and Innovation and Science, Canadian Institutes of health Research (CIHR), Diabetes Canada, American Society for Nutrition (ASN). He has received travel support, speaker fees, and/or honoraria from ASN. T.A.K. has received research support from the Canadian Institutes of Health Research. V.C. has received research support from the University of Toronto and the Toronto 3D Knowledge Synthesis and Clinical Trials Foundation. D.R. He served as a board member and secretary of the International Diabetes Federation (IDF) Europe in biennium 2015–2017. He is a director of Vuk Vrhovac University Clinic for Diabetes, Endocrinology and Metabolic Diseases, University Hospital at Merkur University Hospital, president of the Croatian Society for Diabetes and Metabolic Disorders of the Croatian Medical Association, chair of IDF Young Leaders in Diabetes Programme, executive committee member of the Diabetes and Cardiovascular Disease Study Group of European Association for the Study of Diabetes (EASD), the Croatian Endocrine Society, the Croatian Society for Obesity, and the Croatian Society for Endocrine Oncology. J.S.S. is on the Clinical Practice Guidelines Expert Committee of the European Association for the Study of Diabetes (EASD) and served in the Scientific Committee of the Spanish Food and Safety Agency and the Spanish Federation of the Scientific Societies of Food, Nutrition and Dietetics. He is a member of the International Carbohydrate Quality Consortium (ICQC) and Executive Board Member of the Diabetes and Nutrition Study Group (DNSG) of the EASD, and has received research support from the Instituto de Salud Carlos III, Spain, Ministerio de Educación y Ciencia, Spain, Departament de Salut Pública de la Generalitat de Catalunya, Catalonia, Spain, and the European Commission. C.W.C.K. has received grants or research support from the Canadian Institutes of Health Research, Agriculture and Agri-Foods Canada (AAFC), the International Nut and Dried Fruit Council, and the International Tree Nut Council Research and Education Foundation.
With the exception of the Clinical Practice Guidelines Committee of the DNSG of the EASD, none of the sponsors had a role in any aspect of the current study, including design and conduct of the study, collection, management, analysis, and interpretation of the data, and preparation, review, approval of the manuscript or decision to publish.
Duality of Interest. T.A.K. has received research support from the National Honey Board and International Life Sciences Institute (ILSI North America). D.R. has served as principal investigator or coinvestigator in clinical trials of AstraZeneca, Eli Lilly, MSD, Novo Nordisk, Sanofi Aventis, Solvay, and Trophos. He received honoraria for speaking or advisory board engagements and consulting fees from Abbott, Amgen, AstraZeneca, Bayer, Boehringer Ingelheim, Eli Lilly, Lifescan–Johnson and Johnson, Novartis, Novo Nordisk, MSD, Merck Sharp and Dohme, Pfizer, Pliva, Roche, Salvus, Sanofi Aventis, and Takeda. J.S.S. reports receiving grant support through his institution from the International Nut and Dried Fruit Council and reports serving on the board of the International Nut and Dried Fruit Council and the Eroski Foundation and serving on the Executive Committee of the Instituto Danone Spain and on the Scientific Committee of the Danone International Institute. He has received research support from the California Walnut Commission (Sacramento, CA) Patrimonio Comunal Olivarero, Spain, La Morella Nuts, Spain, and Borges S.A., Spain. J.S.S. reports receiving consulting fees or travel expenses from Danone, the California Walnut Commission, the Eroski Foundation, Instituto Danone–Spain, Nuts for Life, the Australian Nut Industry Council, Nestlé, Abbot Laboratories, and Font Vella Lanjarón. C.W.C.K. has received grants or research support from the Advanced Food Materials Network, the Almond Board of California, American Pistachio Growers, Barilla, the California Strawberry Commission, the Calorie Control Council, the Canola Council of Canada, Loblaw Brands Ltd., Pulse Canada, Saskatchewan Pulse Growers, and Unilever. He has received in-kind research support from the Almond Board of California, the California Walnut Council, the American Peanut Council, Barilla, Unilever, Unico/Primo, Loblaw Companies, Quaker, Pristine Gourmet, Kellogg Canada, and WhiteWave Foods. He has received travel support and/or honoraria from the American Peanut Council, American Pistachio Growers, Barilla, Bayer, the California Walnut Commission, the Canola Council of Canada, General Mills, the International Tree Nut Council, Loblaw Brands Ltd., the Nutrition Foundation of Italy, Oldways Preservation Trust, Orafti, Paramount Farms, the Peanut Institute, Pulse Canada, Sabra Dipping Co., Saskatchewan Pulse Growers, Sun-Maid, Tate and Lyle, Unilever, and WhiteWave Foods. He has served on the scientific advisory board for the International Tree Nut Council, McCormick Science Institute, Oldways Preservation Trust, Paramount Farms and Pulse Canada. He is a member of the ICQC, Executive Board Member of the DNSG of the EASD, is on the Clinical Practice Guidelines Expert Committee for Nutrition Therapy of the EASD, and is a Director of the Toronto 3D Knowledge Synthesis and Clinical Trials foundation. J.L.S. has received research support from the International Nut and Dried Fruit Council (INC) Foundation, National Honey Board (U.S. Department of Agriculture [USDA] honey “Checkoff” program), Institute for the Advancement of Food and Nutrition Sciences (IAFNS; formerly ILSI North America), Pulse Canada, Quaker Oats Center of Excellence, The United Soybean Board (USDA soy “Checkoff” program), The Tate and Lyle Nutritional Research Fund at the University of Toronto, The Glycemic Control and Cardiovascular Disease in Type 2 Diabetes Fund at the University of Toronto (a fund established by the Alberta Pulse Growers), The Plant Protein Fund at the University of Toronto (a fund which has received contributions from IFF), and The Nutrition Trialists Network Fund at the University of Toronto (a fund established by an inaugural donation from the Calorie Control Council). He has received food donations to support randomized controlled trials from the Almond Board of California, California Walnut Commission, Peanut Institute, Barilla, Unilever/Upfield, Unico/Primo, Loblaw Companies, Quaker, Kellogg Canada, Danone, Nutrartis, Soylent, and Dairy Farmers of Canada. He has received travel support, speaker fees and/or honoraria from Danone, Dairy Farmers of Canada, FoodMinds LLC, Nestlé, Abbott, General Mills, Nutrition Communications, International Food Information Council (IFIC), Calorie Control Council, International Sweeteners Association, International Glutamate Technical Committee, Phynova, and Brightseed. He has or has had ad hoc consulting arrangements with Perkins Coie LLP, Tate & Lyle, and Inquis Clinical Research. He is a former member of the European Fruit Juice Association Scientific Expert Panel and former member of the Soy Nutrition Institute (SNI) Scientific Advisory Committee. He is on the Clinical Practice Guidelines Expert Committees of Diabetes Canada, European Association for the study of Diabetes (EASD), Canadian Cardiovascular Society (CCS), and Obesity Canada/Canadian Association of Bariatric Physicians and Surgeons. He serves or has served as an unpaid member of the Board of Trustees and an unpaid scientific advisor for the Carbohydrates Committee of IAFNS. He is a member of the International Carbohydrate Quality Consortium (ICQC), Executive Board Member of the Diabetes and Nutrition Study Group (DNSG) of the EASD, and Director of the Toronto 3D Knowledge Synthesis and Clinical Trials foundation. His spouse is an employee of AB InBev. H.K. is Director of Clinical Research at the Physicians Committee for Responsible Medicine, a nonprofit organization that provides nutrition education and research. She is an Executive Board Member of the DNSG of the EASD. No other potential conflicts of interest relevant to this article were reported.
Author Contributions. T.A.K. contributed to data curation, formal analysis, investigation, methodology, project administration, resources, software, supervision, visualization, to writing the original draft and reviewing and editing the manuscript. D.F. contributed to data curation, formal analysis, investigation, methodology, writing the original draft, and reviewing and editing the manuscript. V.C. contributed to data curation, formal analysis, investigation, methodology, writing the original draft, and reviewing and editing the manuscript. S.A. contributed to formal analysis, investigation, methodology, resources, writing the original draft, and reviewing and editing the manuscript. S.B.M. contributed to methodology, resources, software, and to reviewing and editing the manuscript. H.K., D.R., J.S.-S., L.A.L., M.U., and C.W.C.K. contributed to conceptualization and to reviewing and editing the manuscript. J.L.S. contributed to conceptualization, funding acquisition, investigation, methodology, project administration, resources, software, supervision, validation, visualization, to writing and original draft, and reviewing and editing the manuscript. All authors approved the final version of the manuscript. Each author had access to all of the study data, takes responsibility for the accuracy of the analysis, and had authority over manuscript preparation and the decision to submit the manuscript for publication. J.L.S. is the guarantor of this work and, as such, had full access to all the data in the study and takes responsibility for the integrity of the data and the accuracy of the data analysis.
ICMJE Statement. All people listed as authors meet the criteria for authorship according to the International Committee of Medical Journal Editors (ICMJE) criteria for authorship, and no person other than the authors listed contributed significantly to its preparation.
Prior Presentation. Parts of this study were presented as an abstract at the 35th International Symposium on Diabetes and Nutrition, Skagen, Denmark, 19–21 June 2017.
Footnotes
Clinical trial reg. no. NCT03234101, clinicaltrials.gov
This article contains supplementary material online at https://doi.org/10.2337/figshare.21706151.
T.A.K. and D.F. contributed equally.
References
- 1. Saeedi P, Petersohn I, Salpea P, et al.; IDF Diabetes Atlas Committee . Global and regional diabetes prevalence estimates for 2019 and projections for 2030 and 2045: results from the International Diabetes Federation Diabetes Atlas, 9th edition. Diabetes Res Clin Pract 2019;157:107843. [DOI] [PubMed] [Google Scholar]
- 2. Biggs ML, Mukamal KJ, Luchsinger JA, et al. Association between adiposity in midlife and older age and risk of diabetes in older adults. JAMA 2010;303:2504–2512 [DOI] [PMC free article] [PubMed] [Google Scholar]
- 3. Schienkiewitz A, Schulze MB, Hoffmann K, Kroke A, Boeing H. Body mass index history and risk of type 2 diabetes: results from the European Prospective Investigation into Cancer and Nutrition (EPIC)-Potsdam Study. Am J Clin Nutr 2006;84:427–433 [DOI] [PubMed] [Google Scholar]
- 4. Schwingshackl L, Missbach B, König J, Hoffmann G. Adherence to a Mediterranean diet and risk of diabetes: a systematic review and meta-analysis. Public Health Nutr 2015;18:1292–1299 [DOI] [PMC free article] [PubMed] [Google Scholar]
- 5. Jannasch F, Kröger J, Schulze MB. Dietary patterns and type 2 diabetes: a systematic literature review and meta-analysis of prospective studies. J Nutr 2017;147:1174–1182 [DOI] [PubMed] [Google Scholar]
- 6. Smith AD, Crippa A, Woodcock J, Brage S. Physical activity and incident type 2 diabetes mellitus: a systematic review and dose-response meta-analysis of prospective cohort studies. Diabetologia 2016;59:2527–2545 [DOI] [PMC free article] [PubMed] [Google Scholar]
- 7. Pan A, Wang Y, Talaei M, Hu FB, Wu T. Relation of active, passive, and quitting smoking with incident type 2 diabetes: a systematic review and meta-analysis. Lancet Diabetes Endocrinol 2015;3:958–967 [DOI] [PMC free article] [PubMed] [Google Scholar]
- 8. Ford ES, Bergmann MM, Kröger J, Schienkiewitz A, Weikert C, Boeing H. Healthy living is the best revenge: findings from the European Prospective Investigation Into Cancer and Nutrition-Potsdam study. Arch Intern Med 2009;169:1355–1362 [DOI] [PubMed] [Google Scholar]
- 9. Long GH, Johansson I, Rolandsson O, et al. Healthy behaviours and 10-year incidence of diabetes: a population cohort study. Prev Med 2015;71:121–127 [DOI] [PubMed] [Google Scholar]
- 10. Lindström J, Peltonen M, Eriksson JG, et al.; Finnish Diabetes Prevention Study (DPS) . Improved lifestyle and decreased diabetes risk over 13 years: long-term follow-up of the randomised Finnish Diabetes Prevention Study (DPS). Diabetologia 2013;56:284–293 [DOI] [PubMed] [Google Scholar]
- 11. Uusitupa M, Khan TA, Viguiliouk E, et al. Prevention of type 2 diabetes by lifestyle changes: a systematic review and meta-analysis. Nutrients 2019;11:2611. [DOI] [PMC free article] [PubMed] [Google Scholar]
- 12. Higgins JPT, Thomas J, Chandler J, et al. Cochrane Handbook for Systematic Reviews of Interventions. 2nd ed. Chichester: John Wiley & Sons, 2019 [Google Scholar]
- 13. Stroup DF, Berlin JA, Morton SC, et al. Meta-analysis of observational studies in epidemiology: a proposal for reporting. Meta-analysis Of Observational Studies in Epidemiology (MOOSE) group. JAMA 2000;283:2008–2012 [DOI] [PubMed] [Google Scholar]
- 14. Page MJ, McKenzie JE, Bossuyt PM, et al. The PRISMA 2020 statement: an updated guideline for reporting systematic reviews. Syst Rev 2021;10:89. [DOI] [PMC free article] [PubMed] [Google Scholar]
- 15. Wells GA, Shea B, O’Connell D, et al. The Newcastle-Ottawa Scale (NOS) for assessing the quality of nonrandomised studies in meta-analyses. Ottawa, The Ottawa Hospital Research Institute, 2000 [Google Scholar]
- 16. Zhang Y, Huang L, Wang D, Ren P, Hong Q, Kang D. The ROBINS-I and the NOS had similar reliability but differed in applicability: a random sampling observational studies of systematic reviews/meta-analysis. J Evid Based Med 2021;14:112–122 [DOI] [PubMed] [Google Scholar]
- 17. Semnani-Azad Z, Khan TA, Blanco Mejia S, et al. Association of major food sources of fructose-containing sugars with incident metabolic syndrome: a systematic review and meta-analysis. JAMA Netw Open 2020;3:e209993. [DOI] [PMC free article] [PubMed] [Google Scholar]
- 18. Lin X, Xu Y, Pan X, et al. Global, regional, and national burden and trend of diabetes in 195 countries and territories: an analysis from 1990 to 2025. Sci Rep 2020;10:14790. [DOI] [PMC free article] [PubMed] [Google Scholar]
- 19. DerSimonian R, Laird N. Meta-analysis in clinical trials. Control Clin Trials 1986;7:177–188 [DOI] [PubMed] [Google Scholar]
- 20. Guyatt GH, Oxman AD, Kunz R, et al.; GRADE Working Group . GRADE guidelines: 7. Rating the quality of evidence--inconsistency. J Clin Epidemiol 2011;64:1294–1302 [DOI] [PubMed] [Google Scholar]
- 21. Higgins J, Jackson D, Barrett J, Lu G, Ades A, White IR. Consistency and inconsistency in network meta-analysis: concepts and models for multi-arm studies. Res Synth Methods 2012;3:98–110 [DOI] [PMC free article] [PubMed] [Google Scholar]
- 22. Riley RD, Higgins JP, Deeks JJ. Interpretation of random effects meta-analyses. BMJ 2011;342:d549. [DOI] [PubMed] [Google Scholar]
- 23. IntHout J, Ioannidis JP, Rovers MM, Goeman JJ. Plea for routinely presenting prediction intervals in meta-analysis. BMJ Open 2016;6:e010247. [DOI] [PMC free article] [PubMed] [Google Scholar]
- 24. Higgins J, Thomas J. Cochrane Handbook for Systematic Reviews of Interventions. Version 6.3, 2022. Accessed 24 October 2022. Available from https://training.cochrane.org/handbook/current
- 25. Sutton AJ, Higgins JP. Recent developments in meta-analysis. Stat Med 2008;27:625–650 [DOI] [PubMed] [Google Scholar]
- 26. VanderWeele TJ, Ding P. Sensitivity analysis in observational research: introducing the E-value. Ann Intern Med 2017;167:268–274 [DOI] [PubMed] [Google Scholar]
- 27. Crippa A, Discacciati A, Bottai M, Spiegelman D, Orsini N. One-stage dose-response meta-analysis for aggregated data. Stat Methods Med Res 2019;28:1579–1596 [DOI] [PubMed] [Google Scholar]
- 28. Orsini N. Weighted mixed-effects dose–response models for tables of correlated contrasts. Stata J 2021;21:320–347 [Google Scholar]
- 29. Begg CB, Mazumdar M. Operating characteristics of a rank correlation test for publication bias. Biometrics 1994;50:1088–1101 [PubMed] [Google Scholar]
- 30. Egger M, Davey Smith G, Schneider M, Minder C. Bias in meta-analysis detected by a simple, graphical test. BMJ 1997;315:629–634 [DOI] [PMC free article] [PubMed] [Google Scholar]
- 31. Duval S, Tweedie R. Trim and fill: a simple funnel-plot-based method of testing and adjusting for publication bias in meta-analysis. Biometrics 2000;56:455–463 [DOI] [PubMed] [Google Scholar]
- 32. Guyatt G, Oxman AD, Akl EA, et al. GRADE guidelines: 1. Introduction—GRADE evidence profiles and summary of findings tables. J Clin Epidemiol 2011;64:383–394 [DOI] [PubMed] [Google Scholar]
- 33. Schünemann HJ, Higgins JP, Vist GE, et al.; Cochrane GRADEing Methods Group and the Cochrane Statistical Methods Group . Completing ‘Summary of findings’ tables and grading the certainty of the evidence. In Cochrane Handbook for Systematic Reviews of Interventions. London, Cochrane Collaboration, 2019, pp. 375–402 [Google Scholar]
- 34. Tuomilehto J, Wang Y, Hu G, Jousilahti P. Poster Sessions: Avoidance of type 2 diabetes (T2D) depends on adherence with multiple concomitant healthy lifestyle traits: a prospective real-life population-based observation in Finland. J Diabetes 2013;5:52 [Google Scholar]
- 35. Rajaobelina K, Dow C, Romana Mancini F, et al. Population attributable fractions of the main type 2 diabetes mellitus risk factors in women: findings from the French E3N cohort. J Diabetes 2019;11:242–253 [DOI] [PubMed] [Google Scholar]
- 36. Lv J, Yu C, Guo Y, et al.; China Kadoorie Biobank Collaborative Group . Adherence to a healthy lifestyle and the risk of type 2 diabetes in Chinese adults. Int J Epidemiol 2017;46:1410–1420 [DOI] [PMC free article] [PubMed] [Google Scholar]
- 37. Djoussé L, Driver JA, Gaziano JM, Buring JE, Lee IM. Association between modifiable lifestyle factors and residual lifetime risk of diabetes. Nutr Metab Cardiovasc Dis 2013;23:17–22 [DOI] [PMC free article] [PubMed] [Google Scholar]
- 38. Li Y, Ley SH, Tobias DK, et al. Birth weight and later life adherence to unhealthy lifestyles in predicting type 2 diabetes: prospective cohort study. BMJ 2015;351:h3672. [DOI] [PMC free article] [PubMed] [Google Scholar]
- 39. Joosten MM, Grobbee DE, van der A DL, Verschuren WM, Hendriks HF, Beulens JW. Combined effect of alcohol consumption and lifestyle behaviors on risk of type 2 diabetes. Am J Clin Nutr 2010;91:1777–1783 [DOI] [PubMed] [Google Scholar]
- 40. Reis JP, Loria CM, Sorlie PD, Park Y, Hollenbeck A, Schatzkin A. Lifestyle factors and risk for new-onset diabetes: a population-based cohort study. Ann Intern Med 2011;155:292–299 [DOI] [PMC free article] [PubMed] [Google Scholar]
- 41. Mozaffarian D, Kamineni A, Carnethon M, Djoussé L, Mukamal KJ, Siscovick D. Lifestyle risk factors and new-onset diabetes mellitus in older adults: the cardiovascular health study. Arch Intern Med 2009;169:798–807 [DOI] [PMC free article] [PubMed] [Google Scholar]
- 42. Dow C, Balkau B, Bonnet F, et al. Strong adherence to dietary and lifestyle recommendations is associated with decreased type 2 diabetes risk in the AusDiab cohort study. Prev Med 2019;123:208–216 [DOI] [PubMed] [Google Scholar]
- 43. Steinbrecher A, Morimoto Y, Heak S, et al. The preventable proportion of type 2 diabetes by ethnicity: the multiethnic cohort. Ann Epidemiol 2011;21:526–535 [DOI] [PMC free article] [PubMed] [Google Scholar]
- 44. Simmons RK, Harding A-H, Jakes RW, Welch A, Wareham NJ, Griffin SJ. How much might achievement of diabetes prevention behaviour goals reduce the incidence of diabetes if implemented at the population level? Diabetologia 2006;49:905–911 [DOI] [PubMed] [Google Scholar]
- 45. Han X, Wei Y, Hu H, et al. Genetic risk, a healthy lifestyle, and type 2 diabetes: the Dongfeng-Tongji Cohort Study. J Clin Endocrinol Metab 2020;105:dgz325. [DOI] [PubMed] [Google Scholar]
- 46. Li Y, Schoufour J, Wang DD, et al. Healthy lifestyle and life expectancy free of cancer, cardiovascular disease, and type 2 diabetes: prospective cohort study. BMJ 2020;368:l6669. [DOI] [PMC free article] [PubMed] [Google Scholar]
- 47. Shen QM, Li HL, Li ZY, et al. Joint impact of BMI, physical activity and diet on type 2 diabetes: Findings from two population-based cohorts in China. Diabet Med 2022;39:e14762. [DOI] [PubMed] [Google Scholar]
- 48. Delgado-Velandia M, Gonzalez-Marrachelli V, Domingo-Relloso A, et al. Healthy lifestyle, metabolomics and incident type 2 diabetes in a population-based cohort from Spain. Int J Behav Nutr Phys Act 2022;19:8. [DOI] [PMC free article] [PubMed] [Google Scholar]
- 49. Wang W, Lv J, Yu C, et al.; China Kadoorie Biobank Collaborative Group . Lifestyle factors and fetal and childhood origins of type 2 diabetes: a prospective study of Chinese and European adults. Am J Clin Nutr 2022;115:749–758 [DOI] [PubMed] [Google Scholar]
- 50. Zhang J, Yu KF. What’s the relative risk? A method of correcting the odds ratio in cohort studies of common outcomes. JAMA 1998;280:1690–1691 [DOI] [PubMed] [Google Scholar]
- 51. Shor E, Roelfs D, Vang ZM. The “Hispanic mortality paradox” revisited: meta-analysis and meta-regression of life-course differentials in Latin American and Caribbean immigrants’ mortality. Soc Sci Med 2017;186:20–33 [DOI] [PubMed] [Google Scholar]
- 52. Miettinen OS. Proportion of disease caused or prevented by a given exposure, trait or intervention. Am J Epidemiol 1974;99:325–332 [DOI] [PubMed] [Google Scholar]
- 53. Zhang Y, Pan XF, Chen J, et al. Combined lifestyle factors and risk of incident type 2 diabetes and prognosis among individuals with type 2 diabetes: a systematic review and meta-analysis of prospective cohort studies. Diabetologia 2020;63:21–33 [DOI] [PubMed] [Google Scholar]
- 54. Schlesinger S, Neuenschwander M, Ballon A, Nöthlings U, Barbaresko J. Adherence to healthy lifestyles and incidence of diabetes and mortality among individuals with diabetes: a systematic review and meta-analysis of prospective studies. J Epidemiol Community Health 2020;74:481–487 [DOI] [PubMed] [Google Scholar]
- 55. Tuomilehto J, Lindström J, Eriksson JG, et al.; Finnish Diabetes Prevention Study Group . Prevention of type 2 diabetes mellitus by changes in lifestyle among subjects with impaired glucose tolerance. N Engl J Med 2001;344:1343–1350 [DOI] [PubMed] [Google Scholar]
- 56. Lindström J, Peltonen M, Eriksson JG, et al. High-fibre, low-fat diet predicts long-term weight loss and decreased type 2 diabetes risk: the Finnish Diabetes Prevention Study. Diabetologia 2006;49:912–920 [DOI] [PubMed] [Google Scholar]
- 57. Penn L, White M, Lindström J, et al. Importance of weight loss maintenance and risk prediction in the prevention of type 2 diabetes: analysis of European Diabetes Prevention Study RCT. PLoS One 2013;8:e57143. [DOI] [PMC free article] [PubMed] [Google Scholar]
- 58. Knowler WC, Barrett-Connor E, Fowler SE, et al.; Diabetes Prevention Program Research Group . Reduction in the incidence of type 2 diabetes with lifestyle intervention or metformin. N Engl J Med 2002;346:393–403 [DOI] [PMC free article] [PubMed] [Google Scholar]
- 59. Kodama S, Horikawa C, Fujihara K, et al. Comparisons of the strength of associations with future type 2 diabetes risk among anthropometric obesity indicators, including waist-to-height ratio: a meta-analysis. Am J Epidemiol 2012;176:959–969 [DOI] [PubMed] [Google Scholar]
- 60. Lean ME, Leslie WS, Barnes AC, et al. Primary care-led weight management for remission of type 2 diabetes (DiRECT): an open-label, cluster-randomised trial. Lancet 2018;391:541–551 [DOI] [PubMed] [Google Scholar]
- 61. Salas-Salvadó J, Guasch-Ferré M, Lee C-H, Estruch R, Clish CB, Ros E. Protective effects of the Mediterranean diet on type 2 diabetes and metabolic syndrome. J Nutr 2015;146:920S–927S [DOI] [PMC free article] [PubMed] [Google Scholar]
- 62. Aune D, Norat T, Leitzmann M, Tonstad S, Vatten LJ. Physical activity and the risk of type 2 diabetes: a systematic review and dose-response meta-analysis. Eur J Epidemiol 2015;30:529–542 [DOI] [PubMed] [Google Scholar]
- 63. Knott C, Bell S, Britton A. Alcohol consumption and the risk of type 2 diabetes: a systematic review and dose-response meta-analysis of more than 1.9 million individuals from 38 observational studies. Diabetes Care 2015;38:1804–1812 [DOI] [PubMed] [Google Scholar]
- 64. Li X-H, Yu FF, Zhou YH, He J. Association between alcohol consumption and the risk of incident type 2 diabetes: a systematic review and dose-response meta-analysis. Am J Clin Nutr 2016;103:818–829 [DOI] [PubMed] [Google Scholar]
- 65. Holst C, Becker U, Jørgensen ME, Grønbæk M, Tolstrup JS. Alcohol drinking patterns and risk of diabetes: a cohort study of 70,551 men and women from the general Danish population. Diabetologia 2017;60:1941–1950 [DOI] [PubMed] [Google Scholar]
- 66. Fernández-Solà J. Cardiovascular risks and benefits of moderate and heavy alcohol consumption. Nat Rev Cardiol 2015;12:576–587 [DOI] [PubMed] [Google Scholar]
- 67. Holmes MV, Asselbergs FW, Palmer TM, et al.; UCLEB consortium . Mendelian randomization of blood lipids for coronary heart disease. Eur Heart J 2015;36:539–550 [DOI] [PMC free article] [PubMed] [Google Scholar]
- 68. Chiavaroli L, Viguiliouk E, Nishi SK, et al. DASH dietary pattern and cardiometabolic outcomes: an umbrella review of systematic reviews and meta-analyses. Nutrients 2019;11:338. [DOI] [PMC free article] [PubMed] [Google Scholar]
- 69. Cespedes EM, Hu FB. Dietary prevention of obesity and cardiometabolic disease. Nat Rev Endocrinol 2015;11:448–449 [DOI] [PMC free article] [PubMed] [Google Scholar]
- 70. Wang Y, Xu D. Effects of aerobic exercise on lipids and lipoproteins. Lipids Health Dis 2017;16:132. [DOI] [PMC free article] [PubMed] [Google Scholar]
- 71. Palmefors H, DuttaRoy S, Rundqvist B, Börjesson M. The effect of physical activity or exercise on key biomarkers in atherosclerosis–a systematic review. Atherosclerosis 2014;235:150–161 [DOI] [PubMed] [Google Scholar]
- 72. Snowling NJ, Hopkins WG. Effects of different modes of exercise training on glucose control and risk factors for complications in type 2 diabetic patients: a meta-analysis. Diabetes Care 2006;29:2518–2527 [DOI] [PubMed] [Google Scholar]
- 73. Vina J, Sanchis-Gomar F, Martinez-Bello V, Gomez-Cabrera MC. Exercise acts as a drug; the pharmacological benefits of exercise. Br J Pharmacol 2012;167:1–12 [DOI] [PMC free article] [PubMed] [Google Scholar]
- 74. Colberg SR, Sigal RJ, Yardley JE, et al. Physical activity/exercise and diabetes: a position statement of the American Diabetes Association. Diabetes Care 2016;39:2065–2079 [DOI] [PMC free article] [PubMed] [Google Scholar]
- 75. Chang SA. Smoking and type 2 diabetes mellitus. Diabetes Metab J 2012;36:399–403 [DOI] [PMC free article] [PubMed] [Google Scholar]
- 76. Yeh HC, Duncan BB, Schmidt MI, Wang NY, Brancati FL. Smoking, smoking cessation, and risk for type 2 diabetes mellitus: a cohort study. Ann Intern Med 2010;152:10–17 [DOI] [PMC free article] [PubMed] [Google Scholar]
- 77. Griswold MG, Fullman N, Hawley C, et al.; GBD 2016 Alcohol Collaborators . Alcohol use and burden for 195 countries and territories, 1990-2016: a systematic analysis for the Global Burden of Disease Study 2016. Lancet 2018;392:1015–1035 [DOI] [PMC free article] [PubMed] [Google Scholar]
- 78. Marlatt GA, Witkiewitz K. Harm reduction approaches to alcohol use: health promotion, prevention, and treatment. Addict Behav 2002;27:867–886 [DOI] [PubMed] [Google Scholar]
- 79. Nutt DJ, Rehm J. Doing it by numbers: a simple approach to reducing the harms of alcohol. J Psychopharmacol 2014;28:3–7 [DOI] [PubMed] [Google Scholar]
- 80. Rücker G, Schwarzer G, Carpenter JR, Schumacher M. Undue reliance on I(2) in assessing heterogeneity may mislead. BMC Med Res Methodol 2008;8:79. [DOI] [PMC free article] [PubMed] [Google Scholar]
- 81. Haneuse S, VanderWeele TJ, Arterburn D. Using the E-value to assess the potential effect of unmeasured confounding in observational studies. JAMA 2019;321:602–603 [DOI] [PubMed] [Google Scholar]
- 82. Shan Z, Ma H, Xie M, et al. Sleep duration and risk of type 2 diabetes: a meta-analysis of prospective studies. Diabetes Care 2015;38:529–537 [DOI] [PubMed] [Google Scholar]
- 83. D’Aiuto F, Gkranias N, Bhowruth D, et al.; TASTE Group . Systemic effects of periodontitis treatment in patients with type 2 diabetes: a 12 month, single-centre, investigator-masked, randomised trial. Lancet Diabetes Endocrinol 2018;6:954–965 [DOI] [PubMed] [Google Scholar]
- 84. White J, Greene G, Kivimaki M, Batty GD. Association between changes in lifestyle and all-cause mortality: the Health and Lifestyle Survey. J Epidemiol Community Health 2018;72:711–714 [DOI] [PubMed] [Google Scholar]
- 85. Möller H, Dherani M, Harwood C, Kinsella T, Pope D. Health planning for the future: comparative risk assessment of five major lifestyle risk factors: evidence from the Wirral, UK. J Public Health (Oxf) 2012;34:430–437 [DOI] [PubMed] [Google Scholar]
- 86. Truthmann J, Busch MA, Scheidt-Nave C, et al. Modifiable cardiovascular risk factors in adults aged 40-79 years in Germany with and without prior coronary heart disease or stroke. BMC Public Health 2015;15:701. [DOI] [PMC free article] [PubMed] [Google Scholar]
- 87. Wirth T, Kozak A, Schedlbauer G, Nienhaus A. Health behaviour, health status and occupational prospects of apprentice nurses and kindergarten teachers in Germany: a cross-sectional study. J Occup Med Toxicol 2016;11:26. [DOI] [PMC free article] [PubMed] [Google Scholar]
- 88. Kotseva K, Wood D, De Bacquer D, et al.; EUROASPIRE Investigators . EUROASPIRE IV: A European Society of Cardiology survey on the lifestyle, risk factor and therapeutic management of coronary patients from 24 European countries. Eur J Prev Cardiol 2016;23:636–648 [DOI] [PubMed] [Google Scholar]
- 89. De Cocker K, Ottevaere C, Sjöström M, et al.; HELENA Study Group . Self-reported physical activity in European adolescents: results from the HELENA (Healthy Lifestyle in Europe by Nutrition in Adolescence) study. Public Health Nutr 2011;14:246–254 [DOI] [PubMed] [Google Scholar]
- 90. Moreno LA, Gottrand F, Huybrechts I, Ruiz JR, González-Gross M; HELENA Study Group . Nutrition and lifestyle in european adolescents: the HELENA (Healthy Lifestyle in Europe by Nutrition in Adolescence) study. Adv Nutr 2014;5:615S–623S [DOI] [PMC free article] [PubMed] [Google Scholar]
- 91. Johnson SS, Paiva AL, Cummins CO, et al. Transtheoretical model-based multiple behavior intervention for weight management: effectiveness on a population basis. Prev Med 2008;46:238–246 [DOI] [PMC free article] [PubMed] [Google Scholar]