

Abstract
Monitoring progress towards UNAIDS 90-90-90 targets among key populations is essential to achieve HIV/AIDS epidemic control. Using data from serial cross-sectional surveys, we comparatively evaluated changes in HIV care continuum indicators among community-based people who inject drugs (PWID) and men who have sex with men (MSM) in India. Cross-sectional baseline (2012–13) and follow-up (2016–17) samples of ~1,000 participants per site were recruited using respondent-driven sampling (10 MSM and 12 PWID sites in 21 Indian cities). All participants were tested for HIV and HIV RNA was measured in HIV-positive participants. Linear regression was used to model temporal site-level changes in HIV care continuum indicators in MSM versus PWID. At baseline, we recruited 2,544 HIV-infected PWID and 1,086 HIV-infected MSM. At follow-up, we recruited 2,517 HIV-infected PWID and 1,763 HIV-infected MSM. At baseline, there were no significant differences in care continuum indicators between MSM and PWID. At follow-up, compared to PWID, the proportion of MSM reaching each care continuum indicator—awareness of status, receipt of HIV care, ART use, and viral suppression—increased by 15–33 percentage points. At follow-up, 78% of MSM compared to 49% of PWID were aware of their status (p<0.01); 56% of MSM compared to 32% of PWID were virologically suppressed (p=0.05). HIV-infected MSM showed marked improvements across the care continuum, whereas HIV-positive PWID lagged behind and may require additional intervention. Differential improvement in HIV engagement over time may necessitate key population-specific interventions and routine surveillance efforts to monitor and facilitate progress towards HIV elimination.
Keywords: injection drug use, India, HIV prevalence, HIV incidence, harm reduction, needle and syringe exchange
Introduction:
Globally, key populations, including people who inject drugs (PWID) and men who have sex with men (MSM) and their sexual partners, account for over half of new HIV infections (90-90-90: treatment for all | UNAIDS, 2018). HIV risk among key populations is compounded by stigma, discrimination, and criminalization of risk behaviors, which inhibit access to HIV prevention and treatment services, leading to sub-optimal HIV outcomes (Risher et al., 2015).
UNAIDS recently outlined the 95-95-95 “Fast-Track goals to end the AIDS epidemic by 2030”, which build on the previous 90-90-90 targets. According to these goals, 95% of those infected with HIV should know their status, 95% of those aware of their status should be on sustained antiretroviral therapy (ART), and 95% of those on treatment should be virally suppressed (Understanding Fast-Track Targets. Accelerating action to end the AIDS epidemic by 2030, 2015). Achieving these ambitious targets requires comprehensive strategies to address HIV diagnostic and treatment gaps in all populations affected by HIV, including key populations, particularly in low- and middle-income countries (LMICs).
India is home to an estimated 2.35 million HIV-infected people, making it the third largest HIV epidemic in the world (UNAIDS Data 2019, 2019). The HIV epidemic is driven primarily by heterosexual transmission (Arora et al., 2008). As such, HIV prevention and treatment efforts historically have targeted populations whereby HIV is transmitted through heterosexual contact, resulting in substantial decreases in HIV prevalence and incidence in this group. In contrast, vulnerable populations like PWID and MSM shoulder a disproportionate burden of HIV, with prevalence estimates 20 to 30 times higher than the general population (Annual Report 2018–2019, 2019). Recent studies suggest that HIV prevalence and incidence are increasing, or stabilizing at best, in these two populations (Lucas et al., 2015; Sunil Suhas Solomon et al., 2016). Consequently, in recent years, the National AIDS Control Programme has increased focus on addressing HIV prevention and treatment gaps in these key populations (Annual Report 2018–2019, 2019). National HIV prevention and treatment strategies for MSM and PWID provide a package of prevention, support, and linkage services (both facility- and outreach-based) including screening and treatment for sexually transmitted infections, free condom distribution, behaviour change communication, linkages to integrated HIV counselling and testing centres, linkages with care and support services for HIV-positive individuals. Additional strategies for PWID include free needle and syringe services, abscess prevention, and medication for opioid use disorder.
Despite these efforts, community-based data from 2013–2014 suggest uptake of HIV prevention and treatment services among PWID and MSM across much of India remains suboptimal (Mehta et al., 2015). Specifically, in this study, fewer than 50% of HIV-positive PWID and MSM sampled across 26 Indian cities were aware of their status, and fewer than 20% had suppressed HIV viral load. Poor uptake of HIV services is further compounded by criminalization of injection drug use and same-sex behaviors (until recently), which limit health-seeking behaviors of these already hidden populations, further hampering access (Annual Report 2018–2019, 2019; Details of ICTC Centres; List of ART Centres). Temporal data on changes in the HIV care continuum among key populations in LMICs are sparse, yet necessary to make informed programmatic decisions. In this manuscript, we leverage data from two serial cross-sectional surveys to compare temporal changes in HIV care continuum outcomes among PWID and MSM in India from 2013 to 2017.
Methods:
Study Design:
Data were collected as part of a cluster-randomized trial of an integrated service delivery intervention that aimed to increase HIV testing rates and engagement in HIV care among PWID and MSM across India (Clinical Trial Number: NCT01686750).(Sunil S. Solomon et al., 2016) Details of the study are described elsewhere.(Solomon et al., 2019) Briefly, we conducted the study in 22 sites (12 PWID and 10 MSM), of which 11 (6 PWID and 5 MSM) were assigned to the intervention and 11 were assigned to control (Figure 1). The study was conducted in 21 different cities across different regions of India; New Delhi, had both a PWID and an MSM site. In intervention sites, we scaled up at least one key population-focused facility that provided rapid on-site HIV testing, condoms, counselling, sexually transmitted infection screening, tuberculosis screening, linkage and retention to HIV care (for HIV-positive persons), and (at PWID sites) medication for opioid use disorder and syringe exchange (at the field-level). Sites assigned to the control group received no specific intervention, although services provided at integrated care centres were available but were not integrated or tailored to key populations.
Figure 1. Map of Study sites:
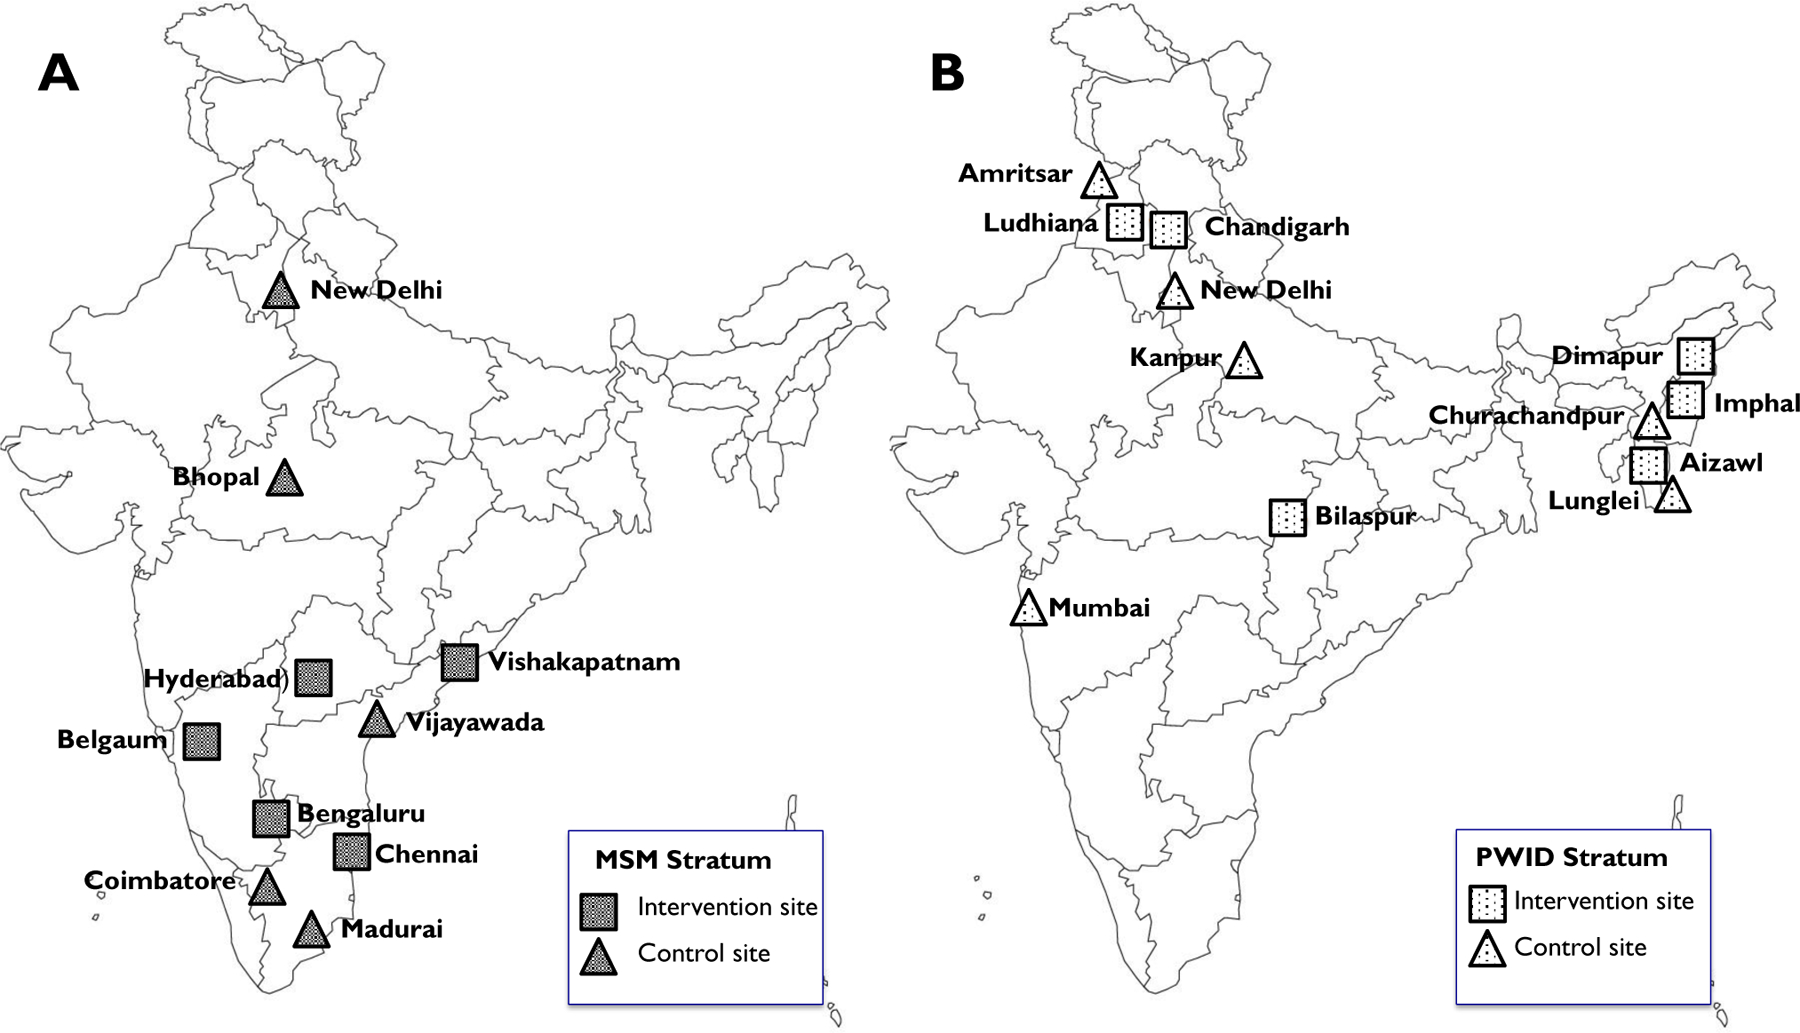
Map of India showing cities in which [A] men who have sex with men (MSM) and [B] people who inject drugs (PWID) were recruited in cross-sectional surveys at baseline (2012/13) and follow-up (2016/17) in a cluster-randomized trial. Cities assigned to control or intervention group are shown as triangles and squares, respectively.
To determine the community-level impact of the intervention, independent baseline (before the intervention) and follow-up (after the intervention) assessments were conducted in each city among PWID or MSM using respondent-driven sampling (RDS). Data collection took place from September 2012-December 2013 (baseline) and from August 2016-August 2017 (follow-up). We previously reported that the intervention was associated with some modest improvement in HIV testing though this difference was not statistically significant (p=0.09). There was no substantial impact of the intervention on any HIV care continuum outcome overall or for the PWID or MSM strata.(Solomon et al., 2019) In the present analysis, we compare temporal changes in care continuum outcomes among HIV-positive PWID and MSM who participated in these surveys.
Recruitment and study population:
RDS is a chain-referral sampling method, in which participants recruit members from their social networks using a coupon system (Heckathorn, 1997; Salganik & Heckathorn, 2004). Each survey was conducted from a single field site with two or three “seed” participants (influential and connected individuals) who were given two coupons to recruit members of their social networks. Recruits returned to the field site with coupons and, if eligible, completed a study visit and were given two new coupons to recruit others. Recruitment continued through successive RDS waves until the target sample of approximately 1,000 was reached in each site.
Participants were reimbursed for completing a study visit and for referring eligible participants. A biometric fingerprint-based tracking system was used to ensure non-duplicate enrolment in the baseline or follow-up surveys separately (individuals could participate in both the baseline and follow-up surveys). Eligible participants had a valid recruitment coupon, were 18 years or older, spoke English, Hindi, or the local language, and provided consent. Additional eligibility requirements included reporting injection drug use in the prior two years for PWID sites or self-identifying as male and reporting oral or anal intercourse with a man in the prior year for MSM sites.
Study procedures:
Eligible participants provided a blood sample and completed an interviewer-administered electronic questionnaire which queried demographics, risk behaviours, experience with HIV testing, and access to HIV services (if known to be HIV-positive). Participants who self-reported a prior positive HIV test or were ever told they had HIV were additionally queried about use of HIV-related services including seeing a healthcare provider for HIV, initiation of antiretroviral therapy and self-reported adherence. Questions regarding care continuum outcomes were identical in the two surveys. To minimize social desirability bias, interviewers were not affiliated with the integrated care centres (in intervention cities) or with local organizations serving the key population in question. Following the survey, all participants underwent rapid HIV testing with appropriate pre- and post-test counselling, and referrals to care, where applicable.
Laboratory methods:
On-site HIV testing was conducted with a protocol using three rapid HIV tests: Alere™ Determine™ HIV-1/2 (Alere Medical Co., Ltd., Chiba, Japan), First Response HIV card test 1–2.0 (PMC Medical India Pvt Ltd, Daman, India), and Signal Flow Through HIV 1+2 Spot/Immunodot Test kit, (Span Diagnostics Ltd, Surat, India). Blood samples were shipped for storage and additional testing to a central laboratory in Chennai, India. In HIV-positive participants, we measured absolute CD4+ T-cell counts with the FlowCARE™ PLG CD4 (CD45-FITC/CD4-PE) assay (Beckman Coulter, Brea, CA, USA) and HIV RNA with RealTime HIV-1 assay (Abbott Laboratories, Abbott Park, Illinois, USA).
Statistical analysis:
We examined RDS process data including time to reach recruitment targets, recruitment waves reached at each site, equilibrium, and homophily (Heckathorn, 1997). The denominator in each city survey was the number of participants who tested HIV-positive at the study visit. Participants who reported HIV-positive status during the survey (prior to receiving HIV test results) were defined as aware of their status. Those who reported a visit with an HIV clinician in the prior 6 months were defined as in care and those who reported use of antiretroviral therapy (ART) in the prior 30 days were defined as using ART. Finally, those with HIV RNA <150 copies/mL were considered to have viral load suppression, irrespective of self-reported awareness of status, receipt of HIV care, or ART use. We used RDS-II weights, which were based on participants’ reported network sizes (number of PWID or MSM seen in the past 30 days) to account for unequal probability of recruitment (Heckathorn, 2002).
In the baseline and follow-up surveys, we compared the pooled site-level prevalence of the four care continuum outcomes for PWID and MSM. We modelled the difference in log prevalence of each outcome between the two populations using a linear regression model. We then compared changes in each of the four outcomes, between baseline and follow-up in PWID and MSM, by modelling the site-level difference in differences using a linear regression model. We adjusted for intervention status in the parent trial and prevalence of the care continuum outcome at baseline.
We conducted four sensitivity analyses. First, we repeated analyses using unweighted outcome estimates. Second, we examined MSM-PWID differences in care continuum outcome changes, stratified by intervention allocation in the parent trial. Third, to account for potential nondisclosure of HIV status in interviews, (Marzinke et al., 2014) we repeated analyses in which participants with a suppressed viral load were considered to be aware of their status, in care, and receiving ART irrespective of what they reported in the survey. Fourth, we reanalysed the outcomes of ART use and viral suppression by including only participants in the denominator who were ART eligible. During the study period, Indian HIV treatment guidelines recommended that ART be initiated when the CD4 count was below 350 cells/µL. In the sensitivity analysis, we revised the denominator for these outcomes to include participants who: 1) had a CD4 count <350 cells/µL measured at the study visit or 2) reported being prescribed ART at any time in the past. All statistical analyses were conducted using Stata 14 (StataCorp. 2015. Stata Statistical Software: Release 14. College Station, TX: StataCorp LP).
Ethical oversight:
This study was approved by the institutional review boards of YRGCARE in Chennai, India, Johns Hopkins Medicine, and Johns Hopkins Bloomberg School of Public Health in Baltimore, MD, USA. Survey participants provided oral informed consent.
Results:
Population characteristics:
In the baseline RDS survey (October 2012 - December 2013), we recruited 11,993 PWID and 9,997 MSM, of whom 2,544 (21.2%) and 1,086 (10.9%) were HIV-positive, respectively. In the follow-up survey (August 2016 - May 2017), we recruited 11,721 PWID and 10,005 MSM, of whom 2,517 (21.5%) and 1,763 (17.6%) were HIV-positive, respectively. Across both populations, the median time to complete recruitment was 123 days (range: 52 – 200) in the baseline survey and 155 days (range: 96 – 269) in the follow-up survey (Appendix Tables 1–4 show RDS process measures for both surveys). Homophily values for HIV status were generally low (i.e., participants were only marginally more likely than chance to recruit someone with the same HIV status as themselves).
HIV prevalence in the baseline survey ranged from 8.6% to 31.1% in PWID sites and from 3.8% to 13.1% in MSM sites, while prevalence in the follow-up survey ranged from 5.6% to 38.0% in PWID sites and from 3.3% to 32.8% in MSM sites (data not shown).(Solomon et al., 2019) Weighted site-level estimates of HIV-positive participant characteristics in each survey are shown in Table 1 (corresponding unweighted data are shown in Appendix Table 5). The weighted site-level median CD4 count (site range) in the baseline and follow-up surveys was 309 cells/µL (215 – 409) and 305 cells/µL (215 – 409) in PWID cities, and 370 cells/µL (249 – 438) and 382 cells/µL (249 – 438) in MSM cities, respectively (Table 1). Participation in both the baseline and follow-up survey ranged from 7.5% to 23.5% in PWID sites and from 4.1% to 15.1% in MSM sites.
Table 1.
Characteristics of HIV-positive people who inject drugs and men who have sex with men that participated in baseline (2012–13) or follow-up (2016–17) surveys in 21 cities in India.
| People who inject drugs (12 sites) |
Men who have sex with men (10 sites) |
|||
|---|---|---|---|---|
|
| ||||
| Baseline | Follow-up | Baseline | Follow-up | |
| Participants, n | 2,544 | 2,517 | 1,086 | 1,763 |
| Age (years), median | 29 (24, 34) | 29 (25, 35) | 26 (21, 30) | 28 (22, 32) |
| Women, % | 7.2 (0, 22.7) | 5.9 (0.5, 22.0) | NA | NA |
| Married or living with opposite-sex partner, % | 44.4 (26.3, 63.9) | 41.9 (26.5, 62.5) | 38.0 (22.4, 63.0) | 51.5 (32.9, 87.0) |
| At least secondary school education, % | 63.8 (30.7, 95.1) | 68.3 (35.6, 97.6) | 80.4 (61.7, 93.2) | 81.6 (68.2, 88.9) |
| Monthly household income (US$), median | 193.0 (91.8, 388.6) | 255 (137.7, 459.0) | 154.5 (76.5, 244.8) | 221.8 (153, 306) |
| Hazardous alcohol usex, % | 39.7 (11.5, 66.8) | 35.0 (8.3, 51.5) | 38.7 (20.3, 57.6) | 28.3 (9.6, 43.2) |
| Injected drugs in past 6 months, % | 90.1 (68.6, 99.1) | 77.6 (27.1, 98.3) | NA | NA |
| Ever shared a needle or syringe, % | 48.6 (19.9, 80.4) | 49.4 (24.8, 82.4) | NA | NA |
| Unprotected anal sex with man in prior 6 months, % | NA | NA | 62.6 (42.3, 93.0) | 62.8 (39.8, 84.0) |
| Number of male partners in lifetime, median | NA | NA | 11.2 (3, 20) | 14 (1, 40) |
| CD4 count, cells/µL, median | 309.3 (215, 409) | 304.5 (215, 409) | 369.9 (249, 438) | 382.3 (249, 438) |
| Aware of HIV status, % | 37.8 (2.4, 81.6) | 49.2 (14.4, 86.5) | 42.0 (10.3, 90.0) | 77.8 (61.3, 97.4) |
| HIV care in prior 6 months, % | 19.2 (1.3, 58.2) | 26.6 (3.1, 65.1) | 32.1 (6.2, 88.7) | 63.0 (45.7, 88.0) |
| Using antiretroviral therapy, % | 16.5 (0, 53.9) | 25.6 (1.7, 75.2) | 30.4 (4.7, 70.8) | 63.8 (42.7, 92.3) |
| HIV RNA <150 copies/mL, % | 23.7 (0.9, 55.1) | 32.4 (5.6, 82.4) | 35.3 (19.4, 68.2) | 56.1 (33.0, 74.2) |
| Follow-up survey participants who also participated in baseline survey, % | NA | 14 (5.8, 23.5) | NA | 9 (4.1, 15.1) |
Data are site-level frequency, percent, or median of the median city (city range). Percentages and medians are weighted using respondent-driven sampling-II weights (Heckathorn, 2002).
Score of 8 or higher on AUDIT instrument (Saunders et al., 1993).
Care continuum outcomes:
There was a wide range in the prevalence of care continuum indicators across sites and key population group (Appendix Tables 6–9). For example, in the baseline survey the prevalence of individuals who were aware of their HIV status ranged from 2.4% among PWID in Kanpur to 90% among MSM in Chennai (Appendix Table 6). At baseline, the average care continuum indicators were higher in MSM than PWID, although the differences were not statistically significant (Table 2).
Table 2.
Care continuum outcomes at baseline, follow-up, and change between surveys in HIV-positive people who inject drugs and men who have sex with men in 21 cities in India.
| Baseline (2012/13) | Follow-up (2016/17) | Change between surveys | |||||||
|---|---|---|---|---|---|---|---|---|---|
|
| |||||||||
| Outcome | MSM (%) | PWID (%) | P valuea | MSM (%) | PWID (%) | P valuea | MSM (percentage points) |
PWID (percentage points) |
Difference in changeb
(95% CI) |
| Aware of status | 42.0 | 37.8 | 0.59 | 77.8 | 49.2 | 0.005 | 35.8 | 11.5 | 27.4 (11.6, 43.2) |
| Care in prior 6 months | 32.1 | 19.2 | 0.091 | 63.0 | 26.6 | 0.001 | 30.9 | 7.4 | 32.2 (16.2, 48.2) |
| Use of ART | 30.4 | 16.5 | 0.15 | 63.8 | 25.6 | 0.002 | 33.5 | 9.0 | 33.2 (14.5, 51.8) |
| Viral load suppressed | 35.3 | 23.7 | 0.079 | 56.1 | 32.4 | 0.008 | 20.8 | 8.7 | 15.4 (−0.1, 30.8) |
Percentages are pooled site-level estimates, weighted using respondent-driven sampling-II weights. MSM, men who have sex with men; PWID, people who inject drugs; CI, confidence interval (Heckathorn, 2002).
P value testing difference in care continuum indicator between MSM and PWID.
Difference in change (MSM minus PWID) was estimated in a model that adjusted for prevalence of the outcome at baseline and for assignment to intervention or control in the cluster-randomized trial.
There was also a wide range in the magnitude and direction of site-level changes in the care continuum indicators in the follow-up survey. For example, the between-survey change in awareness of status ranged from −37.4 percentage points among PWID in Aizawl to +65.6 percentage points among MSM in New Delhi (Appendix Table 6). Figure 2 shows site-level changes for each care continuum outcome in rank order, suggesting that MSM sites tended to experience more favourable changes between surveys than PWID sites.
Figure 2. Change in weighted site-level prevalence of HIV care continuum outcomes:
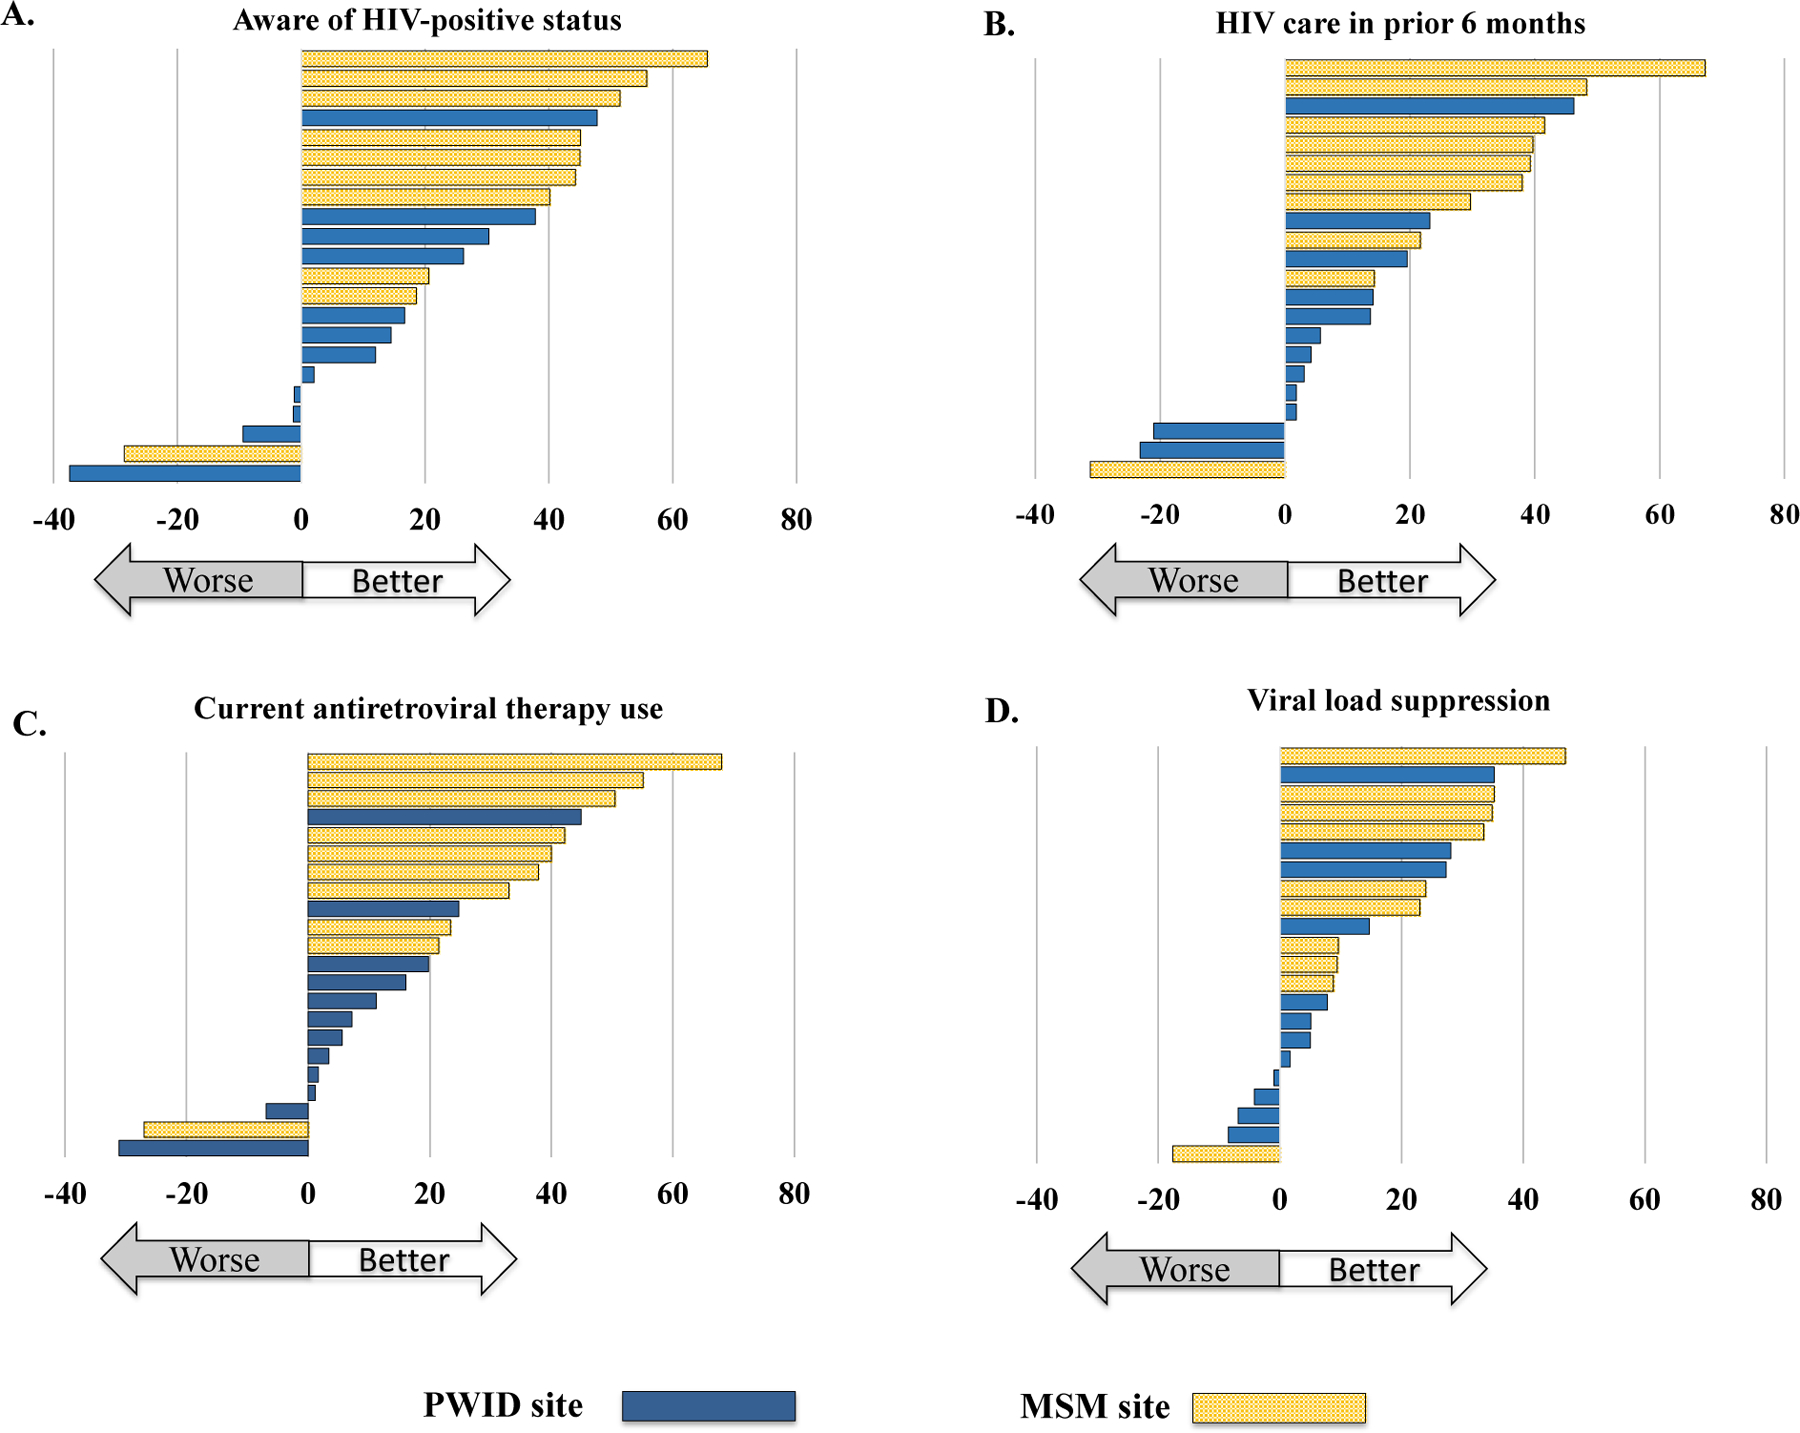
[A] Aware of status, [B] HIV care in prior 6 months, [C] using antiretroviral therapy, and [D] viral load suppression, between baseline (2012/13) and follow-up (2016/17) surveys in 22 Indian cities. Each bar represents change (follow-up minus baseline) in a city, with cities arranged in rank order (higher to lower change) in each figure. PWID, people who inject drugs; MSM, men who have sex with men.
In the follow-up survey, the average pooled site-level prevalence of all four care continuum indicators was significantly higher in MSM sites than in PWID sites (p<0.01 for all comparisons), including viral suppression: 56.1% in MSM sites and 32.4% in PWID sites (Table 2). The site-level differences in change in care continuum indicators from baseline to follow-up was significantly higher in MSM than PWID for awareness of HIV status, receipt of HIV care, and ART use, and was higher for viral suppression though this was not statistically significant (Figure 3).
Figure 3. Pooled weighted site-level prevalence of HIV care continuum indicators between baseline (2012/13) and follow-up (2016/17) surveys in 21 Indian cities:

Numbers represent respondent-driven sampling (RDS) II-weighted site-level means. PWID, people who inject drugs; MSM, men who have sex with men.
Comparisons using unweighted estimates yielded similar results (Appendix Table 10). Similarly, stratifying our analysis by control and intervention study arms did not change our findings: compared to PWID, MSM in both the control and intervention arms experienced larger increases in care continuum indicators (Appendix Table 11). If we assumed that those who were virally suppressed were also aware of their status, in care, and using ART, our findings remain the same. Likewise, inferences remain unchanged after restricting our analysis to ART eligible participants.
Discussion:
Over a 4-year period, using large, community-derived samples across 21 cities in India, we observed substantial improvements in the proportion of both MSM and PWID populations meeting HIV care continuum targets. However, improvements were significantly more pronounced among MSM, with MSM appearing to be on track to achieve UNAIDS 90-90-90 targets. By contrast, PWID still experience substantial gaps across all steps of the care continuum.
Our findings suggest that awareness of HIV status among MSM in the follow-up survey was comparable to heterosexual populations in India (Alvarez-Uria et al., 2013; Annual Report 2018–2019, 2019). However, despite discernible improvements in the first step of the care continuum, gaps in transitioning from HIV diagnosis to linkage to care, or from ART use to viral suppression, remain. Persistent gaps further downstream in the care continuum highlight the need for targeted MSM-focused interventions to improve retention in HIV services. Nevertheless, our findings suggest that MSM may achieve UNAIDS 90-90-90 targets by the end of 2020 and potentially the 95-95-95 targets by 2030.
Among PWID, the primary barrier to successful engagement in HIV care and treatment services, at baseline and follow-up, was awareness of HIV-positive status, with less than half of PWID aware of their HIV infection in the follow-up survey. We have previously demonstrated very high HIV incidence among PWID in these same cities, partly attributable to high prevalence of HIV viremia given the lack of HIV viral suppression (Lucas et al., 2015). Linkage to ART and ultimately viral suppression can only be improved if diagnosis is improved.
We found substantial between-site variability in care continuum outcomes in both populations. MSM sites located in states with a programmatic focus on reaching MSM with comprehensive HIV prevention and treatment services (e.g. STI screening, condom distribution, HIV testing and linkages to care and treatment), like New Delhi or Hyderabad, saw the greatest increase in care continuum outcomes from baseline to follow-up (Annual Report 2016–2017, 2016). Similarly, sites with high coverage of PWID-focused harm reduction and HIV services, like Imphal, saw significant improvement in care continuum outcomes.
Coverage of harm reduction programs is high in Northeastern states where the HIV epidemic among PWID is well-established. However, in Northern or Central states where the epidemics are less established, access to these services is variable (List of OST Centres). However, in Northern or Central states where the epidemics are less established, access to these services is variable as evidenced by fewer centres providing medication for opioid use disorder in these sites (List of OST Centres). For instance, Kanpur, located in Central India, did not have medication for opioid use disorder available during the trial, and correspondingly only showed a moderate increase in care continuum outcomes. Additionally, results from our study indicate that HIV-positive PWID living in Northeastern states were two times more likely to know their status than PWID living in other states. Increasing geographic coverage of harm reduction and HIV programs may potentiate improvements along the HIV care continuum for PWID.
Our study is one of a few to report temporal changes along the full range of HIV care continuum outcomes using large, community-derived samples of PWID and MSM in a LMIC. Other studies conducted in LMICs are often smaller in size, cross-sectional in nature, sample from clinic-based populations, or do not provide direct comparisons between MSM and PWID (Brown et al., 2018; Lippman et al., 2019; Rebeiro et al., 2016). One ecological analysis combining European and Central Asian countries reported similar heterogeneity in care continuum outcomes between MSM and PWID, suggesting that relative to PWID, MSM outcomes parallel those at the national level while PWID experience poorer treatment and viral suppression (Brown et al., 2018). Analogously, a multi-site study conducted across several Latin American countries indicated that PWID experience lower retention in treatment compared to MSM (Rebeiro et al., 2016).
Several factors may explain heterogeneity between MSM and PWID populations in India. First, differences in outcomes over time may reflect differential availability of PWID- and MSM-focused HIV services. MSM may benefit more from services targeted towards the general population, such as HIV testing, condom distribution, STD care and linkage to ART services, while PWID may require additional harm reduction services such as medication for opioid use disorder and syringe services. During the time of our study, the National AIDS Control Programme renewed its focus in addressing HIV prevention and treatment gaps among key populations (Annual Report 2012–2013, 2013). These data suggest that these additional resources may have improved care continuum outcomes among MSM, while PWID may require further intervention.
Psychosocial factors such as stigma and depression have been previously correlated with delays in seeking care after testing HIV-positive in heterosexual Indian populations and may also partially explain the differences in findings (Piña et al., 2018; Steward et al., 2013). Smaller studies of PWID in India have indicated that fear of rejection by family and negative interactions with healthcare providers add to treatment delays in this population, though similar issues exist for MSM (Chakrapani et al., 2014). We have also previously demonstrated higher levels of depression and hazardous alcohol use in this population – depression was associated with decreased levels of viral suppression (Prabhu et al., 2020).
Active drug use has also been associated with treatment delays, sub-optimal adherence, and lower levels of viral suppression among PWID globally (Chakrapani et al., 2014; Prabhu et al., 2020). In our study, over two-thirds of PWID reported injecting drugs in the prior six months, while over 75% reported never using medication for opioid use disorder services or using them more than six months prior (Solomon et al., 2019). This highlights the added burdens associated with injection drug use faced by PWID in achieving successful retention along the HIV care continuum.
This study has several limitations. Despite our large and geographically diverse samples, study sites may not be representative of all PWID and MSM in India. Specifically, sites were selected purposefully based on site-level PWID HIV prevalence and injection drug use for PWID sites, and general HIV prevalence data for MSM sites. Nevertheless, we used respondent driven sampling, a probabilistic sampling method that is appropriate for historically ‘hidden’ populations, to derive community-level estimates of engagement in HIV care and treatment programs (Heckathorn, 1997, 2002). Second, apart from New Delhi, MSM and PWID were recruited from different cities. As PWID trial sites were concentrated in the north of the country while MSM sites were concentrated in the south, we also cannot rule out the possibility that city or regional heterogeneity in the HIV care continuum account for the observed differences between MSM and PWID.
Data from this study are derived from a cluster randomized trial, as opposed to routine surveillance efforts. It is possible that the observed differences in MSM and PWID populations are associated with the parent trial, and do not represent objective changes in continuum care outcomes; however, this is unlikely. First, in the parent trial, we showed that randomization to intervention versus control was not associated with improved HIV care continuum indicators (Solomon et al., 2019). Second, in primary comparisons, we controlled for study arm assignment and baseline prevalence. Third, after stratifying our analyses by intervention arm, the relative MSM-PWID differences remained.
Finally, our findings may be subject to reporting bias. We were limited to using self-reported indicators to ascertain awareness of status, engagement in care, and ART use, while HIV serostatus and viral load were determined using laboratory testing. Changes in how participants self-reported care continuum indicators, between baseline and follow-up surveys, may lead to measurement error. However, this is unlikely given that improvements in self-reported measurers over time paralleled improvements in viral load suppression from baseline to follow-up.
Other exogenous factors, like changes in access to harm reduction services or migration, may further affect our findings. However, similarities in demographic, healthcare access and risk behavioural characteristics, comparing baseline and follow-up surveys for each key population suggest that this is unlikely (Solomon et al., 2019). Moreover, we would expect temporal factors (e.g., migration) to affect both key populations similarly. Nevertheless, improvements in the HIV care continuum were more modest in PWID then MSM. Finally, our findings were robust to several sensitivity analyses accounting for potential non-disclosure of HIV serostatus and changes in national treatment guidelines.
We compared temporal changes in the HIV care continuum between MSM and PWID, across multiple cities in a LMIC. Our findings indicate favourable changes in both these groups, although substantially larger improvements among MSM compared with PWID. To meet UNAIDS HIV elimination targets, increased coverage of focused, key population-specific interventions may be necessary to address specific harm reduction, HIV prevention and ART needs of MSM and PWID separately. Moreover, routine key population surveillance efforts are necessary to track progress towards elimination goals and identify gaps in HIV engagement in these hard-to-reach populations.
Supplementary Material
Acknowledgements:
NPM and GL were responsible for drafting the manuscript. SSS, SHM, and GL were responsible for the design of the study, data collection, and interpretation of data. NPM and AM were responsible for data analysis. AS, CV, and MK led data collection. DC was involved in the design of the study and contributed to manuscript development. All authors read and approved the final manuscript. We thank the National AIDS Control Organization (India) and all our partner non-governmental organizations across India who were instrumental in facilitating the recruitment of the study sample. We are especially thankful to our participants, without whom this research would not be possible.
Funding details:
This work was supported by the National Institutes of Health (NIH) (R01DA032059, R01MH089266, K24DA035684, T32AI102623, F31DA044046) and by the Johns Hopkins University Center for AIDS Research (P30AI094189). Additional support was provided by the Division of Intramural Research, National Institute of Allergy and Infectious Diseases, NIH, and by the Elton John AIDS Foundation. The content is solely the responsibility of the authors and does not necessarily represent the official views of the funding organizations.
Footnotes
Declaration of interest statement: The authors have no conflicts of interest to declare.
Data availability statement:
The data that support the findings of this study are available from the study principal investigators, SHM and GL, upon reasonable request.
References:
- 90-90-90: treatment for all | UNAIDS ((2018). http://www.unaids.org/en/resources/909090
- Alvarez-Uria G, Pakam R, Midde M, & Naik PK (2013). Entry, retention, and virological suppression in an HIV cohort study in India: Description of the cascade of care and implications for reducing HIV-related mortality in low- and middle-income countries. Interdisciplinary perspectives on infectious diseases 10.1155/2013/384805 [DOI] [PMC free article] [PubMed] [Google Scholar]
- Annual Report 2012–2013 ((2013). http://www.naco.gov.in
- Annual Report 2016–2017 ((2016). http://www.naco.gov.in
- Annual Report 2018–2019 ((2019). http://www.naco.gov.in
- Arora P, Kumar R, Bhattacharya M, Nagelkerke NJD, & Jha P (2008). Trends in HIV incidence in India from 2000 to 2007. The Lancet, 372(9635), 289–290. 10.1016/S0140-6736(08)61105-8 [DOI] [PubMed] [Google Scholar]
- Brown AE, Attawell K, Hales D, Rice BD, Pharris A, Supervie V, Van Beckhoven D, Delpech VC, An der Heiden M, Marcus U, Maly M, & Noori T (2018). Monitoring the HIV continuum of care in key populations across Europe and Central Asia. HIV Medicine, 19(7), 431–439. 10.1111/hiv.12603 [DOI] [PubMed] [Google Scholar]
- Chakrapani V, Velayudham J, Shunmugam M, Newman PA, & Dubrow R (2014). Barriers to antiretroviral treatment access for injecting drug users living with HIV in Chennai, South India. AIDS Care - Psychological and Socio-Medical Aspects of AIDS/HIV, 26(7), 835–841. 10.1080/09540121.2013.861573 [DOI] [PMC free article] [PubMed] [Google Scholar]
- Details of ICTC Centres (http://www.naco.gov.in/NACO/Directory_of_Services/Details_of_ICTC_Centres_/
- Heckathorn DD (1997). Respondent-Driven Sampling: A New Approach to the Study of Hidden Populations. Social Problems, 44(2), 174–199. 10.2307/3096941 [DOI] [Google Scholar]
- Heckathorn DD (2002). Respondent-Driven Sampling II: Deriving Valid Population Estimates from Chain-Referral Samples of Hidden Populations. Social Problems, 49(1), 11–34. 10.1525/sp.2002.49.1.11 [DOI] [Google Scholar]
- Lippman SA, El Ayadi AM, Grignon JS, Puren A, Liegler T, Venter WDF, Ratlhagana MJ, Morris JL, Naidoo E, Agnew E, Barnhart S, & Shade SB (2019). Improvements in the South African HIV care cascade: findings on 90-90-90 targets from successive population-representative surveys in North West Province. Journal of the International AIDS Society, 22(6), e25295–e25295. 10.1002/jia2.25295 [DOI] [PMC free article] [PubMed] [Google Scholar]
- List of ART Centres (http://www.naco.gov.in/living-hivaids/list-art-center
- List of OST Centres (http://naco.gov.in/sites/default/files/list_of_ost_centres_as_of_31st_july_2016.xlsx_.pdf
- Lucas GM, Solomon SS, Srikrishnan AK, Agrawal A, Iqbal S, Laeyendecker O, McFall AM, Kumar MS, Ogburn EL, Celentano DD, Solomon S, & Mehta SH (2015). High HIV burden among people who inject drugs in 15 Indian cities. AIDS, 29(5), 619–619. 10.1097/QAD.0000000000000592 [DOI] [PMC free article] [PubMed] [Google Scholar]
- Marzinke MA, Clarke W, Wang L, Cummings V, Liu TY, Piwowar-Manning E, Breaud A, Griffith S, Buchbinder S, Shoptaw S, Del Rio C, Magnus M, Mannheimer S, Fields SD, Mayer KH, Wheeler DP, Koblin BA, Eshleman SH, & Fogel JM (2014). Nondisclosure of HIV status in a clinical trial setting: Antiretroviral drug screening can help distinguish between newly diagnosed and previously diagnosed HIV infection. Clinical Infectious Diseases, 58(1), 117–120. 10.1093/cid/cit672 [DOI] [PMC free article] [PubMed] [Google Scholar]
- Mehta SH, Lucas GM, Solomon S, Srikrishnan AK, McFall AM, Dhingra N, Nandagopal P, Kumar MS, Celentano DD, & Solomon SS (2015). HIV care continuum among men who have sex with men and persons who inject drugs in India: Barriers to successful engagement. Clinical Infectious Diseases, 61(11), 1732–1741. 10.1093/cid/civ669 [DOI] [PMC free article] [PubMed] [Google Scholar]
- Piña C, Dange A, Rawat S, Jadhav U, Arnsten JH, Chhabra R, & Patel VV (2018). Antiretroviral treatment uptake and adherence among men who have sex with men and transgender women with HIV in Mumbai, India: a cross-sectional study. The Journal of the Association of Nurses in AIDS Care: JANAC, 29(2), 310. [DOI] [PMC free article] [PubMed] [Google Scholar]
- Prabhu S, McFall AM, Mehta SH, Srikrishnan AK, Kumar MS, Anand S, Shanmugam S, Celentano DD, Lucas GM, & Solomon SS (2020). Psychosocial barriers to viral suppression in a community-based sample of human immunodeficiency virus-infected men who have sex with men and people who inject drugs in India. Clinical Infectious Diseases, 70(2), 304–313. 10.1093/cid/ciz175 [DOI] [PMC free article] [PubMed] [Google Scholar]
- Rebeiro PF, Cesar C, Shepherd BE, De Boni RB, Cortés CP, Rodriguez F, Belaunzarán-Zamudio P, Pape JW, Padgett D, Hoces D, McGowan CC, & Cahn P (2016). Assessing the HIV Care Continuum in Latin America: Progress in clinical retention, cART use and viral suppression. Journal of the International AIDS Society, 19(1), 20636–20636. 10.7448/IAS.19.1.20636 [DOI] [PMC free article] [PubMed] [Google Scholar]
- Risher K, Mayer K, & Beyrer C (2015). The HIV treatment cascade in men who have sex with men, people who inject drugs and sex workers. Current Opinion in HIV and AIDS, 10(6), 420–420. 10.1002/aur.1474.Replication [DOI] [PMC free article] [PubMed] [Google Scholar]
- Salganik MJ, & Heckathorn DD (2004). Sampling and Estimation in Hidden Populations Using Respondent-Driven Sampling. Sociological Methodology, 34(1), 193–240. 10.1111/j.0081-1750.2004.00152.x [DOI] [Google Scholar]
- Saunders JB, Aasland OG, Babor TF, de La Fuente JR, & Grant M (1993). Development of the Alcohol Use Disorders Identification Test (AUDIT): WHO Collaborative Project on Early Detection of Persons with Harmful Alcohol Consumption‐II. Addiction, 88(6), 791–804. 10.1111/j.1360-0443.1993.tb02093.x [DOI] [PubMed] [Google Scholar]
- Solomon SS, Lucas GM, Celentano DD, McFall AM, Ogburn E, Moulton LH, Srikrishnan AK, Kumar MS, Anand S, Solomon S, & Mehta SH (2016). Design of the Indian NCA study (Indian national collaboration on AIDS): a cluster randomized trial to evaluate the effectiveness of integrated care centers to improve HIV outcomes among men who have sex with men and persons who inject drugs in India. BMC Health Services Research, 16(1), 652–652. 10.1186/s12913-016-1905-5 [DOI] [PMC free article] [PubMed] [Google Scholar]
- Solomon SS, Mehta SH, McFall AM, Srikrishnan AK, Saravanan S, Laeyendecker O, Balakrishnan P, Celentano DD, Solomon S, & Lucas GM (2016). Community viral load, antiretroviral therapy coverage, and HIV incidence in India: a cross-sectional, comparative study. The Lancet HIV, 3(4), e183–e190. 10.1016/S2352-3018(16)00019-9 [DOI] [PMC free article] [PubMed] [Google Scholar]
- Solomon SS, Solomon S, McFall AM, Srikrishnan AK, Anand S, Verma V, Vasudevan CK, Balakrishnan P, Ogburn EL, Moulton LH, Kumar MS, Sachdeva KS, Laeyendecker O, Celentano DD, Lucas GM, & Mehta SH (2019). Integrated HIV testing, prevention, and treatment intervention for key populations in India: a cluster-randomised trial. The Lancet HIV, 6(5), e283–e296. 10.1016/S2352-3018(19)30034-7 [DOI] [PMC free article] [PubMed] [Google Scholar]
- Steward WT, Bharat S, Ramakrishna J, Heylen E, & Ekstrand ML (2013). Stigma is associated with delays in seeking care among HIV-infected people in India. Journal of the International Association of Providers of AIDS Care, 12(2), 103–109. 10.1177/1545109711432315 [DOI] [PMC free article] [PubMed] [Google Scholar]
- UNAIDS Data 2019 ((2019). https://www.unaids.org/sites/default/files/media_asset/2019-UNAIDS-data_en.pdf
- Understanding Fast-Track Targets. Accelerating action to end the AIDS epidemic by 2030 (No. JC 2743 (2015). https://www.unaids.org/sites/default/files/media_asset/201506_JC2743_Understanding_FastTrack_en.pdf
Associated Data
This section collects any data citations, data availability statements, or supplementary materials included in this article.
Supplementary Materials
Data Availability Statement
The data that support the findings of this study are available from the study principal investigators, SHM and GL, upon reasonable request.