Abstract
Bubble point pressures of six binary mixtures at two compositions each have been measured utilizing a static method. The performance of the apparatus was characterized from bubble point measurements of R32 + R125 for which 19 literature studies are available for comparison. The mixtures studied were as follow: R1234yf + R134a, R134a + R1234ze (E), R1234yf + R1234ze (E), R125 + R1234yf, R1234ze (E) + R227ea and R1234yf + R152a. For each mixture measurements were conducted from 270 K to 360 K or to within approximately 10 K of the critical temperature of the pure component with the lower critical temperature. A total of 196 bubble point pressures are reported with combined expanded uncertainties (k = 2) ranging from 0.1% – 0.6%. The measured data are graphically compared to available literature data.
Keywords: Bubble point pressure, Refrigerants, Vapor-liquid equilibrium
1. Introduction
In recent years, there has been an effort to find a replacement for pure R134a with a lower Global Warming Potential (GWP) while maintaining some of its attributes such as non-flammability and low toxicity. To reduce its environmental impacts, the U.S. military would like to replace R134a with a non-flammable, low GWP refrigerant in its environmental control units. A recent study by Bell et al.1 examined binary, ternary and four-component blends of existing refrigerants that might meet the military criteria. In this work, bubble point pressures of six binary mixtures of refrigerants identified as potential replacements for pure R134a1 have been measured. The mixtures were R1234yf + R134a, R134a + R1234ze (E), R1234yf + R1234ze (E), R125 + R1234yf, R1234ze (E) + R227ea and R1234yf + R152a. (The chemical names of these refrigerants are given in Table 1.) Two compositions of each of the mixtures were measured over the temperature range 270 K to 360 K.
Table 1.
Manufacturers of pure fluids used in the preparation of mixtures for this work.
| Chemical | CAS # | Manufacturer(s) | Purity [%] |
|---|---|---|---|
| 2,3,3,3 Tetrafluoropropene (R1234yf) | 29118-24-9 | Chemourss Honeywell |
99.9 99.99 |
| trans-1,3,3,3-Tetrafluoroprop-1-ene (R1234ze (E)) | 29118-24-9 | Honeywell | 99.97 |
| 1,1,1,2-Tetrafluoroethane (R134a) | 811-97-2 | Dupont | 99.9 |
| 1,1-Difluoroethane (152a) | 75-37-6 | Chemours | 99.9355 |
| Pentafluoroethane (R125) | 354-33-6 | Scott Specialty Gas | 99.99 |
| 1,1,1,2,3,3,3-Heptafluoropropane (R227ea) | 431-89-0 | Honeywell | 99.97 |
Accurate thermodynamic and transport property information is critical in the design of refrigeration systems. Two major components of the typical refrigeration system are the evaporator and condenser to boil and condense the fluid, respectively, at the appropriate stage in the refrigeration cycle. Bubble point data, more broadly vapor-liquid equilibrium data, are needed to establish the temperature and pressure at which the evaporator and condenser operate.2 Properties such as the density and viscosity influence the pressure drop3 throughout the cycle which determines how much work the compressor must do convert the vapor refrigerant back to the liquid phase. While not explicitly important, fitting the sound speed to an equation of state (EoS) is expected to provide more accurate estimations for derivative properties4 such as the heat capacity, thermal expansion co-efficient, and isothermal compressibility. In particular, the heat capacity and thermal conductivity are needed to determine the refrigeration systems overall heat transfer co-efficient.3
The measurements presented here are part of a broader scope of work performed at the National Institute of Standards and Technology (NIST) in Boulder, CO. The work includes bubble point, density, speed of sound, thermal conductivity, and viscosity measurements of binary refrigerant mixtures. The work was undertaken to provide a comprehensive set of high-accuracy experimental data to develop more accurate EoS for binary refrigerant mixtures. In future work, vapor-liquid equilibrium, density, and sound speed data will be fit simultaneously to develop new EoS. Further, the new EoS, which will be included in future versions of REFPROP5, will provide calculations that more accurately represent the experimental data. These more accurate predictive capabilities will then facilitate the design of mechanical systems which more efficiently use refrigerant blends like those studied in this work.
2. Mixture Preparation
The mixtures were gravimetrically prepared with pure refrigerants obtained from commercial sources. Table 1 lists the refrigerants, CAS number, manufacturer, and manufacturers stated purity. An insufficient amount of R1234yf was available to prepare all 8 refrigerant mixtures containing R1234yf. Therefore, two sources of R1234yf are listed in Table 1. The R125 + R1234yf (x1 = 0.6635) and both R1234yf + R152a mixtures were prepared using R1234yf manufactured by Honeywell while the remaining five mixtures were prepared with R1234yf manufactured by Chemours‡. The manufacturer-stated purities of all refrigerants used were 99.9 % or higher. Additionally, analyses of the pure fluids were performed in our laboratory by both gas chromatography (GC) and single quadrupole (SQ) mass spectrometry (MS). GC-MS screened for impurities with very low abundance and SQ-MS for any impurities with very similar retention times to the refrigerant being tested. Spectral peaks were interpreted with guidance from the NIST/EPA/NIH Mass Spectral Database6 and the CRC Handbook of Basic Tables for Chemical Analysis.7 The analyses indicated that all of the samples had impurities no greater than ± 0.1 % based on the instruments limit of detection.
The refrigerants, as received from the manufacturer, were transferred to evacuated 2.25 liter stainless steel cylinders referred to as feed bottles hereafter. The purity analyses done on the refrigerant samples was not capable of detecting air impurities. As such, a freeze/pump/thaw technique was performed to degas the samples. The freeze/pump/thaw technique first involves freezing the sample with liquid nitrogen, then opening the cylinder to vacuum to remove volatile impurities. After evacuation, the sample was heated (in the closed stainless steel cylinder) to drive the greatest possible amount of the remaining volatile impurities into the vapor space. For a given feed bottle, the entire cycle (freeze/pump/thaw) was repeated until a negligible pressure rise was observed when opening the frozen sample to the vacuum or a minimum of three times if no pressure rise was detected.
The degassed pure refrigerants prepared in the feed bottles were used to make the binary mixtures studied in this work. The mixtures were prepared in sealed 300 mL stainless steel cylinders. To best cover the composition range of each mixture (with only two compositions), samples were prepared with the goal of component (1) mol fractions of approximately 0.33 and 0.66. It can be difficult to finely adjust the feed rate of each component during sample preparation and thus component (1) mol fractions of 0.3 – 0.4 on the low end and 0.6 – 0.7 on the high end were considered acceptable. The uncertainty in sample compositions is described in detail in the Uncertainty section of this work.
Figure 1 is a schematic of the mixing manifold used to prepare mixture samples. First, the empty cylinder and the component (1) feed bottle were connected to the mixing manifold, and the entire system was evacuated for at least 5 hours. While connected to the mixing manifold the empty bottle was cooled in a Dewar of liquid nitrogen for approximately 30 minutes. The empty sample bottle was then closed, taken out of the liquid nitrogen Dewar and secured to a ring stand on the balance. The manifold was then isolated from vacuum and the feed bottle was opened pressurizing the manifold. The empty sample bottle was then opened to add an approximate amount of component (1) by observing the increase in mass using a balance with a resolution of 0.1 g. After the addition of component (1), the sample bottle was closed, then removed from the mixing manifold and degassed using the same procedure described for the feed bottles. The sample bottle was then placed along-side a high-accuracy balance, precise to 0.0001 g, housed in a plexiglass shield and allowed to thermally equilibrate (to ambient temperature). Utilizing the double-substitution weighing design of Harris and Torres,8 as described in Outcalt and Lemmon9, the sample bottle was then weighed four times to accurately determine the amount of component (1) that had been added. The sample bottle was then reconnected to the mixing manifold for the addition of component (2). Component (2) was added the same way as component (1) with the exception that the sample bottle was immersed in the Dewar of liquid nitrogen for 1 – 2 hours to ensure that component (1) was frozen prior to the addition of component (2). Again, the lower accuracy balance was used to add the approximate amount of component (2) necessary to reach the desired composition. After the addition of component (2), the sample bottle was again weighed with the high-accuracy balance to determine the mass of component (2) in the mixture. Mixtures were prepared with the goal of filling the sample cylinder such that it would be full of liquid at room temperature, but without over-pressurizing the cylinder. Maximizing the liquid sample volume minimizes the loading uncertainty which is explained in the Uncertainty section of this work.
Figure 1.
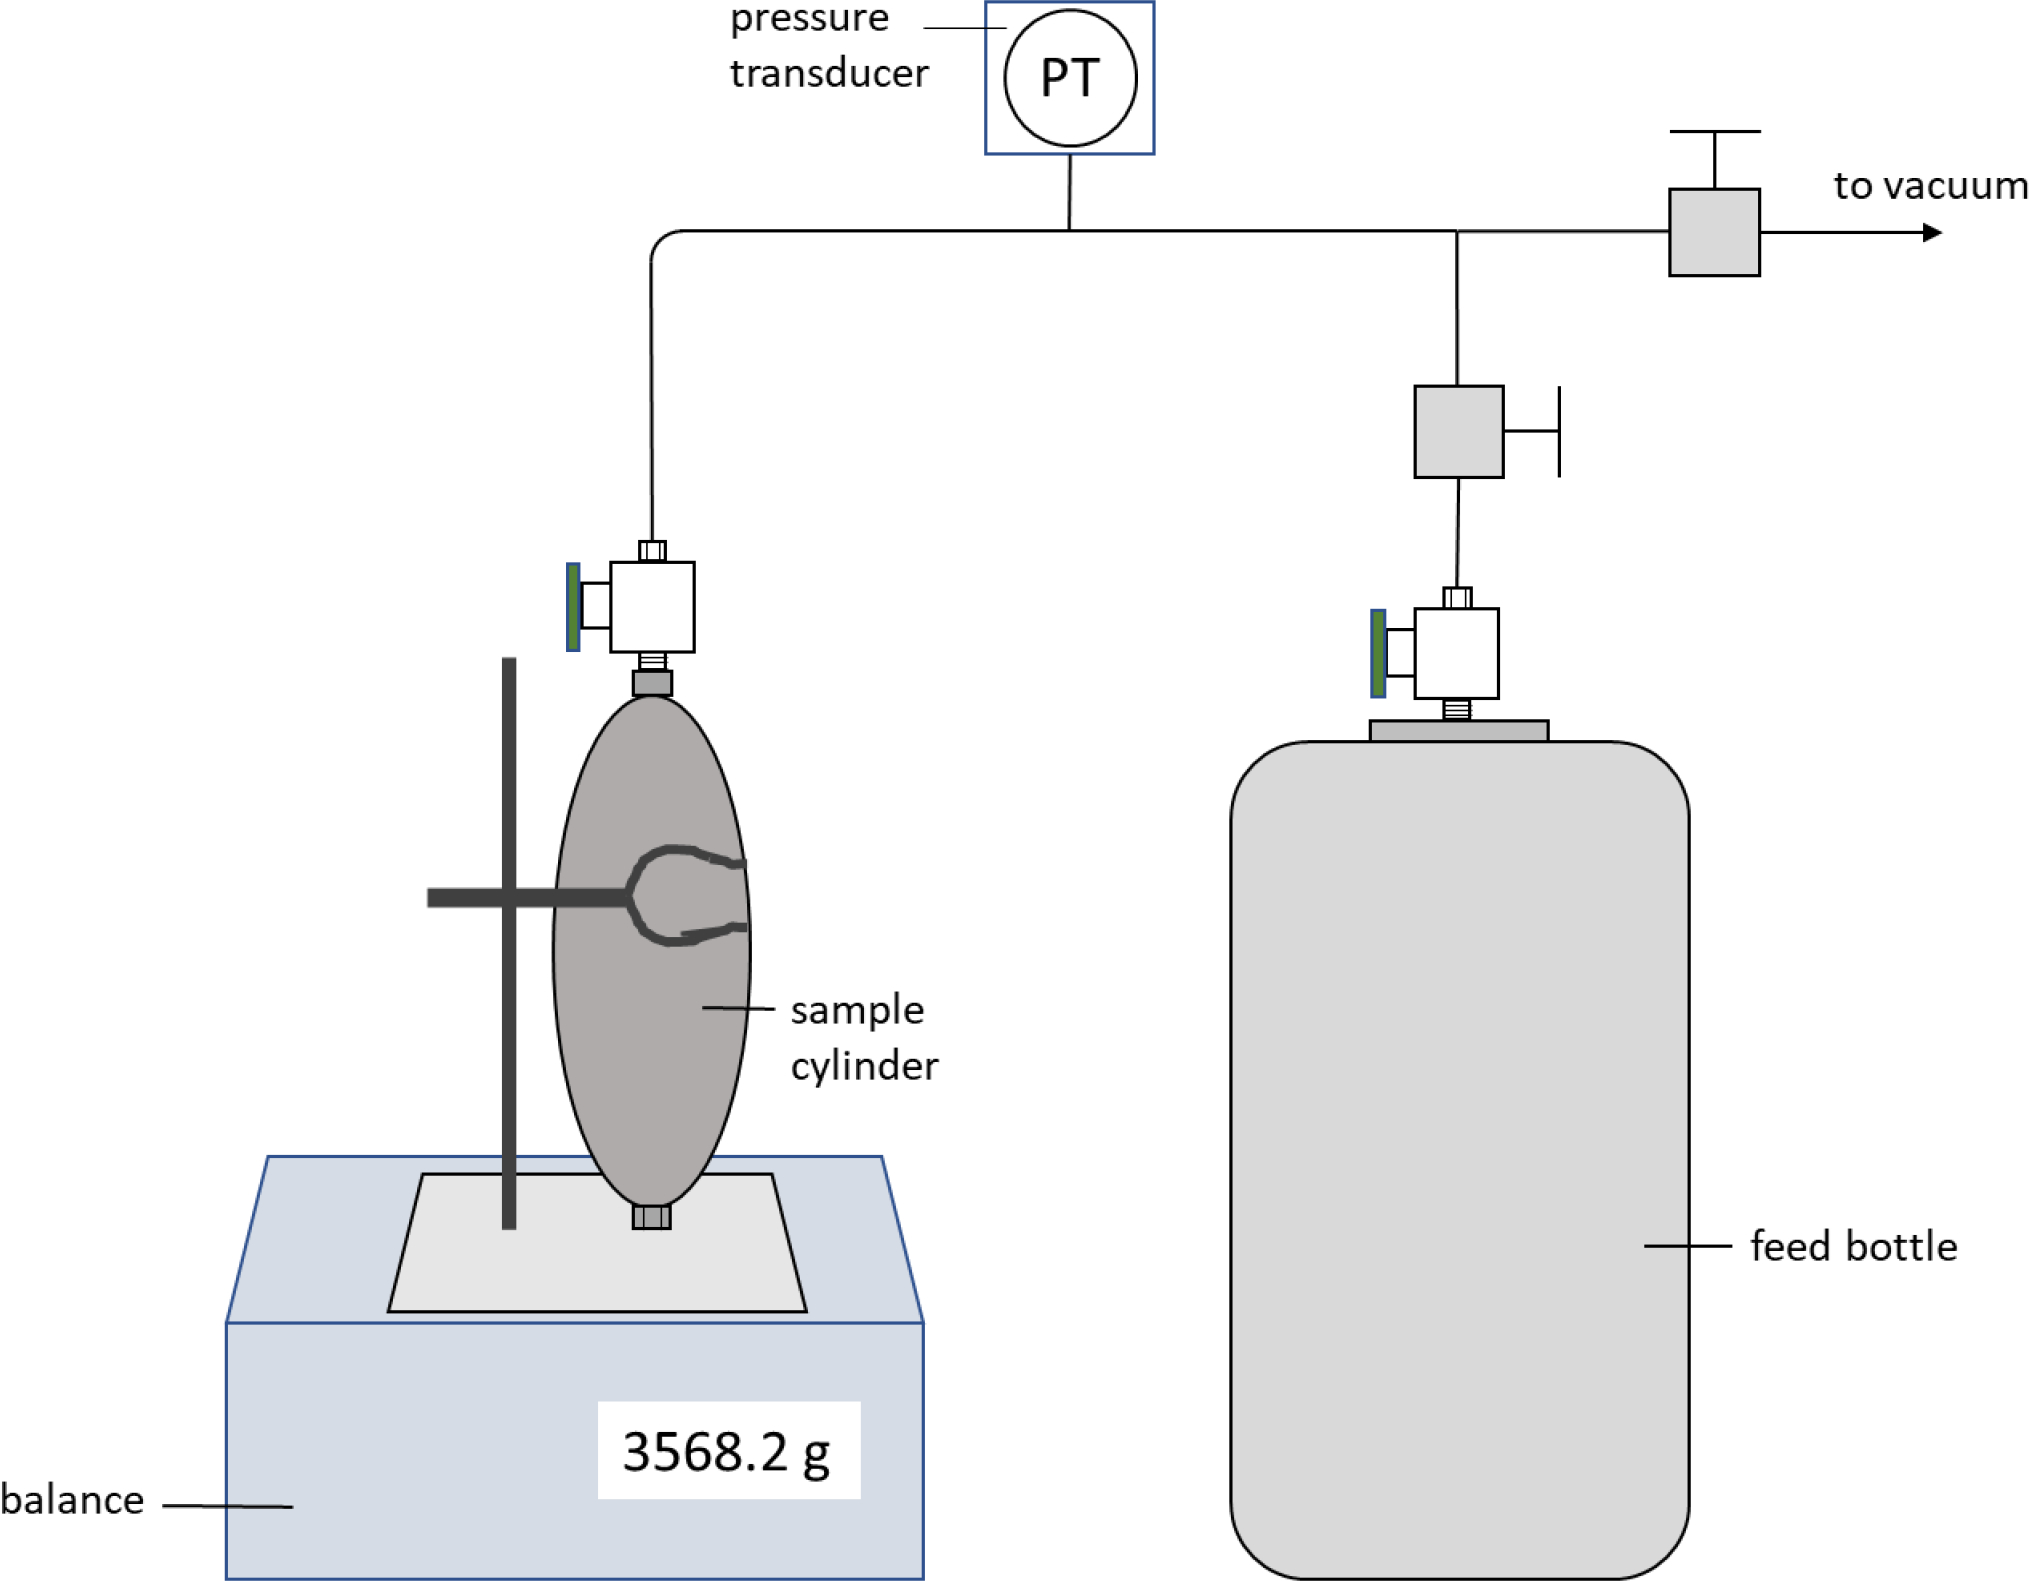
Schematic of mixing manifold used to prepare binary mixtures studied this work.
3. Experimental
3.1. Method of measurement
The apparatus utilized in this work was designed acknowledging that highly accurate, non-invasive mixture phase equilibria measurements are extremely difficult while invasive measurements (i.e., withdrawing sample for composition analysis) have their own inherent complications and associated uncertainties. In general, the liquid and vapor phase compositions are typically the greatest source of uncertainty encountered in phase equilibria measurements. The methodology of this work is to very accurately measure the prepared sample bulk mixture composition, temperature (T) and pressure (p) and to perform the bubble point measurements such that the following assumptions can be considered true: (1) The liquid composition (x1) in the measurement cell is very close to the bulk composition of the mixture in the sample bottle, and (2) by loading and maintaining the liquid level of the cell such that only a very small vapor space remains (the bubble), the composition of the liquid in the system remains equal to the bulk composition of the prepared mixture, and thus the pressure of the vapor phase is the bubble point pressure of that composition at a given temperature. This method of measurement is most successful with mixtures of components of similar normal boiling points as are the binary mixtures in this work. Similar boiling points of mixture components and preparing the samples such that the bottles are full of liquid help ensure that the liquid composition loaded into the measuring cell is very close to the bulk composition of the prepared sample.
3.2. Apparatus description
Figure 2 is a schematic of the bubble point instrument used in this work. The operating range of the apparatus is 270 K to 360 K, to pressures of 7 MPa. The heart of the instrument is a cylindrical stainless steel cell with opposing sapphire windows on each end for visual access of the cell contents. The cell is encased in a block of aluminum and has an internal volume of approximately 30 ml. There are two ports at the top of the cell and one at the bottom. The valves closest to those ports are located inside the aluminum block to limit the volume of sample outside of the temperature-controlled environment. The additional volume of the system inside the aluminum block (excluding the equilibrium cell) is estimated to be no greater than 2.5 ml.
Figure 2.
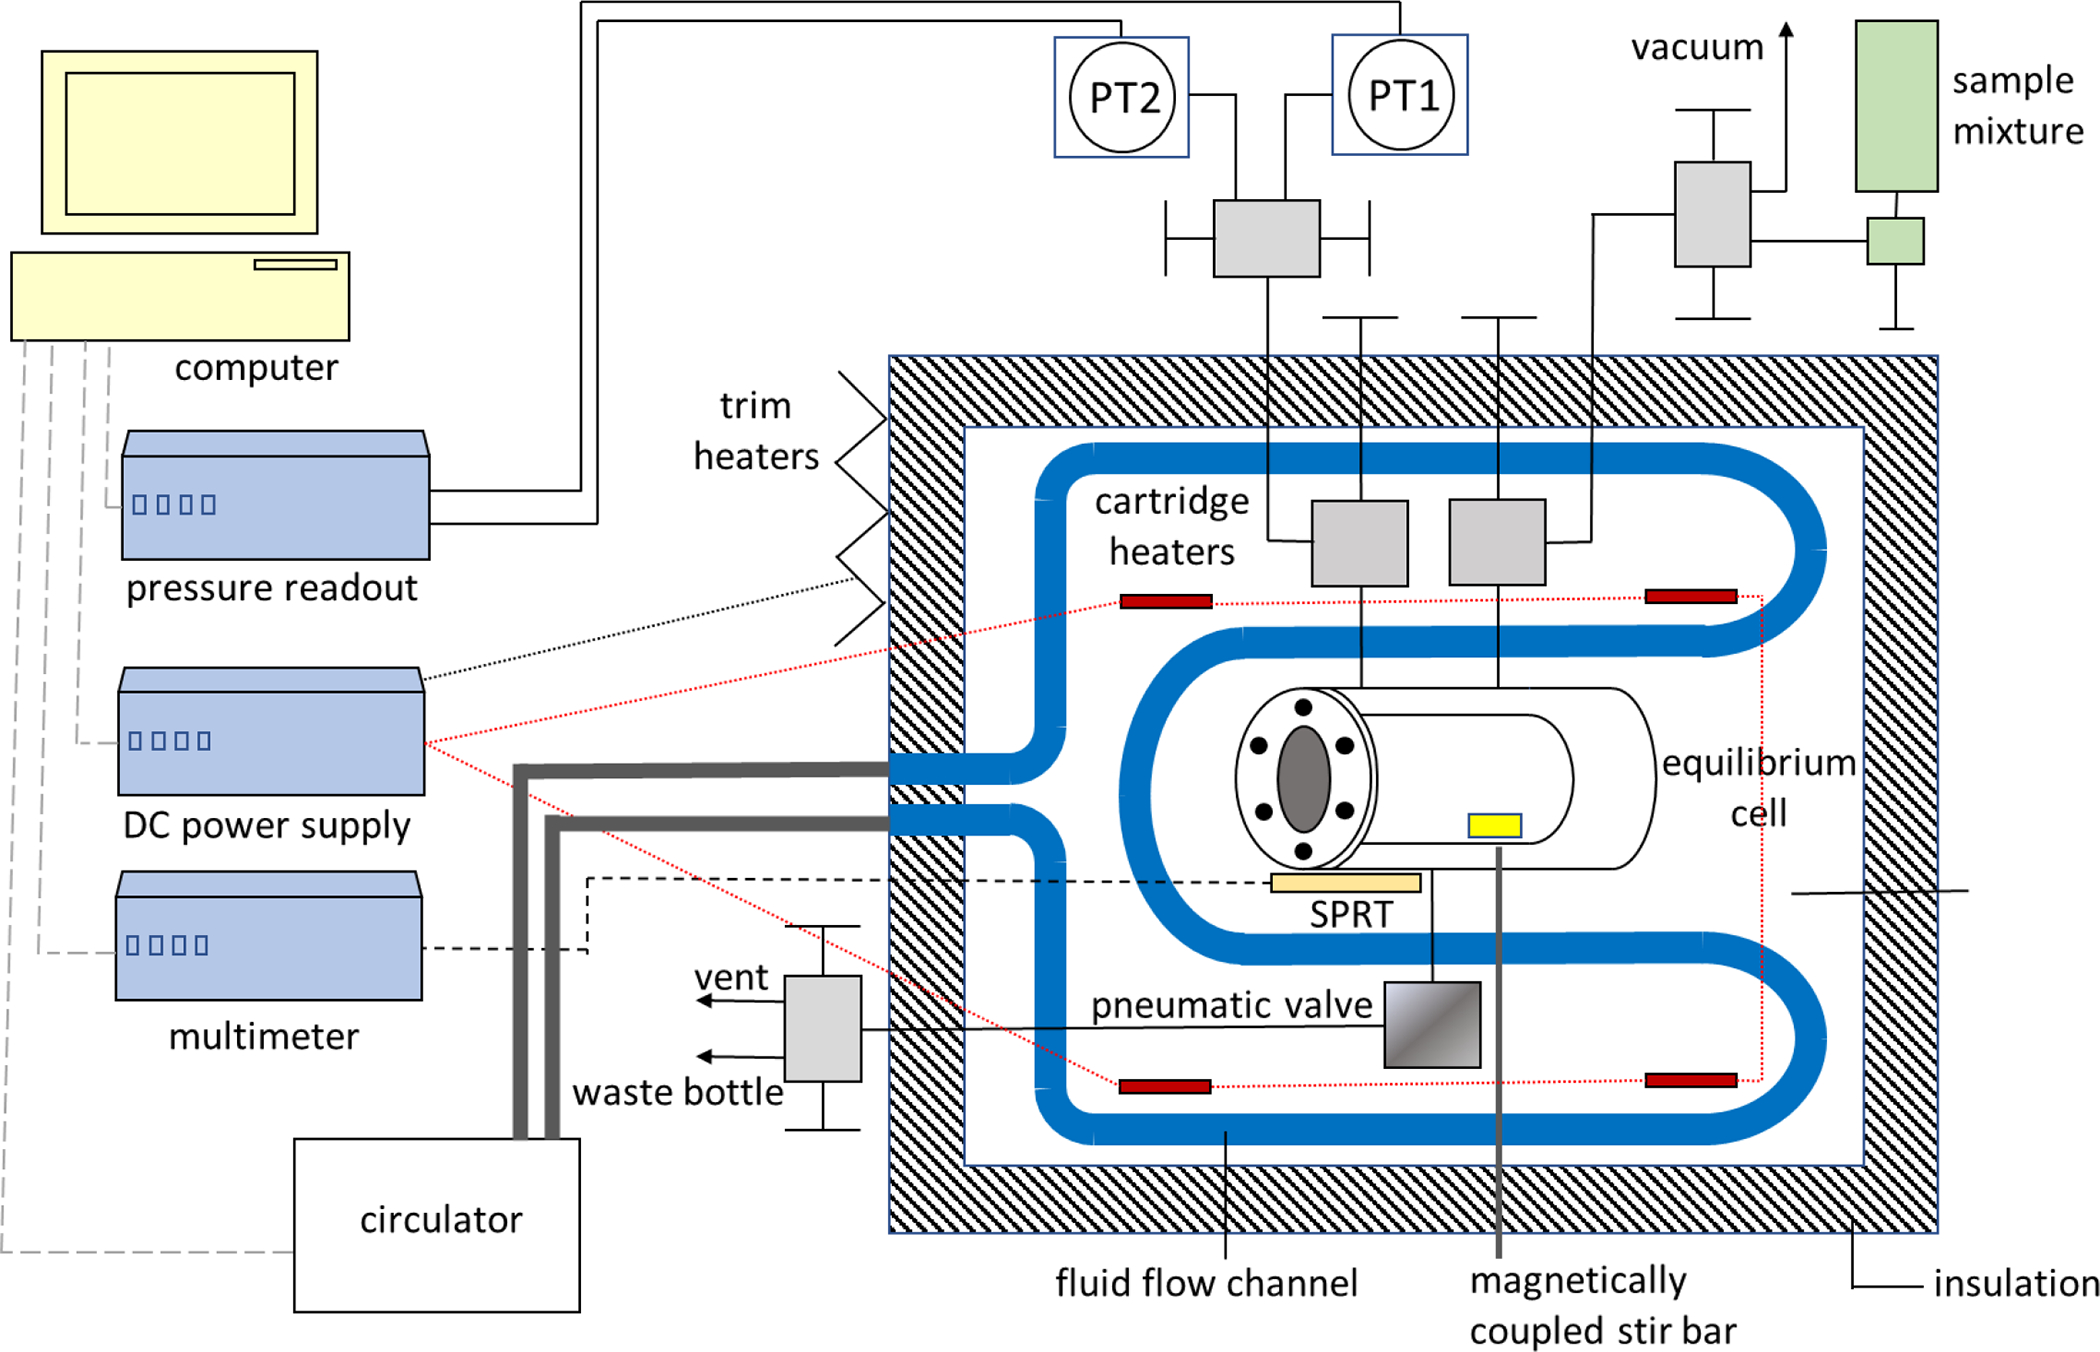
Schematic of the apparatus used to make the bubble point measurements.
The instrument is similar to that described in Outcalt and Lemmon,9 but incorporates several improvements relative to the previous design. These improvements include a thermostat that uses cartridge heaters and not the circulator as the main heating source, a magnetically-coupled stir bar inside the cell to ensure no composition gradients exist in the liquid-phase of the mixture under test, and a computer-controlled pneumatic valve to more precisely regulate venting of the liquid phase. Other additions to the instrument are a second pressure transducer for more accurate pressure measurements below 0.7 MPa, and a differential thermocouple (not shown) located between the equilibrium cell and pneumatic valve to monitor potentially problematic temperature gradients within the system.
The temperature is measured with a standard platinum resistance thermometer (SPRT) situated in a thermowell along the side of the equilibrium cell. The aluminum block features internal flow channels for the circulation of cooling fluid and wells containing cartridge heaters. Trim heaters are adhered to the exterior of the block, and the block is surrounded by 5 cm of insulation. Temperature control of the system is fully automated incorporating a PID routine developed by Hust et al.10 Once the system has reached thermal equilibrium at a given temperature set point, the stability of the temperature is typically ± 5 mK.
The bubble point pressure is measured with one of two oscillating quartz crystal pressure transducers (PT1 and PT2 in Figure 2) connected to the system through one of the ports at the top of the cell. The range of the first transducer is to 0.7 MPa and the second to 7 MPa. The manufacturers’ stated accuracy of the pressure transducers is 0.01% of full range. Hence, to reduce the uncertainty in our measurements the lower range transducer is used for bubble point pressures below 0.7 MPa, then isolated from the system for higher pressure measurements, where the high range transducer is used. Each transducer is separately housed in its own temperature-controlled block, which is maintained at 313 K.
The second port at the top of the cell connects to valving that facilitates both filling and evacuating the system. The port at the bottom of the cell connects to a computer controlled, normally closed, pneumatic valve. During measurements, as the temperature of the system is increased, the bubble in the top of the cell disappears due to expansion of the sample. The pneumatic valve is used to remove small amounts of liquid from the cell to maintain a small bubble. Upon completion of a set of measurements, the pneumatic valve is opened so that the cell contents can be cryo-pumped into a waste bottle.
3.3. Measurement Procedure
To facilitate loading the liquid phase of the mixture sample, the sample bottle is connected to the system in an inverted position and secured above the insulated aluminum block. Prior to loading a sample, the system is evacuated and then cooled to approximately 270 K, and the pressure reading under vacuum is recorded. Reported pressures are adjusted to reflect any offset of the pressure transducers from zero. The sample is quickly loaded into the system until only a small vapor space remains in the equilibrium cell.
A measurement series typically included points from 270 K to 360 K in 10 K increments, excepting those systems containing a component with a critical point of less than 360 K. In those instances, points were sometimes measured in 5 K increments and the maximum temperature measured was approximately 10 K below the critical temperature of the component with the lower critical temperature. During measurements, as the temperature was increased to achieve the next setpoint, the contents of the cell were stirred with the magnetically-coupled stir bar and the presence of the bubble was monitored. If the bubble disappeared, a small amount of liquid was vented from the bottom of the cell via the computer controlled pneumatic valve until a bubble was again visible along the entire length of the top of the cell. After measuring the full temperature range, repeat measurements were conducted at a minimum of two temperatures.
The instrument temperature control and data acquisition are fully automated. Temperature and pressure measurements are recorded every 30 s. Certain criteria must be met before a bubble point measurement is made. First, the standard deviation of 10 consecutive temperature readings must be within ± 0.2 K of the programmed temperature setpoint and second, the standard deviation of those 10 readings must be less than or equal to 0.001% of the mean temperature. The system setpoint temperature is then maintained for 3 hours to ensure equilibrium has been reached. After that time, 20 temperature and pressure readings are taken. These readings are then averaged and reported as the bubble point pressure at the corresponding temperature.
4. Uncertainty Analysis
The combined uncertainty for our bubble point measurements was calculated using the propagation of uncertainty method outlined in Guidelines for Evaluation and Expressing the Uncertainty of NIST Measurement Results11 taking into account five principle sources of uncertainty: temperature, pressure, sample composition (air impurities and loading uncertainty), measurement repeatability, and head pressure correction. A compilation of the uncertainties and their range for the mixtures studied herein is given in Table 2. The standard platinum resistance thermometer (SPRT) and the pressure transducer used for our measurements were calibrated regularly. The SPRT was calibrate with fixed-point standards, namely mercury (234.316 K) and water (273.16 K) triple points, gallium’s melting point (302.915 K) and indium’s freezing point (429.749 K) prior to starting the work herein. The standard combined uncertainty in our temperature measurements is estimated to be 20 mK. This includes the uncertainties in the SPRT calibration, the standard deviation of repeat temperature measurements of temperature standards, and the uncertainty in the multi-meter used to read the SPRT resistance.
Table 2.
Source of uncertainty included in overall uncertainty. Ranges include the maximum and minimum values for the six mixtures reported in this work.
| Property | Uncertainty (k=1) | Equivalent in Pressure [kPa] |
|---|---|---|
| Temperature measurement | 0.02 K | 0.12 – 1.2 |
| Pressure transducer measurement | 0.035 or 0.35 | |
| Loading uncertainty | 0.2 or 0.3 (only applicable to R125 + R1234yf mixtures) | |
| Air impurity (calculated as Nitrogen) | 0.25 | |
| Repeatability of measurements | 0.11 – 0.75 | |
| Head pressure correction (measurements above 310 K) | 0.46 – 0.62 | |
| Total Root Sum of Squares (k=1) | 0.32 – 1.88 |
The quartz-crystal pressure transducers were calibrated with a NIST-traceable piston gauge. The pressure transducers were maintained at a temperature of 313 K during both the piston gauge tests and bubble point measurements. The manufacturer’s stated uncertainty of the pressure transducers is 0.01 % of the full range. However, Outcalt and Lee12 documented that holding the piston gauge and pressure transducers at the same constant temperature during calibration and measurements can reduce the pressure measurement uncertainty to 0.005% or less of the full scale. Therefore, the pressure measurement uncertainty is assigned a value of 0.035 kPa for pressures below 680 kPa and 0.35 kPa for higher pressures.
The uncertainty of the measured liquid phase composition has several contributions. The balance used to determine the mass of each component added has a precision of 0.1 mg. As mentioned previously the weighing procedure of Harris and Torres was used and each weighing was repeated 4 times. The maximum standard deviation of the repeated weighings was never greater than 3 mg. This corresponds to less than 0.0001 mol fraction. Thus, the uncertainty in composition based on the sample preparation is considered negligible and the bulk composition of the mixture known with high accuracy. However, additional uncertainties associated with the liquid composition exist because of the measurement technique.
Outcalt and Lemmon9 described the calculations to determine the liquid phase composition uncertainty in detail and therefore only a brief description is given here. The two largest contributors to the composition uncertainty result from transferring the mixture from the sample bottle into the cell (referred to as the loading uncertainty) and air impurities that may exist in the mixture. Both of these sources of uncertainty can alter the composition and are accounted for using REFPROP (version 10.0)5 calculations. Flash calculations are used to account for the change in liquid phase composition when loading the cell. In this work, the greatest change to the liquid-phase composition based on the flash calculations was 0.0005 mol fraction for the R125 + R1234yf (x1 = 0.6635) sample resulting in a loading uncertainty pressure equivalent of 0.3 kPa. The loading uncertainty for the R125 + R1234yf (x1 = 0.3495) sample was 0.0004 mol fraction resulting in a loading uncertainty pressure equivalent of 0.2 kPa. For all other mixtures studied in this work the pressure equivalent of the loading uncertainty was negligible. The reported uncertainties in the liquid-phase compositions are those derived from the flash calculations.
The correction for dissolved air in the sample is calculated based on a typical vacuum gauge reading of 60 millitorr at 295 K (ambient conditions) prior to the sample being loaded into the evacuated system. Using nitrogen as a surrogate for air, calculations are done to determine the amount of nitrogen present in the system at 100 millitorr (to be conservative). The assumption is made that the nitrogen is insoluble in the refrigerant mixture and that it is therefore compressed into the bubble space of approximately 1 ml. This represents a pressure of 0.25 kPa which is used as the uncertainty value for the possible air impurity.
The repeatability of our bubble point measurements was determined by duplicating measurements at a minimum of two temperatures for each sample studied. In some instances, bubble points at a given temperature were measured three times. The average deviation of the repeated bubble points was calculated at the given temperature. To be conservative in our uncertainty estimates, the repeatability value for all bubble points measured at a given composition was the averaged value of the average deviations between repeat measurements.
The instrument was designed minimizing the system volume above the cell (especially that outside of the temperature-controlled area). This was done to keep the bubble volume to a minimum and ensure the sample in that volume remained in the vapor phase. If this were the case, the head pressure correction would be negligible; however, if surface tension caused a significant portion of the line to the pressure transducer, to be filled with liquid as opposed to condensing back into the cell, there would be a head pressure contribution to the measured bubble point pressure. The pressure transducers were maintained at 313 K during measurements. Thus, for temperatures below this, it was assumed the head pressure had no contribution to the measurement. At temperatures above 310 K, the head pressure was calculated for each point (assuming the volume above the cell was liquid-filled) and treated as an uncertainty in the calculation of the overall uncertainty in the reported bubble point pressures.
The combined uncertainty of the bubble point pressure for each point was calculated by taking the root sum of squares of the pressure equivalents of the temperature and composition uncertainties, the pressure uncertainty, the measurement repeatability, and head pressure corrections. The bubble point pressure combined uncertainty was then multiplied by a coverage factor, k = 2, to obtain the combined expanded uncertainty which is reported as both an absolute value in pressure and a percentage of the measured bubble point pressure.
5. Results and Discussion
Bubble point measurements for an R32 (1) + R125 (2) binary mixture where x1 = 0.6342 are listed in Table 3. These measurements were used to validate the apparatus. Figure 3 shows deviations of the measured R32 + R125 bubble point pressures reported here and phase equilibria data from nineteen literature studies13–31 from pressures calculated using the REFPROP program.5 Mixture phase equilibria models embedded in REFPROP5 use pure component Helmholtz free energy equations of state (EoS) 32–33 and binary interaction parameters and mixing rules as described by Lemmon and Jacobson34 for R32 + R125 mixtures. To avoid confusion, symbols are used in Figure 3 only to distinguish the data measured in this study from those available in the literature. However, for completeness, Table 3 lists the composition and temperature ranges, measurement method, measurement uncertainties, and statistics to summarize the comparison of each study to REFPROP5 including the average absolute deviation (ΔAAD), standard deviation(ΔSD), bias (Δbias), and maximum deviation (Δmax). Figure 3 shows that the data from this study deviate within the scatter of many of the literature studies. It is interesting to note that the bubble point pressures reported here exhibit consistently positive deviations relative to REFPROP. Referencing Table 3 we see that 12 of the 19 literature studies listed exhibit positive Δbias values. This distinction demonstrates that the R32 + R125 bubble point pressures reported in this study are consistent with most available literature studies.
Table 3.
Measured bubble point pressures for the system R32 (1) + R125 (2) at temperature T, pressure P, and liquid mole fraction xa.
| x1 = 0.6342 ± 0.0000 | ||||
|---|---|---|---|---|
|
| ||||
| T/K | p/kPa | u(p)/kPa | (u(p)/p)*100 | (1− p exp/ pEoS)*100 |
|
| ||||
| 264.99 | 610.1 | 1.25 | 0.20 | 0.55 |
| 264.99 | 610.1 | 1.25 | 0.20 | 0.56 |
| 269.99 | 720.9 | 1.49 | 0.21 | 0.57 |
| 269.99 | 720.9 | 1.49 | 0.21 | 0.57 |
| 274.99 | 845.6 | 1.57 | 0.19 | 0.51 |
| 274.99 | 845.6 | 1.57 | 0.19 | 0.52 |
| 279.99 | 985.6 | 1.66 | 0.17 | 0.43 |
| 279.99 | 985.7 | 1.66 | 0.17 | 0.43 |
| 284.99 | 1142.1 | 1.77 | 0.15 | 0.31 |
| 284.99 | 1142.8 | 1.77 | 0.15 | 0.38 |
| 289.99 | 1318.4 | 1.88 | 0.14 | 0.37 |
| 289.99 | 1317.2 | 1.88 | 0.14 | 0.27 |
| 294.99 | 1512.2 | 2.01 | 0.13 | 0.25 |
| 294.99 | 1511.7 | 2.01 | 0.13 | 0.22 |
| 299.99 | 1727.6 | 2.15 | 0.12 | 0.21 |
| 299.99 | 1726.1 | 2.15 | 0.12 | 0.13 |
| 304.99 | 1965.0 | 2.31 | 0.12 | 0.16 |
| 304.99 | 1965.6 | 2.31 | 0.12 | 0.20 |
| 304.99 | 1963.7 | 2.31 | 0.12 | 0.10 |
| 309.99 | 2226.9 | 2.48 | 0.11 | 0.15 |
| 309.99 | 2227.0 | 2.48 | 0.11 | 0.16 |
| 309.99 | 2226.1 | 2.48 | 0.11 | 0.11 |
| 314.99 | 2514.8 | 2.84 | 0.11 | 0.15 |
| 314.99 | 2514.5 | 2.84 | 0.11 | 0.14 |
| 314.99 | 2513.6 | 2.84 | 0.11 | 0.11 |
| 319.99 | 2830.0 | 3.04 | 0.11 | 0.15 |
| 319.99 | 2830.2 | 3.04 | 0.11 | 0.15 |
| 319.99 | 2828.7 | 3.04 | 0.11 | 0.10 |
| 324.99 | 3174.9 | 3.25 | 0.10 | 0.14 |
| 324.99 | 3173.5 | 3.25 | 0.10 | 0.10 |
| 329.99 | 3551.8 | 3.49 | 0.10 | 0.14 |
| 329.99 | 3550.6 | 3.49 | 0.10 | 0.11 |
| 334.99 | 3962.4 | 3.76 | 0.09 | 0.11 |
Standard uncertainties u are u(T) = 0.02 K, values of u(p) and u(x1) are given in the table.
Figure 3.
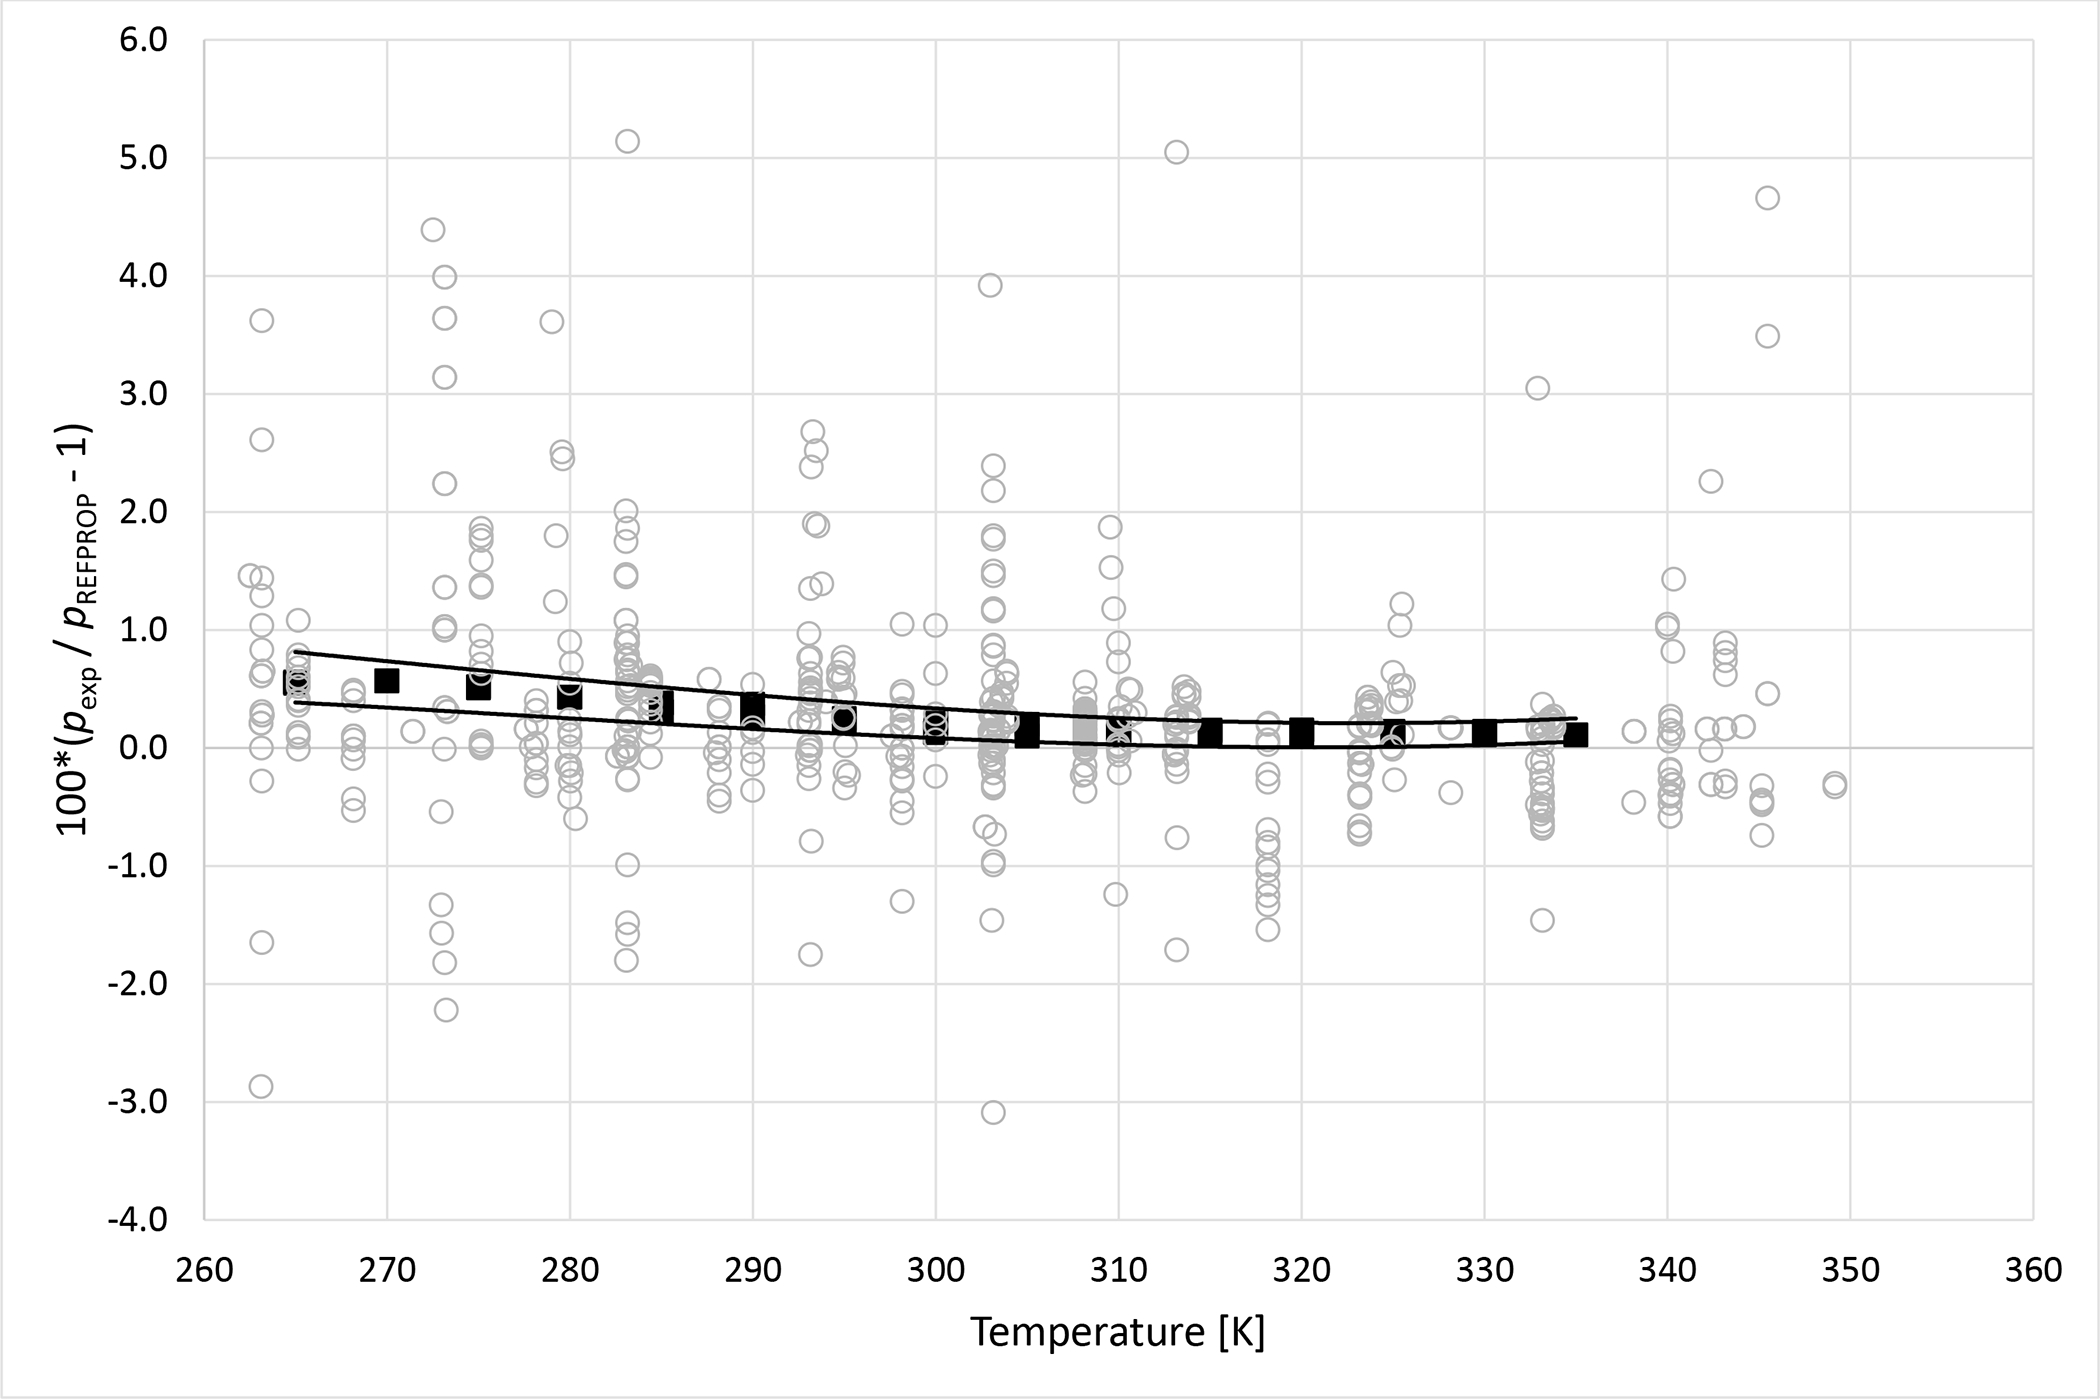
Deviations from pressures calculated with REFPROP5 for the mixture R32 + R125 as a function of temperature for data measured in this work ■ and literature values13–31 ○. Curves represent approximate experimental uncertainty bounds for this work.
The measured bubble points for the R1234yf + R134a, R134a + R1234ze(E), R1234yf + R1234ze(E), R125 + R1234yf, R1234ze(E) + R227ea, and R1234yf + R152a binary mixtures studied in this work are reported in Tables 5 through 10, respectively. Each table contains data for the two compositions studied here.
Table 5.
Measured bubble point pressures for the system R1234yf (1) + R134a (2) at temperature T, pressure P, and liquid mole fraction xa.
| x1 = 0.3199 ± 0.0001 | ||||
|
| ||||
| T/K | p/kPa | u(p)/kPa | (u(p)/p)*100 | (1− p exp/ pEoS)*100 |
|
| ||||
| 269.99 | 282.7 | 1.10 | 0.39 | −0.60 |
| 279.99 | 399.3 | 1.15 | 0.29 | −0.65 |
| 279.99 | 399.6 | 1.15 | 0.29 | −0.58 |
| 289.99 | 549.3 | 1.22 | 0.22 | −0.70 |
| 289.99 | 549.6 | 1.22 | 0.22 | −0.65 |
| 299.99 | 739.7 | 1.50 | 0.20 | −0.58 |
| 299.99 | 739.8 | 1.50 | 0.20 | −0.56 |
| 309.99 | 975.1 | 1.62 | 0.17 | −0.56 |
| 309.99 | 974.5 | 1.62 | 0.17 | −0.62 |
| 319.99 | 1262.0 | 2.07 | 0.16 | −0.60 |
| 319.99 | 1261.8 | 2.07 | 0.16 | −0.62 |
| 329.99 | 1609.3 | 2.24 | 0.14 | −0.56 |
| 329.99 | 1608.6 | 2.24 | 0.14 | −0.60 |
| 339.99 | 2024.3 | 2.44 | 0.12 | −0.53 |
| 339.99 | 2023.2 | 2.44 | 0.12 | −0.58 |
| 349.99 | 2516.9 | 2.70 | 0.11 | −0.49 |
| 349.99 | 2515.1 | 2.70 | 0.11 | −0.56 |
| 359.99 | 3098.6 | 3.03 | 0.10 | −0.50 |
| 359.99 | 3095.7 | 3.03 | 0.10 | −0.59 |
|
| ||||
| x1 = 0.6467 ± 0.0000 | ||||
|
| ||||
| T/K | P/kPa | u(P)/kPa | (u(P)/P)*100 | (Pexp/PEoS − 1)*100 |
|
| ||||
| 269.99 | 289.9 | 0.81 | 0.28 | −0.69 |
| 269.99 | 290.0 | 0.81 | 0.28 | −0.64 |
| 279.99 | 406.9 | 0.88 | 0.22 | −0.70 |
| 279.99 | 407.0 | 0.88 | 0.22 | −0.69 |
| 289.99 | 557.8 | 0.97 | 0.17 | −0.53 |
| 289.99 | 556.5 | 0.97 | 0.17 | −0.75 |
| 289.99 | 556.5 | 0.97 | 0.17 | −0.75 |
| 299.99 | 745.2 | 1.30 | 0.17 | −0.67 |
| 299.99 | 745.2 | 1.30 | 0.17 | −0.67 |
| 309.99 | 977.0 | 1.43 | 0.15 | −0.71 |
| 309.99 | 976.8 | 1.43 | 0.15 | −0.73 |
| 319.99 | 1259.8 | 1.90 | 0.15 | −0.68 |
| 319.99 | 1259.3 | 1.90 | 0.15 | −0.72 |
| 329.99 | 1599.0 | 2.07 | 0.13 | −0.72 |
| 339.99 | 2005.3 | 2.28 | 0.11 | −0.64 |
| 339.99 | 2003.8 | 2.28 | 0.11 | −0.71 |
| 349.99 | 2482.2 | 2.54 | 0.10 | −0.73 |
| 349.99 | 2482.9 | 2.54 | 0.10 | −0.71 |
| 359.99 | 3047.8 | 2.86 | 0.09 | −0.74 |
| 359.99 | 3047.6 | 2.86 | 0.09 | −0.75 |
Standard uncertainties u are u(T) = 0.02 K, values of u(p) and u(x1) are given in the table.
Table 10.
Measured bubble point pressures for the system R1234yf (1) + R152a (2) at temperature T, pressure P, and liquid mole fraction xa.
| x1 = 0.3653 ± 0.0001 | ||||
|
| ||||
| T/K | p/kPa | u(p)/kPa | (u(p)/p)*100 | (1− p exp/ pEoS)*100 |
|
| ||||
| 270.00 | 268.2 | 0.70 | 0.26 | −1.93 |
| 270.00 | 268.3 | 0.70 | 0.26 | −1.91 |
| 280.00 | 378.2 | 0.77 | 0.20 | −1.71 |
| 290.00 | 519.2 | 0.86 | 0.17 | −1.59 |
| 290.00 | 519.4 | 0.86 | 0.17 | −1.56 |
| 300.00 | 697.3 | 1.21 | 0.17 | −1.42 |
| 310.00 | 917.0 | 1.34 | 0.15 | −1.37 |
| 310.00 | 916.8 | 1.34 | 0.15 | −1.39 |
| 320.00 | 1185.7 | 1.76 | 0.15 | −1.26 |
| 330.00 | 1508.8 | 1.92 | 0.13 | −1.20 |
| 330.00 | 1509.5 | 1.92 | 0.13 | −1.16 |
| 340.00 | 1895.1 | 2.13 | 0.11 | −1.09 |
| 350.00 | 2352.5 | 2.37 | 0.10 | −0.98 |
| 360.00 | 2889.9 | 2.67 | 0.09 | −0.91 |
|
| ||||
| x1 = 0.6851 ± 0.0000 | ||||
|
| ||||
| T/K | P/kPa | u(P)/kPa | (u(P)/P)*100 | (Pexp/PEoS − 1)*100 |
|
| ||||
| 270.00 | 283.3 | 0.68 | 0.24 | −0.38 |
| 270.00 | 283.4 | 0.68 | 0.24 | −0.35 |
| 280.00 | 397.5 | 0.75 | 0.19 | −0.22 |
| 290.00 | 543.2 | 0.85 | 0.16 | −0.17 |
| 290.00 | 543.3 | 0.85 | 0.16 | −0.15 |
| 300.00 | 726.2 | 1.20 | 0.17 | −0.08 |
| 310.00 | 951.1 | 1.33 | 0.14 | −0.10 |
| 320.00 | 1225.3 | 1.79 | 0.15 | −0.04 |
| 320.00 | 1225.6 | 1.79 | 0.15 | −0.02 |
| 330.00 | 1555.0 | 1.95 | 0.13 | 0.03 |
| 340.00 | 1947.4 | 2.15 | 0.11 | 0.08 |
| 340.00 | 1947.0 | 2.15 | 0.11 | 0.05 |
| 350.00 | 2411.0 | 2.40 | 0.10 | 0.12 |
| 360.00 | 2956.9 | 2.71 | 0.09 | 0.15 |
Standard uncertainties u are u(T) = 0.02 K, values of u(p) and u(x1) are given in the table.
The performance of current Helmholtz free energy EoS contained within REFPROP5 is evaluated by comparing the data obtained in this study and from available literature studies35–42. REFPROP5 uses the pure component Helmholtz free energy EoS with binary interaction parameters and mixing rules. It is important to note that both parameters for the pure component EoS and binary interaction parameters used in REFPROP5 are determined using available experimental data. Table 11 lists the studies reporting literature data for the mixtures that were the focus of this work. It lists various details of the data sets including temperature and composition range, technique for composition determination and author stated uncertainties. It is important to highlight that currently, limited literature data, covering a narrow temperature and pressure range were available for the binary mixtures evaluated in this study. Most of the binary interactions parameters embedded in REFPROP5 for the R1234yf + R1234ze(E), R1234yf + R134a, R125 + R1234yf, and R134a + R1234ze(E) are reported by Bell et al.43 Additionally, binary interactions parameters for the R1234yf + 152a system are reported by Bell and Lemmon.44 However, as indicated by Table 11, no literature sources report binary interaction parameters for the R1234ze(E) + R227ea system. Therefore, REFPROP5 defaults to using R1234yf + R227ea binary interaction parameters reported by Bell and Lemmon to predict bubble point values for the R1234ze(E) + R227ea system.
Table 11.
Summary of studies reporting vapor-liquid equilibria data for mixtures investigated in this work.
| Year | Authors | Trange/K | x 1, range | Technique | U(T)/mK | U(p)/kPa | U(xi) |
|---|---|---|---|---|---|---|---|
|
| |||||||
| R1234yf(1) + R152a (2) | |||||||
| 2013 | Kamika et al. | 273 – 333 | 0 – 1 | GC | 15 | 0.7 |
l : 0.001 g·g−1 v: 0.01 g·g−1 |
|
| |||||||
| R134a (1) + R1234ze(E) (2) | |||||||
| 2019 | Al Ghafri et al. | 273 – 341 |
l: 0.4878 – 0.4930 v: 0.5375 – 0.5652 |
GC | 100 | 20 |
l : 0.001 mol·mol−1 v: 0.01 mol·mol−1 |
| 2019 | Kou et al. | 293 – 323 | 0 – 1 | GC | 20 | 2.5 | 0.005 mol·mol−1 |
|
| |||||||
| R1234yf(1) + R1234ze(E) (2) | |||||||
| 2019 | Al Ghafri et al. | 273 – 342 |
l: 0.6555 – 0.6560 v: 0.7127–7251 |
GC | 100 | 20 |
l : 0.001 mol·mol−1 v: 0.01 mol·mol−1 |
| 2021 | Ye et al. | 283 – 333 | 0 – 1 | GC | 3 | 0.6 – 1.0 | 0.004 mol·mol−1 |
|
| |||||||
| R125 + R1234yf | |||||||
| 2010 | Kamika et al. | 273 – 333 | 0 – 1 | GC | 15 | 0.7 |
l : 0.001 g·g−1 v: 0.01 g·g−1 |
| 2013 | Kamika et al. | 273 – 333 | 0 – 1 | GC | 15 | 0.7 |
l : 0.001 g·g−1 v: 0.01 g·g−1 |
| 2020 | Yang et al. | 283 – 323 | 0 – 1 | GC | 10 | 0.5 | 0.005 mol·mol−1 |
|
| |||||||
| R1234yf + R152a | |||||||
| 2014 | Hu et al. | 283 – 323 | 0 – 1 | GC | 5 | 3.5 | 0.004 mol·mol−1 |
| 2018 | Yang et al. | 283 – 323 | 0 – 1 | GC | 10 | 0.5 | 0.005 mol·mol−1 |
Deviation graphs comparing phase equilibria data calculated using REFPROP to data reported in this study and available literature studies are shown in Figures 4 to 9 for the R1234yf + R134a, R134a + R1234ze(E), R1234yf + R1234ze(E), R125 + R1234yf, R1234ze(E) + R227ea, and R1234yf + R152a binary mixtures, respectively. For more comprehensive comparison, deviations plots are shown as a function of temperature and, also as a function of composition. The graphs have dashed and solid lines drawn that quantify the bubble point pressure uncertainty as a function of temperature. The lines are smoothed curves of the uncertainties listed in Tables 5 through 10. In general, the data measured in this study are within the scatter of the available literature data. The one exception is the R1234yf + R152a (x1=0.6851) mixture. It is important to note that all the available literature data listed in Table 11 were obtained using invasive vapor-liquid equilibrium (VLE) measurements. All the authors sampled one or both phases of their mixtures and determined the composition with gas chromatography. As such, the differences between the data herein and those in the literature may be the result of different measurement techniques.
Figure 4a.
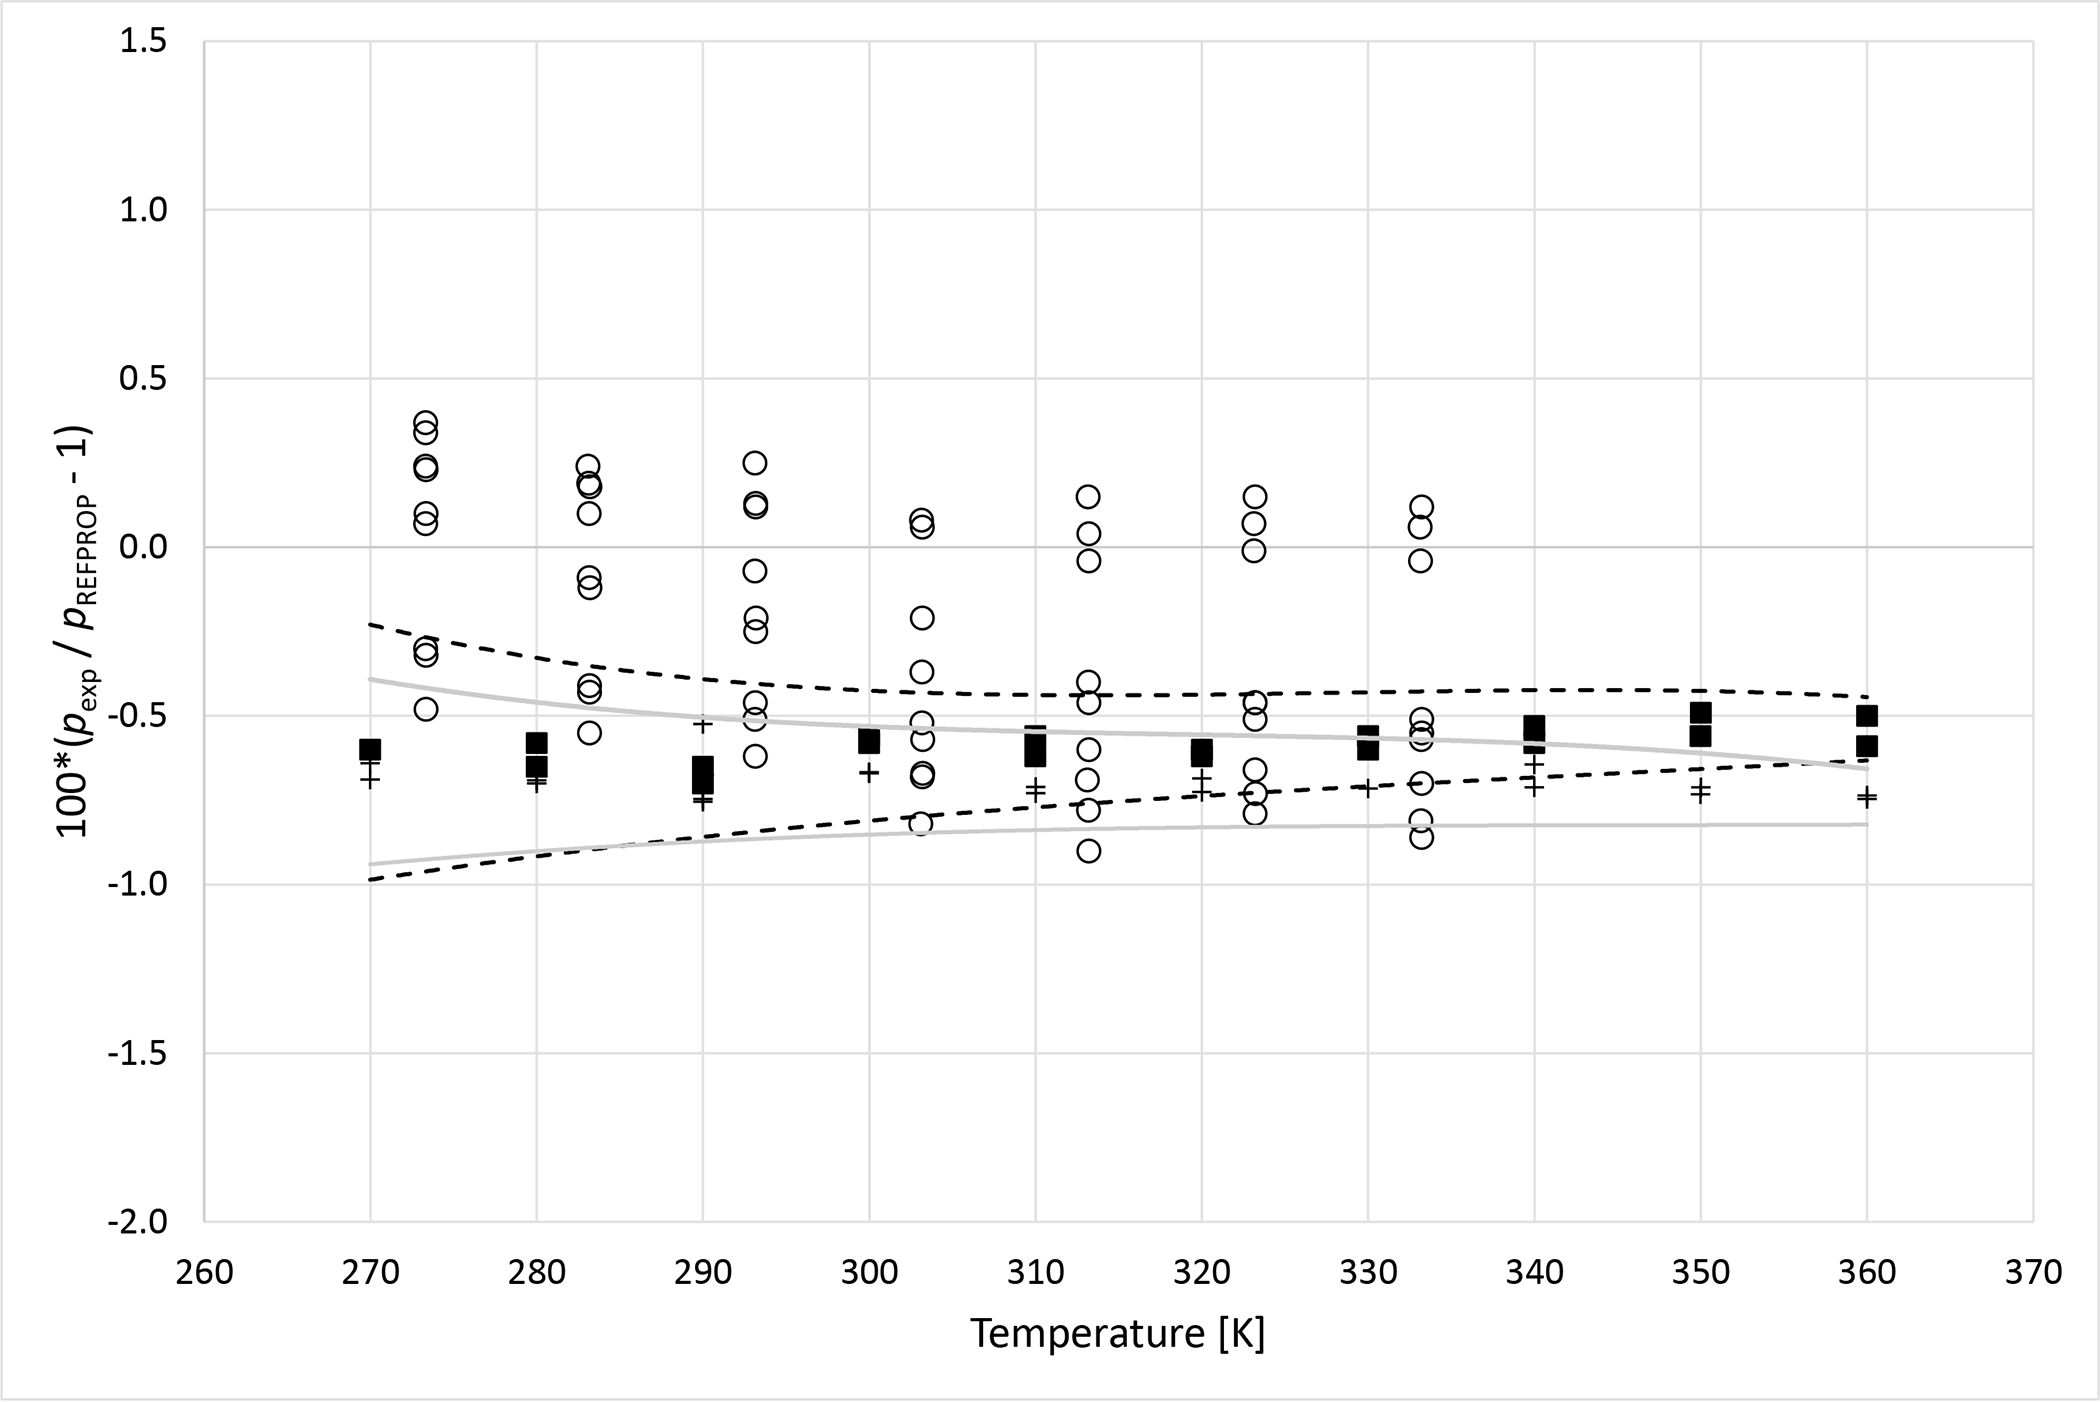
Deviations from pressures calculated with REFPROP5 for the mixture R1234yf (1)+ R134a (2) as a function of temperature for data measured in this work ■ (x1 = 0.3199), + (x1 = 0.6470) and Kamiaka et al.35 ○. Dashed curves (- - -) represent approximate experimental uncertainty bounds for x1 = 0.3199 and solid curves for x1 = 0.6470.
Figure 9a.
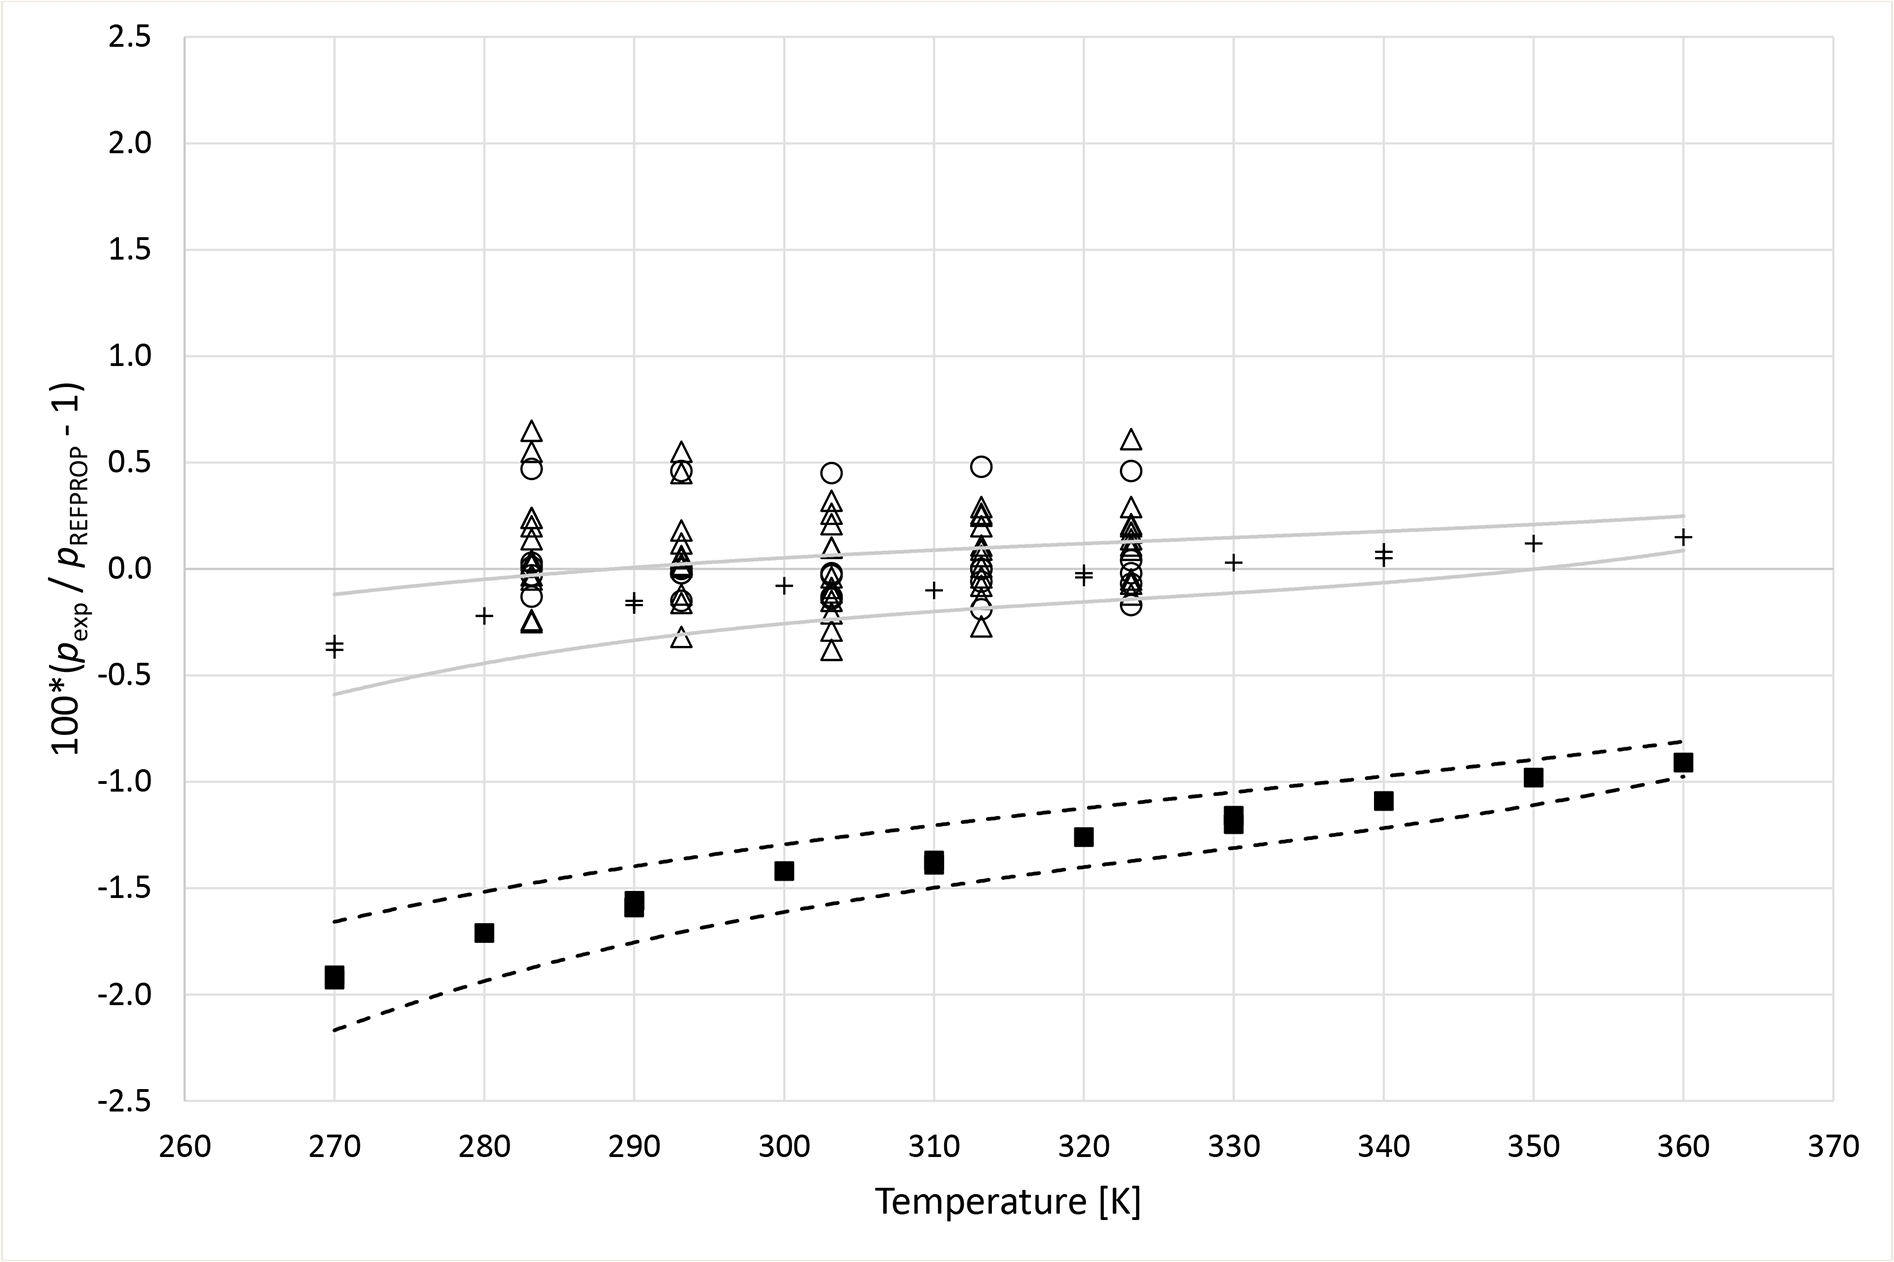
Deviations from pressures calculated with REFPROP5 for the mixture R1234yf (1) + R152a (2) as a function of temperature for data measured in this work ■ (x1 = 0.3653), + (x1 = 0.6851), Hu et al.41 Δ and Yang et al.40 ○. Dashed curves (- - -) represent approximate experimental uncertainty bounds for x1 = 0.3653 and solid curves for x1 = 0.6851.
6. Conclusions
The measurements reported herein have generally increased the temperature range of available phase equilibria data for the binary mixtures studied by 30 K – 40 K. Further, measurements for the R32 + R125 mixture system demonstrate the validity of the newly developed bubble point apparatus as the data produced compare favorably with the bulk of literature data sources. The data from the present study are used to test the current EoS embedded in version 10 of the REFPROP5 program. It is important to note that no adjustments were made to the Helmholtz free energy mixture models embedded in REFPROP5, 33, 45–49 or any of the binary interaction parameters prior to the data comparisons presented in this study. The Helmholtz free energy EoS implemented in REFPROP5 is empirical in form and requires fitting reliable pure component experimental data and adjustment of binary interaction parameters using mixture data to produce reasonable phase equilibria calculations. Therefore, deviations from REFPROP5, 33, 45–49 greater than the experimental uncertainty are not a reflection of the quality of the measurements but demonstrate that further adjustments to the EoS are necessary. The majority of bubble points measured in this work are either within the scatter of the literature data or have absolute deviations within the uncertainty of the literature data. Further, it is worth repeating that comparisons between the R1234ze(E) + R227ea data and REFPROP5 calculations utilize binary interaction parameters for the R1234yf + R227ea mixture and are purely estimates since no R1234ze(E) + R227ea phase equilibria data have been reported prior to this study. In conclusion, the data reported in the present study will be valuable in future work to optimize binary interaction parameters embedded in REFPROP5, 33, 45–49 for the refrigerant mixtures investigated in this study.
Figure 4b.
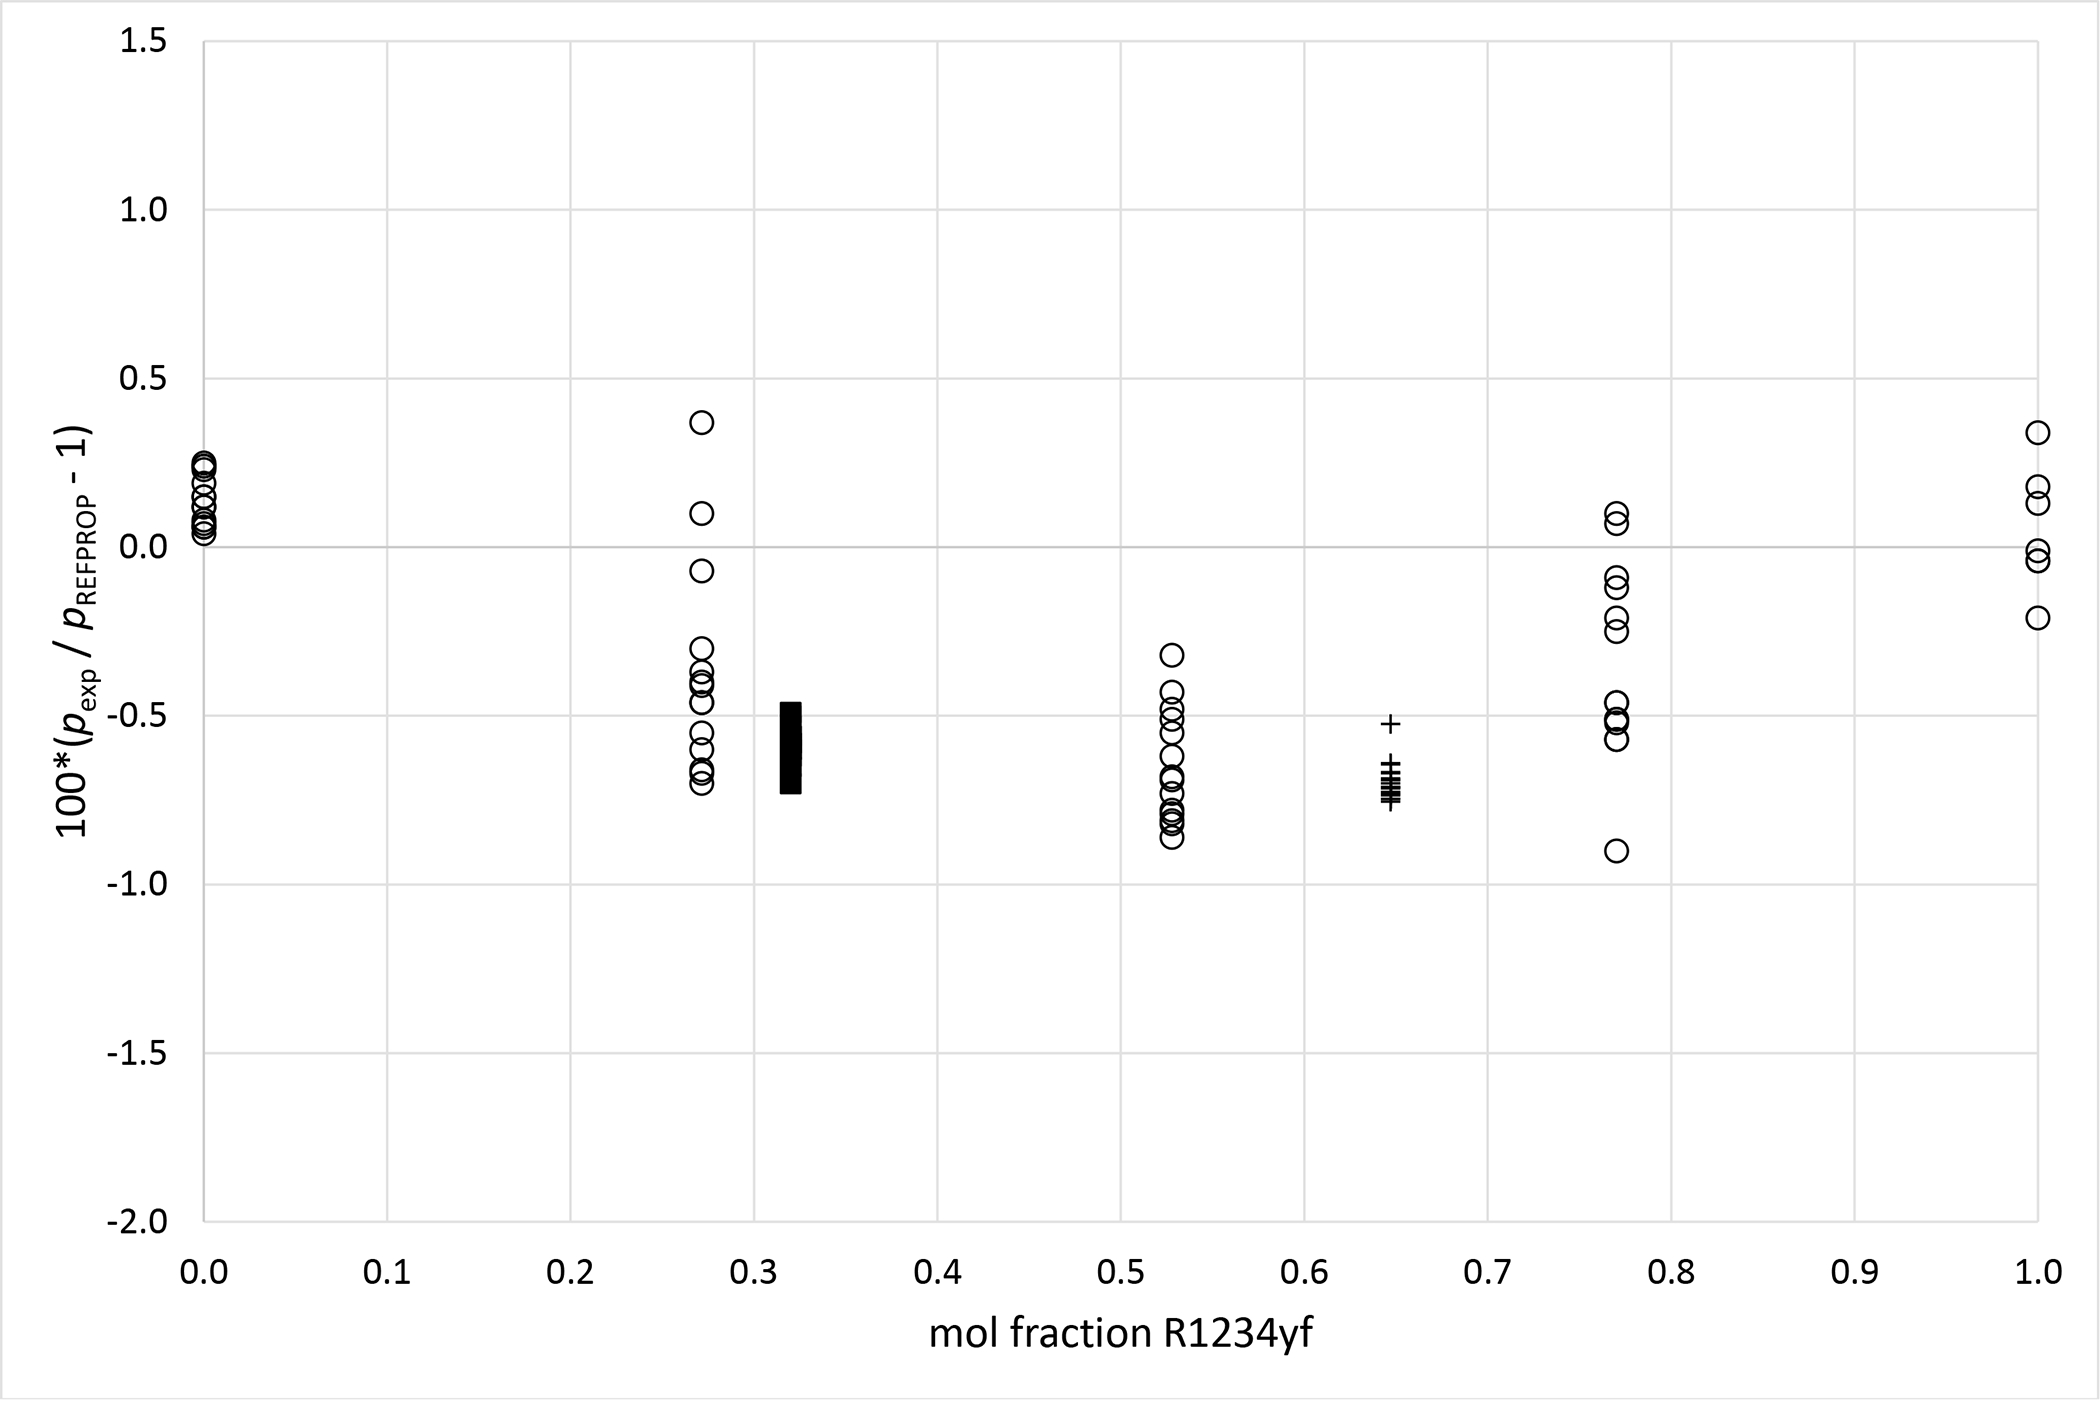
Deviations from pressures calculated with REFPROP5 for the mixture R1234yf (1)+ R134a (2) as a function of composition for data measured in this work ■ (x1 = 0.3199), + (x1 = 0.6470) and Kamiaka et al.35 ○.
Figure 5a.
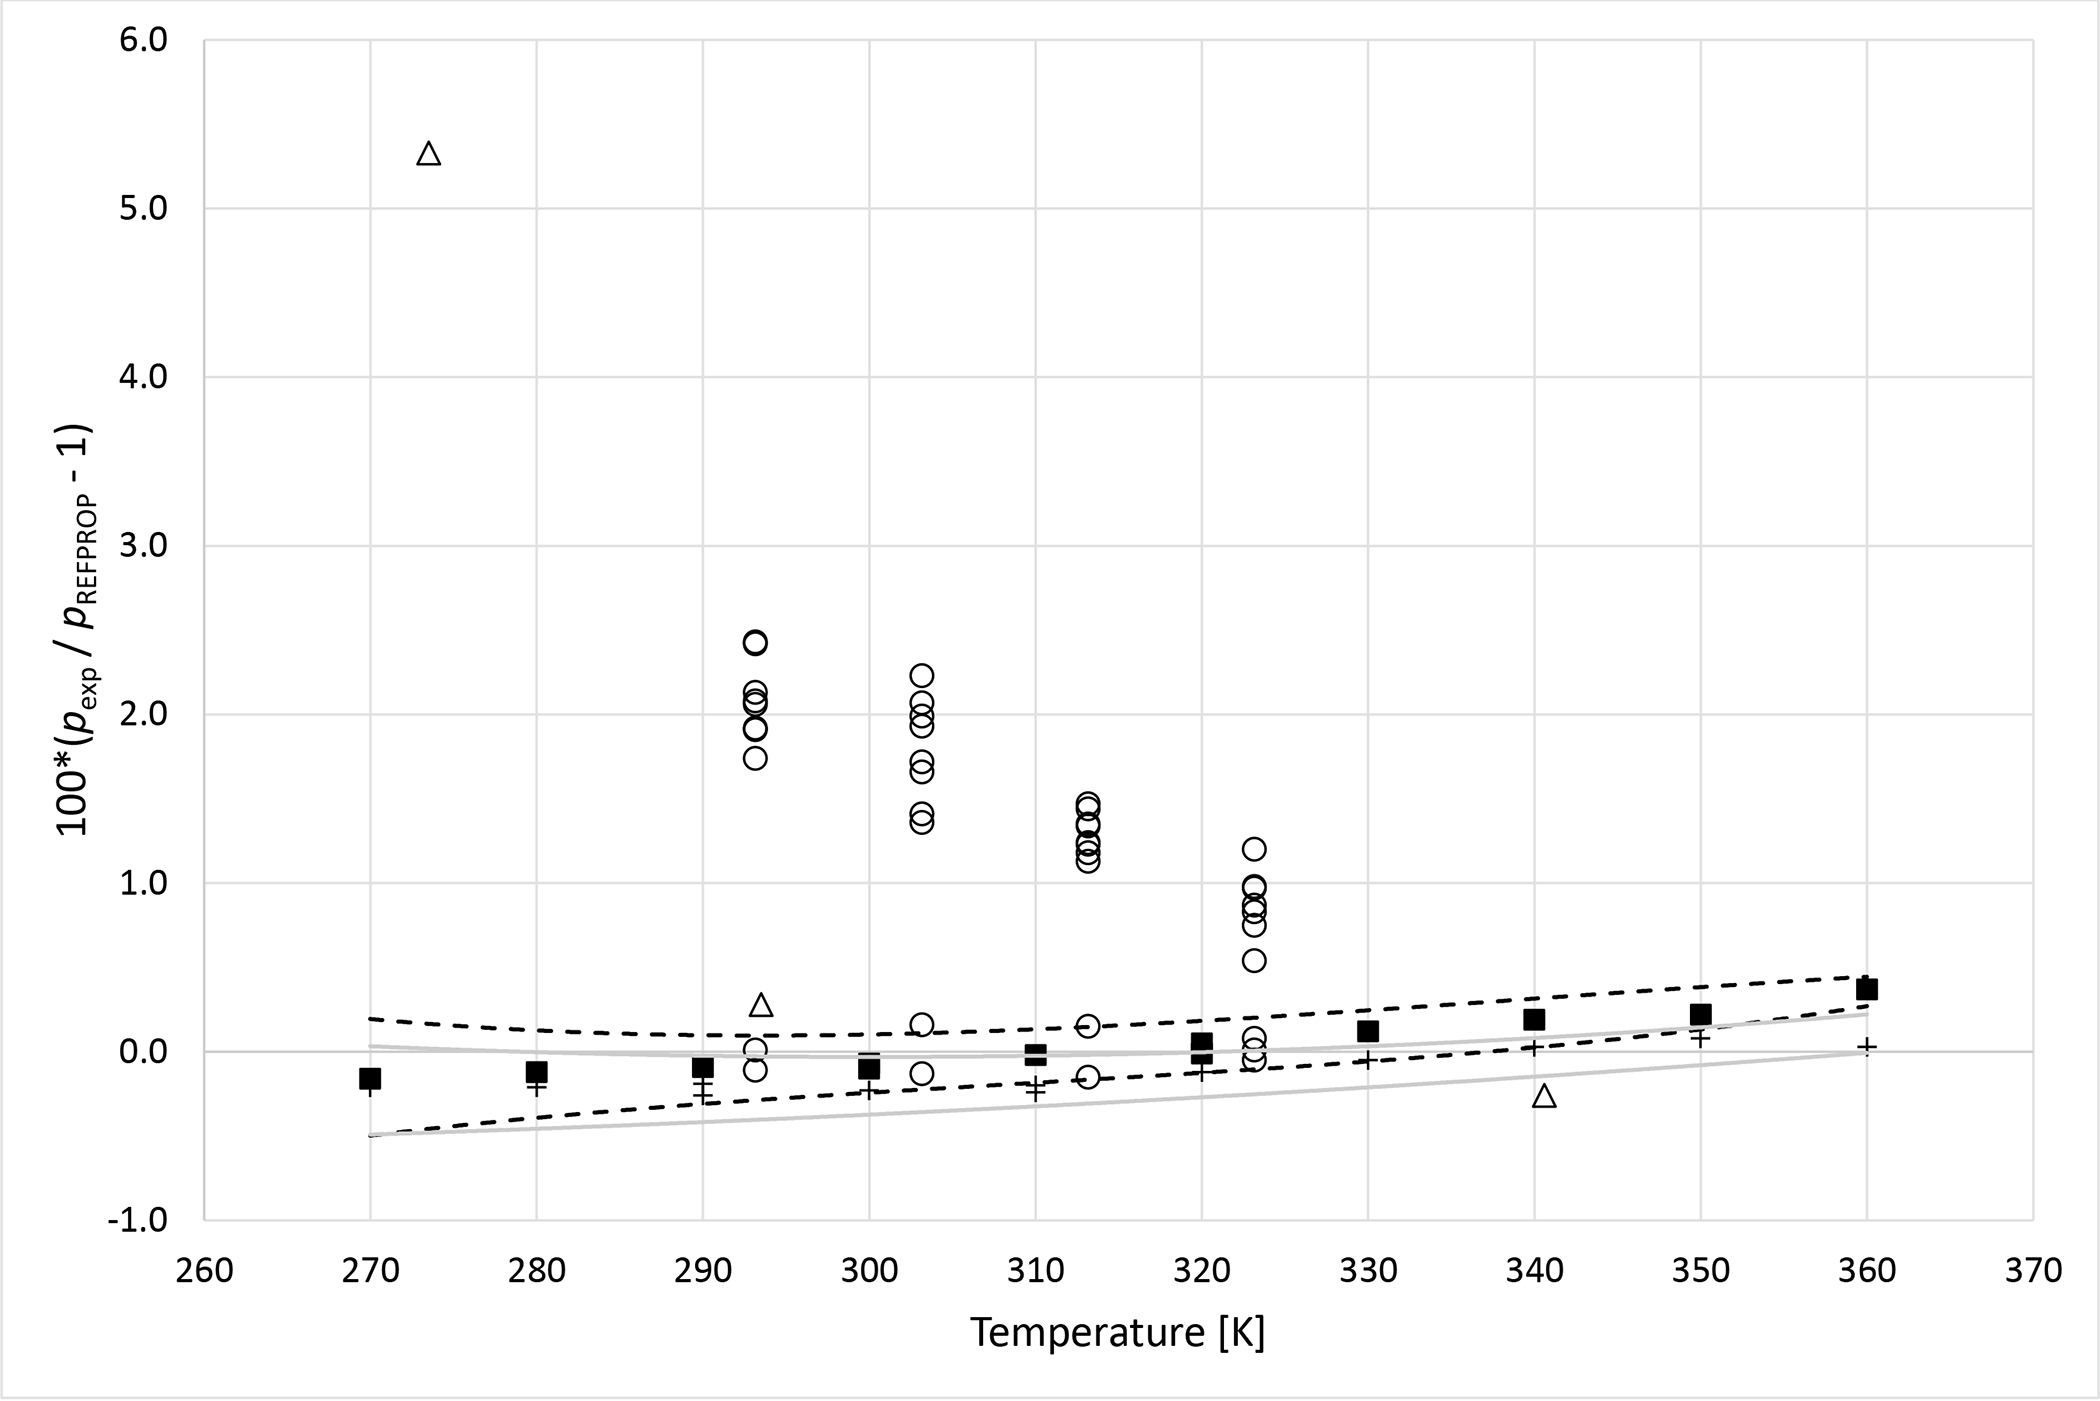
Deviations from pressures calculated with REFPROP5 for the mixture R134a (1) + R1234ze (E) (2) as a function of temperature for data measured in this work ■ (x1 = 0.3341), + (x1 = 0.6631), Al Ghafri et al.36 Δ and Kou et al.37 ○. Dashed curves (- - -) represent approximate experimental uncertainty bounds for x1 = 0.3341 and solid curves for x1 = 0.6631.
Figure 5b.
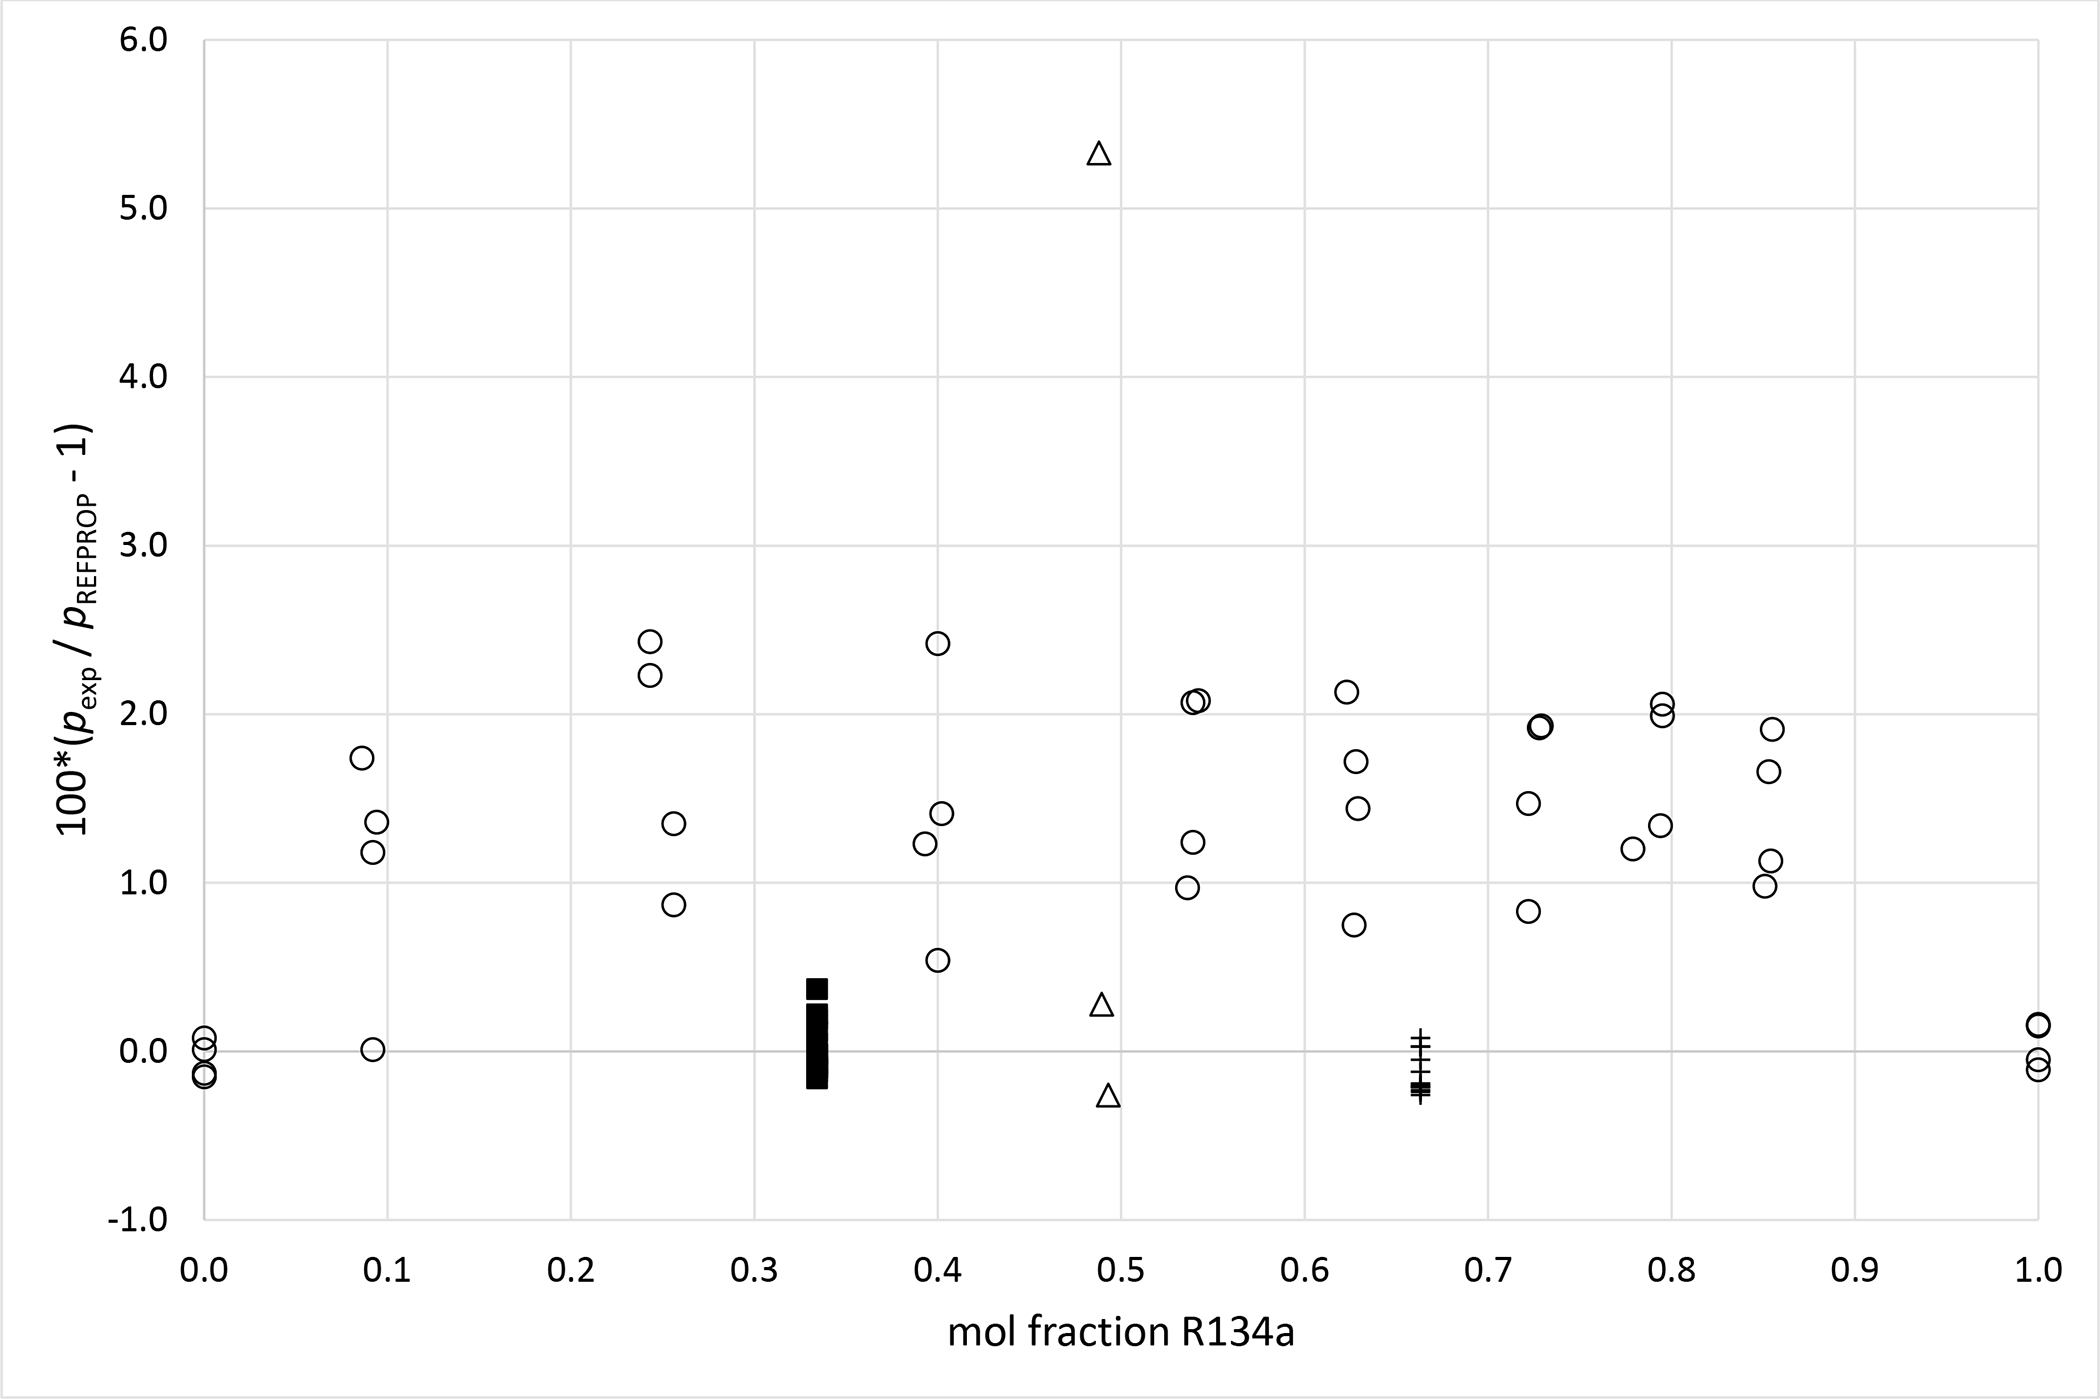
Deviations from pressures calculated with REFPROP5 for the mixture R134a (1) + R1234ze (E) (2) as a function of composition for data measured in this work ■ (x1 = 0.3341), + (x1 = 0.6631), Al Ghafri et al.36 Δ and Kou et al.37 ○.
Figure 6a.
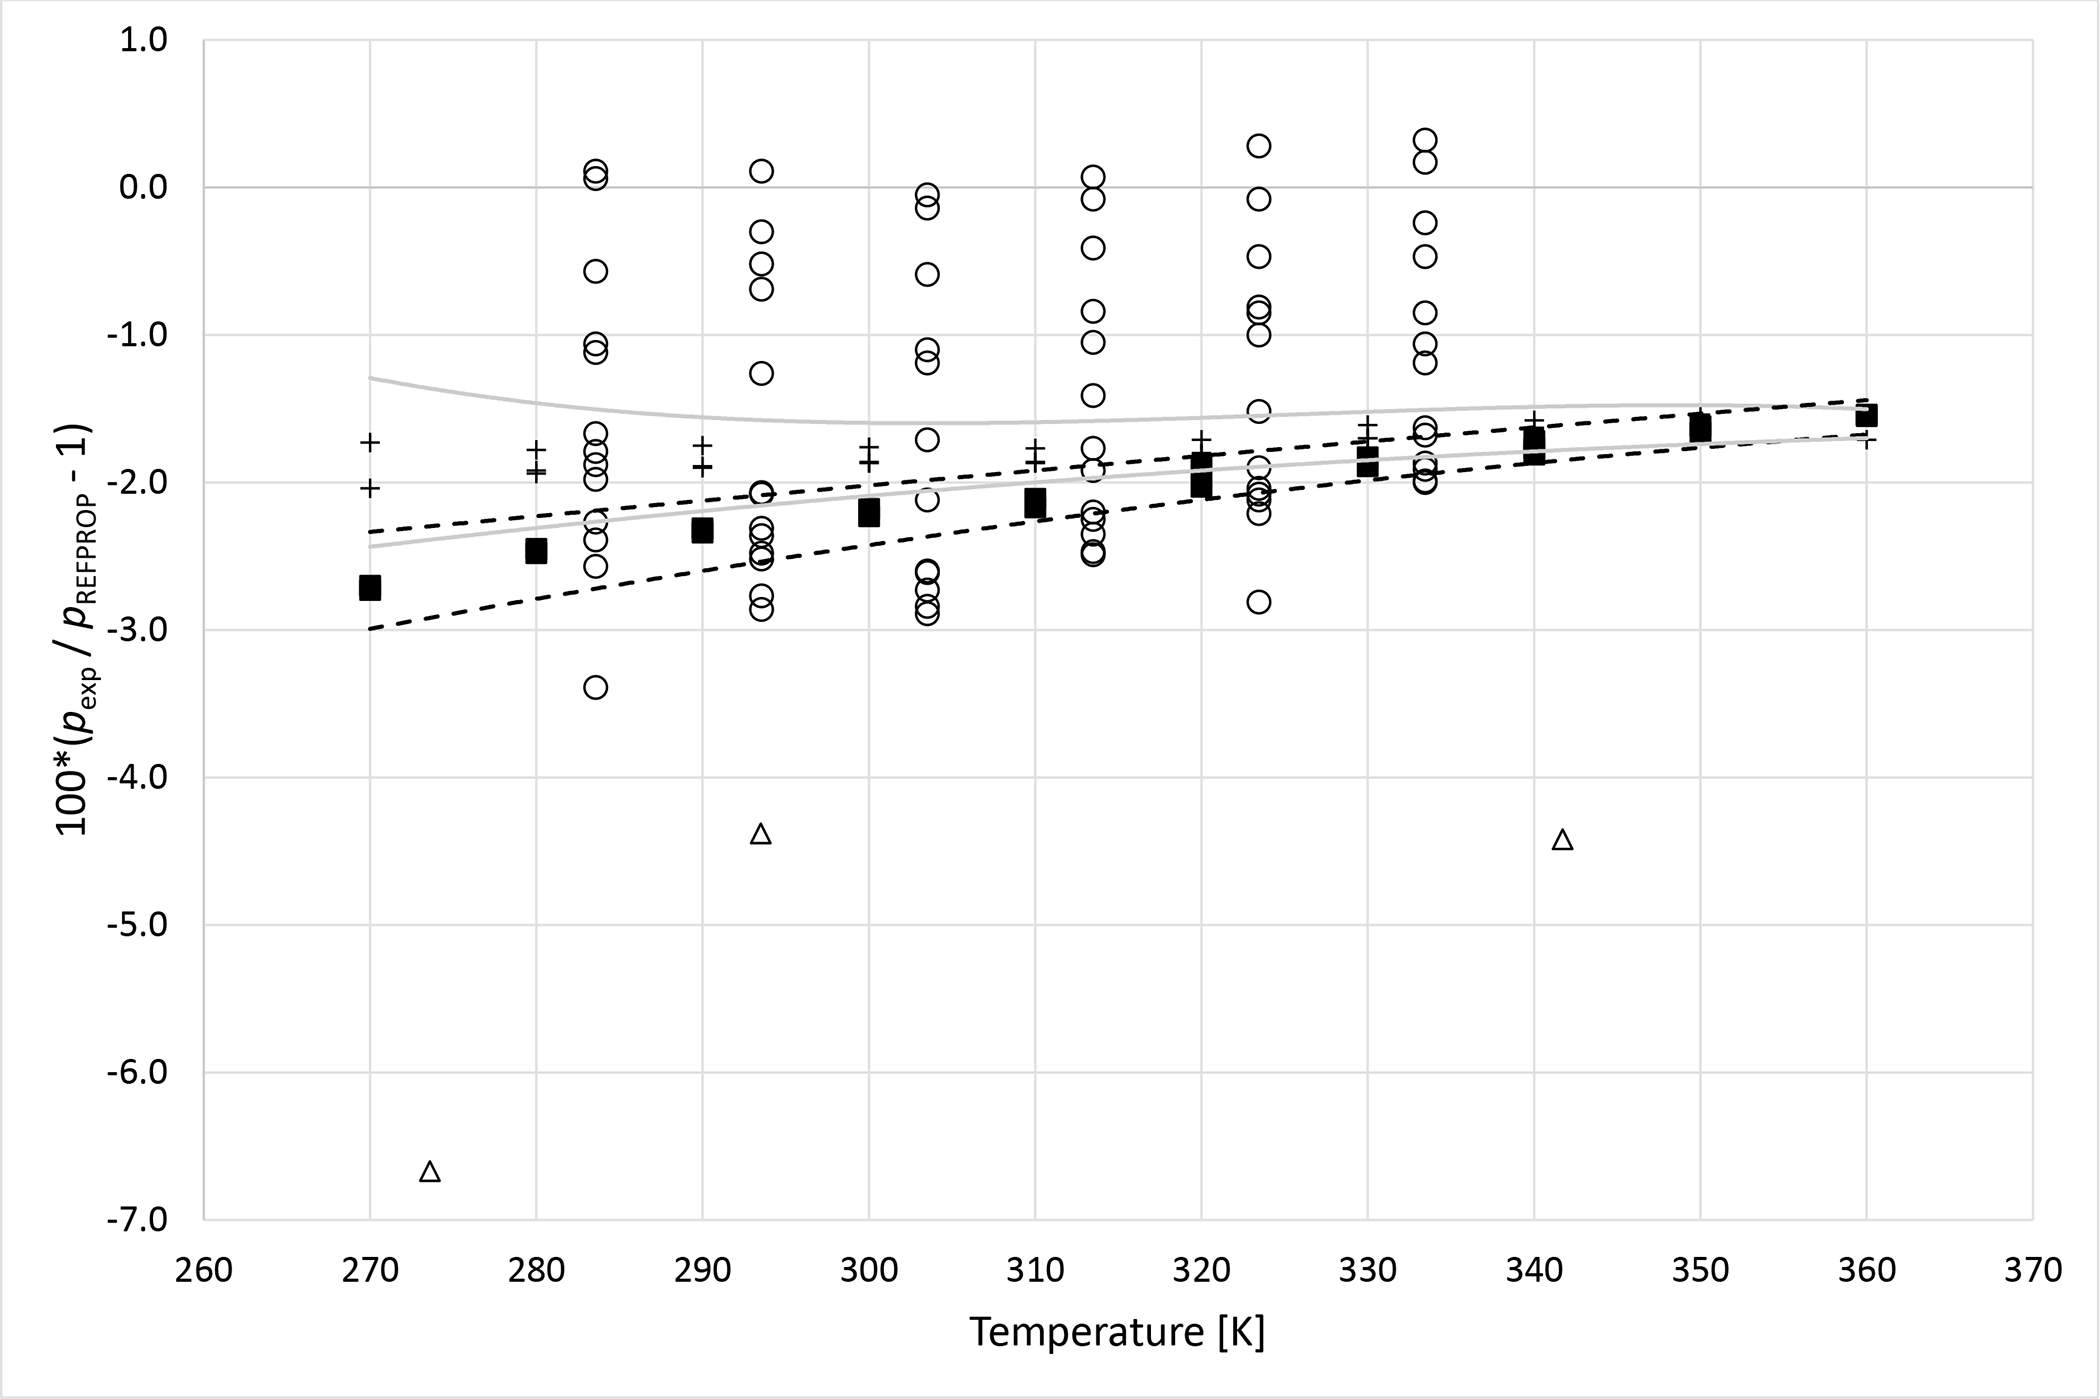
Deviations from pressures calculated with REFPROP5 for the mixture R1234yf (1)+ R1234ze (E) (2) as a function of temperature for data measured in this work ■ (x1 = 0.3241), + (x1 = 0.6382), Al Ghafri et al.36 Δ and Ye et al.38 ○. Dashed curves (- - -) represent approximate experimental uncertainty bounds for x1 = 0.3241 and solid curves for x1 = 0.6382.
Figure 6b.
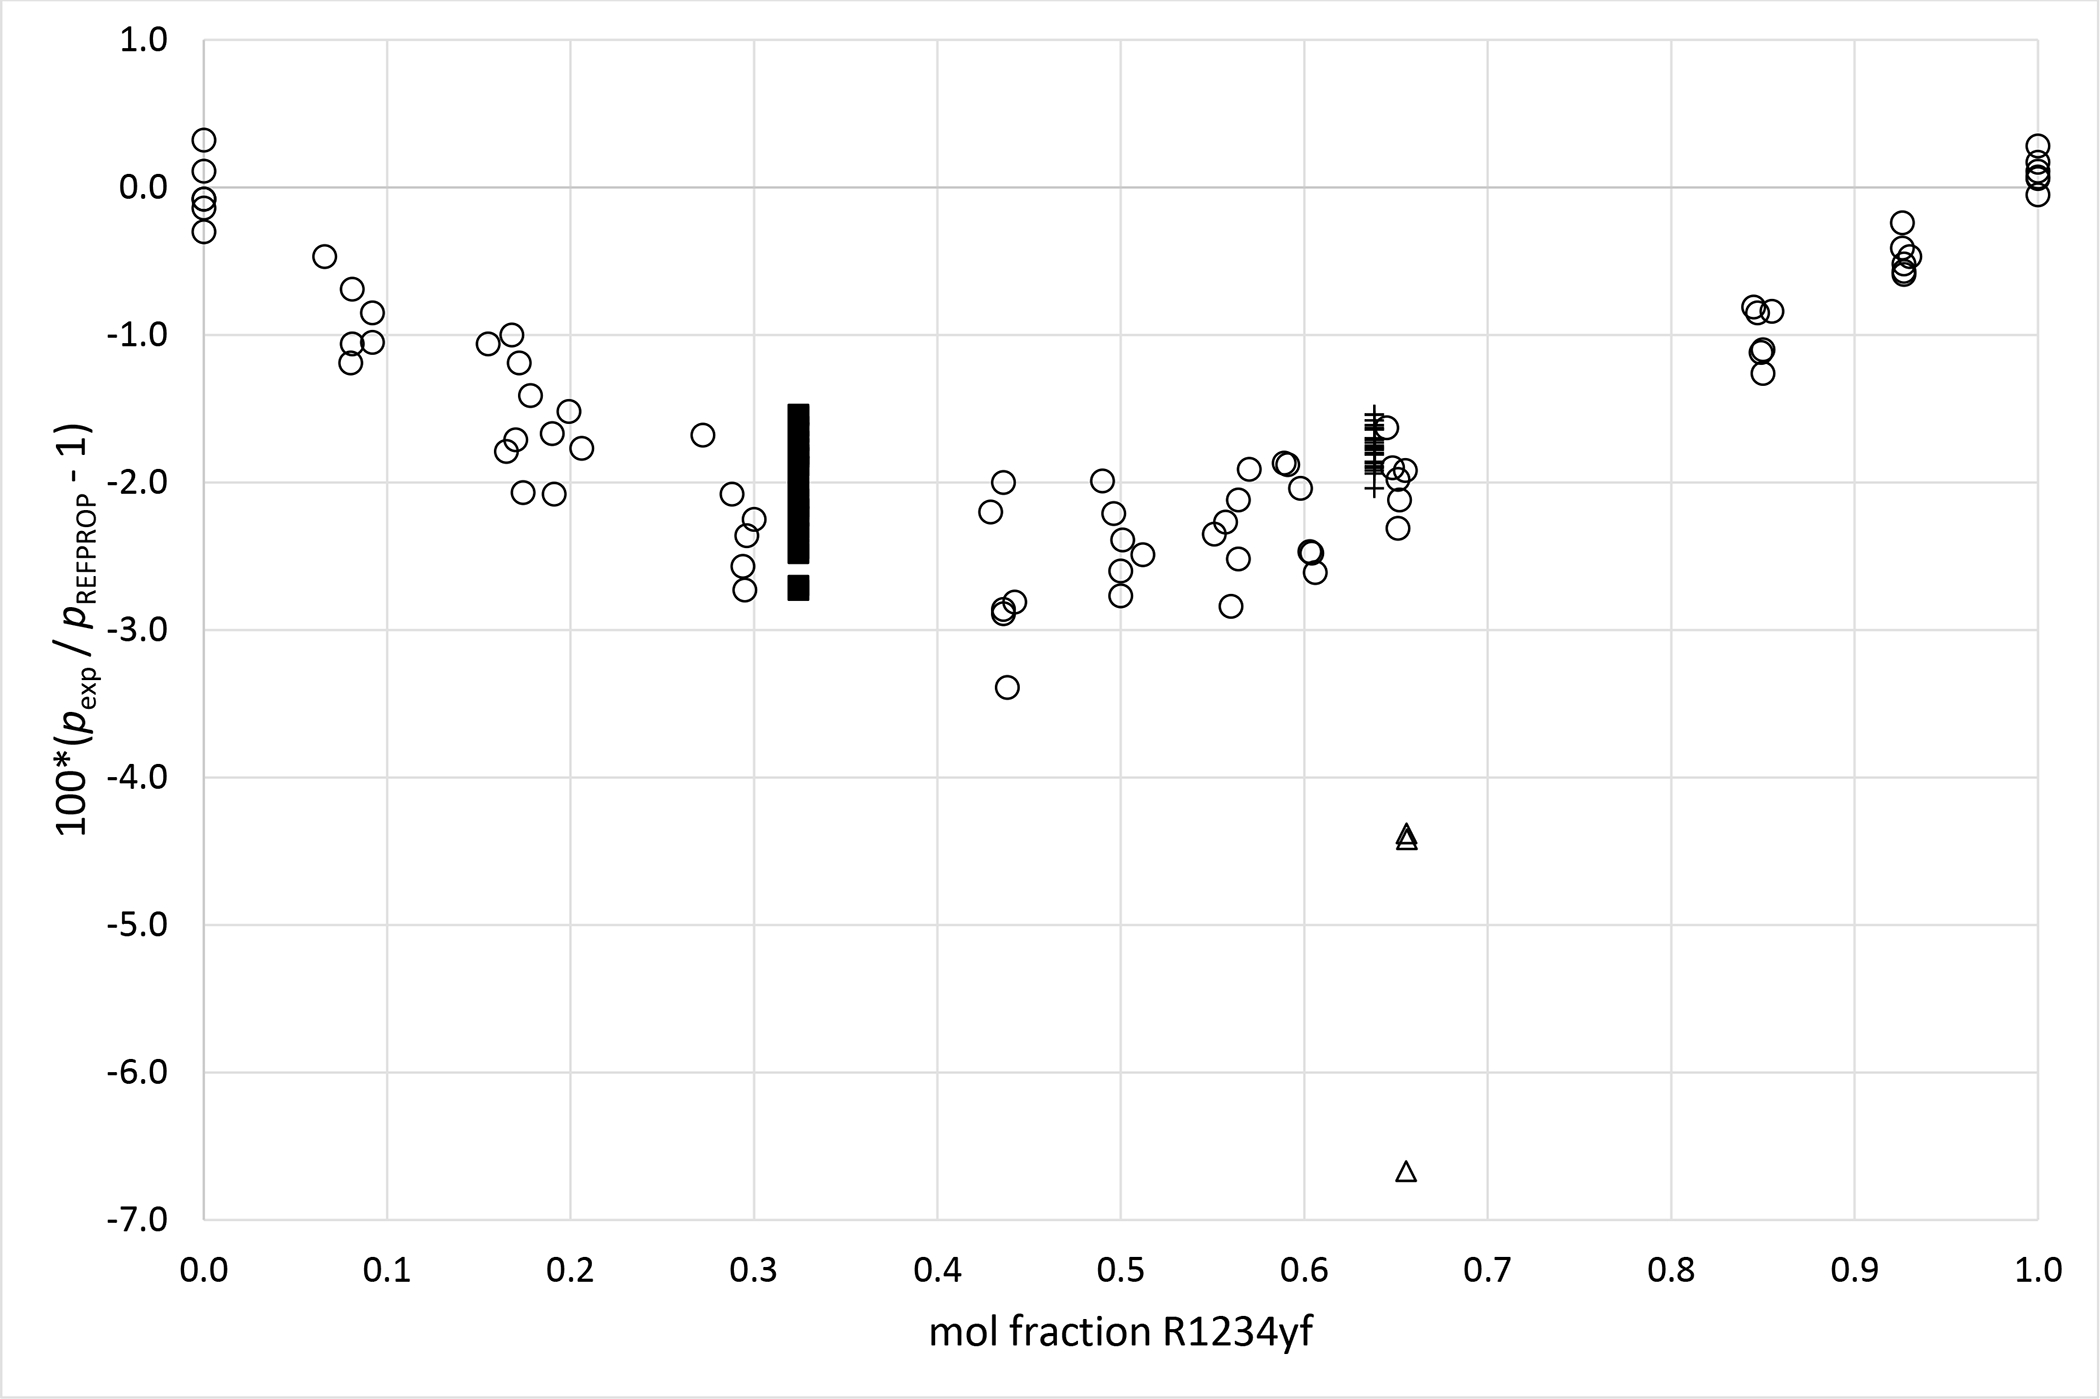
Deviations from pressures calculated with REFPROP5 for the mixture R1234yf (1)+ R1234ze (E) (2) as a function of composition for data measured in this work ■ (x1 = 0.3241), + (x1 = 0.6382), Al Ghafri et al.36 Δ and Ye et al.38 ○.
Figure 7a.
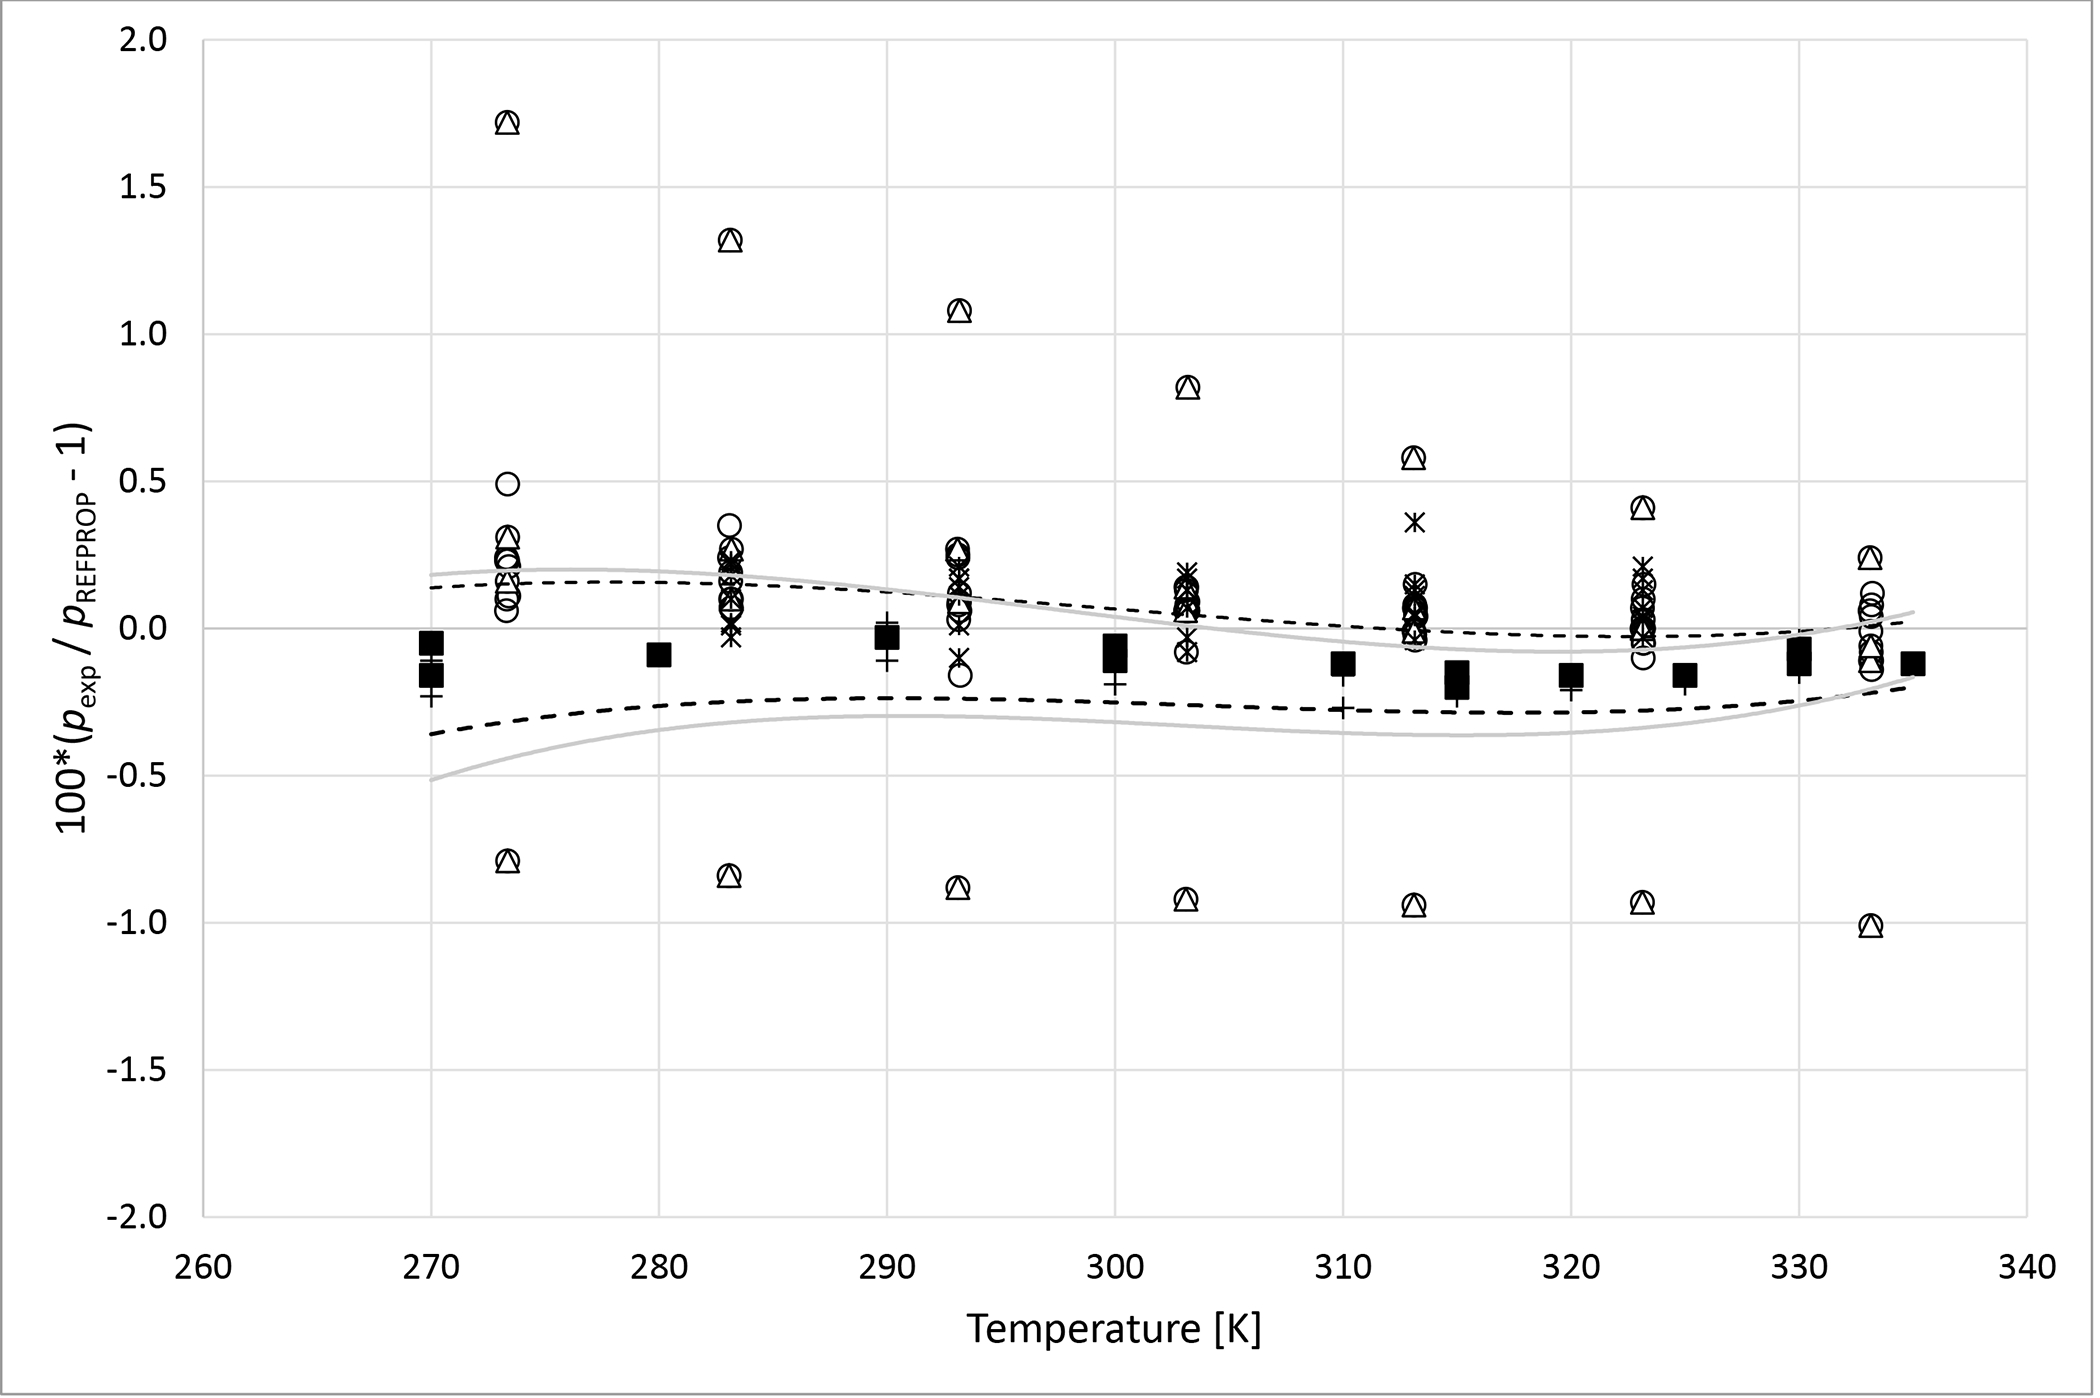
Deviations from pressures calculated with REFPROP5 for the mixture R125 (1) + R1234yf (2) as a function of temperature for data measured in this work ■ (x1 = 0.3495), + (x1 = 0.6635), Kamiaka et al.35 ○, Kamiaka et al.39 Δ and Yang et al.40 *. Dashed curves (- - -) represent approximate experimental uncertainty bounds for x1 = 0.3495 and solid curves for x1 = 0.6635.
Figure 7b.
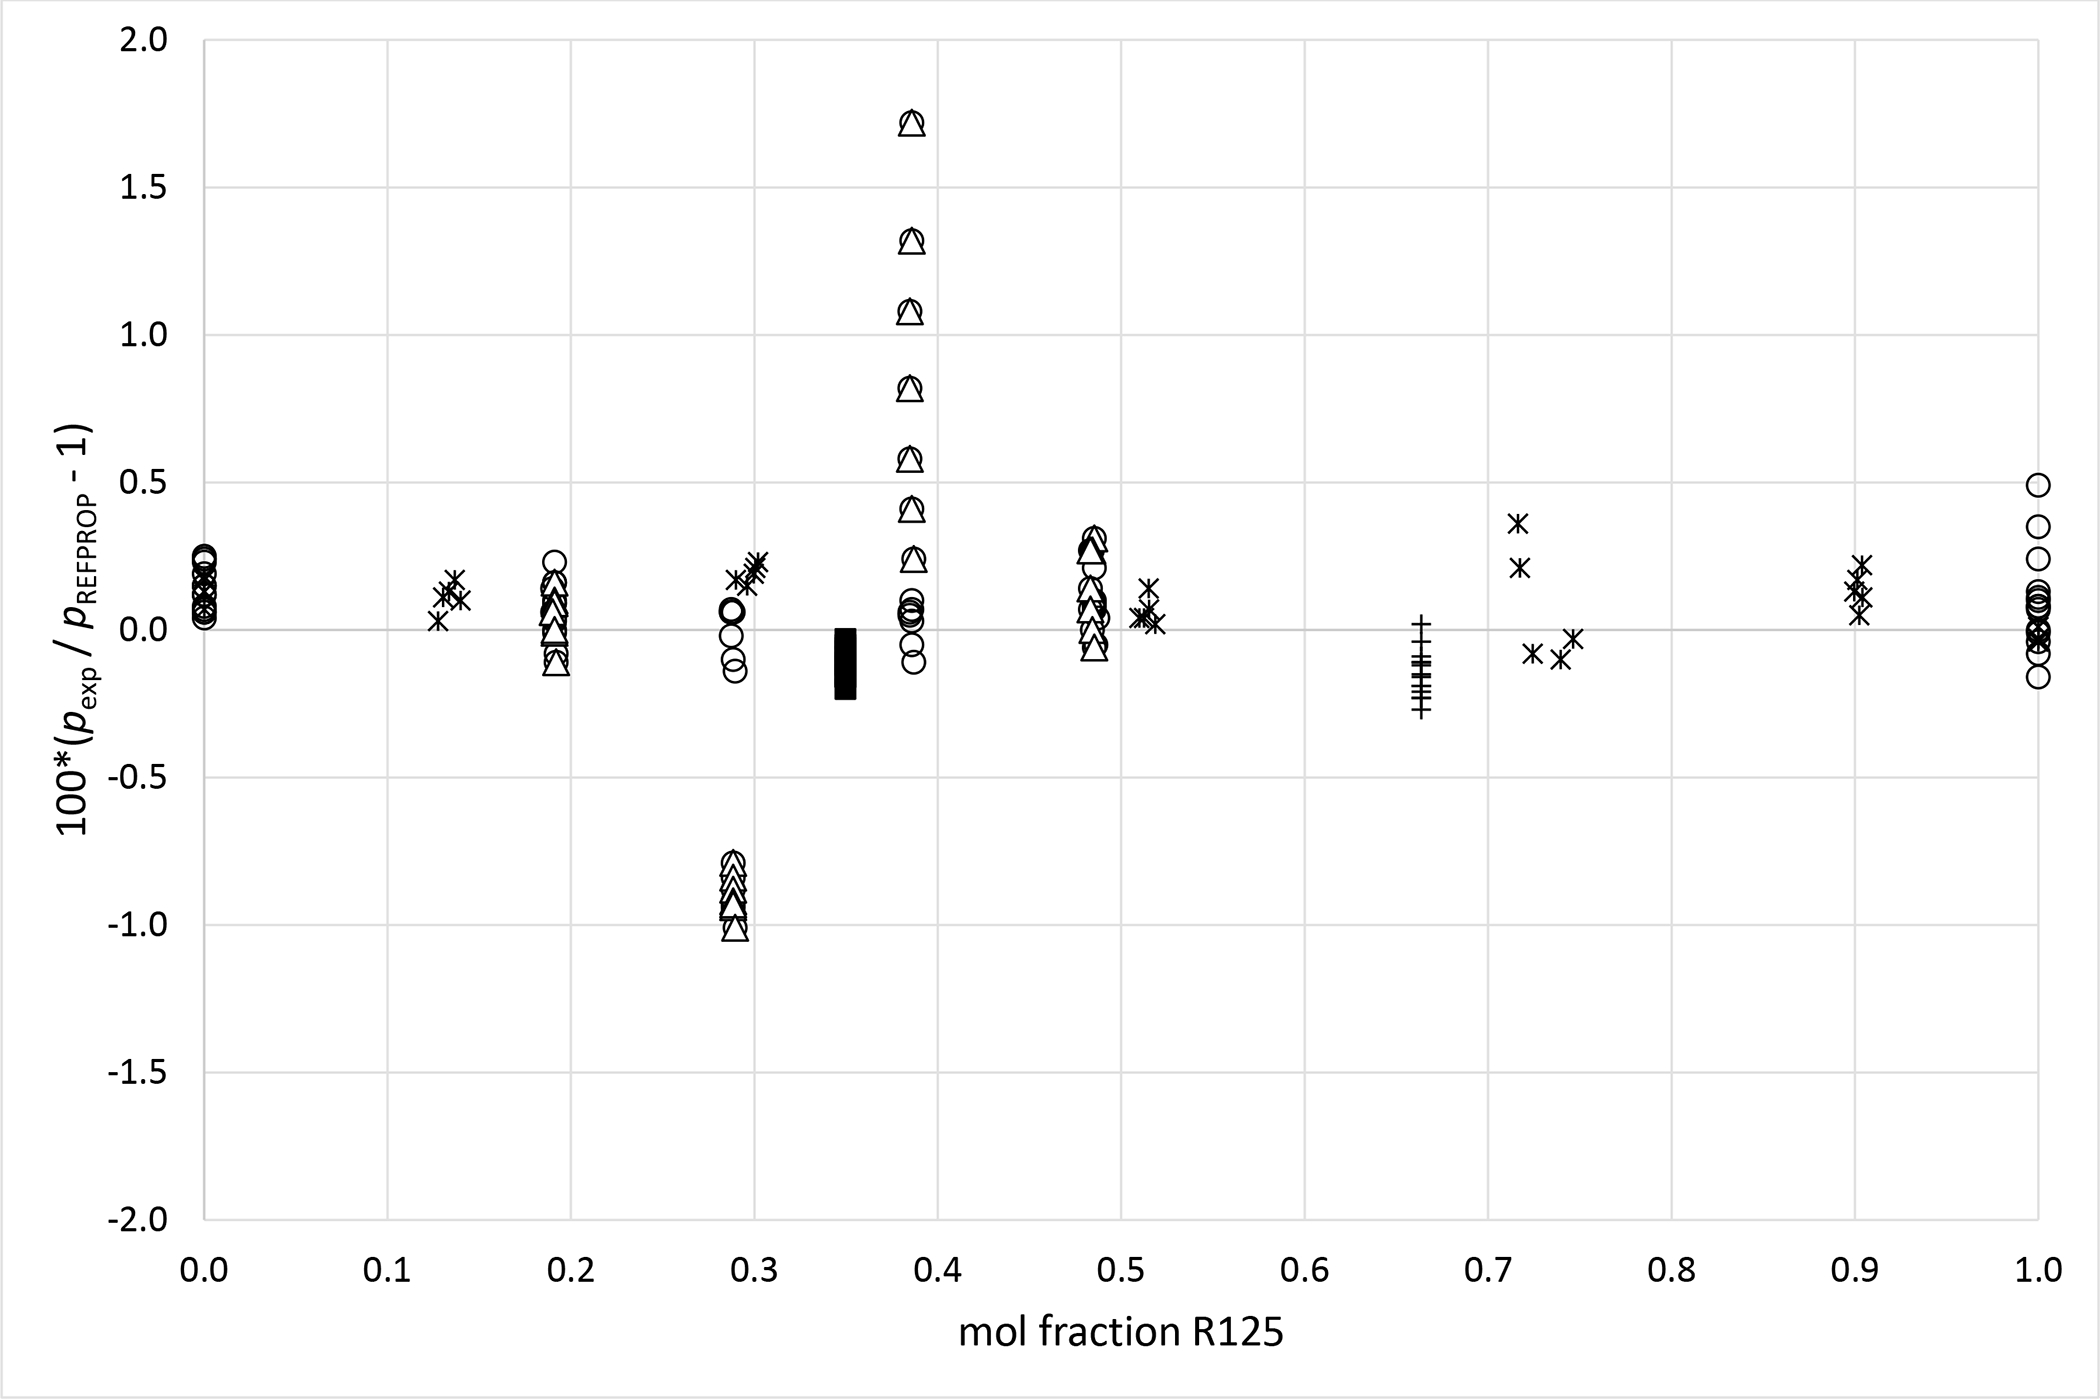
Deviations from pressures calculated with REFPROP5 for the mixture R125 (1) + R1234yf (2) as a function of composition for data measured in this work ■ (x1 = 0.3495), + (x1 = 0.6635), Kamiaka et al.35 ○, Kamiaka et al.39 Δ and Yang et al.40 *.
Figure 8a.
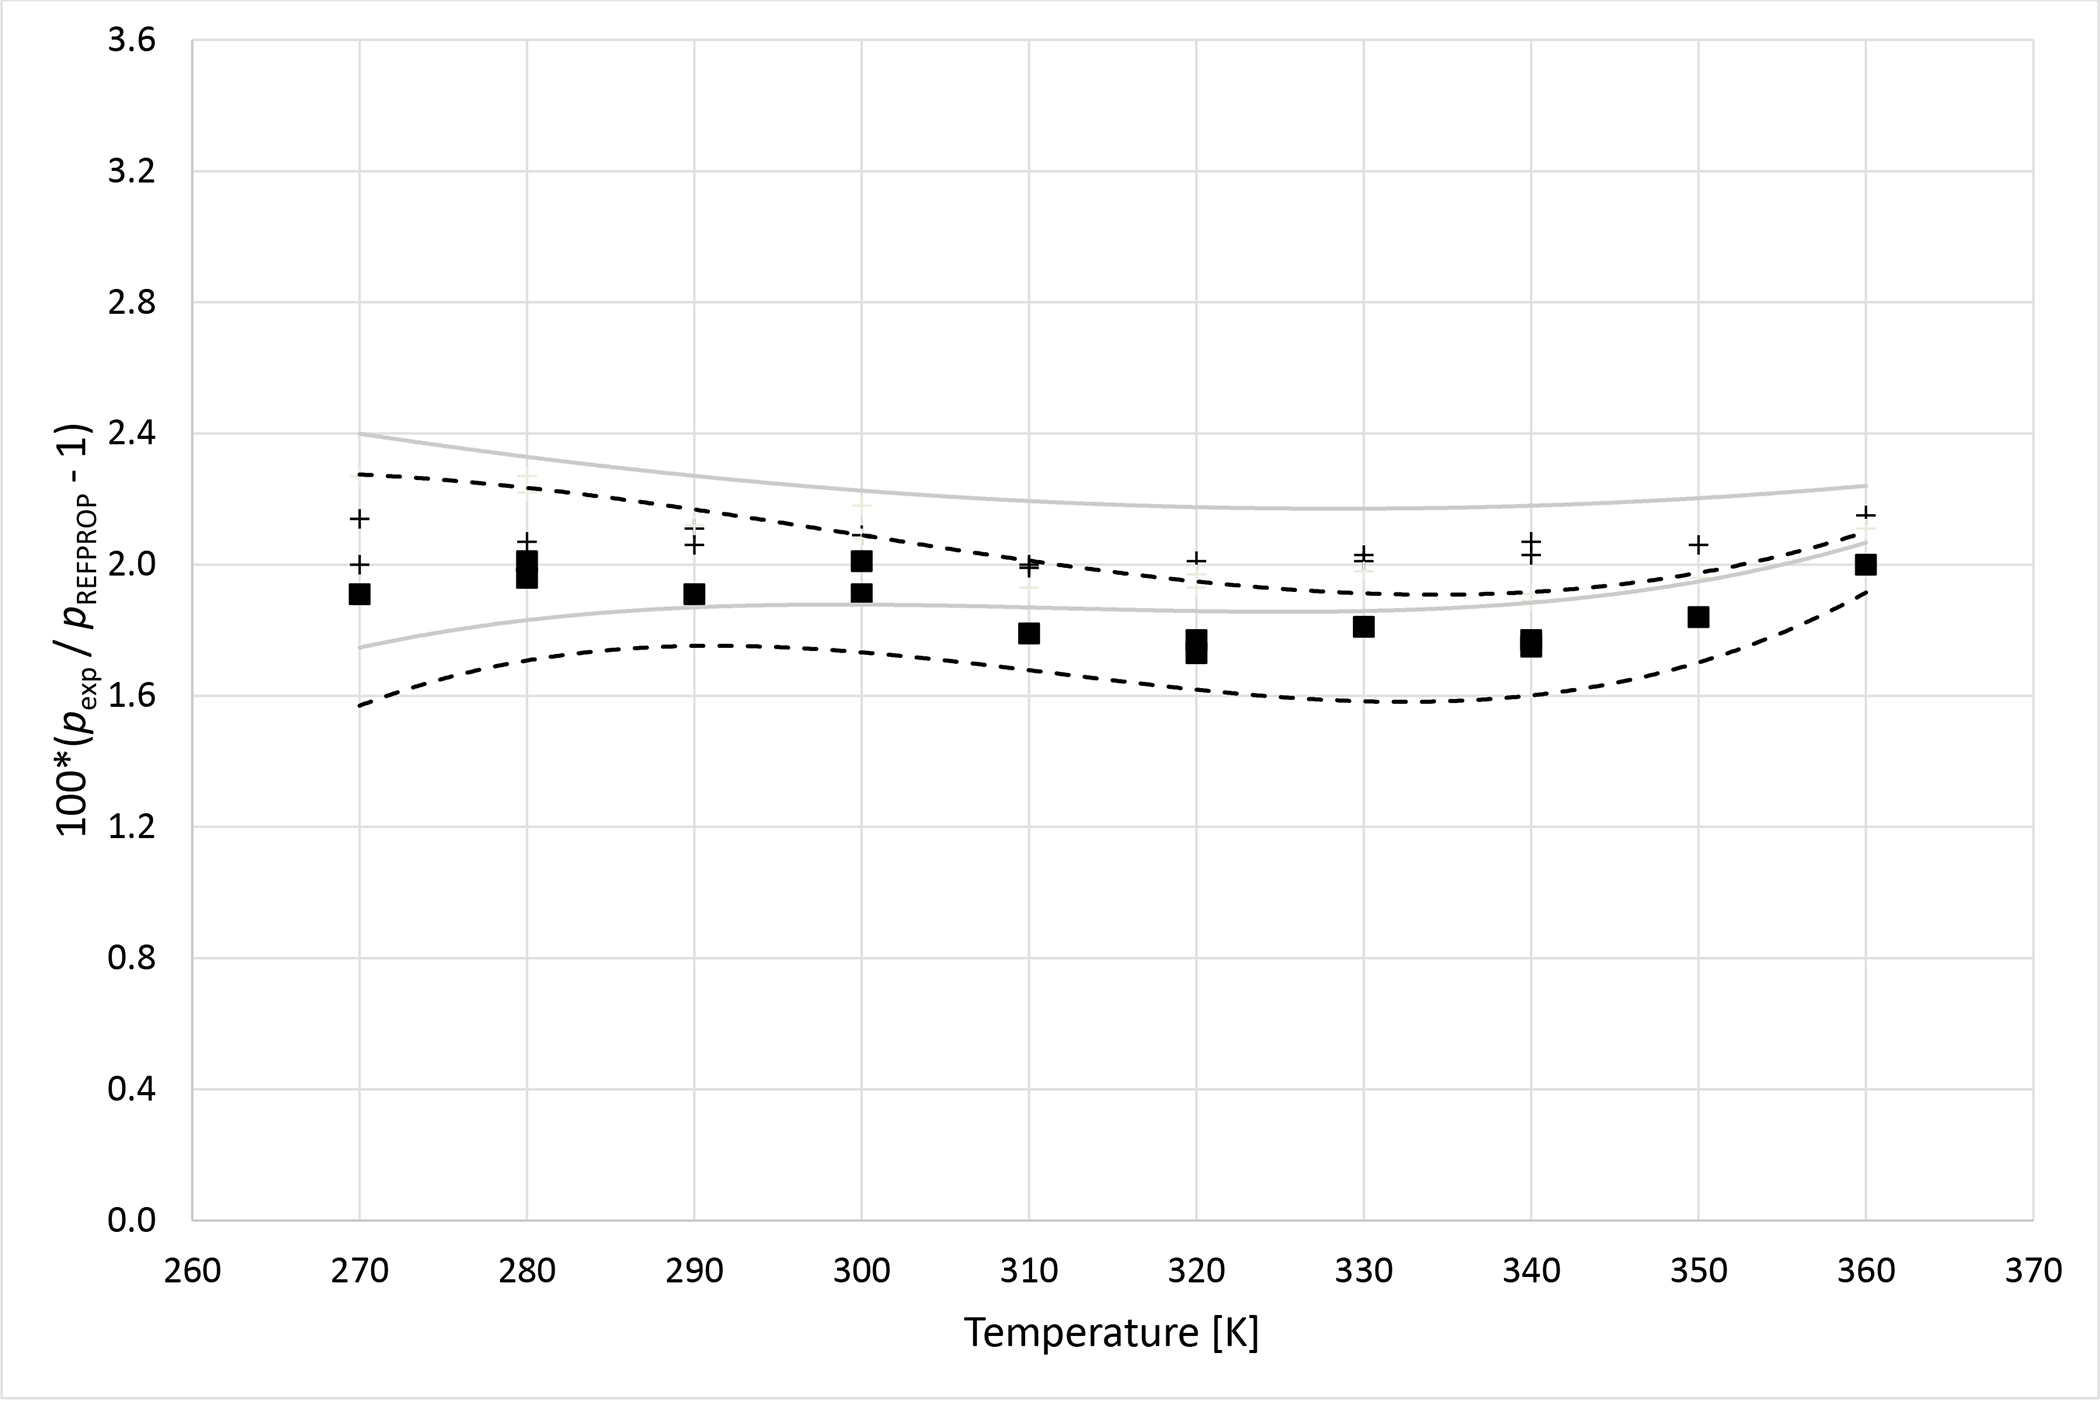
Deviations from pressures calculated with REFPROP5 for the mixture R1234ze (E) (1) + R227ea (2) as a function of temperature for data measured in this work ■ (x1 = 0.3347), + (x1 = 0.6800). Dashed curves (- - -) represent approximate experimental uncertainty bounds for x1 = 0.3347 and solid curves for x1 = 0.6800.
Figure 8b.
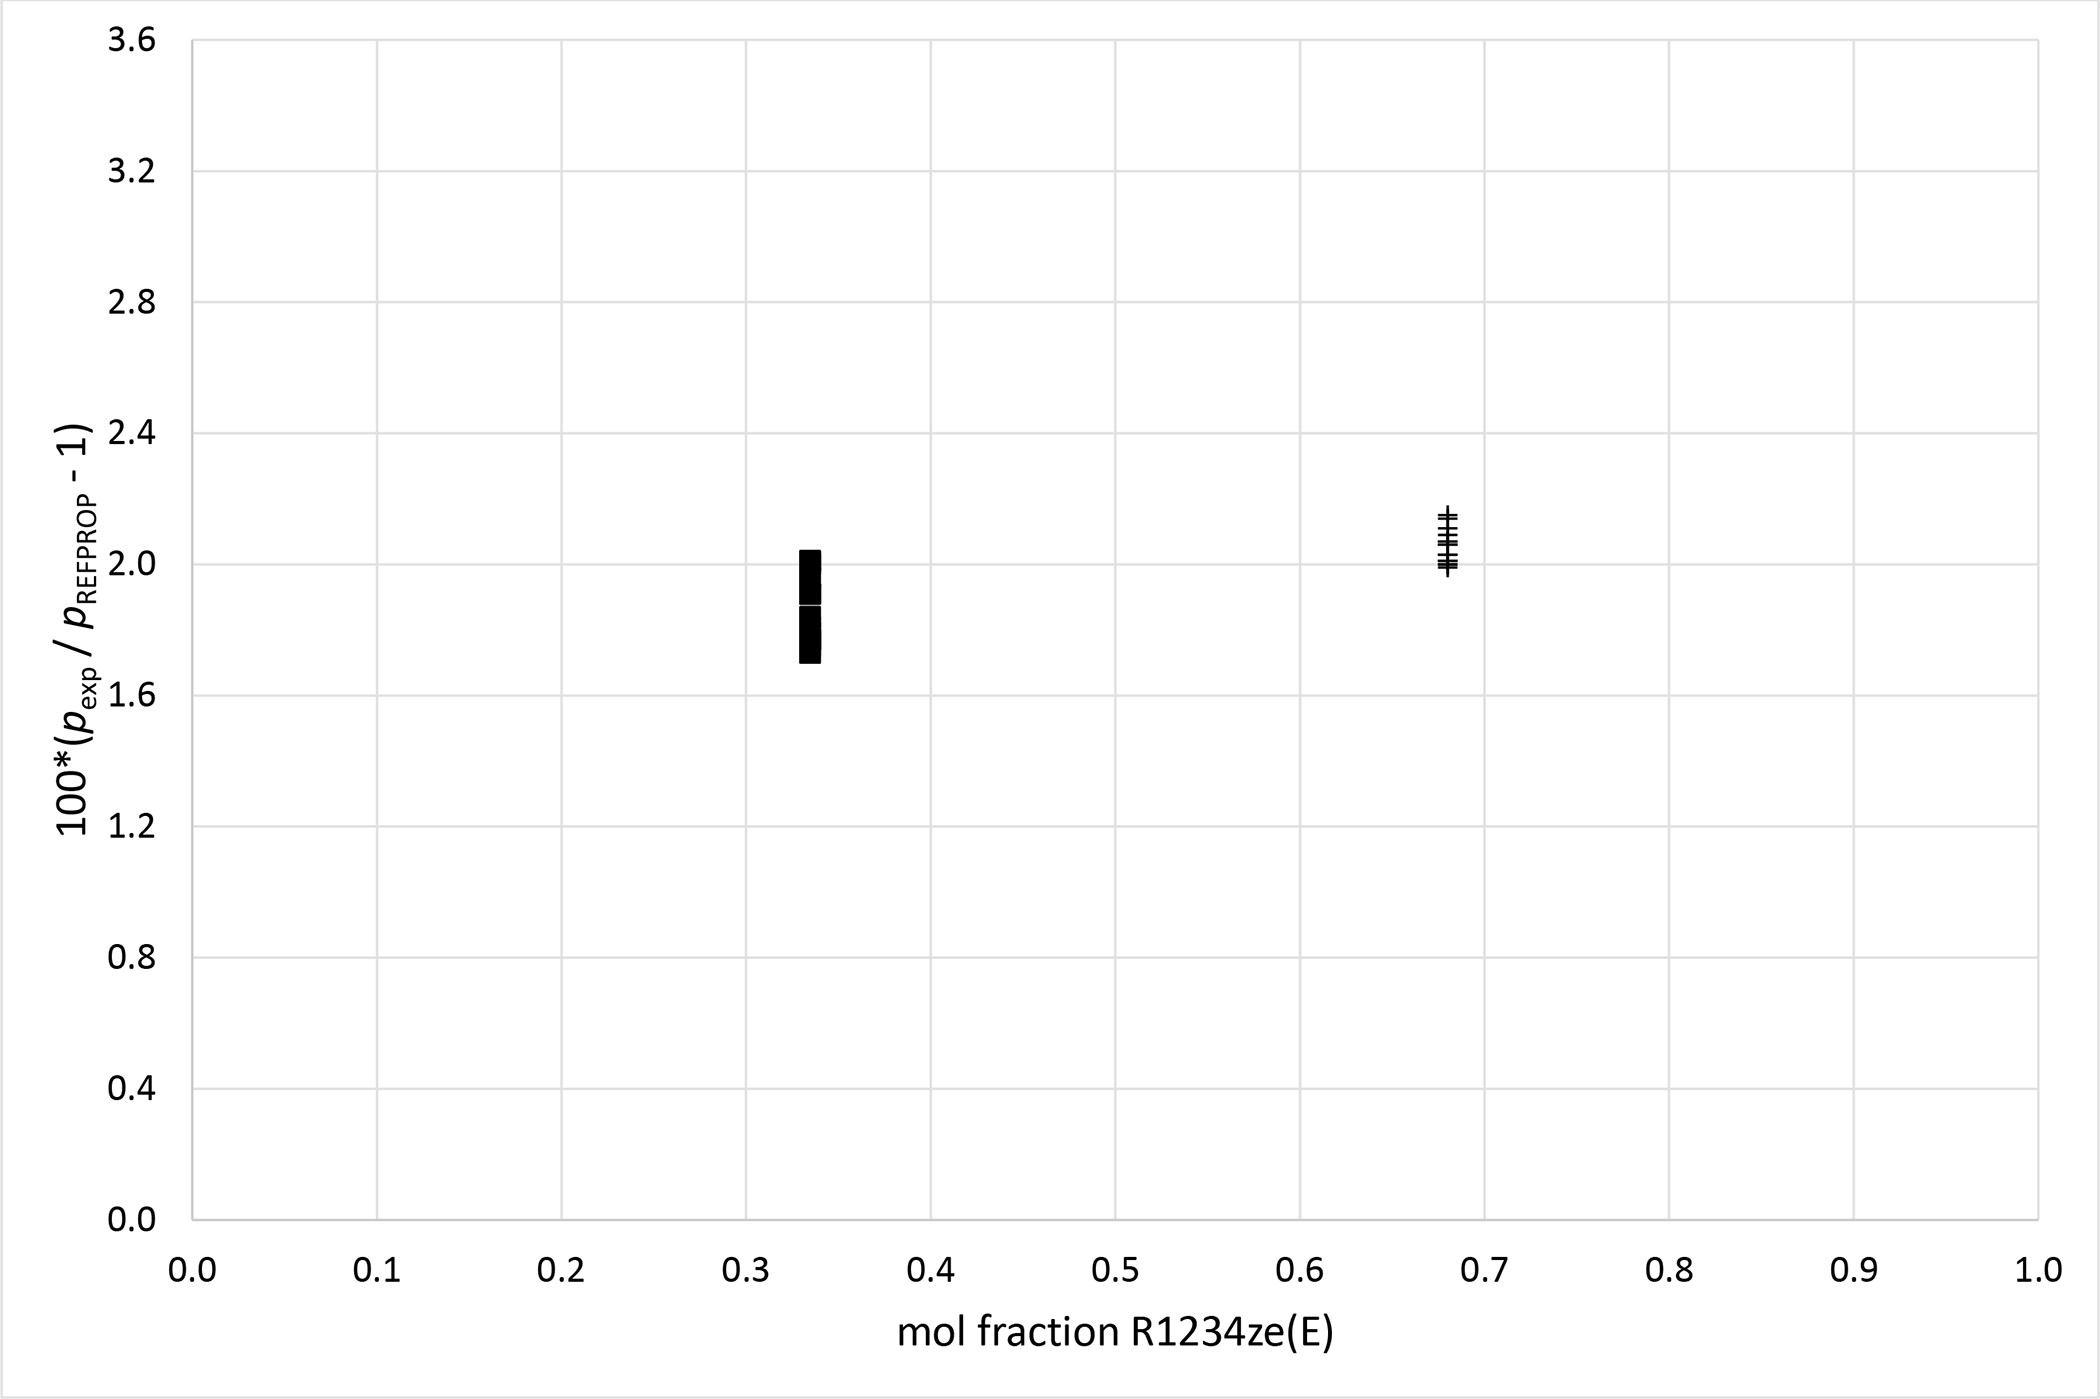
Deviations from pressures calculated with REFPROP5 for the mixture R1234ze (E) (1) + R227ea (2) as a function of composition for data measured in this work ■ (x1 = 0.3347), + (x1 = 0.6800).
Figure 9b.
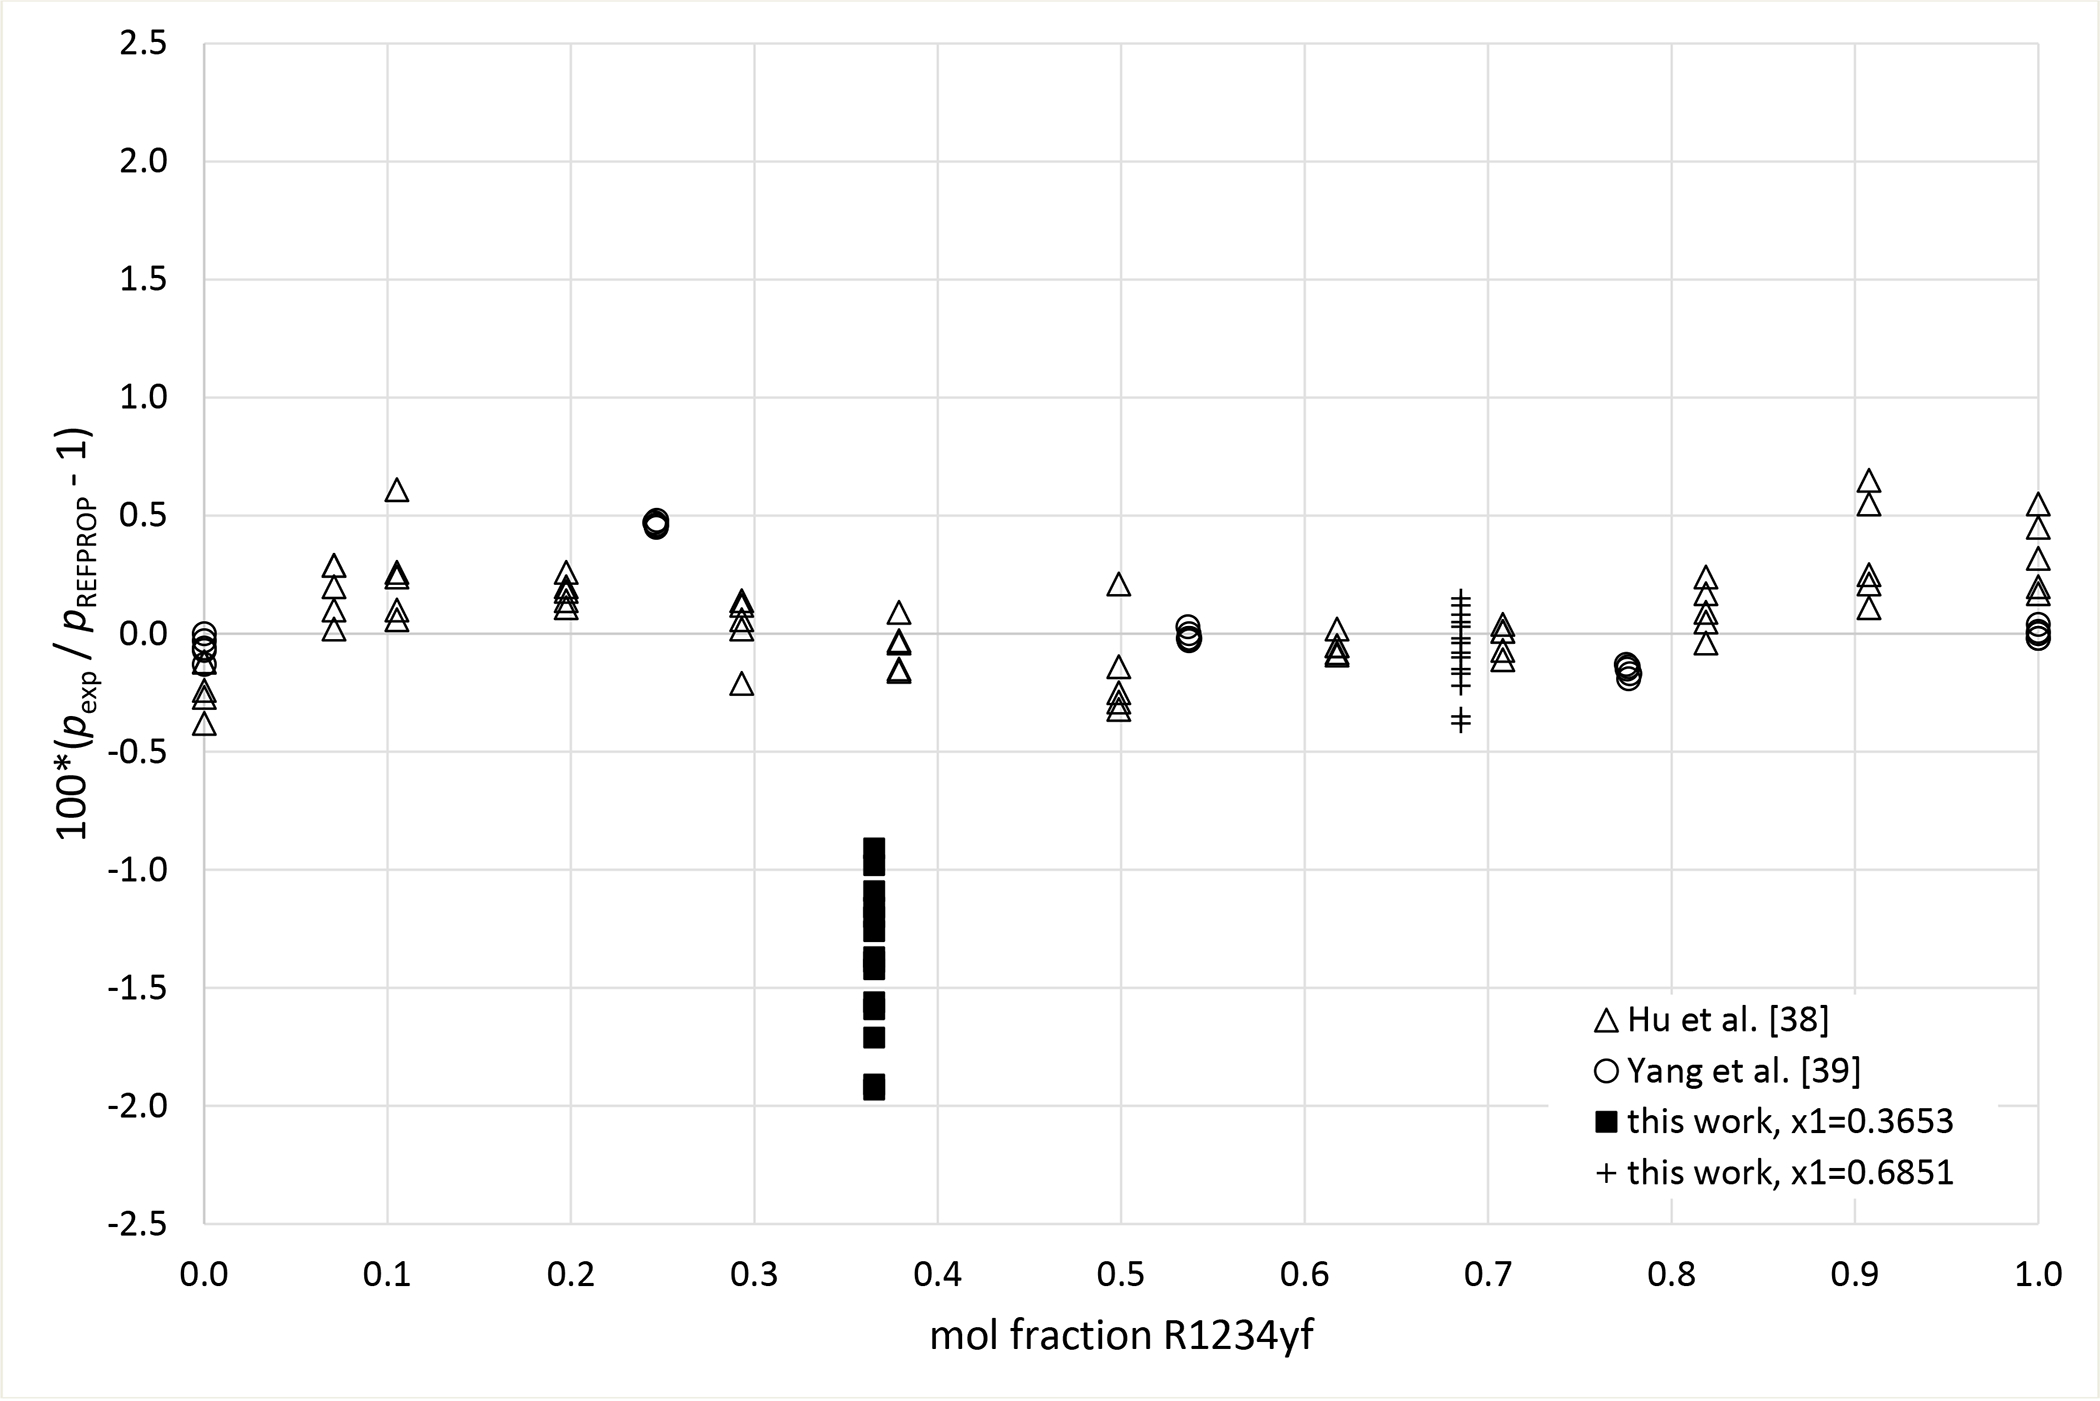
Deviations from pressures calculated with REFPROP5 for the mixture R1234yf (1) + R152a (2) as a function of composition for data measured in this work ■ (x1 = 0.3653), + (x1 = 0.6851), Hu et al.41 Δ and Yang et al.40 ○.
Table 4.
Summary of available literature studies reporting phase behavior data for the R32 + R125 mixture.
| Authors | Year | x R32 | T range | Method | Uc(p)/kPa | Uc(T)/mK | Uc(xi) | ΔAAD | ΔSD | Δbias | Δmax |
|---|---|---|---|---|---|---|---|---|---|---|---|
|
| |||||||||||
| This Study | 2021 | 0.6342 | 265 – 335 | VC | 0.6 – 3.8 | 20 | < 0.0001 | 0.25 | 0.16 | 0.25 | 0.56 |
| Han et al. | 2007 | 0 – 1 | 265 – 303 | GC | 1.4 | 10 | 0.002 | 0.64 | 0.52 | 0.08 | 2.39 |
| Horstmann et al. | 2004 | 0 – 1 | 308 | S | (2+0.1·P)·10−5 | 30 | 0.0001 | 0.20 | 0.12 | 0.20 | 0.56 |
| Kato et al. | 2002 | 0.11 – 0.95 | 318 – 349 | GC | 15 | 20 | USP | 0.64 | 0.39 | −0.50 | 2.34 |
| Jung et al. | 2001 | 0 – 1 | 268 – 308 | GC | 0.40% | 20 | 0.30% | 0.47 | 0.52 | −0.26 | 2.46 |
| Weber | 2000 | 0.42 – 0.88 | 294 – 334 | GC | 0.2 | 10 | 0.005 | 0.37 | 0.16 | 0.37 | 0.77 |
| Benmansour and Richon | 1999 | 0.21 – 0.88 | 253 – 333 | VT | 3 | 20 | 0.0001 | 0.81 | 0.70 | −0.76 | 2.07 |
| Lee et al. | 1999 | 0 – 1 | 303 – 323 | GC | 5 | 10 | USP | 0.73 | 0.61 | −0.32 | 2.33 |
| Takagi et al. | 1999 | 0 – 1 | 248 – 333 | AC | 10 | 20 | 0.0005 | 1.02 | 1.26 | 0.79 | 6.29 |
| Kobayashi and Nishiumi | 1998 | 0 – 1 | 273 – 363 | GC | 6 | 0.05 | 0.007 | 1.15 | 0.85 | 0.73 | 3.83 |
| Shiflett and Sandler | 1998 | 0 – 1 | 258 – 284 | S | 1 | 10 | USP | 0.34 | 0.23 | 0.13 | 0.71 |
| Anonymous | 1997 | 0.70 | 245 – 333 | DE | USP | 20 | USP | 5.21 | 5.49 | −1.06 | 22.42 |
| Benmansour and Richon | 1997 | 0.70 | 253 – 333 | VT | 7 | 20 | USP | 1.42 | 1.00 | −1.42 | 3.85 |
| Higashi | 1997 | 0 – 1 | 283 – 313 | GC | 0.40% | 10 | 0.004 | 0.57 | 0.55 | 0.31 | 1.97 |
| Holcomb et al. | 1997 | 0 – 1 | 280 – 340 | GC | 1 | 20 | 0.004 | 0.89 | 0.78 | 0.07 | 3.58 |
| Kleemiss | 1997 | 0.48 – 0.75 | 223 – 344 | GC | 0.4 | 50 | 0.002 | 0.17 | 0.21 | 0.02 | 0.95 |
| Defibaugh and Morrison | 1995 | 0.76 | 249 – 338 | VC | 0.5 | 50 | USP | 0.34 | 0.13 | −0.27 | 0.55 |
| Nagel and Bier | 1995 | 0 – 1 | 205 – 345 | VC | 6cp 10−4·p+ 0.02 |
60cp 30 |
0.0025 | 0.52 | 0.27 | 0.09 | 1.07 |
| Widiatmo et al. | 1993 | 0.20 – 0.90 | 280 – 310 | VC | 7 | 15 | 0.0004 – 0.003 | 0.34 | 0.31 | 0.22 | 1.03 |
| Fujiwara et al. | 1992 | 0.06 – 0.90 | 263 – 345 | GC | 15 | 50 | 0.01 | 1.73 | 1.13 | 1.73 | 3.83 |
GC – Gas Chromatography, VC- View Cell, VT – Vibrating Tube, S – Static Method, AC – Acoustic, DE – Dielectric, DS – Dual Sinker
USP – Unspecified by the authors’
Critical point
Table 6.
Measured bubble point pressures for the system R134a (1) + R1234ze (E) (2) at temperature T, pressure P, and liquid mole fraction xa.
| x1 = 0.3341 ± 0.0000 | ||||
|
| ||||
| T/K | P/kPa | u(P)/kPa | (u(P)/P)*100 | (Pexp/PEoS − 1)*100 |
|
| ||||
| 269.99 | 222.3 | 0.77 | 0.35 | −0.16 |
| 279.99 | 318.1 | 0.82 | 0.26 | −0.12 |
| 289.99 | 442.8 | 0.90 | 0.20 | −0.09 |
| 299.99 | 601.4 | 0.99 | 0.16 | −0.07 |
| 299.99 | 601.1 | 0.99 | 0.16 | −0.10 |
| 309.99 | 799.6 | 1.32 | 0.17 | −0.02 |
| 319.99 | 1043.7 | 1.82 | 0.17 | 0.05 |
| 319.99 | 1043.0 | 1.82 | 0.17 | −0.01 |
| 329.99 | 1339.6 | 1.96 | 0.15 | 0.12 |
| 339.99 | 1694.3 | 2.13 | 0.13 | 0.19 |
| 349.99 | 2115.3 | 2.35 | 0.11 | 0.22 |
| 359.99 | 2614.9 | 2.60 | 0.10 | 0.37 |
|
| ||||
| x1 = 0.6631 ± 0.0001 | ||||
|
| ||||
| T/K | P/kPa | u(P)/kPa | (u(P)/P)*100 | (Pexp/PEoS − 1)*100 |
|
| ||||
| 269.99 | 244.0 | 0.71 | 0.29 | −0.21 |
| 279.99 | 348.6 | 0.77 | 0.22 | −0.21 |
| 289.99 | 484.6 | 0.86 | 0.18 | −0.19 |
| 289.99 | 484.3 | 0.86 | 0.18 | −0.26 |
| 299.99 | 657.0 | 0.98 | 0.15 | −0.23 |
| 309.99 | 872.8 | 1.33 | 0.15 | −0.20 |
| 309.99 | 872.5 | 1.33 | 0.15 | −0.24 |
| 319.99 | 1138.3 | 1.85 | 0.16 | −0.12 |
| 329.99 | 1460.0 | 2.01 | 0.14 | −0.05 |
| 339.99 | 1846.1 | 2.21 | 0.12 | 0.03 |
| 349.99 | 2304.5 | 2.45 | 0.11 | 0.08 |
| 359.99 | 2843.2 | 2.75 | 0.10 | 0.03 |
Standard uncertainties u are u(T) = 0.02 K, values of u(p) and u(x1) are given in the table.
Table 7.
Measured bubble point pressures for the system R-1234yf (1) + R1234ze(E) (2) at temperature T, pressure P, and liquid mole fraction xa.
| x1 = 0.3241 ± 0.0001 | ||||
|
| ||||
| T/K | p/kPa | u(p)/kPa | (u(p)/p)*100 | (1− p exp/ pEoS)*100 |
|
| ||||
| 270.00 | 229.5 | 0.83 | 0.36 | −2.73 |
| 270.00 | 229.5 | 0.83 | 0.36 | −2.70 |
| 280.00 | 325.4 | 0.88 | 0.27 | −2.48 |
| 280.00 | 325.5 | 0.88 | 0.27 | −2.45 |
| 290.00 | 449.1 | 0.95 | 0.21 | −2.34 |
| 290.00 | 449.2 | 0.95 | 0.21 | −2.31 |
| 300.00 | 605.7 | 1.04 | 0.17 | −2.18 |
| 300.00 | 605.4 | 1.04 | 0.17 | −2.23 |
| 310.00 | 799.6 | 1.35 | 0.17 | −2.11 |
| 310.00 | 799.1 | 1.35 | 0.17 | −2.17 |
| 320.00 | 1038.6 | 1.82 | 0.18 | −1.89 |
| 320.00 | 1037.1 | 1.82 | 0.18 | −2.03 |
| 330.00 | 1325.4 | 1.95 | 0.15 | −1.83 |
| 330.00 | 1324.7 | 1.95 | 0.15 | −1.89 |
| 340.00 | 1669.5 | 2.12 | 0.13 | −1.72 |
| 340.00 | 1667.8 | 2.12 | 0.13 | −1.81 |
| 340.00 | 1668.5 | 2.12 | 0.13 | −1.77 |
| 350.00 | 2077.0 | 2.32 | 0.11 | −1.62 |
| 350.00 | 2076.2 | 2.32 | 0.11 | −1.66 |
| 360.00 | 2556.7 | 2.57 | 0.10 | −1.55 |
| 360.00 | 2557.1 | 2.57 | 0.10 | −1.54 |
|
| ||||
| x1 = 0.6382 ± 0.0003 | ||||
|
| ||||
| T/K | P/kPa | u(P)/kPa | (u(P)/P)*100 | (Pexp/PEoS − 1)*100 |
|
| ||||
| 270.00 | 258.9 | 1.49 | 0.58 | −1.73 |
| 270.00 | 258.0 | 1.49 | 0.58 | −2.04 |
| 280.00 | 363.5 | 1.52 | 0.42 | −1.78 |
| 280.00 | 362.9 | 1.52 | 0.42 | −1.92 |
| 280.00 | 362.8 | 1.52 | 0.42 | −1.94 |
| 290.00 | 497.8 | 1.56 | 0.31 | −1.75 |
| 290.00 | 497.1 | 1.56 | 0.31 | −1.89 |
| 290.00 | 497.0 | 1.56 | 0.31 | −1.90 |
| 300.00 | 666.3 | 1.63 | 0.24 | −1.76 |
| 300.00 | 665.7 | 1.63 | 0.24 | −1.86 |
| 300.00 | 665.6 | 1.63 | 0.24 | −1.87 |
| 310.00 | 874.6 | 1.85 | 0.21 | −1.77 |
| 310.00 | 873.8 | 1.85 | 0.21 | −1.86 |
| 310.00 | 873.7 | 1.85 | 0.21 | −1.87 |
| 320.00 | 1128.8 | 2.22 | 0.20 | −1.71 |
| 320.00 | 1127.8 | 2.22 | 0.20 | −1.80 |
| 320.00 | 1127.7 | 2.22 | 0.20 | −1.81 |
| 330.00 | 1435.4 | 2.34 | 0.16 | −1.61 |
| 330.00 | 1434.0 | 2.34 | 0.16 | −1.70 |
| 330.00 | 1434.0 | 2.34 | 0.16 | −1.70 |
| 340.00 | 1800.0 | 2.50 | 0.14 | −1.58 |
| 340.00 | 1798.8 | 2.50 | 0.14 | −1.64 |
| 340.00 | 1799.1 | 2.50 | 0.14 | −1.63 |
| 350.00 | 2229.1 | 2.69 | 0.12 | −1.64 |
| 350.00 | 2231.3 | 2.69 | 0.12 | −1.54 |
| 360.00 | 2734.0 | 2.94 | 0.11 | −1.71 |
| 360.00 | 2738.9 | 2.94 | 0.11 | −1.54 |
Standard uncertainties u are u(T) = 0.02 K, values of u(p) and u(x1) are given in the table.
Table 8.
Measured bubble point pressures for the system R125 (1) + R1234yf (2) at temperature T, pressure P, and liquid mole fraction xa.
| x1 = 0.3495 ± 0.0004 | ||||
|
| ||||
| T/K | p/kPa | u(p)/kPa | (u(p)/p)*100 | (1− p exp/ pEoS)*100 |
|
| ||||
| 270.00 | 393.4 | 1.08 | 0.27 | −0.16 |
| 270.00 | 393.8 | 1.08 | 0.27 | −0.05 |
| 280.00 | 542.2 | 1.15 | 0.21 | −0.09 |
| 290.00 | 729.5 | 1.44 | 0.20 | −0.03 |
| 300.00 | 959.9 | 1.55 | 0.16 | −0.11 |
| 300.00 | 960.4 | 1.55 | 0.16 | −0.06 |
| 310.00 | 1240.8 | 1.70 | 0.14 | −0.12 |
| 315.00 | 1401.0 | 2.07 | 0.15 | −0.20 |
| 315.00 | 1401.8 | 2.07 | 0.15 | −0.15 |
| 320.00 | 1577.9 | 2.15 | 0.14 | −0.16 |
| 325.00 | 1770.1 | 2.24 | 0.13 | −0.16 |
| 330.00 | 1979.7 | 2.34 | 0.12 | −0.12 |
| 330.00 | 1980.8 | 2.34 | 0.12 | −0.07 |
| 335.00 | 2206.6 | 2.46 | 0.11 | −0.12 |
|
| ||||
| x1 = 0.6635 ± 0.0005 | ||||
|
| ||||
| T/K | P/kPa | u(P)/kPa | (u(P)/P)*100 | (Pexp/PEoS − 1)*100 |
|
| ||||
| 270.00 | 494.0 | 1.82 | 0.37 | −0.23 |
| 270.00 | 494.6 | 1.82 | 0.37 | −0.11 |
| 280.00 | 677.4 | 1.89 | 0.28 | −0.09 |
| 290.00 | 905.9 | 2.10 | 0.23 | −0.11 |
| 290.00 | 907.0 | 2.10 | 0.23 | 0.02 |
| 300.00 | 1186.1 | 2.22 | 0.19 | −0.19 |
| 310.00 | 1525.9 | 2.37 | 0.16 | −0.27 |
| 310.00 | 1527.6 | 2.37 | 0.16 | −0.16 |
| 315.00 | 1721.4 | 2.68 | 0.16 | −0.23 |
| 320.00 | 1935.0 | 2.77 | 0.14 | −0.21 |
| 325.00 | 2167.5 | 2.87 | 0.13 | −0.19 |
| 330.00 | 2421.0 | 2.99 | 0.12 | −0.15 |
| 330.00 | 2423.6 | 2.99 | 0.12 | −0.04 |
| 335.00 | 2695.5 | 3.12 | 0.12 | −0.12 |
Standard uncertainties u are u(T) = 0.02 K, values of u(p) and u(x1) are given in the table.
Table 9.
Measured bubble point pressures for the system R1234ze (E) (1) + R227ea (2) at temperature T, pressure P, and liquid mole fraction xa.
| x1 = 0.3347 ± 0.0000 | ||||
|
| ||||
| T/K | p/kPa | u(p)/kPa | (u(p)/p)*100 | (1− p exp/ pEoS)*100 |
|
| ||||
| 270.00 | 183.2 | 0.66 | 0.36 | 1.91 |
| 280.00 | 264.2 | 0.70 | 0.26 | 1.96 |
| 280.00 | 264.4 | 0.70 | 0.26 | 2.01 |
| 290.00 | 370.0 | 0.76 | 0.21 | 1.91 |
| 300.00 | 505.5 | 0.84 | 0.17 | 1.91 |
| 300.00 | 506.0 | 0.84 | 0.17 | 2.01 |
| 310.00 | 674.8 | 0.95 | 0.14 | 1.79 |
| 320.00 | 884.2 | 1.79 | 0.20 | 1.77 |
| 320.00 | 883.9 | 1.79 | 0.20 | 1.73 |
| 330.00 | 1139.5 | 1.89 | 0.17 | 1.81 |
| 340.00 | 1445.8 | 2.03 | 0.14 | 1.77 |
| 340.00 | 1445.5 | 2.03 | 0.14 | 1.75 |
| 350.00 | 1812.4 | 2.20 | 0.12 | 1.84 |
| 360.00 | 2249.2 | 2.41 | 0.11 | 2.00 |
|
| ||||
| x1 = 0.6800 ± 0.0000 | ||||
|
| ||||
| T/K | P/kPa | u(P)/kPa | (u(P)/P)*100 | (Pexp/PEoS − 1)*100 |
|
| ||||
| 270.00 | 189.7 | 0.63 | 0.33 | 2.00 |
| 270.00 | 190.0 | 0.63 | 0.33 | 2.14 |
| 280.00 | 273.3 | 0.68 | 0.25 | 2.07 |
| 290.00 | 382.3 | 0.74 | 0.19 | 2.06 |
| 290.00 | 382.5 | 0.74 | 0.19 | 2.11 |
| 300.00 | 521.8 | 0.83 | 0.16 | 2.09 |
| 310.00 | 695.9 | 1.18 | 0.17 | 1.99 |
| 310.00 | 696.0 | 1.18 | 0.17 | 2.00 |
| 320.00 | 911.4 | 1.74 | 0.19 | 2.01 |
| 330.00 | 1173.5 | 1.85 | 0.16 | 2.03 |
| 330.00 | 1173.3 | 1.85 | 0.16 | 2.01 |
| 340.00 | 1488.9 | 1.99 | 0.13 | 2.07 |
| 340.00 | 1488.3 | 1.99 | 0.13 | 2.03 |
| 350.00 | 1863.7 | 2.17 | 0.12 | 2.06 |
| 360.00 | 2309.0 | 2.39 | 0.10 | 2.15 |
Standard uncertainties u are u(T) = 0.02 K, values of u(p) and u(x1) are given in the table.
Acknowledgements:
We thank Drs Megan Harries and Jason Widegren for providing analysis of the pure fluids used to prepare the binary mixtures studied in this work. We also thank Dr. Ian Bell for providing the available literature data pertinent to this work.
This work was partially supported by the Strategic Environmental Research and Development Program; Project WP19-1385: WP-2740 Follow-On: Low-GWP Alternative Refrigerant Blends for HFC-134a.
Footnotes
Contribution of the National Institute of Standards and Technology. Not subject to Copyright in the U.S.A.
Certain commercial equipment, instruments, or materials are identified in this paper only for completeness of scientific description. Such identification implies neither recommendation nor endorsement by the National Institute of Standards and Technology, nor that the materials or equipment identified are necessarily the best available for the purpose.
References:
- 1.Bell IH; Domanski PA; McLinden MO; Linteris GT, The hunt for nonflammable refrigerant blends to replace R-134a. International Journal of Refrigeration 2019, 104, 484–495. [DOI] [PMC free article] [PubMed] [Google Scholar]
- 2.Bell I; Domanski P; Linteris G; McLinden M, Evaluation of binary and ternary refrigerant blends as replacements for R134a in an air-conditioning system. In 17th International Refrigeration and Air Conditioning Conference at Purdue, West Lafayette, IN, 2018. [Google Scholar]
- 3.Brignoli R; Brown JS; Skye HM; Domanski PA, Refrigerant performance evaluation including effects of transport properties and optimized heat exchangers. International Journal of Refrigeration 2017, 80, 52–65. [DOI] [PMC free article] [PubMed] [Google Scholar]
- 4.Lin CW; Trusler JPM, The speed of sound and derived thermodynamic properties of pure water at temperatures between (253 and 473) K and at pressures up to 400 MPa. The Journal of Chemical Physics 2012, 136 (9), 094511. [DOI] [PubMed] [Google Scholar]
- 5.Lemmon EW; Bell IH; Huber ML; McLinden MO NIST Standard Reference Database 23: Reference Fluid Thermodynamic and Transport Properties-REFPROP, Version 10.0; National Institute of Standards and Technology, Standard Reference Data Program: Gaithersburg, 2018. [Google Scholar]
- 6.Stein SE NIST/EPA/NIH Mass Spectral Library with Search Program, NIST Standard Reference Database 1A, National Institute of Standards and Technology: Gaithersburg, MD, 2005. [Google Scholar]
- 7.Bruno TJ; Svoronos PDN, CRC Handbook of Basic Tables for Chemical Analysis. 3rd ed.; Taylor and Francis, CRC Press: Boca Raton, FL, 2011. [Google Scholar]
- 8.Harris GL; Torres JA Selected laboratory and measurement practices and procedures to support basic mass calibrations, NIST-IR 6969; NIST: Boulder, CO, 2003. [Google Scholar]
- 9.Outcalt SL; Lemmon EW, Bubble-Point Measurements of Eight Binary Mixtures for Organic Rankine Cycle Applications. Journal of Chemical & Engineering Data 2013, 58 (6), 1853–1860. [Google Scholar]
- 10.Hust JG; Filla J; Smith DR, A Modified Digital PID Temperature Controller for Thermal Properties Measurements. J. Thermal Insulation 1987, 11, 102–107. [Google Scholar]
- 11.Taylor BN; Kuyatt CE Guidelines for Evaluating and Expressing the Uncertainty of NIST Measurement Results; NIST Technical Note 1297; U.S. Department of Commerce; Washington, DC, 1994. [Google Scholar]
- 12.Outcalt SL; Lee BC, A Small-Volume Apparatus for the Measurement of Phase Equilibria. J. Res. Natl. Inst. Stand. Technol. 2004, 109, 525–531. [DOI] [PMC free article] [PubMed] [Google Scholar]
- 13.Anonymous Thermophysical properties of AZ-20; Texas A&M University: College Station, TX, 1997. [Google Scholar]
- 14.Benmansour S; Richon D, Vapor-Liquid Equilibria and Densities for Difluoromethane (R-32, 49.8 wt. %) + Pentafluoroethane (R-125, 50.2 wt. %) Mixture (R-410A) at Temperatures Between 253 K and 333 K and Pressures up to 20 MPa. ELDATA: The International Electronic Journal of Physico-Chemical Data 1997, 3, 149–158. [Google Scholar]
- 15.Benmansour S; Richon D, Vapor-Liquid Equilibria and Densities for Difluoromethane (R-32) + Pentafluoroethane (R-125) Binary Mixtures at Temperatures Between 253 K and 333 K and Pressures up to 20 MPa. ELDATA: The International Electronic Journal of Physico-Chemical Data 1999, 5, 9–18. [Google Scholar]
- 16.Defibaugh DR; Morrison G, Interaction coefficients for 15 mixtures of flammable and non-flammable components. International Journal of Refrigeration 1995, 18 (8), 518–523. [Google Scholar]
- 17.Fujiwara K; Momota H; Noguchi M In Vapor-Liquid Equilibria of HFC-32 Mixtures, 13th Japan Symp. Thermophys. Props., 1992; 1992; pp 61–64. [Google Scholar]
- 18.Han X; Chen G; Cui X; Wang Q, Vapor−Liquid Equilibrium Data for the Binary Mixture Difluoroethane (HFC-32) + Pentafluoroethane (HFC-125) of an Alternative Refrigerant. Journal of Chemical & Engineering Data 2007, 52 (6), 2112–2116. [Google Scholar]
- 19.Higashi Y, Vapor−Liquid Equilibrium, Coexistence Curve, and Critical Locus for Difluoromethane + Pentafluoroethane (R-32 + R-125). Journal of Chemical & Engineering Data 1997, 42 (6), 1269–1273. [Google Scholar]
- 20.Holcomb CD; Magee JW; Scott JL; Outcalt SL; Haynes WM, Selected Thermodynamic Properties for Mixtures of R32 (Difluoromethane), R125 (Pentafluoroethane), R134a (1,1,12-Tetrafluoroethane, R-143a (1,1,1-Trifluoroethane), R-41 (Fluoromethane), R-290 (Propane), and R-744 (Carbon Dioxide). NIST Technical Note 1397 1997, 200 pp. [Google Scholar]
- 21.Horstmann S; Wilken M; Fischer K; Gmehling J, Isothermal Vapor−Liquid Equilibrium and Excess Enthalpy Data for the Binary Systems Propylene Oxide + 2-Methylpentane and Difluoromethane (R32) + Pentafluoroethane (R125). Journal of Chemical & Engineering Data 2004, 49 (6), 1504–1507. [Google Scholar]
- 22.Jung MY; Kim CN; Park YM; Yoo JS, Vapor−Liquid Equilibria for the Difluoromethane (HFC-32) + Pentafluoroethane (HFC-125) System. Journal of Chemical & Engineering Data 2001, 46 (3), 750–753. [Google Scholar]
- 23.Kleemiss M Thermodynamic Properties of Two Ternary Refrigerant Mixtures: Measurements and Equations of State; VDI Verlag GmbH: Dusseldorf, 1997. [Google Scholar]
- 24.Nagel M; Bier K, Vapour-liquid equilibrium of ternary mixtures of the refrigerants R32, R125 and R134a. International Journal of Refrigeration 1995, 18 (8), 534–543. [Google Scholar]
- 25.Kato R; Shirakawa K; Nishiumi H, Corrigendum: Corrigendum to “Critical locus and vapor–liquid equilibria of HFC32–HFC125 system” [Fluid Phase Equilib. 194–197 (2002) 995–1008]. Fluid Phase Equilibria 2004, 221 (1), 207. [Google Scholar]
- 26.Kobayashi M; Nishiumi H, Vapor–liquid equilibria for the pure, binary and ternary systems containing HFC32, HFC125 and HFC134a. Fluid Phase Equilibria 1998, 144 (1), 191–202. [Google Scholar]
- 27.Lee BG; Park JY; Lim JS; Cho SY; Park KY, Phase Equilibria of Chlorofluorocarbon Alternative Refrigerant Mixtures. Journal of Chemical & Engineering Data 1999, 44 (2), 190–192. [Google Scholar]
- 28.Shiflett MB; Sandler SI, Modeling fluorocarbon vapor–liquid equilibria using the Wong–Sandler model. Fluid Phase Equilibria 1998, 147 (1), 145–162. [Google Scholar]
- 29.Takagi T; Sakura T; Tsuji T; Hongo M, Bubble point pressure for binary mixtures of difluoromethane with pentafluoroethane and 1,1,1,2-tetrafluoroethane. Fluid Phase Equilibria 1999, 162 (1), 171–179. [Google Scholar]
- 30.Weber F, Simultaneous measurement of pressure, liquid and vapour density along the vapour–liquid equilibrium curve of binary mixtures of R32 and R125 of different composition. Fluid Phase Equilibria 2000, 174 (1), 165–173. [Google Scholar]
- 31.Widiatmo JV; Sato H; Watanabe K, Saturated-liquid Densities and Bubble-point Pressures of the Binary System HFC-32 + HFC-125. High Temp. High Pressures 1993, 25, 677–683. [Google Scholar]
- 32.Tillner-Roth R; Yokozeki A, An International Standard Equation of State for Difluoromethane (R-32) for Temperatures from the Triple Point at 136.34 K to 435 K and Pressures up to 70 MPa. Journal of Physical and Chemical Reference Data 1997, 26 (6), 1273–1328. [Google Scholar]
- 33.Lemmon EW; Jacobsen RT, A New Functional Form and New Fitting Techniques for Equations of State with Application to Pentafluoroethane (HFC-125). Journal of Physical and Chemical Reference Data 2005, 34 (1), 69–108. [Google Scholar]
- 34.Lemmon EW; Jacobsen RT, Equations of State for Mixtures of R-32, R-125, R-134a, R-143a, and R-152a. Journal of Physical and Chemical Reference Data 2004, 33 (2), 593–620. [Google Scholar]
- 35.Kamiaka T; Dang C; Hihara E, Vapor-liquid equilibrium measurements for binary mixtures of R1234yf with R32, R125, and R134a. International Journal of Refrigeration 2013, 36 (3), 965–971. [Google Scholar]
- 36.Al Ghafri SZS; Rowland D; Akhfash M; Arami-Niya A; Khamphasith M; Xiao X; Tsuji T; Tanaka Y; Seiki Y; May EF; Hughes TJ, Thermodynamic properties of hydrofluoroolefin (R1234yf and R1234ze(E)) refrigerant mixtures: Density, vapour-liquid equilibrium, and heat capacity data and modelling. International Journal of Refrigeration 2019, 98, 249–260. [Google Scholar]
- 37.Kou L; Yang Z; Tang X; Zhang W; Lu J, Experimental measurements and correlation of isothermal vapor-liquid equilibria for HFC-32 + HFO-1234ze (E) and HFC-134a + HFO-1234ze (E) binary systems. The Journal of Chemical Thermodynamics 2019, 139, 105798. [Google Scholar]
- 38.Ye G; Fang Y; Guo Z; Ni H; Zhuang Y; Han X; Chen G, Experimental Investigation of Vapor–Liquid Equilibrium for 2,3,3,3-Tetrafluoropropene (HFO-1234yf) + trans-1,3,3,3-Tetrafluoropropene (HFO-1234ze(E)) at Temperatures from 284 to 334 K. Journal of Chemical & Engineering Data 2021, 66 (4), 1741–1753. [Google Scholar]
- 39.Kamiaka T; Dang C; Hihara E, Vapor-Liquid Equilibrium Measurements of HFC-32+HFO-1234yf and HFC-125+HFO-1234yf Refrigerant Mixture. 2010. [Google Scholar]
- 40.Yang T; Hu X; Meng X; Wu J, Vapour-liquid equilibria for the binary systems of pentafluoroethane {(R125) + 2,3,3,3-tetrafluoroprop-1-ene (R1234yf)} and {trans-1,3,3,3-tetrafluoropropene R1234ze(E)}. The Journal of Chemical Thermodynamics 2020, 150, 106222. [Google Scholar]
- 41.Hu P; Chen L-X; Zhu W-B; Jia L; Chen Z-S, Isothermal VLE measurements for the binary mixture of 2,3,3,3-tetrafluoroprop-1-ene (HFO-1234yf)+1,1-difluoroethane (HFC-152a). Fluid Phase Equilibria 2014, 373, 80–83. [Google Scholar]
- 42.Yang T; Hu X; Meng X; Wu J, Vapor–Liquid Equilibria for the Binary and Ternary Systems of Difluoromethane (R32), 1,1-Difluoroethane (R152a), and 2,3,3,3-Tetrafluoroprop-1-ene (R1234yf). Journal of Chemical & Engineering Data 2018, 63 (3), 771–780. [Google Scholar]
- 43.Bell IH; Riccardi D; Bazyleva A; McLinden MO, Survey of Data and Models for Refrigerant Mixtures Containing Halogenated Olefins. Submitted to J Chem Eng Data 2021. [DOI] [PMC free article] [PubMed] [Google Scholar]
- 44.Bell IH; Lemmon EW, Automatic Fitting of Binary Interaction Parameters for Multi-fluid Helmholtz-Energy-Explicit Mixture Models. Journal of Chemical & Engineering Data 2016, 61 (11), 3752–3760. [Google Scholar]
- 45.Richter M; McLinden MO; Lemmon EW, Thermodynamic Properties of 2,3,3,3-Tetrafluoroprop-1-ene (R1234yf): Vapor Pressure and p–ρ–T Measurements and an Equation of State. Journal of Chemical & Engineering Data 2011, 56 (7), 3254–3264. [Google Scholar]
- 46.Thol M; Lemmon EW, Equation of State for the Thermodynamic Properties of trans-1,3,3,3-Tetrafluoropropene [R-1234ze(E)]. International Journal of Thermophysics 2016, 37 (3), 28. [Google Scholar]
- 47.Tillner-Roth R; Baehr HD, An International Standard Formulation for the Thermodynamic Properties of 1,1,1,2-Tetrafluoroethane (HFC-134a) for Temperatures from 170 K to 455 K and Pressures up to 70 MPa. Journal of Physical and Chemical Reference Data 1994, 23 (5), 657–729. [Google Scholar]
- 48.Outcalt SL; McLinden MO, A Modified Benedict–Webb–Rubin Equation of State for the Thermodynamic Properties of R152a (1,1-difluoroethane). Journal of Physical and Chemical Reference Data 1996, 25 (2), 605–636. [Google Scholar]
- 49.Lemmon EW; Span R, Thermodynamic Properties of R-227ea, R-365mfc, R-115, and R-13I1. Journal of Chemical & Engineering Data 2015, 60 (12), 3745–3758. [Google Scholar]


