

Abstract
The ultraviolet (UV)-induced degradation of graphene/polymer nanocomposites was investigated in this study. Specifically, the effect of few-layer graphene nanofillers on the degradation of a thermoplastic polyurethane (TPU) and the release potential of graphene from the degraded nanocomposite surfaces were assessed. Graphene/TPU (G/TPU) nanocomposites and neat TPU were UV-exposed under both dry and humid conditions in the NIST SPHERE, a precisely controlled, high intensity UV-weathering device. Neat TPU and G/TPU were characterized over the time course of UV exposure using color measurements and infrared spectroscopy, for appearance and chemical changes, respectively. Changes in thickness and surface morphology were obtained with scanning electron microscopy. A new fluorescence quenching measurement approach was developed to identify graphene sheets at the nanocomposite surface, which was supported by contact angle measurements. The potential for graphene release from the nanocomposite surface was evaluated using a tape-lift method followed by microscopy of any particles present on the tape. The findings suggest that graphene improves the service life of TPU with respect to UV exposure, but that graphene becomes exposed at the nanocomposite surface over time, which may potentially lead to its release when exposed to small mechanical forces or upon contact with other materials.
Keywords: Graphene, polymer nanocomposite, polyurethane, ultraviolet weathering, degradation, nanoparticle release
1. Introduction
Graphene nanomaterials, which are two-dimensional sp2-hybridized sheets of carbon, have exceptional properties that can be useful in a wide range of applications. Graphene nanoparticles are typically nanometer-sized in thickness and micron-sized (or larger) in lateral dimensions. The high aspect ratio of graphene, coupled with its fused network of benzene rings, makes for a mechanically strong, electrically conductive, thermally resistant, low friction, and impermeable material [1]. Upon incorporation into a polymer matrix, a low mass concentration of graphene can impart its properties onto the polymer to an extent dependent on the homogeneity of graphene nanoparticle dispersion [2]. Graphene/polymer nanocomposites (G/PNCs) have been proposed for use in sporting equipment such as skis, helmets, bike frames, and tennis rackets [3]; cell phone touch screens, solar cells, batteries and other electronic devices [3–6]; low-friction applications [7]; membranes for water treatment [5]; food packaging [8]; anti-corrosion coatings for barrier properties [9]; and anti-flammable coatings [10]. The widespread use of G/PNCs has been hindered, in part, by the scalability of high purity graphene production and the challenges associated with exfoliating graphene during G/PNC fabrication. Nevertheless, improvements in manufacturing processes have steadily lowered graphene’s production cost and improved the likelihood of G/PNC products becoming more prevalent on the market [11].
During and after consumer use of G/PNCs, it is likely that the polymeric matrix will degrade. This can potentially lead to exposure of otherwise embedded graphene at the product surface as well a release of graphene from the product, which may have implications for human health and the environment [12,13]. Furthermore, the presence of graphene in the PNC may improve or adversely affect the service life or durability of the polymer product by altering the rate of polymer degradation. Polymer degradation processes outdoors are most commonly induced by combinations of ultraviolet (UV) radiation from the sun, heat, and humidity. These UV weathering processes lead to polymer degradation mechanisms that include chain scission, photooxidation, cross-linking, and material loss [14]. Since UV-induced degradation tends to be slow on an experimental time scale, accelerated weathering protocols have been developed to rapidly assess the durability of polymeric materials. These accelerated weathering protocols can ultimately help guide the design of more sustainable and safe G/PNC materials.
Only a few studies have systematically assessed the effect of graphene-family nanomaterials on polymer matrix degradation in nanocomposites. In our previous work, graphene oxide (GO), the oxidized form of graphene, was found to increase the durability of waterborne polyurethane (WBPU) relative to neat WBPU under dry UV but not humid UV conditions [15]. Graphene oxide also became exposed at the nanocomposite surface, especially under humid UV conditions, and evidence of GO release was observed [15]. However, since GO is a less photo-stable form of graphene and its bandgap, chemical composition, hydrophilicity, and mechanical strength are significantly different from graphene, it is unclear if the degradation processes observed for GO/WBPU nanocomposites will be representative of the degradation processes of G/PNCs [16,17]. A recent study by Zepp et al. showed that graphene, among other nanomaterials, modulated UV degradation of epoxy but the results focused primarily on the amount of released material [18]. Shehzad et al. [19] characterized the changes in chemical structure, molecular weight, and microstructure during the UV photodegradation of graphene/high-density polyethylene nanocomposite and found a decrease in polymer matrix photodegradation with increasing graphene mass loading in the nanocomposites, consistent with the UV-induced degradation processes previously observed for carbon nanotube (CNT)/PNCs [19–22]. Carbon nanotubes, the cylindrical counterparts of graphene, have been shown to decrease the degradation of polymer matrices in CNT/PNCs by radiation filtering [23]. In contrast, other types of nanoparticles such as ZnO and nano-clays have been shown to accelerate oxidative polymer degradation [24,25]. So far, graphene has only been shown to systematically decrease polymer degradation in a chemically inert, semi-crystalline polyolefin system [19].
The main objectives of this study were to critically assess the long-term performance of a graphene/polymer nanocomposite with a different type of polymer matrix and evaluate how multiple UV weathering conditions affected degradation. Furthermore, this study used new methodologies or approaches to identify graphene surface-accumulation and assess graphene release potential. A thermoplastic polyurethane (TPU), which is an elastomer with hard and soft segments, was chosen as the polymer matrix because polyurethane has a well-understood photochemistry and is commonly used outdoors in automotive, building and construction, and outdoor gear such as bicycles and kayaks [7,26–28]. Few-layer graphene was embedded in TPU at 3% by mass and the resulting G/TPU nanocomposites were exposed to accelerated UV weathering under both dry and humid conditions. This approach was taken since humidity was shown to have an important impact on the UV-induced polymer degradation rates of polyurethanes which, in turn, led to more GO surface-exposure and GO release from GO/WBPU nanocomposites in our previous study [15]. The NIST SPHERE (Simulated Photodegradation via High Energy Radiant Exposure), a state-of-the-art accelerated UV-weathering device based on integrating sphere technology, was used to simulate highly uniform UV exposure from sunlight with controlled temperature and humidity conditions [29]. The long-term weatherability of G/TPU nanocomposites was assessed by measurement of chemical changes of the polymer matrix, color changes, and thickness loss; measured by attenuated total reflectance- Fourier transform infrared spectroscopy (ATR-FTIR), colorimetry, and cross-sectional scanning electron microscopy (SEM), respectively. The accumulation of graphene on the nanocomposite surface resulting from UV irradiation was characterized by Raman spectroscopy, SEM, and laser scanning confocal microscopy measurements (LSCM) in fluorescence mode, which enabled the detection of carbonaceous nanomaterial in the carbonaceous polymer matrix by taking advantage of the fluorescence quenching properties of graphene [30]. For assessment of graphene release potential, a tape technique was used to simulate graphene transfer of loosely bound graphene at the PNC surface. The results show that graphene increases the long-term performance of TPU, but that the nanofiller becomes exposed at the nanocomposite surface and has the potential release when subjected to small mechanical forces or upon contact with other materials.
2. Materials and methods
2.1. Materials
A commercially available graphene material with a carbon to oxygen ratio of 141.6:1, as measured by X-ray Photoelectron Spectroscopy [XPS] (Phi XPS 5500 system with 300 W monochromatic Al-Kα radiation, 23.5 eV pass energy), was used in this study. X-ray Photoelectron Spectroscopy data was analyzed in Casa XPS 2.3.15 based on Phi standard sensitivity factors, with Shirley background subtraction and peak shape fits as the sum of 90% Gaussian and 10% Lorentzian. The commercially prepared graphene material had lateral dimensions ranging from 1 μm to 10 μm, was confirmed to be graphene with Raman spectroscopy (Fig. S1), and had a platelet thickness of approximately 2.3 nm as determined by a Brunauer Emmet Teller (BET) sorption instrument [27]. The TPU, commercially available as Elastollan 1185 A10 (BASF, Ludwigshafen, Germany), was an aromatic polyurethane containing polyether soft segmentsThe granules used were synthesized from polytetrahydrofuran (chain length of 1000 g/mol), 1,4-butanediol, and 4,4’-diphenylmethane diisocyanate (MDI) [27,31]. This specific polymer did not contain additional UV stabilizers acting by UV absorption, whereas graphene contributed this functionality to the nanocomposites. The polymer contained a phenolic antioxidant acting as radical scavenger. TPU was initially non-crosslinked, and its melt could be injection-molded.
2.2. Nanocomposite preparation and characterization
Graphene nanofillers were melt compounded at 3% mass fraction with TPU using a ZSK 26 MC twin-screw extruder (Coperion, Germany). The compounded nanocomposite granules were then injection molded using an Engel ES 330/80 HL (Engel, Germany) system at an injection velocity of 15 mm/s, a melt temperature of (220 to 230)°C, and a mold temperature of 40°C. Molded nanocomposites were then extruded as 2 mm thick sheets using an Arenz 30 mm extruder (by the company Arenz, Germany) at a melt temperature of 190°C and a screw speed of 50 rpm. Nanocomposites were cut from the sheets into 18.4 mm circles by pressing a sharp circular die into the sheets. Neat TPU (0% mass fraction graphene/TPU) was prepared the same way as 3% mass fraction graphene/TPU (G/TPU). For brevity, 0% mass fraction G/TPU and 3% mass fraction G/TPU will be denoted neat TPU and 3% G/TPU throughout the manuscript. The graphene was primarily incorporated into TPU to minimize electrical charging, and conductivity measurements indicated that the percolating network of graphene formed over cm distances with a 12 orders-of-magnitude increase in electrical conductivity compared with neat TPU, indicating that the graphene was uniformly dispersed throughout the bulk to a degree that accomplished its intended use [27]. Other characterization data for the prepared nanocomposites are provided in Sections 2.4 and 2.5 since most of the techniques used to characterize the initial nanocomposites were also used to characterize the degraded materials.
2.3. UV exposure of nanocomposites
Neat TPU and 3% G/TPU nanocomposites were UV-exposed at an irradiance of approximately 140 W/m2 with wavelengths ranging from 295 nm to 400 nm under high temperature and relative humidity (RH) conditions to simulate the worst-case scenarios of degradation. Specifically, samples were UV-exposed at 55°C under dry (≈ 0% RH) or high humidity (75% RH) conditions, denoted Dry UV and Humid UV throughout the text. Samples were weathered for 0 d, 3 d, 6 d, 10 d, 15 d, 30 d, and 60 d in the SPHERE, which is the equivalent of UV doses ranging from 0 MJ/m2 to 726 MJ/m2. Although a direct comparison with outdoor conditions cannot be made due to the complexity of natural weather patterns, a range of 0 d to almost 2.6 years of outdoor exposure in South Florida (1 year UV exposure in South Florida ≈ 280 MJ/m 2) could be approximated based on UV dose only. Control samples were also exposed to the same conditions in the absence of UV radiation and are denoted Dry Dark and Humid Dark throughout the text. Table 1 summarizes these different conditions.
Table 1.
Sample exposure conditions used for neat TPU and G/TPU weathering in this study.
| Condition Name | % UV | Temperature (°C) | % Relative Humidity (RH) |
|---|---|---|---|
|
| |||
| Dry UV | 100 | 55 | 0 |
| Humid UV | 100 | 55 | 75 |
| Dry Dark | 0 | 55 | 0 |
| Humid Dark | 0 | 55 | 75 |
Replicate specimens (number of replicates described later) of neat TPU and 3% G/TPU were arranged on a 17-position sample holder and held in place using a sample holder cover. For each sample, a circular area of 16 mm in diameter was UV-exposed while the remaining outer rings of the samples were protected from UV light by the sample holder cover. At each exposure time point, unless otherwise specified, a subset of specimens were removed from the sample holders for measurements and then placed back on the sample holders for continued weathering. For microscopy (i.e., SEM and atomic force microscopy [AFM]) analysis, a subset of specimens were removed from the sample holders at each time point and not placed back onto the SPHERE.
2.4. Degradation of neat TPU and G/TPU nanocomposites
The degradation of neat TPU and the polymer matrix of 3% G/TPU nanocomposites was evaluated by color and fluorescence changes, chemical changes, and thickness loss.
2.4.1. Color and fluorescence changes
Visual color changes to the neat TPU and 3% G/TPU nanocomposites were photographed before and after 60 d of UV exposure in the SPHERE under dry and humid conditions. Additionally, the color change (ΔE*) from UV exposure, or change in visual perception of color in L*a*b color space, was measured at each time point using a colorimeter (Spectro-guide sphere gloss, BYK, Columbia, MD) with a CIELab system (L*a*b*), a daylight D65 light source, and a 10° standard observation (D65/10°). Due to the large sampling area of the colorimeter, specimens were measured at the center. Each sample was measured four times (twice in each direction) and the data are reported as the average and one standard deviation of these four measurements. The total color change, ΔE*, was used to represent the color difference as exposure time increased.
Raman spectroscopy (Bruker Senterra XL Raman Microscope, Billerica, MA, 785 nm, 1 mW, 5 co-additions, 10 s accumulation) was used to collect graphene concentration data at the nanocomposite sub-surface as a function of UV exposure time. Raman measurements indirectly provided fluorescence data across the Raman spectrum resulting from polymer photoproduct formation. Thus, fluorescence data from the Raman spectra were obtained at different time points of UV exposure and were used to qualitatively compare fluorescence signal gain from polymer photoproduct formation under dry versus humid conditions. Each Raman spectrum shown is the average measurement from three replicate specimens, with four different spots measured on each replicate due to the small spot size of the laser in Raman spectroscopy.
2.4.2. Chemical degradation
Chemical degradation of neat TPU and the TPU matrix of the 3% G/TPU nanocomposite was evaluated using Fourier transform infrared spectroscopy in attenuated total reflection mode (ATR-FTIR, 4 cm−1 resolution, 128 scans/specimen, Nicolet iS50 with diamond type IIa crystal, ThermoFisher Scientific, Waltham, MA). Triplicate specimens were measured for each type of sample. Although the graphene nanofillers of the 3% G/TPU nanocomposite absorbed across the entire IR spectrum, the graphene did not contribute to the FTIR bands observed (Fig. S2, after baseline correction) and only polymer degradation was tracked with FTIR. All spectra were baseline corrected with the same number of baseline points, only shifted slightly on the x axis (by no more than 5 cm−1) when necessary due to band broadening and/or band shifting in the IR spectra from polymer degradation. All FTIR spectra were normalized to the 1412 cm−1 band (C-H bending) which was found to change minimally during UV irradiation. Neat TPU ground into powder form was evaluated after exposure to one weathering condition (dry UV) using dissolution (in 1,1,1,3,3,3-Hexafluoro-2-propanol [HFIP] and 0.05% by mass ammonium acetate, Alfa Aesar) for identifying the presence of cross-linking and molar mass decreases using gel permeation chromatography (Agilent Modular GPC system [Santa Clara, CA], HFIP-LG Guard column, 2 × PL HFIPgel columns, 300 mm × 7.5 mm, [3 to 100] μm, with a 254 nm refractive index detector, 50 μL injection volume, 35°C, 1.0 mL/min flow rate) to provide an understanding of these changes during UV degradation. This assessment was conducted separately by UV weathering the TPU powder in an Atlas SunTest (Mount Prospect, IL) at 60 W/m2.
2.4.3. Thickness loss
Thickness losses of the neat TPU and 3% G/TPU nanocomposites were measured with SEM (SEM, JEOL 7600f, 6.0 kV, Peabody, MA) after 60 d of exposure under both dry UV and humid UV conditions. The thermoplastic elastomer samples were thick (2 mm) and rubbery, making them difficult to cryo-snap for cross-sectional imaging before and after UV exposure. Thus, all specimens were angled at 60° and imaged at the interface where the UV-exposed material met the unexposed material protected from UV light by the sample cover holder. This was the location where the thickness decrease could be observed with SEM. Prior to SEM imaging, a thin layer of conductive carbon coating was applied to all samples simultaneously. The coating was applied for 10 s using a Cressington 308R coating system with a Cressington EB500 controller (Watford, UK) operating at 85 mA and 2.5 keV. Although this might have slightly masked graphene nanoparticles at the nanocomposite surface, carbon coatings gave low image graininess relative to other available metallic coatings. For cross-sectional SEM, the average and one standard deviation of at least five cross-sectional length measurements from three separate images of a single specimen were made with ImageJ software (NIH, Bethesda, MD) for each SEM image. The cross-sectional lengths were adjusted from the 60° angle to 90° using the sine function.
2.5. Graphene accumulation at the nanocomposite surface
The accumulation (i.e., build-up) of graphene nanofillers at or near the nanocomposite surface, surface morphology changes of the nanocomposites, identification of graphene at the degraded nanocomposite surfaces, and chemical changes to the graphene nanofillers at the degraded nanocomposite surface were characterized as described in the following sections.
2.5.1. Graphene accumulation measurements
The accumulation of graphene at or near the G/TPU nanocomposite surfaces (top 1 μm to 4 μm) was measured using Raman spectroscopy (Raman microscope described earlier). The intensity changes of the defective (D, 1311 cm−1) and graphitic (G, 1602 cm−1) bands could be monitored to determine the changes in graphene concentration at or near the nanocomposite surface during UV-induced degradation. Four measurements per specimen for three specimens were obtained. Further information can be found in the supplementary data. The specimens used were the same that are described later in Section 2.5.3.
2.5.2. Chemical degradation of graphene particles at the nanocomposite surface
Using Raman spectroscopy, the ratio of the D band intensities to the G band intensities for each UV exposure time point was determined to evaluate if a chemical change occurred for the graphene nanomaterials at or near the surface of the degraded nanocomposites. This was compared to the same ratios for the dark control samples.
2.5.3. Surface morphological changes of the nanocomposites
Both SEM and AFM (described earlier) were used to follow surface morphological changes of the neat TPU and 3% G/TPU nanocomposites resulting from UV exposure. For SEM imaging (described earlier), neat TPU and 3% G/TPU surfaces at each UV exposure time point were first coated by carbon evaporation. SEM images of each specimen were collected in multiple locations to ensure the uniformity of morphology across the specimen surface and an additional unexposed nanocomposite specimen surface was imaged to ensure sample-to-sample consistency (example provided in the Supplementary Data, Fig. S10).
The specimens used for SEM and AFM imaging were taken off at each specified UV exposure time point and not re-exposed since a conductive coating had to be applied. AFM imaging was conducted on the same specimens used for SEM imaging, but prior to application of a conductive coating.
Contact angle (CA) was measured using a Drop Shape Analyzer (Kruss, DSA 100, Hamburg, Germany). CA data was used to determine the hydrophilicity of the neat TPU and G/TPU before and after UV degradation under dry and humid conditions. Duplicate specimens were measured for each condition. Nanopure water (18 MΩ) was used for water contact angle measurements. Testing was done using a Normal Sessile Drop with a 5 μL volume. CA was calculated as the average of five drops per specimen with at least two hundred measurements made per drop. The Statistical Package for Social Sciences (SPSS) software was used for statistical analysis. Differences were determined via a one-way Analysis of Variance followed by a Tukey Highly Significant Difference test with a p-value < 0.05.
2.5.4. Identification of graphene at the nanocomposite surface by fluorescence quenching of polymer photoproducts
Laser scanning confocal microscopy (LSCM) was performed with a Zeiss LSM 800 (Thornwood, NY) and image stacks in the z-direction were compressed into a single plane image. In total, the following six samples were characterized in triplicate: neat TPU and 3 % G/TPU before UV exposure, after 60 d of dry UV exposure, and after 60 d of humid UV exposure. Fluorescent images were obtained at three locations for each sample. Reported fluorescent images were captured with instrument settings as follows: 405 nm laser, 20x magnification, 7 % laser power, 28 μm aperture, and with the detector set to collect light from 500 nm to 700 nm. These settings were selected to optimize the collection of any emitted fluorescent light from the most fluorescent sample, while minimizing the collection of backscattered laser light. LSCM in reflectance mode was used to find and confirm the sample surface was in the focal plane of the instrument for all images captured (Fig. S11).
2.6. Graphene release from degraded nanocomposites
The potential for graphene release from the dry UV and humid UV degraded G/TPU nanocomposite surfaces was qualitatively evaluated by applying a 7 mm × 7 mm piece of conductive, copper double-sided tape (3M, Maplewood, MN) to the degraded nanocomposite surface and removing the tape slowly with forceps. This approach was attempted twice: one time to preliminarily determine if there were any qualitative graphene release differences between humid UV and dry UV degraded samples and the second time to ensure consistency and collect released particles for imaging on a second set of humid UV and dry UV degraded samples. This approach has been used previously by Wohlleben and Kingston et al. for CNT/PNCs degraded by a combination of UV exposure and water spray [32]. Tape removal of loose particles from the degraded surfaces simulated low force contact of these loose particles with surrounding materials, such as dust, hail, and debris, in the environment. After contact with the degraded nanocomposite, the backside of the tape was applied to an SEM stub and imaged with a stereo optical microscope and the SEM microscope system described earlier. For SEM imaging, a thin layer of conductive carbon coating was applied to all samples simultaneously prior to imaging as charging of the conductive tape occurred otherwise. Although this might have slightly masked graphene particles that transferred to the tape, carbon coatings gave low image graininess relative to other available metallic coatings. The coating was applied to all specimens simultaneously for 5 s using the same parameters described earlier. For stereo optical microscopy, an Olympus SZ61 (Tokyo, Japan) stereo microscope with an LG-PS2-5 light guide illumination system (100 W) and an Olympus DP27 camera was used. Images were collected of the tape itself as a control and the tape applied to: the initial 3% G/TPU nanocomposite, the 60 d humid UV-exposed neat TPU, the 60 d humid UV-exposed 3% G/TPU, and the 60 d dry UV-exposed 3% G/TPU.
3. Results and discussion
3.1. Color changes
Neat TPU and 3% G/TPU nanocomposites were UV-irradiated under dry and humid conditions in the NIST SPHERE to simulate UV-induced outdoor degradation. In Fig. 1, a visual comparison of the UV-exposed and unexposed samples is made. Both the neat TPU and G/TPU nanocomposites visually changed in color during dry UV and humid UV exposure, with a large increase in yellowing observed for the neat polymer (Fig. 1) and a transition from a black color to a faded, gray color for the nanocomposite. Furthermore, the discoloration caused by UV irradiation for the UV-exposed samples contrasts distinctly from the unchanged color of the same samples’ outer rings that were covered by the sample holder cover during UV exposure. The color changes observed in all samples resulted from the aromatic nature of the TPU used, which led to the formation of colored monoquinone and diquinone imides [14]. The color changes were quantitatively measured with a color meter and the amount of color change (ΔE*) is shown in Fig. 1. Visual assessment and color change plots both showed that neat TPU and the G/TPU nanocomposites became more rapidly discolored after humid UV exposure than after dry UV exposure as discussed later in the text.
Fig. 1.
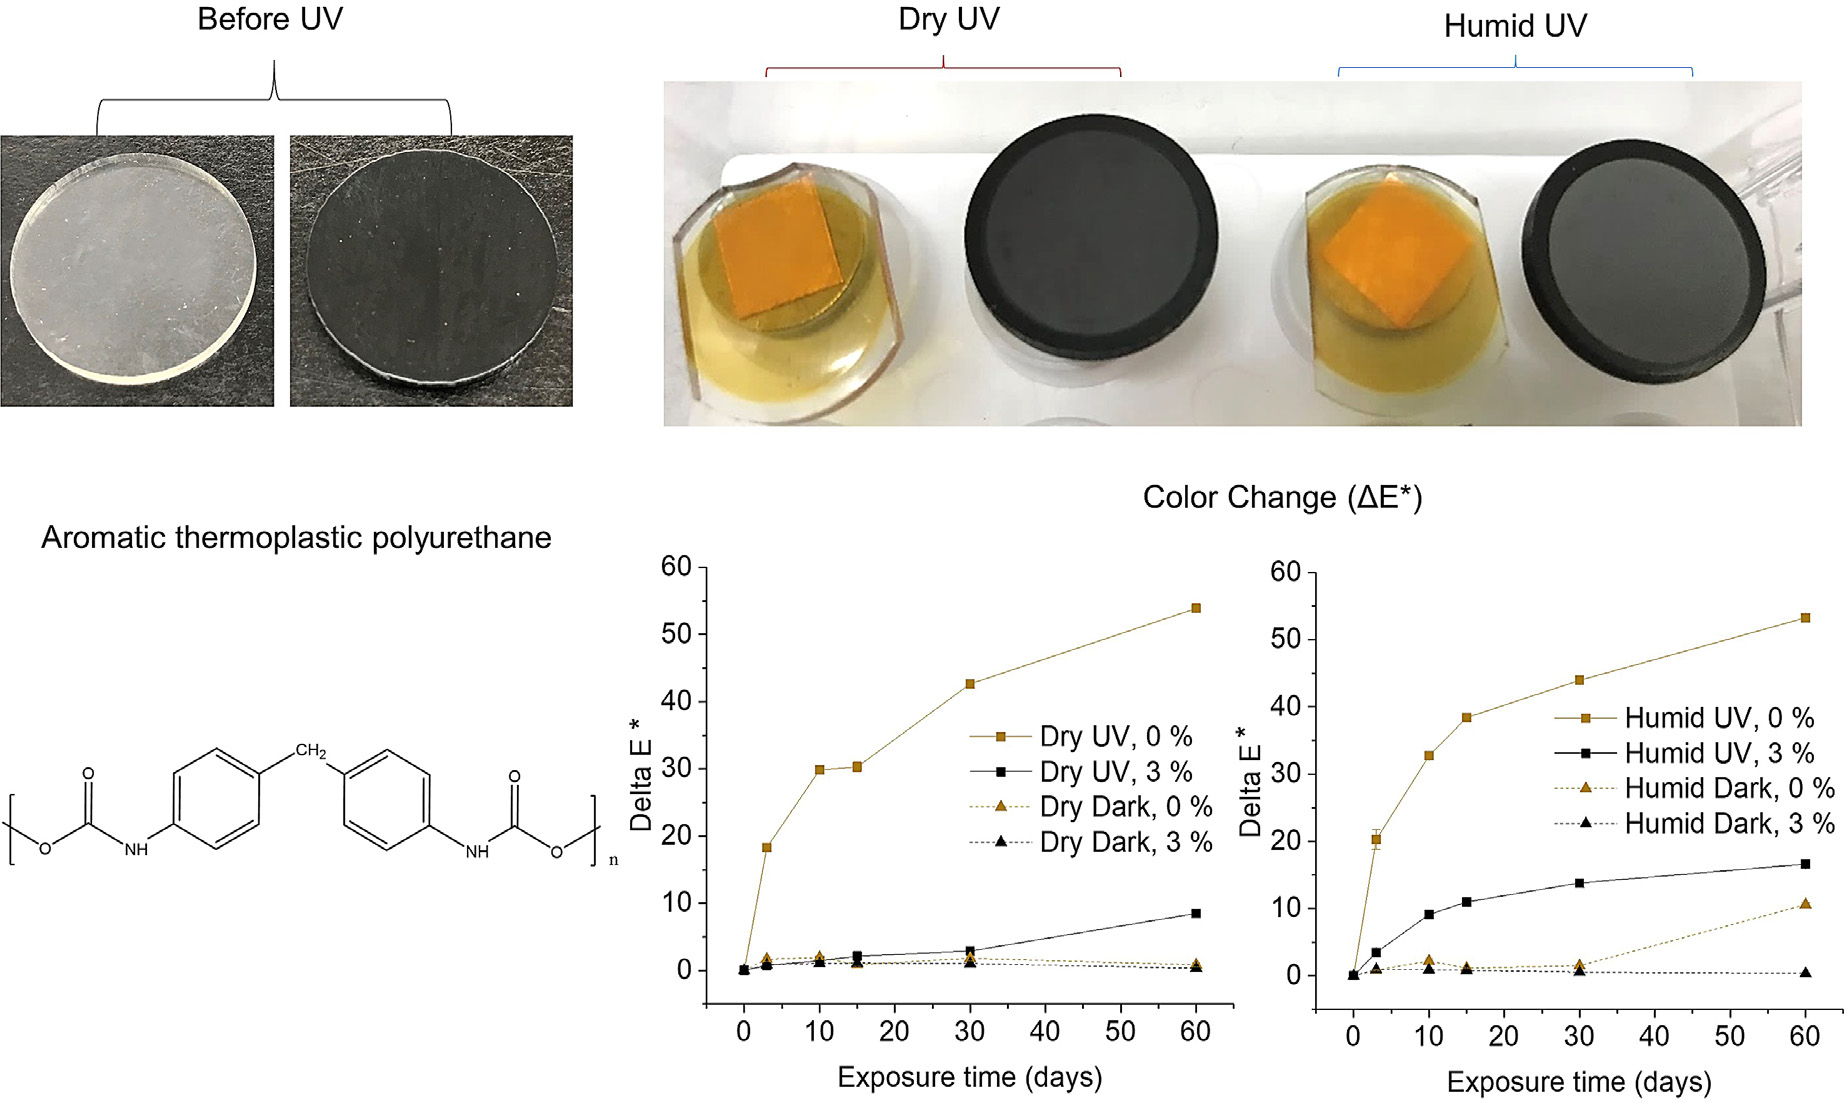
Color changes (inner circles of UV-exposed samples, top right) of neat TPU (clear/yellow) and 3% G/TPU (black/grey) samples after 60 d of dry UV and humid UV exposure. The outer rings show the color of the specimen areas that were protected from UV light by the sample holder cover. Note that the orange squares visible below the neat TPU, UV-exposed samples are pieces of tape that can be seen through the transparent samples attached to SEM stubs. Samples are also shown prior to UV exposure on the top left of the figure. The color changes (ΔE*) of the UV-exposed samples and the dark control samples (shown in plots) were also measured with a colorimeter and are shown as the average of four replicates and one standard deviation (error bars are similar in size to the symbols).
3.2. Neat TPU degradation
With this TPU material, the effects of UV aging on the molar mass and cross-linking showed a more than 30% molar mass reduction with newly emerging fractions between 500 g/mol and 5000 g/mol, and significant cross-linking after dry UV irradiation as indicated by a fraction of remaining swollen gel after polymer dissolution in HFIP. Cross-linking was attributed to reactions of the aromatic segments and was not observed for a comparative TPU with aliphatic segments. Further data on molar mass reduction and cross-linking of this TPU material will be reported elsewhere by Pfohl et al. and FTIR combined with thickness change measurements will be primarily used in this study to evaluate the effects of graphene on TPU photodegradation, for clarity and brevity.
ATR-FTIR spectroscopy was used to assess the degradation rate of neat TPU as a function of UV exposure time under dry and humid conditions (Fig. S2). The carbonyl region (1575 cm−1 – 1825 cm−1) of the FTIR spectrum was used primarily to monitor polymer degradation by photooxidation (Fig. 2). Under dry UV conditions, the intensity of the bands at 1701 cm−1 and 1730 cm−1 increased with exposure time for neat TPU. The band at 1701 cm−1 was indicative of carboxylic acid formation during UV degradation and the formation of hydrogen-bonded urethanes while the 1730 cm−1 band contained both esters and urethanes [33,34]. With increasing UV exposure time, the urethane content (1730 cm−1, 1701 cm−1 for H-bonded) increased partially due to the hydrolysis of acetylurethane photoproducts. The presence of acetylurethanes, which are common photoproducts formed by polyurethanes during UV exposure at wavelengths > 300 nm, were evident by the band at 1779 cm−1, which increased with UV exposure [14,33,35,36]. The band at 1597 cm−1 also increased, which was from the C=C stretch of quinones (i.e., oxidation of the CH2 of MDI) formed during UV irradiation of the aromatic TPU. Monoquinones and diquinones are common photoproducts from irradiation at wavelengths > 340 nm [14]. Aromatic TPUs are also known to undergo Photo-Fries rearrangements at wavelengths < 340 nm [14]. Similar to the literature, the FTIR data (when normalized to 770 cm−1) showed that the Photo-Fries mechanism made a partial contribution to the photodegradation process. Specifically, this was evident from 0 d to 60 d by a decrease in the 815 cm−1 band intensity from C-N bond homolysis at the aromatic ring, and a concomitant increase in the band at 835 cm−1 from side group rearrangement and the resulting increase in the number of substituents on the aromatic ring (Fig. S3) [33].
Fig. 2.

The carbonyl region in the FTIR spectrum of neat TPU at different time points of dry UV and humid UV exposure (left) and cross-sectional SEM images showing the thickness loss (right) of neat TPU after 60 d of dry UV and humid UV exposure. Images of the UV-exposed TPU specimens are shown in the upper left-hand corner of the SEM images with red lines used to denote the areas in which cross-sectional images were obtained. Thickness loss was measured at the location where the UV degraded material met the material that was protected by the sample cover. For cross-sectional SEM, the average and one standard deviation of at least five cross-sectional length measurements from three separate images of a single specimen were made with ImageJ software (NIH, Bethesda, MD). The FTIR data is presented as the average and one standard deviation of one measurement per specimen for triplicate specimens.
Compared to dry UV conditions, humid UV conditions led to the formation of the same photoproducts, but the intensity increases in the FTIR spectrum indicated that the formation of photoproducts occurred to a lesser extent. However, this was not the case because rapid acetylurethane hydrolysis in the presence of moisture led to cycles of photoproduct removal and re-formation occurred under humid UV conditions. Photoproduct removal was likely due to the conversion of smaller chain photoproducts, formed from acetylurethane cleavage, to gas (i.e., CO2 and CO) in the presence of moisture [14]. Similar moisture-enhanced photodegradation processes have been observed for several polymers, including polycarbonates and acrylic melamine [37–40]. Furthermore, the formation of carboxylic acids likely accelerated the hydrolysis of acetylurethanes and other photoproducts while moisture absorbed from the air likely contributed to dissolution and washing away of hydrophilic photoproducts such as alcohols, hydroperoxides, carboxylic acids, water soluble amines, and carbamic acid (which can further photodecompose) [41–44]. In contrast to humid UV conditions, the increase in acetylurethane concentration (1779 cm−1) was much larger under dry UV conditions, where water was unavailable to react with acetylurethanes as they formed [14,35,36]. The greater removal of photoproducts under humid UV conditions compared to dry UV conditions was confirmed by TPU thickness loss using cross-sectional SEM imaging (Fig. 2). A loss of 251 μm ± 9 μm TPU was observed under humid UV conditions while only 79 μm ± 7 μm TPU was lost under dry UV conditions. Under dry dark and humid dark conditions, the material did not visibly change, lose thickness, or show any significant changes in the infrared spectra (Figs. S4–S5).
Raman spectroscopy indirectly showed that fluorescent photoproducts at the surface of neat TPU increased after exposure to both dry UV and humid UV conditions (Fig. S6). However, the neat TPU exposed to humid UV conditions had a larger background fluorescence, or a higher fluorescence intensity, in the Raman spectrum than the neat TPU exposed to dry UV conditions. This suggested that there were more quinone photoproducts and potentially higher levels of conjugation for the neat TPU exposed to humid UV conditions that led to greater fluorescence. The presence of more conjugated photoproducts indicated that the extent of quinone formation was more extensive under humid UV conditions relative to dry UV conditions. This was likely why the neat TPU had a different, more opaque yellow color after dry UV exposure compared to humid UV exposure at 60 d (Fig. 1). The difference in quinone formation under dry UV and humid UV conditions was not as readily apparent in the FTIR spectra.
Previously, it was shown that more free radicals are generated with increasing humidity during photo-oxidation of polymers such as polyethylene terephthalate (PET) [45]. As a result, the increased concentration of free radicals led to greater degradation and discoloration from formed quinones and hydroquinones at the PET surface in the presence of moisture. This suggests that the generation of more free radicals under humid UV conditions rather than dry UV conditions may have led to the increased yellowing of the TPU in this study. Increased fluorescence of the neat TPU under humid UV conditions was also shown with LSCM in fluorescence mode and is described later in the next section.
3.3. Effect of graphene on polymer matrix degradation in G/TPU nanocomposites
Under dry UV conditions, the carbonyl region (1575 cm−1 – 1825 cm−1) intensity increased with UV exposure time for the 3% G/TPU nanocomposites and the same photoproduct bands observed for neat TPU were observed for 3% G/TPU nanocomposites. Similar photooxidation trends were also observed in the C-O region of the spectrum (900 cm−1 – 1300 cm−1, Fig. S2). Strikingly, the intensity of the carbonyl region increased much more rapidly for the 3% G/TPU nanocomposite (Fig. 3) relative to the neat TPU (Fig. 2). In contrast to our previous study where the carbonyl band intensity of the 1% mass fraction GO/WBPU nanocomposites increased more slowly than the carbonyl band intensity of neat WBPU, the presence of graphene at 3% mass fraction in this study appeared to lead to an increased carbonyl band intensity compared to neat TPU, suggesting that graphene accelerated photooxidation of TPU. For further evaluation, cross-sectional SEM imaging was used to compare material loss of neat TPU versus 3% G/TPU nanocomposites under dry UV conditions. It was found that the material loss was an order of magnitude larger (Table 2) for neat TPU relative to 3% G/TPU nanocomposites, opposite to the trends observed for photooxidation with FTIR (Fig. 3). Thus, the larger photoproduct build-up observed for 3% G/TPU nanocomposites relative to neat TPU under dry UV conditions was likely due to less removal of photoproducts as gas. In other words, full conversion of photoproducts to gas occurred to a lesser extent for the G/TPU nanocomposite than the neat TPU and the graphene was acting to decrease the overall photodegradation process, not enhance it (Fig. 3, Table 2). This indicates that graphene at a mass loading of 3% improves the durability (i.e., service life) of TPU by slowing down the full polymer degradation process through photoproduct build-up at the nanocomposite surface.
Fig. 3.

The carbonyl region in the FTIR spectrum of 3% G/TPU (left) and the change in the band intensity at 1701 cm−1 (middle) at different time points of dry UV and humid UV exposure compared to dry dark and humid dark controls. On the right, cross-sectional SEM images show the thickness loss of 3% G/TPU after 60 d of dry UV and humid UV exposure. Images of the UV-exposed G/TPU specimens are shown in the upper left-hand corner of the SEM images with red lines used to denote the areas in which cross-sectional images were obtained. Thickness loss was measured at the location where the UV degraded material met the material that was protected by the sample cover. For cross-sectional SEM, the average and one standard deviation of at least five cross-sectional length measurements from three separate images of a single specimen were made with ImageJ software (NIH, Bethesda, MD). The FTIR data is presented as the average and one standard deviation of one measurement per specimen for triplicate specimens.
Table 2.
Cross-sectional thickness loss from SEM images of neat TPU and 3% G/TPU nanocomposites. At least three replicate cross-sectional images were taken per specimen and at least five cross-sectional lengths per cross-sectional SEM image were measured with ImageJ (NIH, Bethesda, MD) software.
| Sample and Conditions | Average Thickness Loss (μm) | Std. Dev. (μm) |
|---|---|---|
|
| ||
| 0% (by mass) G/TPU Dry UV | 79 | 7 |
| 3% (by mass) G/TPU Dry UV | 8 | 1 |
| 0% (by mass) G/TPU Humid UV | 251 | 9 |
| 3% (by mass) G/TPU Humid UV | 25 | 2 |
For 3% G/TPU nanocomposites exposed to humid UV conditions, the intensity of the carbonyl group region in the FTIR spectrum grew to a much smaller extent than under dry UV conditions (Fig. 3). Similar to the results obtained for neat TPU (Fig. 2), this indicated that there was also less build-up of photoproducts for 3% G/TPU nanocomposites under humid UV conditions than under dry UV conditions, most likely due to their rapid conversion to gas in the presence of moisture (Fig. 3). For the 3% G/TPU nanocomposites, the larger degree of photodegradation under humid UV versus dry UV conditions was confirmed by the larger thickness changes observed under humid UV conditions (25 μm ± 2 μm versus 8 μm ± 1 μm). For studies that assess the long-term performance of polymer nanocomposite, these results demonstrate the importance of evaluating total material loss in addition to photoproduct formation by FTIR.
Under humid UV conditions, FTIR indicated that the extent of degradation for neat TPU (Fig. 2) was somewhat faster (≈ 25% more degraded by 60 d) than the extent of degradation for 3% G/TPU (Fig. 3). However, owing to the removal of polymer photoproducts by moisture, cross-sectional SEM imaging indicated that the amount of degradation was dramatically larger (Table 2) for neat TPU compared to 3% G/TPU nanocomposites under humid UV conditions (251 μm ± 9 μm versus 25 μm ± 2 μm, ≈ 900% increase). Interestingly, despite the faster degradation rates of both neat TPU and 3% G/TPU under humid UV conditions, the graphene had the same overall inhibition effect on TPU degradation under both humid UV conditions and dry UV conditions. Under both weathering conditions, 3% graphene slowed the TPU photodegradation rate (as demonstrated with thickness loss) or improved the service life of TPU by approximately ten times. This was in contrast to our previous study, where GO did not improve the service life of waterborne polyurethane under humid UV conditions, but did so to a small extent under dry UV conditions [15]. The difference between these two systems was likely a result of the hydrophilicity of GO, which enabled its release during humid UV exposure. This difference is likely due to more accumulation of graphene at the nanocomposite surface in this study due to the hydrophobicity of graphene and its unlikely release through interaction with moisture. In effect, this likely led to increased protection of the underlying polymer by graphene. Raman spectra results were also used to qualitatively compare the fluorescence of neat TPU and G/TPU nanocomposites under both dry UV and humid UV conditions. This was accomplished by assessing the rise in background signal, attributed to fluorescence signal, across the Raman spectra for the neat TPU and G/TPU nanocomposites. In both cases, there was little background fluorescence present in the Raman spectrum for G/TPU nanocomposites. This was in stark contrast to the background fluorescence observed for neat TPU under dry UV and humid UV conditions and was likely due to fluorescence quenching of photoproducts by the graphene that was present [30].
The thickness change results and FTIR results discussed above reveal several important findings regarding the effects of UV radiation and moisture on the degradation of G/TPU nanocomposites: 1) Degradation of neat TPU is much more substantial under humid UV than under dry UV conditions, 2) under dry UV conditions, the degradation of G/TPU is 10x less than that of neat TPU, and 3) under humid UV conditions, the degradation of G/TPU is 10x less than that of neat TPU, but much greater than G/TPU exposed to dry UV conditions. The reduced degradation of G/TPU nanocomposites compared to neat TPU (items 2 and 3) suggests that graphene effectively stabilizes the photodegradation of TPU. The stabilization can occur in four possible ways. First, the presence of hydrophobic graphene in the polymer matrix can potentially reduce the number of water adsorption sites and restrict the extent of moisture-induced photodegradation of the polymer. Both experimental results and theoretical calculations of water sorption on graphene sheets showed that very little or effectively no water is adsorbed on graphene surfaces between 0% and 80% RH [46,47]. Second, graphene can absorb UV light and prevent absorption of UV light by the polymer matrix. Third, graphene can potentially scavenge radicals produced in the polymer, thereby reducing the rate of photooxidation. Fourth, increased cross-linking in G/TPU nanocomposites compared to neat TPU, possibly due to polymer cross-links formed with graphene, can further contribute to the UV stabilization of TPU.
As stated earlier, the increased degradation of neat TPU under humid UV conditions compared to dry UV conditions (item 1), is likely due to a combination of factors including enhanced hydrolysis (which is catalyzed by carboxylic acid formation), washing away of photooxidation products, and increased free radical formation under high humidity [45]. For G/TPU nanocomposites, of all potential graphene protection mechanisms, graphene hydrophobicity was likely most responsible for causing differences in the extent of G/TPU degradation under dry UV and humid UV conditions by preventing access of available water on the surface of the sample, and in turn, reducing the extent of degradation via the three pathways listed above. Notably, however, the protective effect of graphene was similar under both dry UV and humid UV conditions, leading to one order of magnitude less polymer loss than without graphene (i.e., for neat TPU controls) under the same conditions. This suggests that G/TPU nanocomposites, under both dry UV and humid UV conditions had the same protection mechanisms, including hydrophobicity of graphene in the photodegraded fraction of the nanocomposite. Nevertheless, under dry UV conditions, the polymer photoproducts formed in the G/TPU could not be removed as readily with less water present (≈ 0% RH with a precision of 0.5%) and the overall thickness loss was lower.
Future studies will seek to disentangle the roles of graphene protection by radical scavenging, UV filtering, cross-linking, and hydrophobicity. For example, both neat TPU and G/TPU can be added to a solution containing hydrogen peroxide to generate radicals in the presence of UV light and the degree of radical quenching by neat TPU compared to G/TPU nanocomposites can be measured during UV exposure. In addition to assessment of the relative importance of the radical quenching protection mechanism, UV filtering can also be studied by UV exposing thin graphene films applied to TPU surfaces to measure the depth of degradation into the TPU with cross-sectional ATR-FTIR and imaging techniques.
3.4. Change in graphene concentration at the nanocomposite surface during UV exposure
Changes in the concentration of graphene occurring in the sub-surface (top 1 μm to 4 μm) of the G/TPU nanocomposites were assessed using Raman spectroscopy. With this technique, the D and G band intensities unique to graphene were used to track graphene concentration changes near the nanocomposite surface. The results from these measurements indicated that there was no statistically significant change in the graphene concentration within the nanocomposite sub-surface under dry UV conditions and even under humid UV conditions where > 20 μm of polymer thickness loss occurred (Figs. 3,4 and S7). Under humid UV conditions, the unchanging graphene concentration measured in the top 1 μm to 4 μm layer suggested that > 20 μm of polymeric material lost from the 3% G/TPU nanocomposite surface was not sufficient to significantly increase the Raman signal from the higher graphene concentration that may have formed in the top 1 μm to 4 μm of Raman measurements. This contrasts with Raman spectroscopy results for photodegraded GO/WBPU nanocomposites, where higher polymer degradation (45 μm ± 3 μm in the previous study versus 22 μm ± 2 μm in this study, respectively) resulted in higher measured concentrations of GO material in the top 1 μm to 4 μm layer measured by Raman spectroscopy [15]. However, unlike protruding and crinkled GO accumulated at the GO/WBPU nanocomposite surface in our previous study, the accumulated graphene in SEM images appeared to be lying flat in parallel to the nanocomposite surface (Figs. 5 and S10) and internal reflections of the Raman signal within the graphene surface structure may have been lost, preventing an increase in D and G band signal from increased graphene concentration. As a result, the D and G band intensity change was not significant. Another consideration was the lack of TPU polymer reference bands for D and G band intensity normalization, since small roughness changes could slightly amplify or suppress the D and G band intensities in an artificial manner. AFM measurements showed that the nanocomposite surface roughness increased with UV exposure (20 nm ± 2 nm to 190 nm ± 27 nm from 0 d to 60 d for a 7 μm × 7 μm area, triplicate areas of one specimen) and this may have affected the D and G band intensities after UV exposure. For this reason, all spectra were normalized to one G band intensity to determine if graphene accumulation had occurred at or near the surface via changes to the D band intensity. The normalized D band intensities showed some minor fluctuations, potentially due to changes in graphene orientation at the nanocomposite surface during UV degradation, but no statistically significant increase in the D band intensity value was observed, indicating a lack of detectable graphene concentration increase in the top 1 μm to 4 μm (Fig. S9). This normalization was possible since the ratios of the D and G band intensities (ID/IG) were found to not change. The lack of a statistically significant change to the ID/IG ratios also indicated that the graphene structure did not change (e.g., reduction or oxidation, lateral size changes, etc.) during UV exposure. (Fig. S8). Further details about the Raman spectroscopy measurements are provided in the Supplementary Data.
Fig. 4.

The raw D band (1311 cm−1) intensities of 3% G/TPU nanocomposites at different time points of dry UV, dry dark, humid UV, and humid dark exposure. The data is represented as the average and one standard deviation of measurements taken on three replicate specimens, with four measurements taken per specimen.
Fig. 5.

SEM images showing the surface morphology of neat TPU and 3% G/TPU before after exposure to 60 d of dry UV and humid UV conditions.
With Raman spectroscopy, the lack of D and G band intensity increase in the nanocomposite sub-surface did not necessarily mean that the graphene did not accumulate near the surface of the nanocomposite. For an increase in graphene concentration to be detected by Raman spectroscopy, a large thickness loss of polymer via degradation to gas would be required to increase the graphene concentration detected in the large Raman penetration depth (1 μm to 4 μm), especially with the low sensitivity and relative uncertainty observed with this technique. In our previous study, it took almost 40 μm of polymer loss to see a statistically significant change in GO concentration near the nanocomposite surface [15]. To further monitor changes to the graphene concentration exposed at the top nanocomposite surface, SEM was utilized. After 60 d of UV exposure, SEM imaging showed that the top surface of the 3% G/TPU nanocomposite had changed substantially from the nanocomposite surface imaged before UV exposure (Fig. 5). Specifically, the presence of many particle-like features that were consistent with the size and shape of graphene became more apparent and the surface morphology became rougher. Many sharp edges and platelet features were observed with a qualitatively larger amount of graphene-like features on the G/TPU nanocomposite exposed to humid UV conditions than for the G/TPU nanocomposite exposed to dry UV conditions (Fig. 5 and a larger-scale image in Fig. S10), consistent with the greater amount of polymer degradation observed with thickness loss. Although it was challenging to conclusively identify the graphene particles when present, especially in aggregated form at the UV-exposed nanocomposite surface, identification of graphene was based upon 1) the lack of similarly shaped particles on the neat TPU after the same humid UV and dry UV exposure time and 2) the difference between the surface morphology of the G/TPU nanocomposites before and after 60 d of UV exposure. The SEM images suggest that graphene accumulation occurred during polymer degradation and occurred to a greater extent for the nanocomposites exposed to humid UV conditions.
Further evidence of graphene accumulation at the nanocomposite surface was provided by contact angle (CA) measurements. CA determines the wetting ability of a surface with water and in this case, provides information regarding any changes to the hydrophilic/hydrophobic nature of the neat TPU and nanocomposite surfaces. Fig. 6 shows the CA of neat TPU and 3% G/TPU nanocomposites before and after 60 d of UV exposure under dry and humid conditions. Typically, a wetting surface, or hydrophilic surface, has a CA < 90° and a nonwetting surface, or hydrophobic surface, has a CA ≥ 90°. Before exposure, the CA for neat TPU and 3% G/TPU nanocomposites were 91° and 94°, respectively, and were statistically different, suggesting that some graphene may have been initially present at the nanocomposite surface. A CA above 90° for neat TPU also indicated that TPU was hydrophobic to start. After 60 d of humid UV exposure, there was a significant decrease in CA to 58° and 74° for neat TPU and 3% G/TPU nanocomposites, respectively. After dry UV exposure, the CA decreased more significantly than the humid UV samples to 43° and 54° for 0% and 3% G/TPU, respectively. The decrease in CA before and after exposure to UV (either under humid or dry conditions) indicates the propensity of the polymer matrix to change from a hydrophobic surface to a hydrophilic one due to the formation of hydrophilic photoproducts. Dry UV conditions likely led to the most significant decrease in hydrophobicity because these conditions led to the most build-up of hydrophilic photoproducts, as shown with FTIR and thickness loss. Despite the formation of hydrophilic photoproducts under both dry UV and humid UV conditions, the exposed graphene at the nanocomposite surface made the degraded nanocomposite surface much more hydrophobic than the degraded, neat TPU surface, which also contained hydrophilic photoproducts but lacked graphene. The difference in magnitude between the G/TPU nanocomposite CA and the neat TPU CA under the same conditions was larger under humid UV conditions than under dry UV conditions (17 degrees versus 10 degrees, respectively), indicating that more graphene was present at the nanocomposite surface after humid UV exposure. In summary, the 3% G/TPU nanocomposite was much more hydrophobic than neat TPU after 60 d of a given exposure condition (dry UV or humid UV) suggesting that graphene was present at the nanocomposite surface under both conditions. Furthermore, dry UV conditions led to lower overall CA values due to the formation of more hydrophilic photoproducts and the 3% G/TPU nanocomposites likely had a higher surface concentration of graphene under humid UV conditions than under dry UV conditions as indicated by the differences in CA magnitudes from the corresponding neat polymer controls.
Fig. 6.

Water contact angle (CA) of neat TPU and 3% G/TPU nanocomposites before (first two columns) and after 60 d exposure to humid UV (HU) and dry UV (DU) conditions. The data is represented as the average and one standard deviation of measurements taken on five droplets with at least two hundred measurements per droplet (n = 1000+). Different letters represent statistical differences (p-value<0.05) determined by an Analysis of Variance followed by a Tukey Highly Significant Difference test.
For further confirmation that graphene became exposed at the G/TPU nanocomposite surface, LSCM in fluorescence mode was utilized. Since the polymer photoproducts fluoresced in the Raman spectra (Fig. S6), LSCM images of the G/TPU nanocomposites were collected to identify if graphene was present based on how graphene affected the fluorescence signal in the LSCM images. This approach was taken since graphene lacks fluorescence and has the ability to quench fluorescence of surrounding material [30,48]. LSCM data showed that fluorescence from the neat TPU increased substantially after 60 d of UV exposure, with more intense fluorescence from the neat TPU exposed to humid UV conditions compared to the neat TPU exposed to dry UV conditions. This was consistent with the background fluorescence results obtained with Raman spectroscopy (Fig. S6) and the CA results (Fig. 6). In Fig. 7, the LSCM images for the 3% G/TPU nanocomposites showed that there was reduced fluorescence (using the same LSCM parameters for all images) coming from the 60 d photodegraded G/TPU samples, with an almost complete lack of fluorescence observed under humid UV conditions. Opposite to the fluorescence signal observed for the photodegraded neat TPU, the 3% G/TPU samples did not fluoresce to a large extent under dry UV or humid UV conditions despite the build-up of photoproducts in the top few microns of the nanocomposites. This suggested that graphene was present at the surface of the nanocomposite after UV exposure, with a greater concentration of graphene present after exposure to a combination of humidity and UV radiation. In general, these findings suggest that the presence of graphene at the degraded nanocomposite surface may lead to dermal exposure to humans during consumer use and exposure to organisms in the environment post-consumer use.
Fig. 7.

LSCM images showing the fluorescence intensity from 500 nm to 700 nm after excitation with a 405 nm laser (7% laser power) of neat TPU and 3% G/TPU before and after exposure to 60 d of dry UV and humid UV conditions.
3.5. Graphene release
The potential for graphene release from G/TPU nanocomposites was assessed using a tape transfer technique. Conductive tape (7 mm × mm) was applied to neat TPU and G/TPU nanocomposites before and after 60 d of UV exposure under dry and humid conditions. This approach was attempted twice on two sets of dry UV and humid UV degraded samples and the trends observed were found to be qualitatively consistent. After transfer of graphene particles to the tape, a conductive coating was applied to the tape to minimize charging effects and thus enable qualitative assessment of graphene release by SEM imaging. Based on the black color that visually appeared on the tape, it was immediately clear during the tape transfer technique that G/TPU nanocomposites exposed to humid UV conditions released graphene and did so to a greater extent than under dry UV conditions(Fig. 8). This was consistent with the appearance of graphene aggregates in SEM images of the tape after application to the nanocomposite surfaces (Fig. 9). In contrast, G/TPU nanocomposites exposed to dry UV conditions did not appear to visually release much more graphene (Figs. 9 and S13) than the unexposed G/TPU nanocomposites (Fig. S12). Under dry UV conditions, SEM images of the tape showed some graphene release but at a much lower amount than observed for the tape applied to the nanocomposites exposed under humid UV conditions (Figs. 9 and S13). Similar particles were not observed on tape controls and neat TPU after 60 d of humid UV (Fig. S12). These results indicate that graphene is more likely to release from G/TPU nanocomposites exposed to humid UV conditions than from nanocomposites exposed to dry UV conditions.
Fig. 8.

Stereo optical images of the tape applied to the surfaces of 3% G/TPU after exposure to 60 d of a) dry UV and b) humid UV conditions. Images were taken with the same microscope settings and contrast to show the visual appearance of black color across the tape surface due to graphene transfer from the humid-UV exposed G/TPU specimen. Note that circles are air entrapped in the tape.
Fig. 9.

SEM images of particles removed from the surface of neat TPU and 3% G/TPU after exposure to 60 d of dry UV and humid UV conditions. A tape-peel method was used. SEM control images of the tape used for the tape-peel method and the particles removed from the surface of neat TPU and 3% G/TPU before exposure to dry UV and humid UV conditions are shown in the SI.
Humid UV exposure led to a greater loss of polymer photoproducts and as a result, exposed more graphene, making it more available for release. The results from this study were consistent with a previous study by Wohlleben et al. for CNT/PNCs degraded by a combination of UV exposure and water spray [32]. Similar to the high humidity exposure in this study that led to released graphene covering the applied tape, the presence of moisture from rain spray in the study by Wohlleben et al. led to released CNTs covering the peeled tape surface [32]. In contrast, a study by Zepp et al. showed that the quantity of released material from graphene/epoxy nanocomposites was higher after dry UV exposure followed by rain spray than after a combination of UV exposure and repeated rain cycles [18]. In this other study, the increased release under dry UV conditions (followed by a single rain spray) was likely a result of the removal of a large build-up of hydrophilic polymer photoproducts by a single rain event and the simultaneous detection of both polymer fragments and graphene during release measurements [18]. Further comparison of different UV weathering protocols would be useful to assess best- and worst-case graphene release scenarios. The tape transfer technique was found useful to assess graphene release in this study since these hydrophobic nanomaterials were less likely to be removed by water spray and would be difficult to exfoliate in water for analysis of graphene release concentrations. Considering the challenges related to assessment of graphene release, further studies and test method development on release techniques for hydrophobic nanomaterials may be useful.
In contrast to our previous study where GO protruded from the surface and eventually released after long periods of UV irradiation [15], the exposed graphene particles at the nanocomposite surface in this study were generally found to accumulate and lie parallel with the surface structure after UV exposure. This was likely due to the hydrophobicity of the graphene compared to the hydrophilicity of the GO used in our previous study, which led to GO wrinkling at the nanocomposite surface after exposure to moisture, and easier identification of GO with SEM imaging [15]. As confirmed with thickness loss measurements, fewer polymer photoproducts were also removed from the G/TPU nanocomposite under humid UV conditions than from the GO/WBPU nanocomposite in our previous study, despite more loss of neat TPU photoproducts than neat WBPU photoproducts [15]. The difference in polymer photoproduct loss between the two studies may be partially attributed to differences in graphene/GO mass loading (3% versus 1.2%). But we hypothesize that the increased hydrophobicity of graphene may have also played a role in preventing polymer photoproduct loss by not spontaneously releasing in the presence of moisture and instead accumulating to a greater extent to protect underlying polymer from further degradation. In contrast, release of hydrophilic GO in our other study likely exposed more polymer for further degradation under humid UV conditions [15]. Thus, with more graphene present due to a lack of release, there was more protection of the underlying polymer and less polymer loss from the G/TPU nanocomposite compared to the GO/WBPU nanocomposite. However, upon contact with other materials or low mechanical forces as simulated with the tape-peel method, release of graphene and exposure of undegraded polymer may eventually still lead to further polymer degradation.
For environmental scientists and toxicologists to assess the risks of graphene nanofillers [1], this study highlights how a better understanding of graphene dose or exposure depends on the degradability of the polymer matrix in which the graphene is embedded. The durability of the polymer matrix is also an important factor for design to minimize contact of users (e.g., dermal contact) and the environment with graphene particles over a nanocomposite’s service life. In less durable polymers, application of a surface coating or paint to graphene/polymer nanocomposites may be a useful approach to lower the release potential and UV-induced nanocomposite surface exposure of graphene. Although graphene becomes exposed and has release potential when incorporated into TPU, the durability of the overall nanocomposite was still improved by ten times relative to neat TPU in terms of thickness loss, generally consistent with other studies that investigated the degradation of polymers containing graphene-family nanomaterials [15,19]. For this reason and the relatively high cost of graphene, it may be more advantageous to selectively incorporate graphene into polymer products designed for longevity of use, rather than short or single use that may lead to build-up of these products in landfills. Further study on mechanical property change of G/TPU nanocomposites following UV degradation (relative to the neat polymer controls) is also warranted to understand changes in material performance during product use. Another important consideration is nanocomposite product discoloration in the presence of UV light, which was readily apparent with this polymer matrix. This is a concern because it could lead to early disposal of graphene/nanocomposite products by consumers for aesthetic reasons rather than for decreased product function. Although graphene improves the durability of the TPU, it does not prevent discoloration of TPU, and the use of graphene with more UV-resistant polymer matrices may be worthwhile from the appearance perspective. Overall, this study demonstrates some important considerations for production of polymer nanocomposites containing graphene in terms of selection of polymers that degrade slowly, that are unaffected by moisture, and that maintain their initial appearance to provide a long service life.
4. Conclusions
The results of this study suggest that graphene, at a mass loading of 3%, improves the durability of TPU exposed to simulated sunlight exposure. Under humid UV conditions, graphene was found to protect the polymer matrix in the nanocomposite to a lesser extent than under dry UV conditions. However, the presence of graphene decreased the thickness loss of the polymer by an order or magnitude relative to the neat polymer under both dry UV and humid UV conditions. This suggests that graphene, unlike GO, can have the added benefit of increasing the service life of polymers in products at low mass loadings [15]. This study also highlights how care must be taken to measure material thickness loss in conjunction with FTIR results as steady-state photoproduct formation and removal can be difficult to interpret based solely on FTIR spectral changes. The surface exposure of graphene occurred during UV irradiation as demonstrated with SEM, contact angle, and fluorescence imaging, and occurred to a greater extent under humid UV conditions. The nanocomposite transformation results may be useful for other researchers investigating the implications of dermal contact with surface-exposed graphene during consumer use and ecotoxicity upon disposal. The release of graphene from G/TPU nanocomposites was observed when a small mechanical force from applied tape led to release of loosely-bound surface graphene to a small extent under dry UV conditions and to a visually observable extent under humid UV conditions. In summary, the chemical and physical mechanisms considered for this graphene/polymer nanocomposite degradation study as well as the techniques applied may be useful for experimental design by manufacturers, environmental scientists, toxicologists, and other researchers to assess the long-term performance and potential health and environmental considerations during in-service use and post-service disposal of graphene/polymer nanocomposites.
Supplementary Material
Acknowledgments
The authors would like to thank Paul Stutzman for his advice and expertise with respect to SEM imaging. Goodwin acknowledges the National Research Council (NRC) Associateship program for funding and support of this work. Kabir thanks the Montgomery College Internship program for funding his work on this study. Barrios and Perreault acknowledge the financial support of the National Science Foundation through the CBET-1708681 and EEC-1449500 awards. Barrios also acknowledges the support of a Dean’s Fellowship from the Ira A. Fulton Schools of Engineering and a Scholar Award given by the International Chapter of the P.E.O. Sisterhood. The authors also thank Željko Tomović for compounding the G/TPU and Patrizia-Marie Pfohl who provided the data for molar mass and cross-linking changes after UV exposure.
Footnotes
Declaration of Competing Interest
The authors declare that they have no known competing financial interests or personal relationships that could have appeared to influence the work reported in this paper.
CRediT authorship contribution statement
David G. Goodwin Jr: Conceptualization, Methodology, Validation, Formal analysis, Investigation, Resources, Writing - original draft, Writing - review & editing, Supervision. Shih-Jia Shen: Methodology, Investigation, Formal analysis. Yadong Lyu: Methodology, Investigation, Formal analysis. Ronald Lankone: Methodology, Investigation, Formal analysis, Writing - review & editing. Ana C. Barrios: Methodology, Investigation, Formal analysis, Writing - review & editing. Samir Kabir: Investigation, Formal analysis. François Perreault: Writing - review & editing, Supervision. Wendel Wohlleben: Conceptualization, Resources, Writing - review & editing, Supervision. Tinh Nguyen: Conceptualization, Writing - review & editing, Supervision. Lipiin Sung: Conceptualization, Resources, Writing - review & editing, Supervision.
Supplementary materials
Supplementary material associated with this article can be found, in the online version, at doi:10.1016/j.polymdegradstab.2020.109365.
Appendix A. Supplementary Data
The supplementary data contains triplicate Raman spectra for the graphene powder; full FTIR spectra of neat TPU and 3% G/TPU nanocomposites under dry UV, humid UV, dry dark, and humid dark conditions; the 700 cm−1 to 900 cm−1 FTIR spectral window, with spectra normalized to 770 cm−1, to show the contribution of the Photo-Fries reaction to the TPU photodegradation process; the carbonyl region of the FTIR spectra for neat TPU and 3% G/TPU nanocomposites exposed to humid dark and dry dark conditions; the background fluorescence observed in the Raman spectra for neat TPU under dry UV versus humid UV conditions at all UV exposure time points; the D and G band region of the Raman spectra for neat TPU and 3% G/TPU nanocomposites before and after 30 d of dry UV and humid UV exposure after baseline correction; plots of the D to G band intensity ratios at all time points under all exposure conditions to show any structural changes in the graphene particles in the top 1 μm to 4 μm of the degraded nanocomposites; plots of the D band intensity normalized to a single G band intensity to determine changes in graphene concentration in the top 1 μm to 4 μm of the degraded nanocomposites; a large-scale SEM image of a 3% G/TPU nanocomposite after 60 d of humid UV exposure to show the change in surface morphology; LSCM images in reflectance mode to show the focal planes identified and then used in fluorescence mode; SEM controls from the tape transfer technique for graphene release which includes images of the tape, a 3% G/TPU nanocomposite without UV exposure, and neat TPU after 60 d humid UV exposure; and replicate SEM images of released graphene after 60 d of dry UV and humid UV exposure with a higher magnification image shown for the humid UV conditions that yielded more released graphene particles.
NIST disclaimer
Certain commercial products or equipment are described in this paper in order to adequately specify the experimental procedure. In no case does such identification imply recommendation or endorsement by the National Institute of Standards and Technology, nor does it imply that it is necessarily the best available for the purpose.
References
- [1].Goodwin DG Jr, Adeleye AS, Sung L, Ho KT, Burgess RM, Petersen EJ, Detection and Quantification of Graphene-Family Nanomaterials in the Environment, Environ. Sci. Technol. 52 (8) (2018) 4491–4513. [DOI] [PMC free article] [PubMed] [Google Scholar]
- [2].Chee WK, Lim HN, Huang NM, Harrison I, Nanocomposites of graphene/polymers: a review, RSC Adv 5 (83) (2015) 68014–68051. [Google Scholar]
- [3]., Graphene products: introduction and market status, 2018. https://www.graphene-info.com/graphene-products
- [4].Asadi K, Timmering EC, Geuns TCT, Pesquera A, Centeno A, Zurutuza A, Klootwijk JH, Blom PWM, de Leeuw DM, Up-Scaling Graphene Electronics by Reproducible Metal–Graphene Contacts, ACS Appl. Mater. Interfaces 7 (18) (2015) 9429–9435. [DOI] [PubMed] [Google Scholar]
- [5].Zurutuza A, Marinelli C, Challenges and opportunities in graphene commercialization, Nat. Nanotechnol 9 (10) (2014) 730–734. [DOI] [PubMed] [Google Scholar]
- [6].Bae S, Kim H, Lee Y, Xu X, Park J-S, Zheng Y, Balakrishnan J, Lei T, Kim HR, Song YI, Roll-to-roll production of 30-inch graphene films for transparent electrodes, Nat. Nanotechnol 5 (8) (2010) 574–578. [DOI] [PubMed] [Google Scholar]
- [7].Mo M, Zhao W, Chen Z, Yu Q, Zeng Z, Wu X, Xue Q, Excellent tribological and anti-corrosion performance of polyurethane composite coatings reinforced with functionalized graphene and graphene oxide nanosheets, RSC Advances 5 (70) (2015) 56486–56497. [Google Scholar]
- [8].Cirillo G, Kozlowski MA, Spizzirri UG, Composites Materials for Food Packaging, John Wiley & Sons, 2018. [Google Scholar]
- [9].Su Y, Kravets V, Wong S, Waters J, Geim A, Nair R, Impermeable barrier films and protective coatings based on reduced graphene oxide, Nature Commun. 5 (2014) 4843. [DOI] [PubMed] [Google Scholar]
- [10].Yuan B, Fan A, Yang M, Chen X, Hu Y, Bao C, Jiang S, Niu Y, Zhang Y, He S, The effects of graphene on the flammability and fire behavior of intumescent flame retardant polypropylene composites at different flame scenarios, Polym. Degrad. Stab. 143 (2017) 42–56. [Google Scholar]
- [11].Li D, Kaner RB, Graphene-based materials, Nat. Nanotechnol. 3 (2008) 101. [DOI] [PubMed] [Google Scholar]
- [12].Mao L, Liu C, Lu K, Su Y, Gu C, Huang Q, Petersen EJ, Exposure of few layer graphene to Limnodrilus hoffmeisteri modifies the graphene and changes its bioaccumulation by other organisms, Carbon 109 (2016) 566–574. [DOI] [PMC free article] [PubMed] [Google Scholar]
- [13].Garacci M, Barret M, Folgoas C, Flahaut E, Chimowa G, Bertucci A, Gonzalez P, Silvestre J, Gauthier L, Zouine M, Pinelli E, Transcriptomic response of the benthic freshwater diatom Nitzschia palea exposed to Few Layer Graphene, Environ. Sci.-Nano 6 (5) (2019) 1363–1381. [Google Scholar]
- [14].Rabek JF, Polymer photodegradation: mechanisms and experimental methods, Springer Science & Business Media, 2012. [Google Scholar]
- [15].Goodwin DG Jr, Lai T, Lyu Y, Lu CY, Campos A, Reipa V, Nguyen T, Sung L, The Impacts of Moisture and Ultraviolet Light on the Degradation of Graphene Oxide/Waterborne Polyurethane Nanocomposites, NanoImpact (Just Accepted) (2020). [DOI] [PMC free article] [PubMed] [Google Scholar]
- [16].Hou W-C, Henderson WM, Chowdhury I, Goodwin DG, Chang X, Martin S, Fairbrother DH, Bouchard D, Zepp RG, The contribution of indirect photolysis to the degradation of graphene oxide in sunlight, Carbon 110 (2016) 426–437. [Google Scholar]
- [17].Hou W-C, Chowdhury I, Goodwin DG Jr, Henderson WM, Fairbrother DH, Bouchard D, Zepp RG, Photochemical transformation of graphene oxide in sunlight, Environ. Sci. Technol. 49 (6) (2015) 3435–3443. [DOI] [PubMed] [Google Scholar]
- [18].Zepp R, Ruggiero E, Acrey B, Davis MJ, Han C, Hsieh H-S, Vilsmeier K, Wohlleben W, Sahle-Demessie E, Fragmentation of polymer nanocomposites: modulation by dry and wet weathering, fractionation, and nanomaterial filler, Environ. Sci.-Nano 7 (2020) 1742–1758. [DOI] [PMC free article] [PubMed] [Google Scholar]
- [19].Shehzad F, Ahmad MI, Al-Harthi MA, Photooxidative degradation of graphene-reinforced high-density polyethylene nanocomposites, J. Appl. Polym. Sci. 136 (5) (2019) 47030. [Google Scholar]
- [20].Nguyen T, Petersen EJ, Pellegrin B, Gorham JM, Lam T, Zhao M, Sung L, Impact of UV irradiation on multiwall carbon nanotubes in nanocomposites: Formation of entangled surface layer and mechanisms of release resistance, Carbon 116 (2017) 191–200. [DOI] [PMC free article] [PubMed] [Google Scholar]
- [21].Petersen EJ, Lam T, Gorham JM, Scott KC, Long CJ, Stanley D, Sharma R, Alexander Liddle J, Pellegrin B, Nguyen T, Methods to assess the impact of UV irradiation on the surface chemistry and structure of multiwall carbon nanotube epoxy nanocomposites, Carbon 69 (2014) 194–205. [Google Scholar]
- [22].Lankone RS, Wang J, Ranville JF, Fairbrother DH, Photodegradation of polymer-CNT nanocomposites: effect of CNT loading and CNT release characteristics, Environ. Sci.-Nano (2017). [Google Scholar]
- [23].Najafi E, Shin K, Radiation resistant polymer–carbon nanotube nanocomposite thin films, Colloids Surfaces A: Physicochem. Eng. Aspects 257 (2005) 333–337. [Google Scholar]
- [24].Gu X, Chen G, Zhao M, Watson SS, Nguyen T, Chin JW, Martin JW, Critical role of particle/polymer interface in photostability of nano-filled polymeric coatings, J. Coat. Technol. Res 9 (3) (2012) 251–267. [Google Scholar]
- [25].Kumar AP, Depan D, Tomer NS, Singh RP, Nanoscale particles for polymer degradation and stabilization—trends and future perspectives, Prog. Polym. Sci. 34 (6) (2009) 479–515. [Google Scholar]
- [26].Kaur G, Adhikari R, Cass P, Bown M, Evans MDM, Vashi AV, Gunatillake P, Graphene/polyurethane composites, fabrication and evaluation of electrical conductivity, mechanical properties and cell viability, RSC Adv. 5 (120) (2015) 98762–98772. [Google Scholar]
- [27].Neubauer N, Wohlleben W, Tomović Ž, Conductive plastics: comparing alternative nanotechnologies by performance and life cycle release probability, J. Nanopart. Res. 19 (3) (2017) 112. [Google Scholar]
- [28].Council AC, Introduction to Polyurethanes: Thermoplastic Polyurethane, Products Technol. (2005) –2018. [Google Scholar]
- [29].Chin J, Byrd E, Embree N, Garver J, Dickens B, Finn T, Martin J, Accelerated UV weathering device based on integrating sphere technology, Rev. Scientif. Instrum 75 (11) (2004) 4951–4959. [Google Scholar]
- [30].Kasry A, Ardakani AA, Tulevski GS, Menges B, Copel M, Vyklicky L, Highly Efficient Fluorescence Quenching with Graphene, The Journal of Physical Chemistry C 116 (4) (2012) 2858–2862. [Google Scholar]
- [31].Wohlleben W, Meier MW, Vogel S, Landsiedel R, Cox G, Hirth S, Tomovic Z, Elastic CNT-polyurethane nanocomposite: synthesis, performance and assessment of fragments released during use, Nanoscale 5 (1) (2013) 369–380. [DOI] [PubMed] [Google Scholar]
- [32].Wohlleben W, Kingston C, Carter J, Sahle-Demessie E, Vázquez-Campos S, Acrey B, Chen C-Y, Walton E, Egenolf H, Müller P, NanoRelease: Pilot interlaboratory comparison of a weathering protocol applied to resilient and labile polymers with and without embedded carbon nanotubes, Carbon 113 (2017) 346–360. [DOI] [PMC free article] [PubMed] [Google Scholar]
- [33].Wilhelm C, Rivaton A, Gardette J-L, Infrared analysis of the photochemical behaviour of segmented polyurethanes: 3. Aromatic diisocyanate based polymers, Polymer 39 (5) (1998) 1223–1232. [Google Scholar]
- [34].Gardette JL, Lemaire J, Oxydation photothermique d’élastomères de polyuréthannes thermoplastiques, 2. Influence de la longueur d’onde et des conditions d’irradiation sur le jaunissement des polyuréthannes à structure aromatique, Die Makromolekulare Chemie: Macromol. Chem. Phys. 183 (10) (1982) 2415–2425. [Google Scholar]
- [35].Lemaire J, Siampiringue N, in: Prediction of Coating Lifetime Based on FTIR Microspectrophotometric Analysis of Chemical Evolutions, Service Life Prediction of Organic Coatings, American Chemical Society, 1999, pp. 246–256. [Google Scholar]
- [36].Thapliyal B, Chandra R, Advances in photodegradation and stabilization of polyurethanes, Prog. Polym. Sci. 15 (5) (1990) 735–750. [Google Scholar]
- [37].Gupta A, Rembaum A, Moacanin J, Solid state photochemistry of polycarbonates, Macromol. 11 (6) (1978) 1285–1288. [Google Scholar]
- [38].Bauer D, Mielewski D, The role of humidity in the photooxidation of acrylic melamine coatings, Polym. Degrad. Stab. 40 (3) (1993) 349–355. [Google Scholar]
- [39].Nguyen T, Martin J, Byrd E, Embree N, Relating laboratory and outdoor exposure of coatingsIII. Effect of relative humidity on moisture-enhanced photolysis of acrylic-melamine coatings, Polym. Degrad. Stab. 77 (1) (2002) 1–16. [Google Scholar]
- [40].Nguyen T, Martin J, Byrd E, Embree N, Relating laboratory and outdoor exposure of coatings: II, J. Coat. Technol. 74 (932) (2002) 65. [Google Scholar]
- [41].Gu X, Nguyen T, Sung L-P, VanLandingham MR, Fasolka MJ, Martin JW, Jean Y, Nguyen D, Chang N-K, Wu T-Y, Advanced techniques for nanocharacterization of polymeric coating surfaces, JCT Res. 1 (3) (2004) 191–200. [Google Scholar]
- [42].Bernard C, Goodwin D, Gu X, Celina M, Nyden M, Jacobs D, Sung L, Nguyen T, Graphene oxide/waterborne polyurethane nanocoatings: effects of graphene oxide content on performance properties, J. Coat. Technol. Res 17 (1) (2020) 255–269. [DOI] [PMC free article] [PubMed] [Google Scholar]
- [43].Gardette JL, Lemaire J, Oxydation photothermique d’élastomères de polyuréthannes thermoplastiques, 1. propriétés des hydroperoxydes formés, Die Makromolekulare Chemie: Macromol. Chem. Phys 182 (10) (1981) 2723–2736. [Google Scholar]
- [44].Kim H, Urban MW, Molecular level chain scission mechanisms of epoxy and urethane polymeric films exposed to UV/H2O. multidimensional spectroscopic studies, Langmuir 16 (12) (2000) 5382–5390. [Google Scholar]
- [45].Allen NS, Edge M, Mohammadian M, Jones K, UV and thermal hydrolytic degradation of poly(ethylene terephthalate): importance of hydroperoxides and benzophenone end groups, Polym. Degrad. Stab. 41 (2) (1993) 191–196. [Google Scholar]
- [46].Nuraje N, Khan SI, Misak H, Asmatulu R, The addition of graphene to polymer coatings for improved weathering, ISRN Polym. Sci 2013 (2013). [Google Scholar]
- [47].Bera B, Shahidzadeh N, Mishra H, Belyaeva LA, Schneider GF, Bonn D, Wetting of water on graphene nanopowders of different thicknesses, Appl. Phys. Lett. 112 (15) (2018) 151606. [Google Scholar]
- [48].Vempati S, Uyar T, Fluorescence from graphene oxide and the influence of ionic, π–π interactions and heterointerfaces: electron or energy transfer dynamics, Phys. Chem. Chem. Phys. 16 (39) (2014) 21183–21203. [DOI] [PubMed] [Google Scholar]
Associated Data
This section collects any data citations, data availability statements, or supplementary materials included in this article.