Transcriptional and proteomic profiling of individual cells have revolutionized interpretation of biological phenomena by providing cellular landscapes of healthy and diseased tissues1,2. These approaches, however, do not describe dynamic scenarios in which cells continuously change their biochemical properties and downstream ‘behavioural’ outputs3–5. Here we used 4D live imaging to record tens to hundreds of morpho-kinetic parameters describing the dynamics of individual leukocytes at sites of active inflammation. By analysing more than 100,000 reconstructions of cell shapes and tracks over time, we obtained behavioural descriptors of individual cells and used these high-dimensional datasets to build behavioural landscapes. These landscapes recognized leukocyte identities in the inflamed skin and trachea, and uncovered a continuum of neutrophil states inside blood vessels, including a large, sessile state that was embraced by the underlying endothelium and associated with pathogenic inflammation. Behavioural screening in 24 mouse mutants identified the kinase Fgr as a driver of this pathogenic state, and interference with Fgr protected mice from inflammatory injury. Thus, behavioural landscapes report distinct properties of dynamic environments at high cellular resolution.
Single-cell technologies have enabled the reconstruction of persistent cellular states and identities with extraordinary precision and resolution, in turn yielding valuable information on multiple biological scenarios6. Current technologies, however, cannot capture rapid transitions between cellular states in highly dynamic scenarios, such as during acute inflammatory responses, which are characterized by continuous changes in the motility and morphology of individual cells as they adapt to local cues and anatomical barriers. Intravital microscopy captures this dynamism at single-cell resolution7—however, few parameters are typically extracted from these experiments and cells are analysed as homogeneous populations, resulting in poor yields of biological information. Critically, however, how each cell moves and changes shape (that is, behaves) is the result of genetic and signalling networks that vary across tissues and cell types8, and should therefore contain information about core features of the cell. We posited that the behavioural traits of individual cells contain biological insights on the individual cells’ genetic and protein content, as well as their signalling networks9, which can be used to describe persistent cell identities or transient states in their native environment (Fig. 1a).
Fig. 1 |. Behavioural maps capture immune identities.
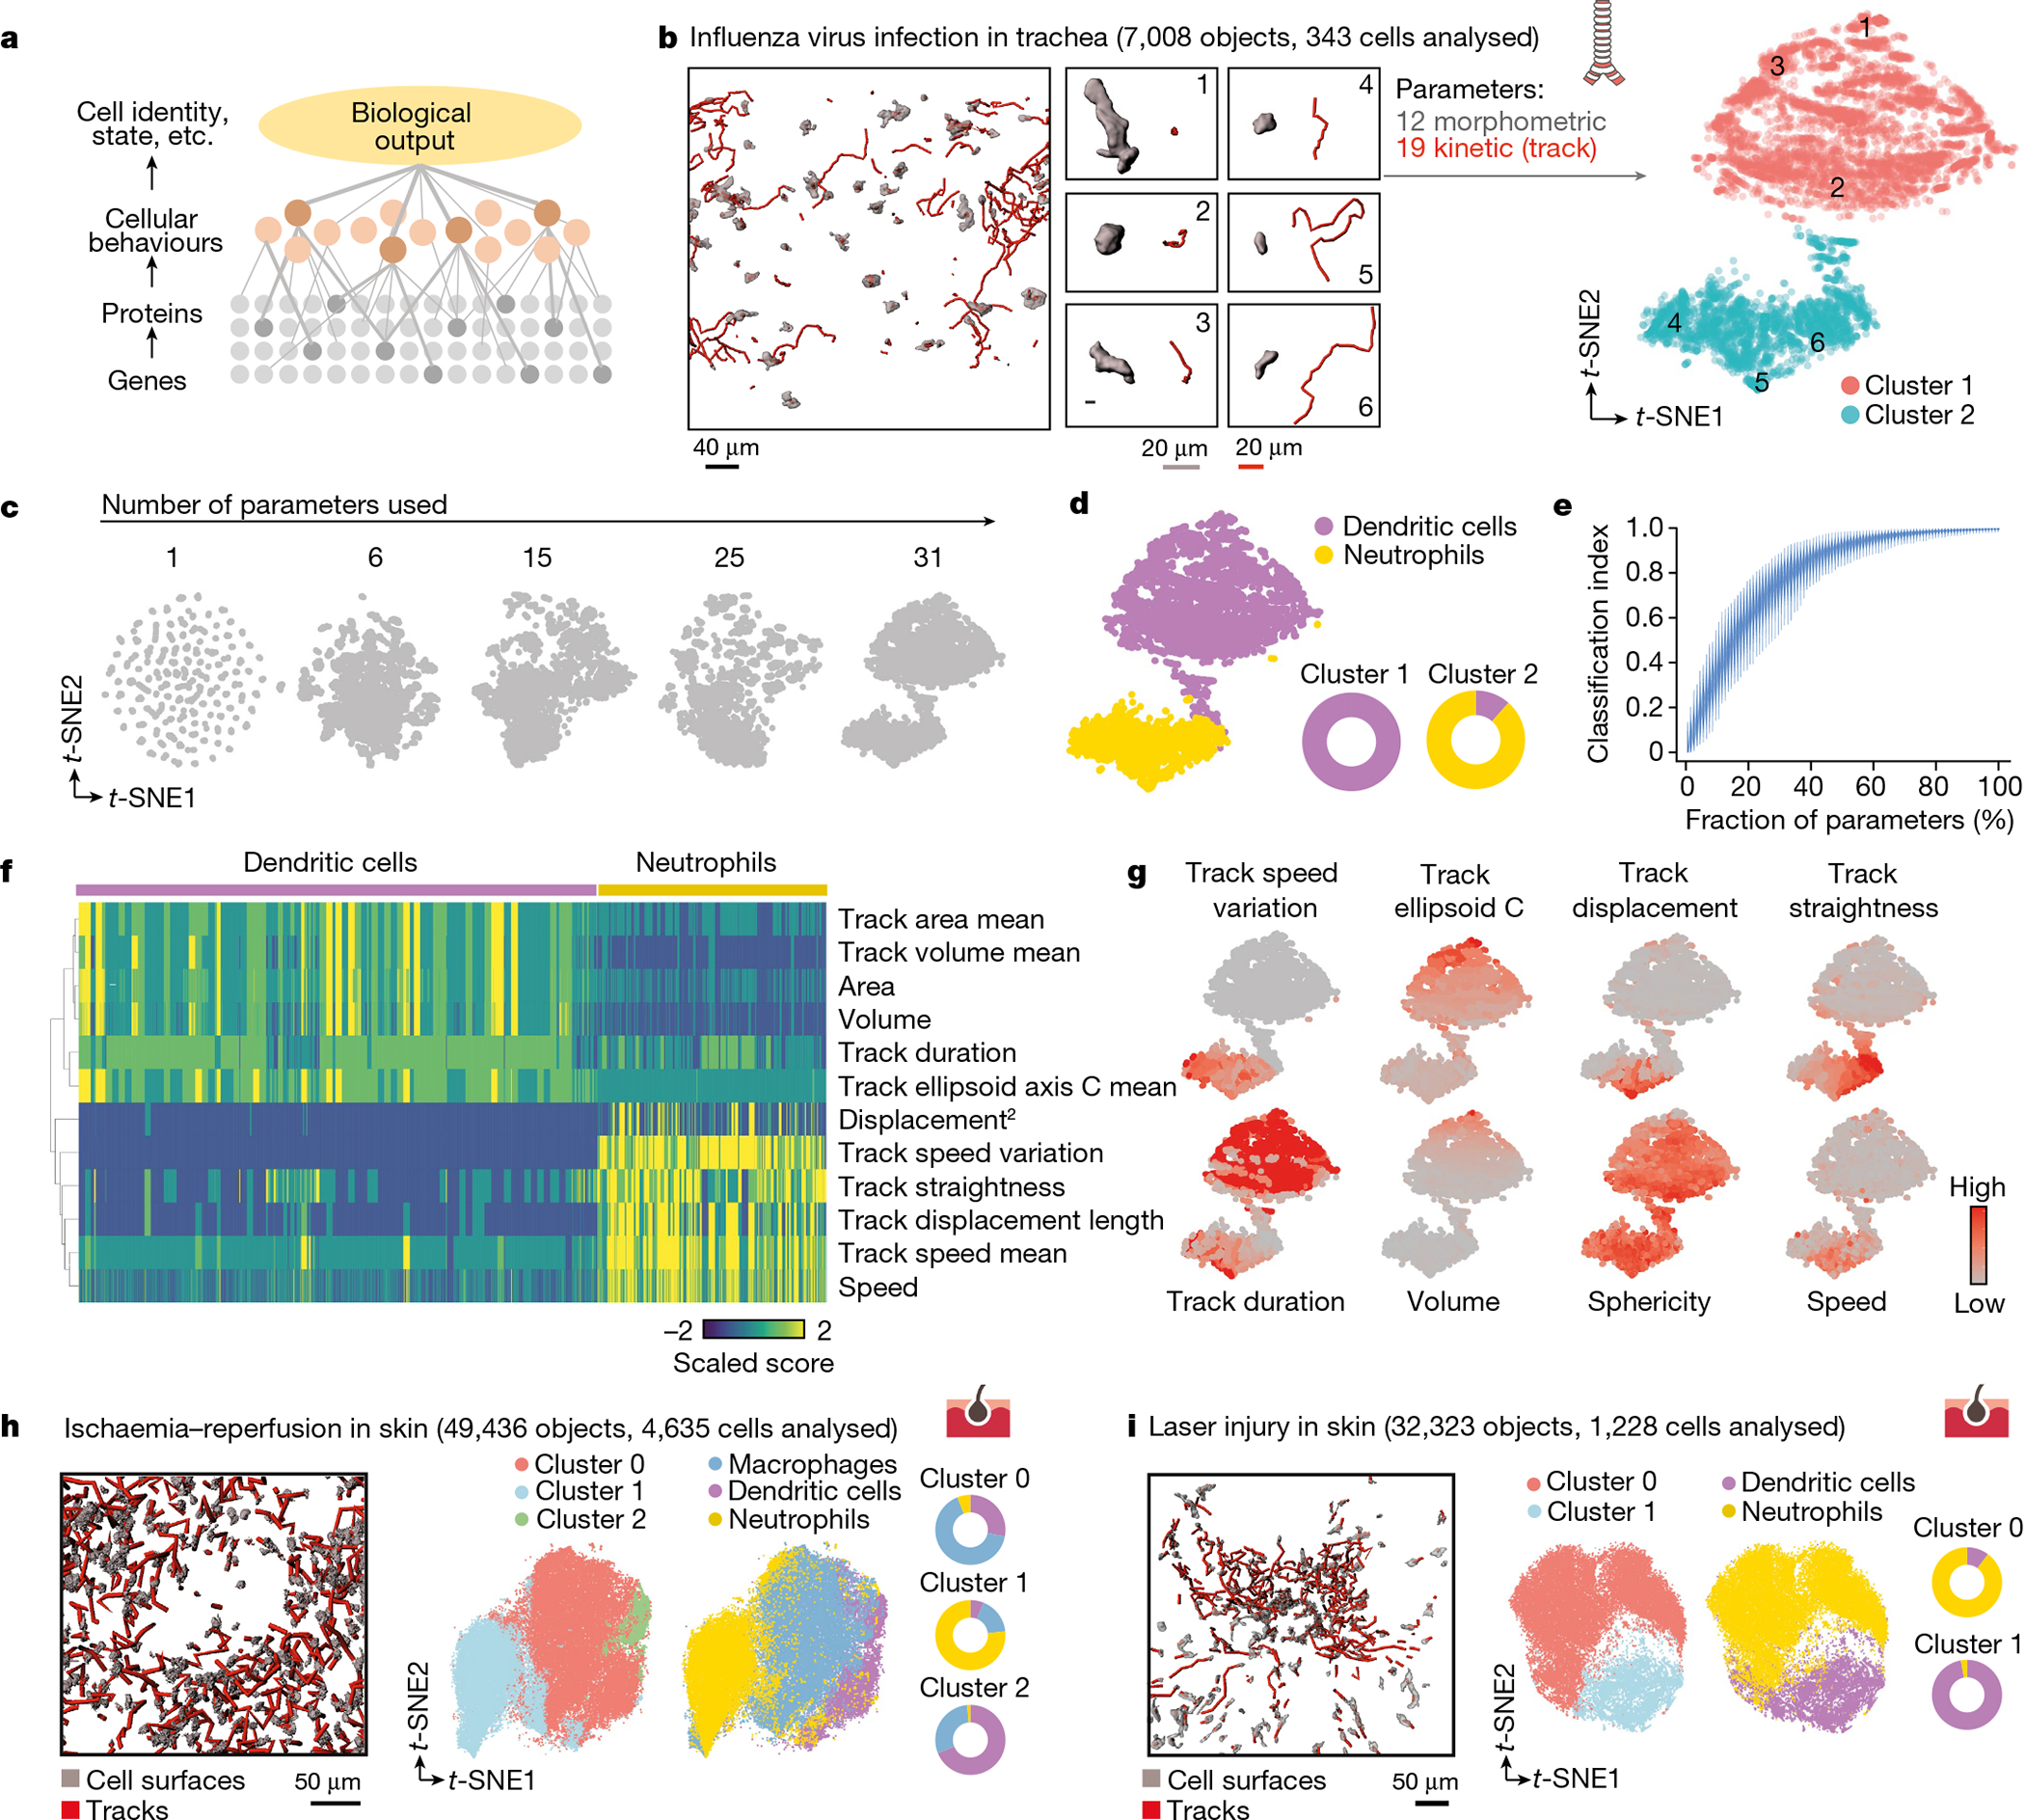
a, Flow of biological information. Cellular behaviours integrate information from the molecular background of cells and can be used to describe higher-order biological outputs at the single cell level. b, Representative 3D and track reconstructions of individual cells from images in tracheas of Cd11cYFP mice transferred with CFP+ neutrophils and infected with influenza. We obtained 31 morpho-kinetic parameters that we used to build bidimensional immune plots with the indicated number of cell-instances or total cells. Shown are six examples of cells and their location in the t-SNE plot (right). c, The accuracy of plots representing cell behaviours are a function of the number of parameters used for analysis. d, t-SNE plot reconstruction of the data in b from two independent experiments, showing the distribution of neutrophils and DCs as defined by driver gene expression (Methods). Doughnut plots indicate the accuracy of behaviours to score actual lineage identity. e, Qualitative stochastic model describing the change and variability in the level of knowledge of a biological system, here measured via a normalized classification index, as a function of the percentage of independent variables describing the system. f, Heat map of the differentially scored parameters for DCs and neutrophils. g, Expression t-SNE plots for the indicated parameters. h, i, Representative 3D tracks and reconstructions, as well as the corresponding t-SNE plots and donut plots, from images obtained in the skin during ischaemia–reperfusion (h), or the skin during laser-induced injury (i). The number of cells and all measured instances (objects) used in the analysis are indicated. Data are from three independent experiments for each model.
Behavioural immune profiles
To test this possibility, we used existing10,11 and new imaging experiments in defined tissues and inflammatory contexts, in which myeloid cells express cytoplasmic fluorescent proteins to enable precise measurement of their morphology and movement in a 3D space over time through multiphoton in vivo microscopy.
We first imaged cells in the trachea of Cd11cYFP (Cd11c is also known as Itgax) mice transferred with CFP+ neutrophils, infected with influenza virus (PR8 strain) and extracted 118 parameters describing features of motion and shape of hundreds of individual cells, at multiple temporal instants (Fig. 1b, Supplementary Video 1). After filtering out subcellular fragments (using a size filter; Extended Data Fig. 1a), we generated a correlation network to visualize the distribution of all parameters and facilitate the selection of those that best described cellular behaviours (Methods, Extended Data Fig. 1b–e). The selected 31 parameters (19 kinetic and 12 morphometric; see criteria for selection in Extended Data Fig. 1f–i and full list in Extended Data Fig. 2a, b, Supplementary Table 5) were used to generate a t-distributed stochastic neighbour embedding (t-SNE) plot that revealed two dominant groups of cells based on their behaviour and notably, segregation of the cells into these clusters was proportional to the number of parameters used (Fig. 1c, Extended Data Fig. 2c). Using independent information on leukocyte identities based on lineage marking (YFP for dendritic cells (DCs), CFP for neutrophils) not used for the initial classification, we found that this essentially overlapped with our behavioural profile (Fig. 1b–d). We used this information to build a qualitative stochastic approach modelling the relationship between the percentage of measured parameters and knowledge of a biological system, in this case the identity of leukocytes (Fig. 1e). Likelihood ratio indexes (LRIs) obtained from a logistic model revealed a relationship between the knowledge that could be inferred from a biological system and the percentage of variables used. Consistently, full knowledge (perfect score for every cell) was only possible with all 118 parameters (Extended Data Fig. 2d).
The multidimensional analyses further allowed us to examine the specific parameters that best discriminated leukocyte identities and clusters on the basis of behaviour (Fig. 1f, g). For example, dynamic changes in speed (track speed variation) was a better predictor of cell identity than parameters of absolute cell size and speed, suggesting that behavioural change stores biological information. We refined our correlation networks with the predictability strength of each parameter (given as LRIs; Extended Data Fig. 1b–d) and used expression plots and correlation matrices to infer specific biological features of interest in the trachea model. For instance, we noticed that neutrophils moved slower near DCs, and that DCs displayed highly homogeneous behaviours (Extended Data Fig. 2e, f).
We next tested these behaviour-based analyses in models of ischaemia–reperfusion and laser burn injury in the skin3,10,11 using the same set of parameters (Supplementary Videos 2, 3). In the ischaemia–reperfusion injury model, we found three major clusters largely matching the known cell types (neutrophils, DCs and macrophages; Fig. 1h, Extended Data Fig. 3a, b). Further sub-clustering allowed identification of two types of behaviourally distinct neutrophils, two types of DCs (CD11c+ cells) and three types of macrophages (Extended Data Fig. 3b, c). In the laser injury model, we again discriminated neutrophils from DCs with high accuracy (Fig. 1i) and found distinct behavioural patterns in neutrophils as they swarmed towards the injury site (Extended Data Fig. 4a–c). Because the generated dataset also contained spatial information for each cell, we built ‘behavioural maps’ by projecting selected parameters or behavioural signatures (clusters) onto cells in their actual location, thus enabling the association of individual traits or complex behavioural patterns (Extended Data Fig. 4d, e) with anatomical hallmarks of the tissue. In the ischaemia–reperfusion dataset, for example, these maps enabled us to visualize the distribution of the behaviourally distinct leukocytes into ischaemic and non-ischaemic regions of the skin (Extended Data Fig. 3c, bottom). Finally, these analyses enabled classification of distinct, but morphologically similar T cell populations in a tumour (Extended Data Fig. 4f, g), and unveiled behavioural changes of the same cell moving through different anatomical microenvironments (Extended Data Fig. 4h–j). Thus, cell behaviours captured by live imaging store biological information of cells in their native environments.
Behaviours of intravascular neutrophils
Cell states underlie dynamic changes in cell activation and are particularly relevant for cell subsets such as neutrophils, in which subtle changes in the proteomic or transcriptomic content can influence the outcome of inflammation12,13. We therefore challenged our model to generate behaviour-driven landscapes for neutrophil states during TNF-induced vascular inflammation in the cremaster muscle of LyzMGFP mice5 (Fig. 2a, Supplementary Video 4). To improve accuracy in the measurement of morphological and kinetic traits, as well as distances to the vessel wall, we implemented a custom-built analytical tool based on machine learning (ACME; Methods), which yielded 73 parameters (Supplementary Table 5) and enabled accurate description of intravascular adherent cells (Fig. 2b, c, Extended Data Fig. 5a, b).
Fig. 2 |. Behavioural landscape of intravascular inflammation.
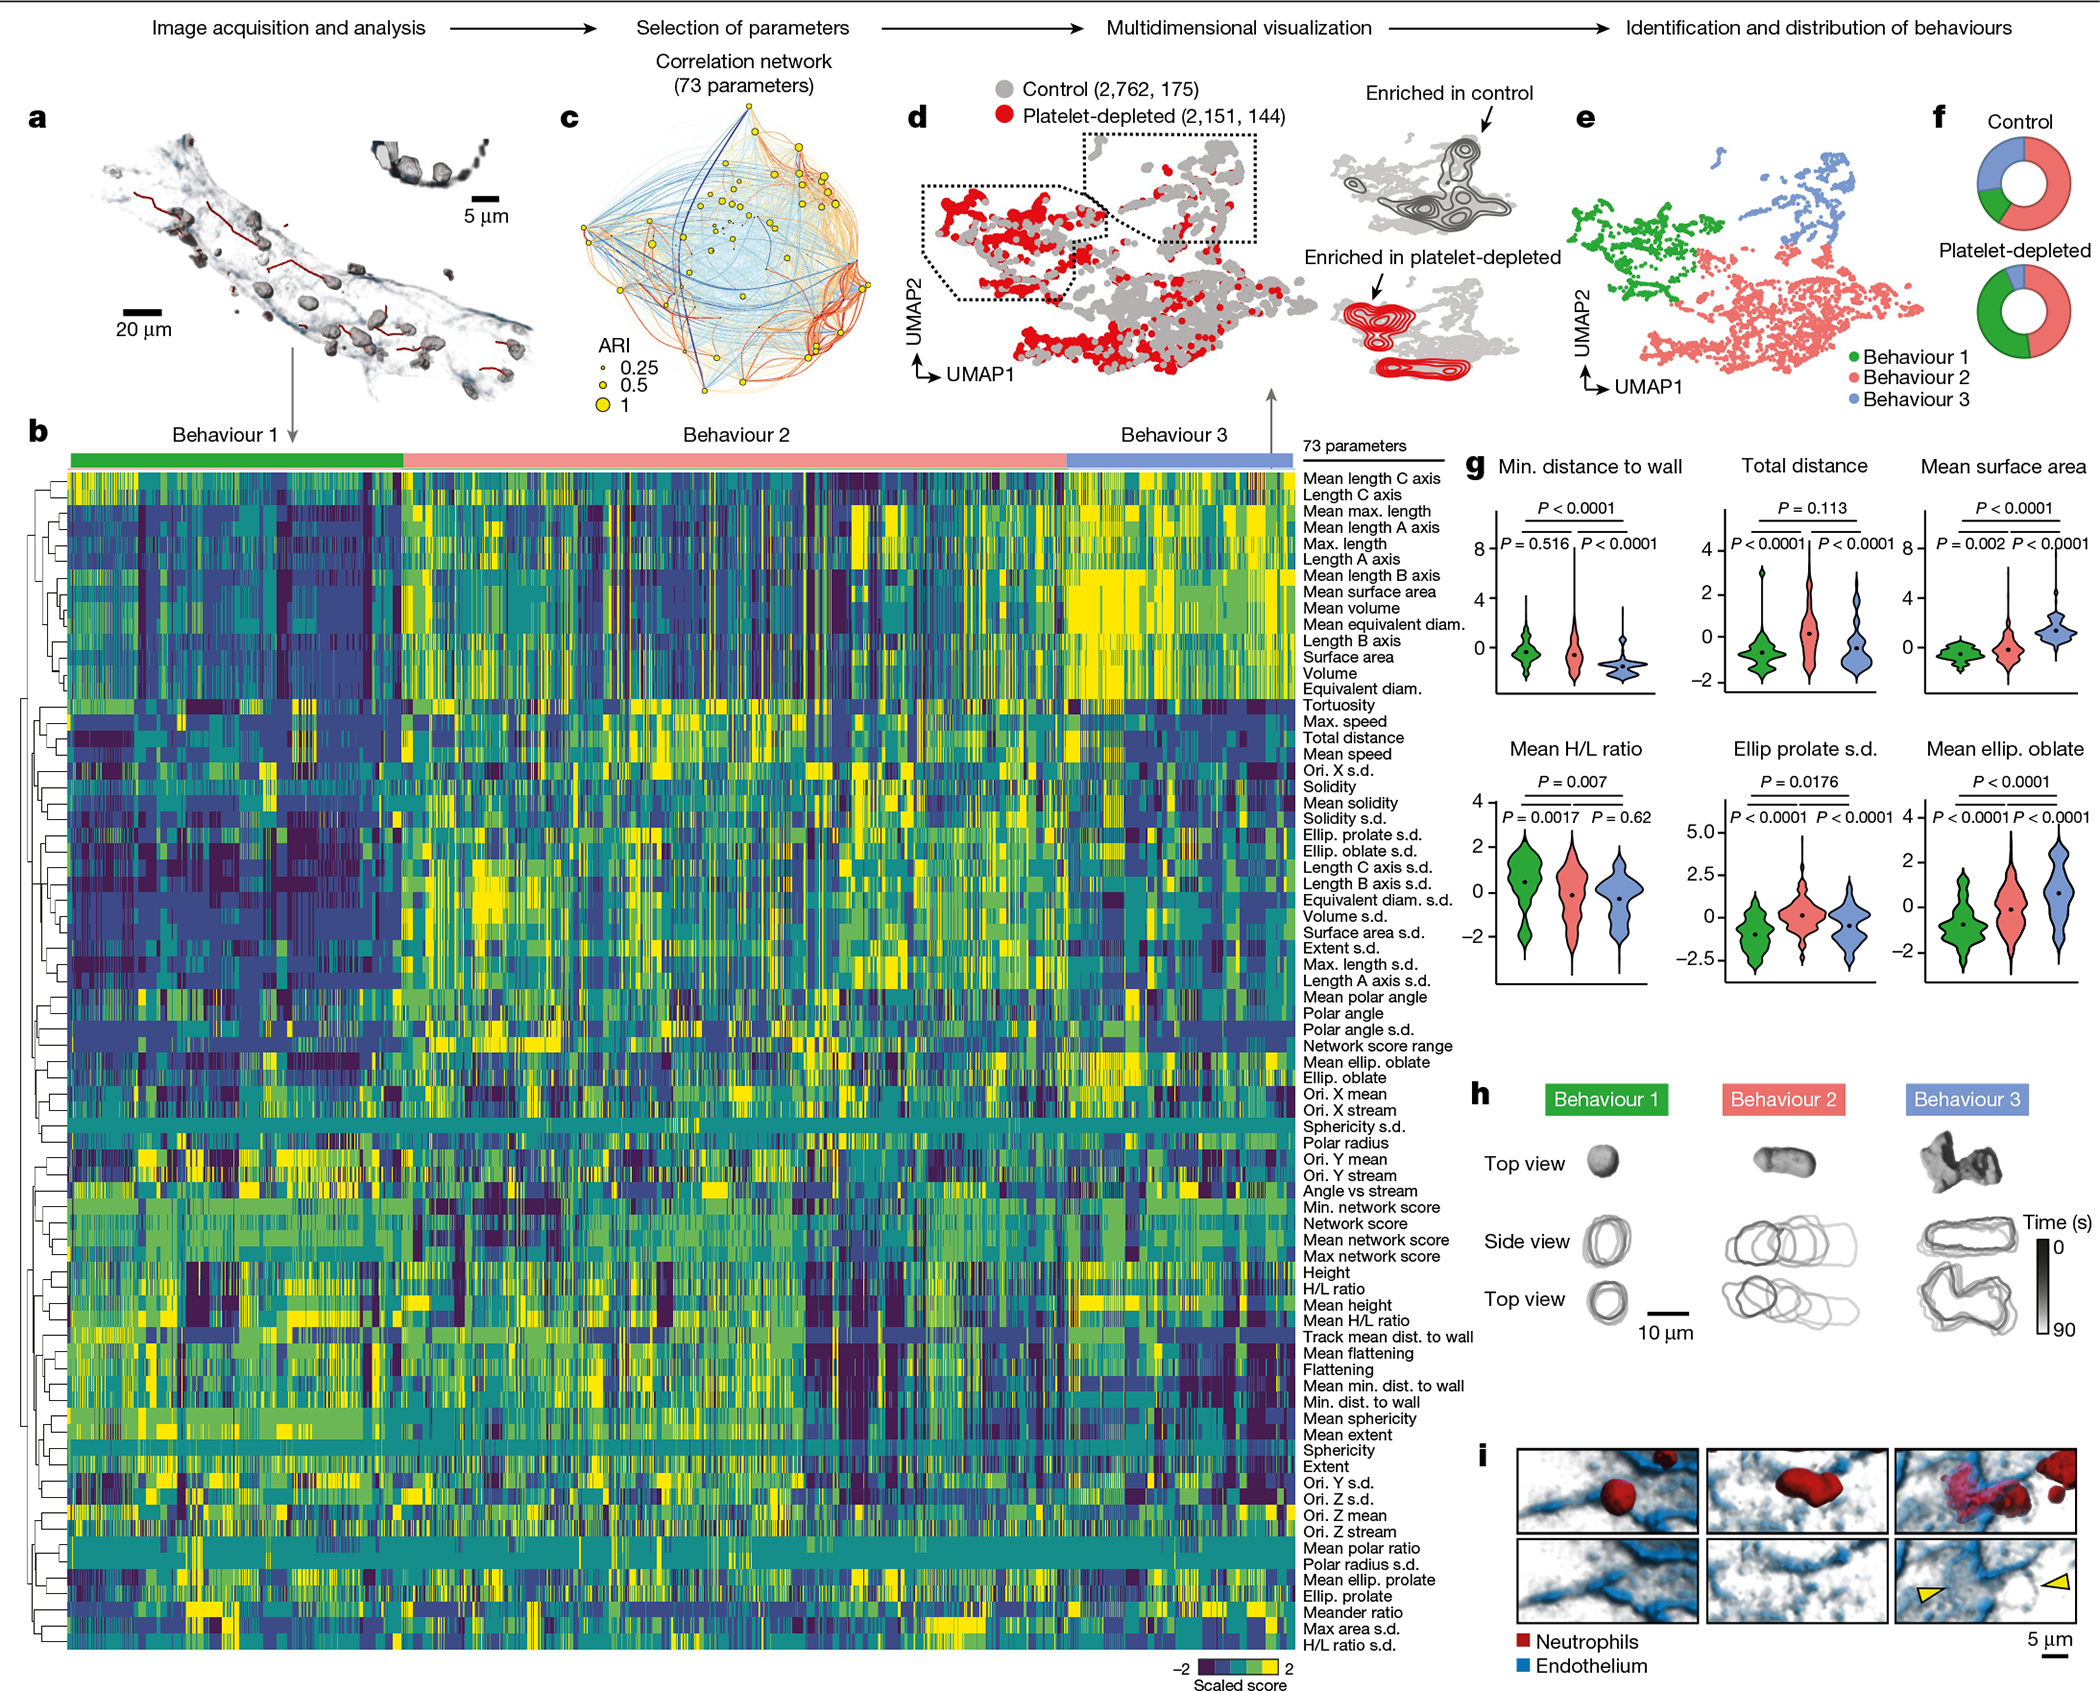
a, Representative 3D and track reconstructions of leukocytes inside an inflamed venule. Inset shows a cross-section of the same vessel. b, Heat map of the dataset obtained for neutrophils inside inflamed venules and all 73 morpho-kinetic parameters, distributed for the three identified behavioural profiles (behaviours 1–3). c, Correlation network of the dataset, showing parameters as nodes (circles) whose diameters are proportional to their adjusted Rand index (ARI), with lines connecting pairs of parameters coloured according to positive (red) and negative (blue) correlations. The thicknesses of the links are proportional to the Pearson correlation coefficient for each pair. d, t-SNE representation of 4,913 temporal cell reconstructions (319 cells) from control and platelet-depleted mice. Density plots at right show the differential distribution of events for each group. Data are from at least four mice per group. e, f, Uniform manifold approximation and projection (UMAP) plot showing the three distinct behavioural clusters (labelled with colours) (e), and the distribution of cells in each cluster for the control and platelet-depleted groups (f). g, Violin plots for the indicated parameters across the three behavioural groups. Data were analysed using univariate multinomial model. h, Volumetric reconstruction of representative cells from behavioural clusters 1–3 (top) and temporal outlines (bottom). i, 3D reconstruction of the same cells shown in h, showing an endothelial footprint (arrowheads) only for the B3 cell. Diam., diameter; Dist., distance; Max., maximum; Min., minimum; Ellip., ellipticity; ori., orientation.
We performed experiments in control untreated mice susceptible to pathogenic inflammation, as well as in mice protected from acute inflammatory injury by depleting platelets before TNF treatment, as interactions with platelets activate intravascular neutrophils4. By integrating datasets from both conditions, we found three main behavioural clusters (B1–B3) (Fig. 2d, e). B1 dominated in platelet-depleted mice, B3 dominated in inflammation-prone control mice and B2 was common to both groups (Fig. 2d–f). Neutrophils from control mice appeared in all behavioural groups, suggesting that the three behaviours coexist and that preventing pathogenic inflammation preferentially targeted B3 behaviours.
Careful examination of the behavioural parameters defining each cluster revealed that cells in B1 were more spherical, had their centre of mass more distant to the vessel wall and a higher height-to-length ratio (H/L ratio) (that is, extension towards the lumen versus the vessel wall; Fig. 2g). Cells in B3 were the largest in size (length, area and volume), had an oblate morphology and their centre of mass was close to the vessel wall. Cells in both B1 and B3 featured low speeds and were often sessile. By contrast, cells in the common B2 group moved rapidly and featured dynamic changes in movement and shape as indicated by high values in the s.d. for most parameters (Fig. 2b, g). B2 cells also featured ameboid shapes and moved in conspicuous stretch–shrink cycles (Fig. 2h, Extended Data Fig. 5c, Supplementary Video 5). Notably, we found that B3 cells in close apposition to the vessel wall associated with the presence of ‘footprints’ on the endothelial substrate (Fig. 2i) as well with endothelial extensions covering part of the neutrophils, none of which were observed in cells from B1 or B2 (Extended Data Fig. 5d). We confirmed these behavioural patterns using a different neutrophil reporter line14 (Ly6gcre; Rosa26tdTom mice; Extended Data Fig. 5e, f). The behavioural patterns identified in our analyses matched activation states of intravascular neutrophils as defined by surface expression of CD11b and phagocytosis of albumin-coated beads15, both of which predominated in B1 and progressively declined in B2 and B3 (Extended Data Fig. 5g, h). Finally, B3 neutrophils typically localized near endothelial junctions, but only a small fraction extravasated, whereas B2 neutrophils transmigrated more efficiently, and those in B1 did not extravasate (Extended Data Fig. 5i–k).
Hierarchical classification allowed us to find three distinct sub-behavioural patterns within B2 (B2.1, B2.2 and B2.3) (Extended Data Fig. 6a, b). All sub-clusters maintained the dynamism typical of the B2 cluster, but featured morphological properties and distances to the vascular wall reminiscent of either the B1 or the B3 groups (Extended Data Fig. 6c), suggesting dynamic transitions between the different behavioural groups. By tracking the behavioural ‘history’ of each cell we found that transitions between behaviours were frequent (occurring in 17–24% of cells), particularly when cells were in B2 or within different B2 sub-behaviours (occurring in 23% of cells). By contrast, direct transitions between B1 and B3 were rare (4%), suggesting that they were extremes of a behavioural continuum, and that B2-type behaviours represented transitional states of intravascular neutrophils (Extended Data Fig. 6d, e).
Regulators of intravascular behaviours
We screened for genetic drivers of inflammogenic behaviours of neutrophils by scoring key behavioural traits defining each group using a combination of kinetic and 3D imaging inside inflamed vessels. We prioritized proportional cell measures as they provided more robust values between the different experimental groups, including H/L ratios discriminating B1 from B3, prolate shape (typical of B1 and B2), and kinetic parameters defining B2 (Extended Data Fig. 7a).
In conditions that prevent pathogenic neutrophil activation, including platelet depletion and mice lacking the receptor PSGL-14 (Selplg−/−), we found high H/L ratios and decreased prolate shapes and cell movement, consistent with neutrophils transitioning away from B3 behaviours (Figs. 2g, 3). Thus, we scored for these behavioural parameters in 24 mutant mouse lines defective in genes previously known to be involved in different stages of neutrophil activation (Fig. 3a, Supplementary Table 1 and ref. 16). The analyses enabled us to generate a behaviour-based classification for each mutant (Fig. 3b, c, Extended Data Figs. 7b, 8) and hierarchical clustering of the behavioural profiles revealed a group of five genes whose loss led to anti-inflammatory features reminiscent of those seen in the platelet-depletion and Selplg−/−groups (Fig. 3c). These genes encoded for activating receptors (Fpr1 and CXCR2), upstream signalling regulators (Fgr and the adaptors Fcgr and Tyrobp), and a small GTPase (Rap1a). Since intravascular neutrophils transit between behavioural states (Extended Data Fig. 6d, e), these results suggested that dynamic on–off engagement of behaviours is dominated by a relatively small repertoire of signalling pathways, and raised the possibility to target them to protect from vascular inflammation.
Fig. 3 |. Screening for drivers of pathogenic intravascular behaviours.
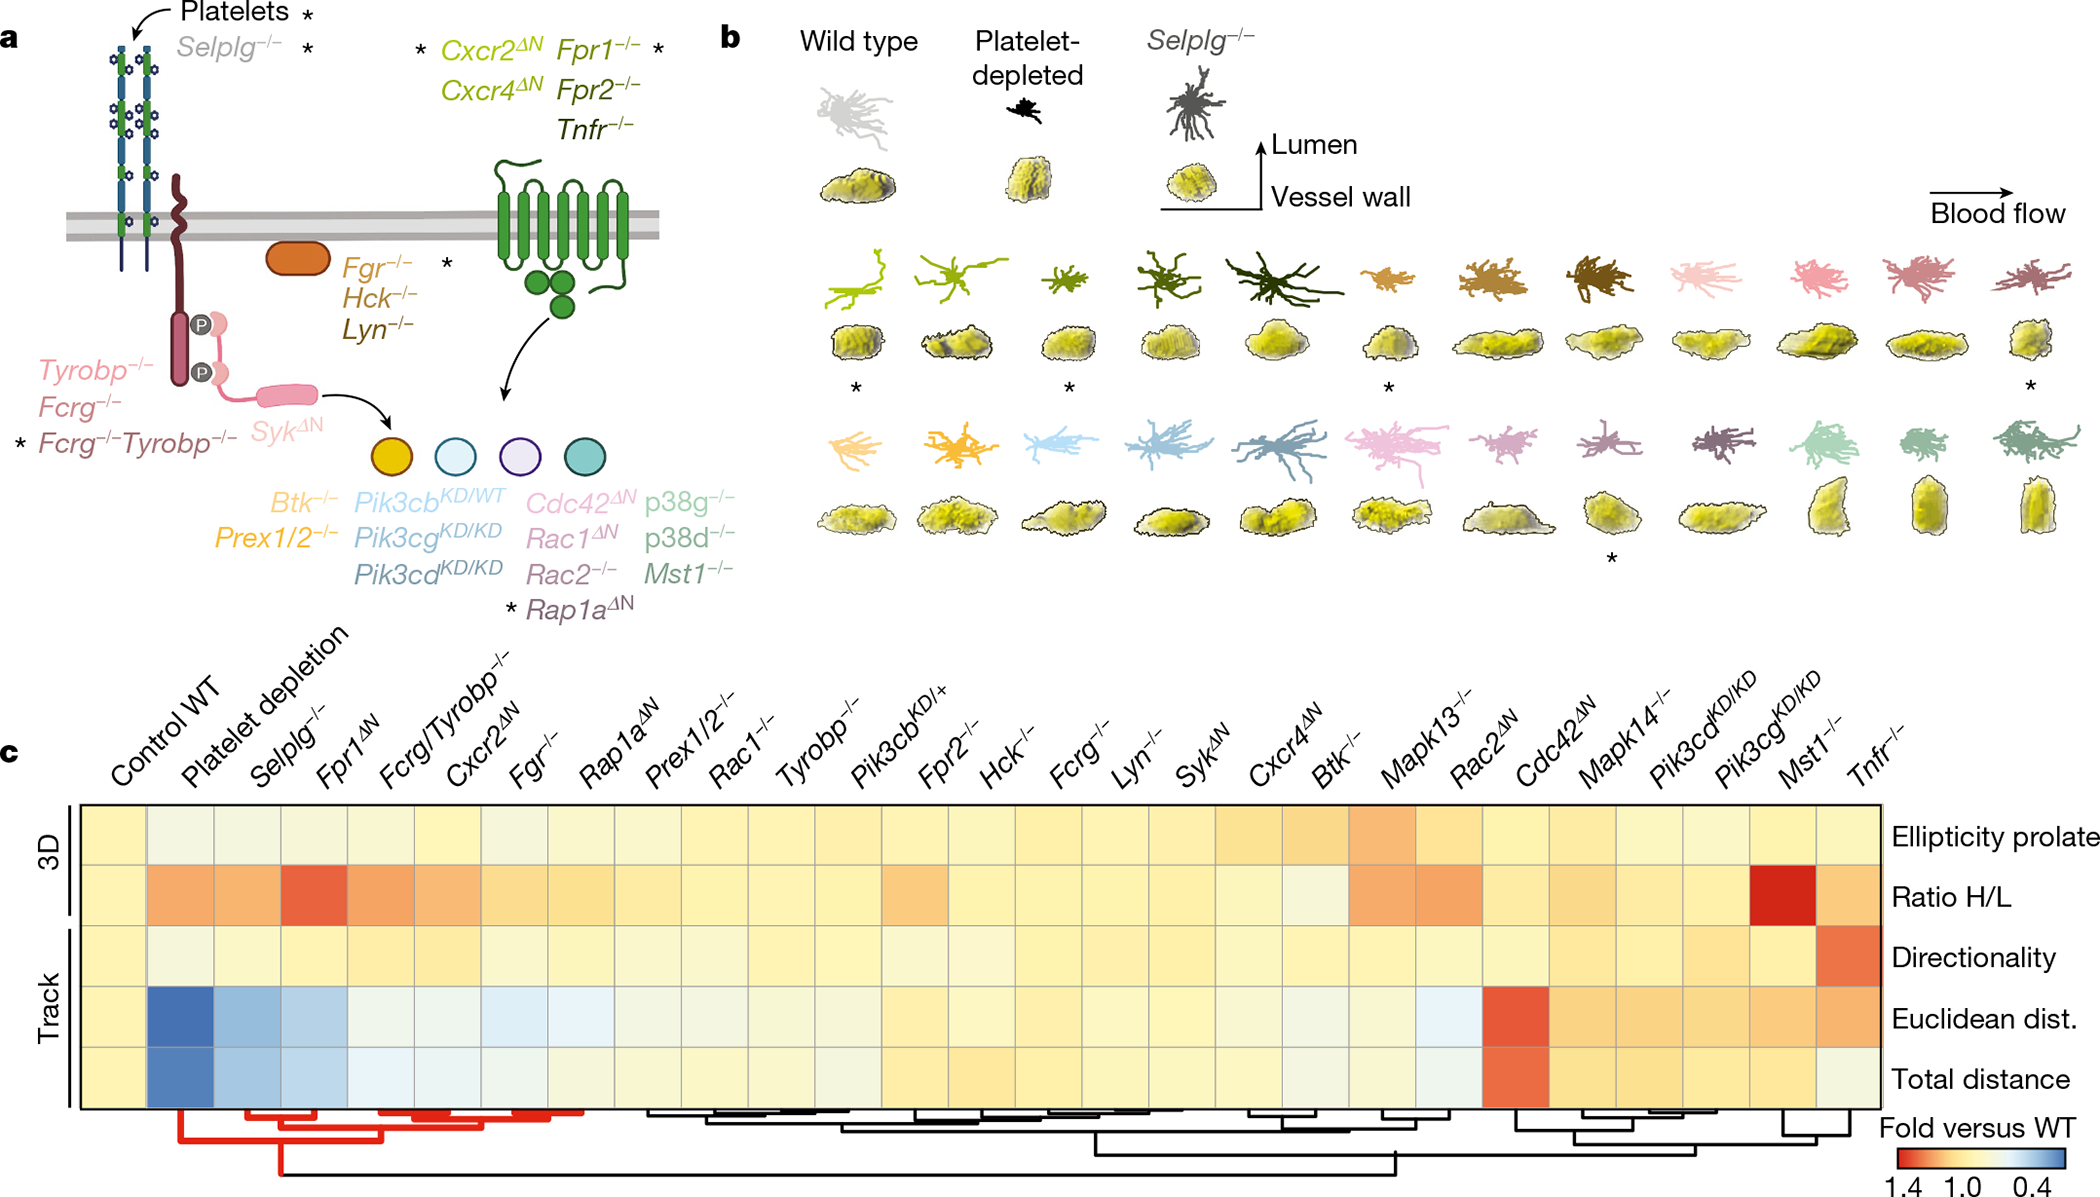
a, Neutrophil signalling pathways, showing the genes analysed here. Control, platelet-depleted and Selplg−/− mice were used as reference groups in the screening. Asterisks denote mutants and conditions with behavioural changes similar to those in the reference groups. b, Representative 2D tracks and corresponding 3D morphologies for each condition and mutant, which are colour-coded to match the genes shown in a, including asterisks to mark the same mutants. c, Heat map of relative changes over control for the 5 selected behavioural parameters (right), for all 24 mutants and 3 reference groups, which were used as reference for protection from inflammation. Individual analyses and sample sizes are shown in Supplementary Figs. 7, 8. Hierarchical clustering identifies five mutant behaviours that group together with the reference groups (red lines below). Data are from 3,736 cells from at least 3 mice per group and type of analysis. Mapk13 encodes p38δ and Mapk14 encodes p38γ; WT, wild type.
Behavioural reprogramming
Among the hits identified in our screening we focused on Fgr because this Src kinase has not been independently associated with altered inflammation16, and its deficiency did not compromise neutrophil recruitment to sites of inflammation or NET production (Extended Data Fig. 9a, b). Behavioural landscapes of intravascular neutrophils from Fgr−/− mice revealed marked behavioural shifts from B3 to B2 relative to control mice (Fig. 4a, b), and similar shifts to non-pathogenic behaviours were found in mice treated with the Fgr inhibitor TL02–5917 (Fig. 4c), indicating that behavioural landscapes are amenable to genetic and pharmacological intervention.
Fig. 4 |. Behavioural reprogramming protects from inflammation.
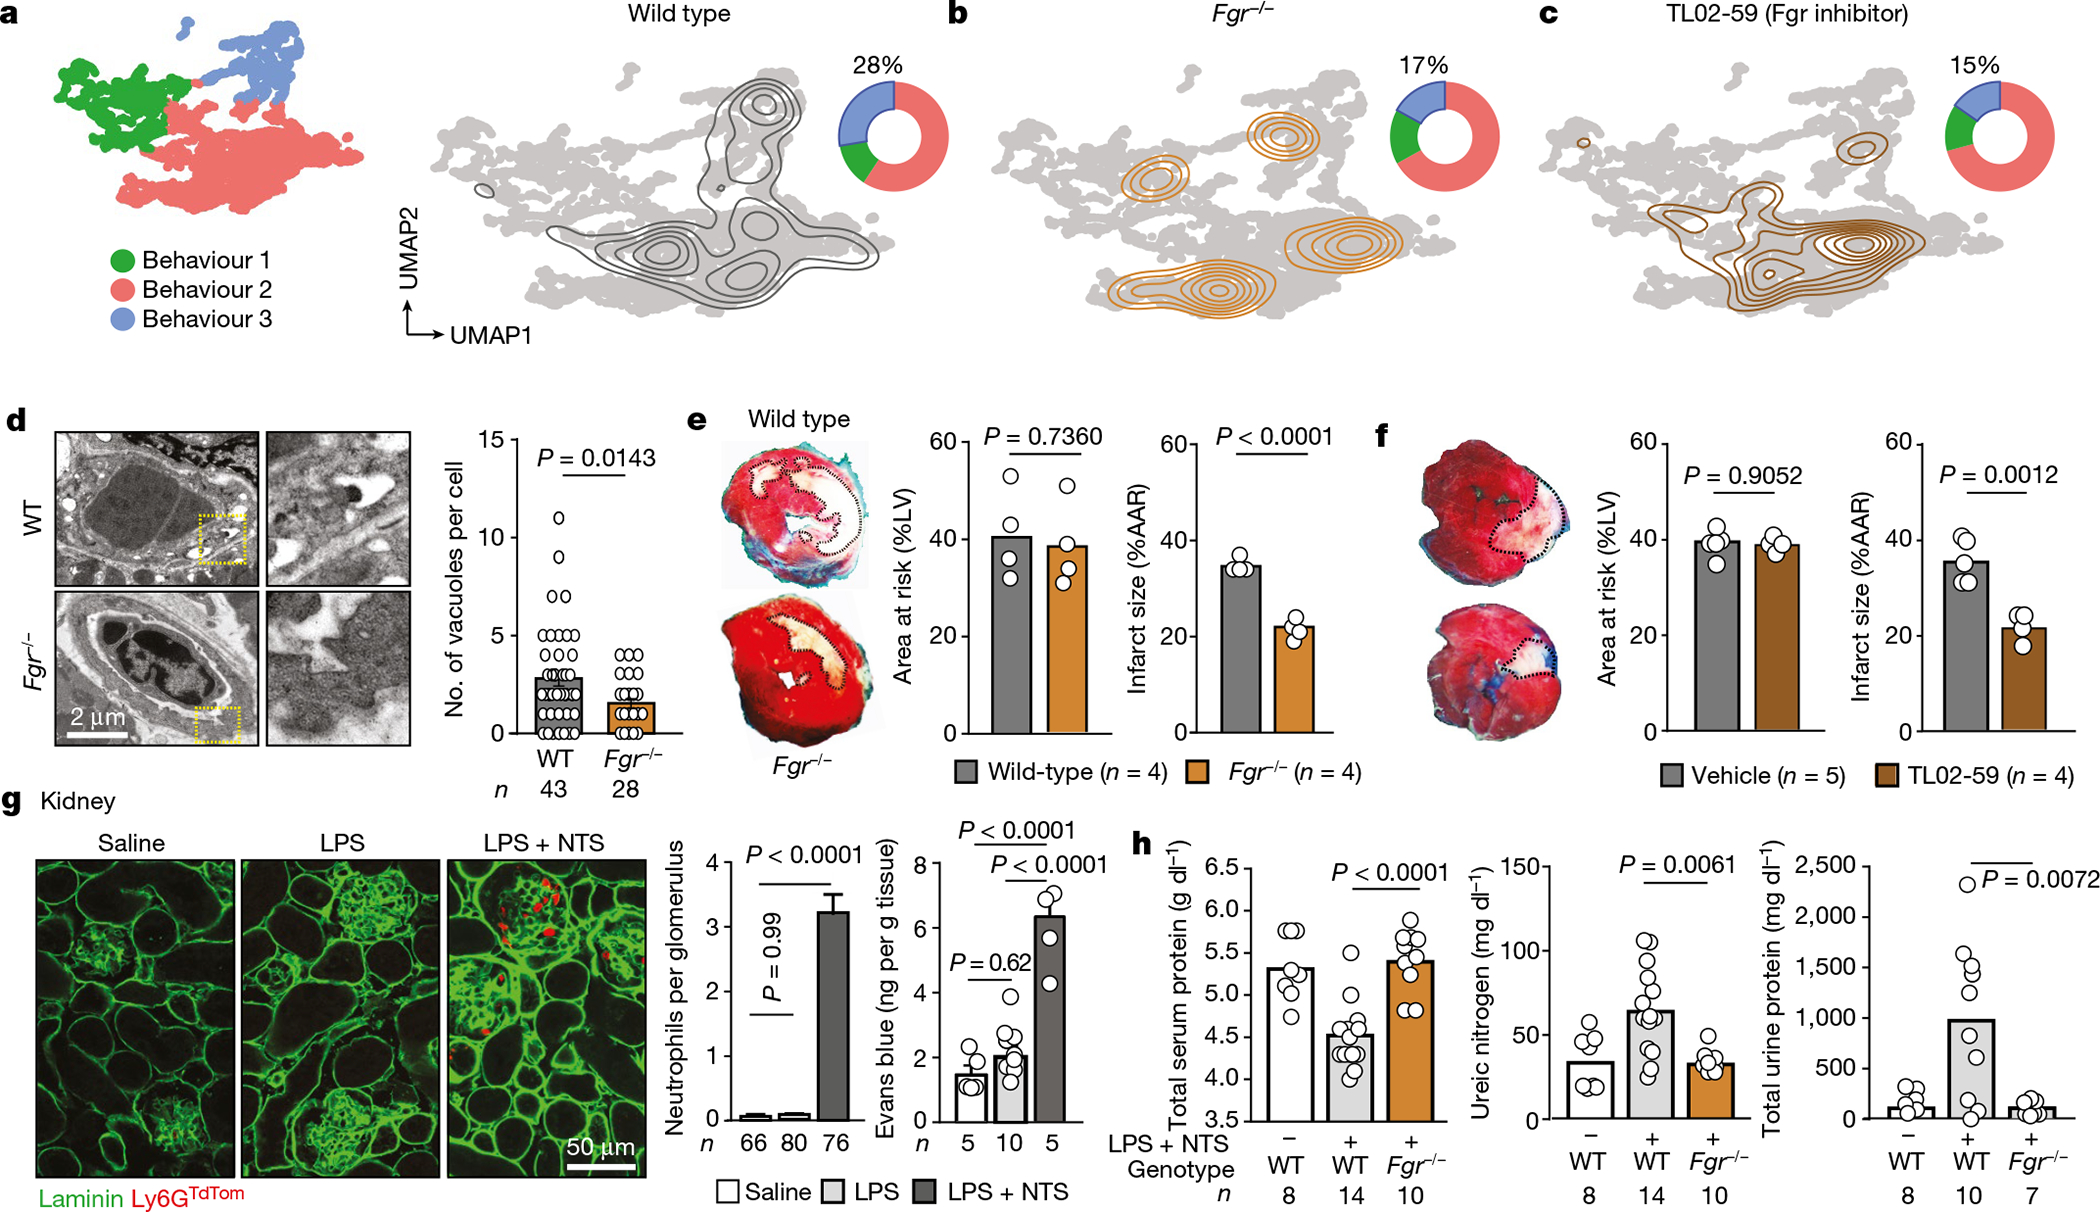
a, UMAP plot showing the distribution of the three behavioural groups (left), density plot for the wild-type control group layered over the global UMAP plot (right) and doughnut plot showing the distribution of cells among the three behavioural clusters. b, c, Similar UMAP and doughnut plots to those in a were built for mice reconstituted with Fgr−/− bone marrow (b) or treated with the Fgr inhibitor TL02–59 (c). Note the shift of cells away from B3 after interfering with Fgr. Numbers in doughnut plots indicate the percentage of cells in B3. d, Vascular damage during myocardial ischaemia–reperfusion determined by vacuolation of endothelial cells in hearts, from images obtained by transmission electron micrographs and quantified right; n is the number of vascular sections analysed. e, f, Protection from myocardial injury in Fgr−/− mice (e) or wild-type mice treated with the inhibitor TL02–59 (f) after normalization to the areas at risk. The dead myocardial area is outlined in white in the heart sections; n is the number of mice analysed. g, Glomerulonephritis model. Left, immunofluorescence of kidney tissue showing accumulation of neutrophils in glomeruli after injury induced by lipopolysaccharide (LPS) and nephrotoxic serum (NTS). Right, quantification of neutrophils accumulated per glomerulus; n is the number glomeruli analysed. Data are mean ± s.e.m. Right, vascular damage measured by Evans blue extravasation; n is the number of mice. h, Analysis of serum and urine in control and glomerulonephritis-induced wild-type and Fgr−/− reconstituted mice. All data are means and were analysed by two-tailed unpaired t-test (d–f), or one-way ANOVA with Tukey’s multiple comparison test (g, h). The number of replicates per group (n) is indicated in each panel.
We then examined the therapeutic potential of targeting Fgr-driven behaviours in two models of inflammation. We first used a model of ischemia–reperfusion heart injury (modelling acute myocardial infarction13,18), in which neutrophils cause early vascular activation and damage (Extended Data Fig. 9c–e). Both endothelial damage and death of myocardial tissue were strongly reduced in mice lacking Fgr in leukocytes (Fig. 4d, e) or in mice treated with the Fgr inhibitor prior to ischaemia (Fig. 4f) or at the time of reperfusion (Extended Data Fig. 9f). Although Fgr deficiency in our model was not restricted to neutrophils, we found that depletion of neutrophils prevented the beneficial effects of Fgr gene deletion (Extended Data Fig. 9g) or inhibition (Extended Data Fig. 9h), and that the TL02–59 inhibitor did not protect Fgr−/− mice further (Extended Data Fig. 9i), indicating that cardiac protection was through specific targeting of Fgr in neutrophils. Interestingly, Fgr mutants were also protected from long-term cardiac fibrosis (Extended Data Fig. 9j). Thus, single depletion or inhibition of the Fgr kinase protects from neutrophil-mediated inflammatory injury.
We finally used a model of glomerulonephritis induced by low dose endotoxin combined with anti-glomerular serum (ref. 19 and Extended Data Fig. 10a). This model featured accumulation of neutrophils in glomeruli, increased vascular permeability (Fig. 4g) and occlusion (Extended Data Fig. 10b), suggesting that glomerular vessels are targeted in this model. Two days after inducing kidney injury, mice exhibited strong alterations in protein and metabolite content in serum, and accumulation of proteins in urine, all of which were completely prevented in the absence of haematopoietic Fgr (Fig. 4h, Extended Data Fig. 10c). Of note, the protective effects seen in mice with Fgr deficiency did not compromise antimicrobial responses upon infection with Candida albicans or Staphylococcus aureus (Extended Data Fig. 10d, e). Thus, Fgr mediates the transition of intravascular neutrophils towards pathogenic behaviours (Extended Data Fig. 10f) without affecting immune recruitment and anti-microbial defence, a finding that highlights the therapeutic value of targeting specific behavioural immune traits, rather than global immune activity.
Discussion
Here we have harnessed the key feature of live microscopic imaging, namely single-cell tractability in native environments, to capture parameters of movement and shape from thousands of individual cells and to generate behavioural landscapes during inflammation. Our analytical pipeline or similar pipelines can be used to generate similar behavioural landscapes across multiple tissues and physiological contexts, to effectively define leukocyte identities or states based on morpho-dynamic traits. Mathematical modelling predicted that a few or even individual parameters could capture important immune properties. For example, changes in movement or cell compactness discriminated macrophages from DCs, and cell shape, size and proximity to the endothelium identified pathogenic neutrophils within inflamed vessels, altogether highlighting the importance of measuring as many parameters as possible to define cell behaviours. Ultimately, behavioural profiling in vivo can guide the identification of pathogenic and non-pathogenic immune states and their underlying molecular switches, as illustrated here by the identification of Fgr as a driver of pathogenic neutrophils and vascular inflammation. Conceptually, the demonstration that inflammatory behaviours within vessels are molecularly deterministic rather than stochastic has important implications for targeting of vascular inflammation without interfering with antimicrobial immunity.
While behavioural landscapes lack the depth and molecular resolution provided by typical transcriptomic or proteomic profiling in non-dynamic biological settings, we emphasize that they could complement and even outperform them under highly dynamic scenarios, including areas of chronic vascular inflammation20, early activation of adaptive immunity in lymphoid organs21, immune activity in the tumour microenvironment22 or developmental stages in which transient cellular activities, rather than persistent lineage specification, dictate biological outcomes23.
Online content
Any methods, additional references, Nature Research reporting summaries, source data, extended data, supplementary information, acknowledgements, peer review information; details of author contributions and competing interests; and statements of data and code availability are available at https://doi.org/10.1038/s41586-021-04263-y.
Methods
Mice
We performed all experiments in 7-to 18-week-old male C57BL/6 wild-type, Cd11cYFP (ref. 24) LyzMGFP (ref. 25) and Ly6gcre;Rosa26tdTom (ref. 14) reporter mice. Reporter knock-in lines were used in heterozygosis to prevent gene deletion. All mice were bred in the C57BL/6 background. Mouse lines used in the in vivo screening using bone marrow transplantation are listed in Supplementary Table 1. For neutrophil depletion, we injected 50 μg of anti-mouse Ly6G antibody (clone 1A8 from BioXcell) intravenously at 24 and 48 h prior analyses, resulting in >93% reduction in blood neutrophil counts compared with vehicle controls. For platelet depletion, we treated mice intraperitoneally with 50 μl rabbit anti-platelet serum (Accurate Chemical) diluted in 200 μl of PBS 24 h before the experiment with >95% depletion efficiency. To inhibit Fgr, we treated mice intravenously with 100 μg of the specific inhibitor TL02–59 (which features picomolar potency and strong specificity for Fgr17) diluted in saline 2 h prior experimentation. Mice were housed in a specific pathogen-free facility at Centro Nacional de Investigaciones Cardiovasculares (CNIC) under a 12 h light/12 h dark schedule (lights on at 07:00, off at 19:00), with water and chow available ad libitum. All experimental procedures were approved by the Animal Care and Ethics Committee at CNIC and regional authorities. We did not used specific prior methods to determine sample size or animal randomization. Investigators were not blind to the experimental groups.
4D Two-photon intravital microscopy
We performed 4D two-photon intravital microscopy imaging in three different models of inflammation: influenza infection of trachea, ischaemia–reperfusion of and laser burn injury of skin. The trachea model was performed exactly as reported26. For the skin models, we reprocessed raw data on ischaemia–reperfusion11 and laser-induced heat injury11, from LyzMGFP; Cd11cYFP mice. For analyses of T regulatory (Treg) cells and CTLs in CT26 tumour-bearing mice we used previously published imaging datasets27. The files obtained for analysis are therefore a collection of new and existing 4D intravital imaging experiments using the settings and workflow indicated in Supplementary Tables 2, 3.
For two-photon imaging of influenza-infected trachea, we inoculated Cd11cYFP mice with influenza virus strain PR8 (A/PR/8/34) 3 days before imaging as previously described26. In brief, we adoptively transferred 5 × 10⁶ neutrophils isolated from bone marrow of CK6ECFP,28 to the infected Cd11cYFP mice 12 h before imaging. At the time of imaging, we anaesthetized infected mice with a mix of ketamine (100 mg per kg body weight, Parke Davis) and xylazine (10 mg per kg bodyweight, Bayer) followed by surgical exposure and cannulation of the trachea in a customized two-photon platform (TrimScope, LaVision BioTec, Bielefeld, Germany). We acquired full z stacks of 40 μm every 30 s for 30 min to generate 4D images using a customized upright two-photon platform (TrimScope, LaVision BioTec). Two-photon probe excitation and tissue second-harmonic generation (SHG) were obtained with a set of two tunable Ti:sapphire lasers (Chamaleon Ultra I, Chamaleon Ultra II, Coherent) and an optical parametric oscillator that emits in the range of 1,010–1,340 nm (Chamaleon Compact OPO, Coherent), with output wavelength in the range of 690–1,080 nm.
In vivo live imaging of skull bone marrow neutrophils was performed as described29. In brief, LyzMGFP mice were anaesthetized and skin covering the skull was removed to expose the imaging area. The exposed skull was superfused with PBS and immobilized under a custom-made stage for multiphoton microscopy (LaVision TriM Scope II) with a 20× 1.4 NA WI objective (Olympus). Steady state time lapse videos were taken at 20 s intervals for approximately 10 min, before 100 ng of recombinant CXCL1 (R&D Systems) was injected subcutaneously, and mice skulls were imaged using the same settings post-treatment to follow the effects of CXCL1 administration.
Spinning-disk intravital imaging of the cremaster muscle
We used 2D (epifluorescence) and 3D imaging analyses (spinning-disk) for the genetic screening as this did not demand generation of fluorescent reporters for each mutant line, and 4D analyses for the full behavioural analyses in the LyzMGFP or Ly6gcre;Rosa26tdTom reporter lines. We performed intravital imaging of the cremaster muscle after TNF stimulation (R&D Systems, 0.5 μg, intrascrotal injection) as previously reported4,13 using the VIVO system (Intelligent Imaging Innovations). We used a plan-Apochromat 40× W NA1.0 ∞/0 objective (Zeiss) and the SlideBook software (Intelligent Imaging Innovations) for image acquisition. For the 2D motility analysis of mutant neutrophils in mixed chimeric mice, we analysed 6–10 venules per mouse 120 to 180 min after TNF treatment by epifluorescence imaging (Cy3/561 channels for PE, FITC/488 channels for FITC and Cy5/640 channels for APC) and bright-field images with 2×2 binning with a 3 s interval for 2 min on each field of view. For the morphological analysis of the mixed chimeric animals, we generated 3D confocal reconstructions using laser stacks for 488, 561 and 640 nm beams coupled with a confocal scanner (Yokogawa CSUX-A1) and images were acquired at 0.5 μm z-intervals. For double staining with phycoerythrin (PE)- and FITC-conjugated antibodies, acquisition was facilitated by single (FITC) and quadrant (PE) filters to avoid bleed-through of fluorescent signals between channels. For the visualization of leukocytes, 10 min before imaging we injected intravenously 1.25 μg per mouse of fluorescently labeled anti-Ly6G-APC and anti-CD62L-FITC and in some instances 0.5 μg anti-CD41-PE to visualize platelets. For 4D intravital imaging, we analyzed 6–10 venules per mouse 120 to 180 min after TNF treatment using laser stacks for 488, 561 and 640nm beams coupled with a confocal scanner (Yokogawa CSUX-A1; Yokogawa, Japan). We acquired full z-stacks that covered a similar cylindrical segment of the venules with an average depth of 26 μm with 1–2 μm z-intervals for a total period of approximately 8 min (see full settings in Supplementary Table 2). For the visualization of the vessel wall, we injected 1.4 μg fluorescently labelled anti-CD31-APC in combination with TNF as published5. For the characterization of the CD11b expression levels of intravascular neutrophils, we injected 3 μg of fluorescently labelled anti-CD11b-FITC (clone M1/70; BD Bioscences) 10 min prior to imaging. For the in vivo bead binding assay, we incubated red FluoSphere sulfate beads (1 μm diameter; excitation/emission of 580/605 nm, respectively; Thermo Fisher) with 1 mg ml−1 bovine serum albumin for 2 h in phosphate-buffered saline. Immediately before use, we sonicated the beads for 15 min in a water bath sonicator. Albumin-coated fluospheres (109) were intravenously injected into mice prepared for intravital microscopy 10 min prior to imaging, as described15.
Image analysis
We processed and corrected the newly generated and existing datasets (trachea, skin, bone marrow and tumours) by performing drift correction and channel unmixing using custom scripts (Python 3.5) and FIJI. For the trachea experiments we additionally generated new imaging channels specific for the cells of interest using the ‘Coloc’ functionality of Imaris (Oxford Instruments, 9.5.1). We then performed cell detection, volumetric reconstruction (‘objectś), object filtering by voxel size (removing objects <40 voxels or ~90 μm3 for trachea and ischaemia–reperfusion; <45 voxels for laser injury; see Extended Data Fig. 1a, Supplementary Video 6) and tracking, using Imaris. Analysed videos were exported as .csv files containing all the raw values and statistical parameters for each detected object and track, and aggregated using custom Python scripts. All channel-related parameters were removed from the list and the remaining 118 parameters used for further curation. Where relevant, we also calculated the standard deviations ‘variation’ parameters, which were calculated for time series data by dividing the parameter’s standard deviation by its mean value by scripting. Finally, to facilitate ‘back-gating’ analysis, in which identified subpopulations (e.g. from t-SNE plots) can be referenced back to the imaging data, we maintained the original Imaris surface identifiers throughout the whole data analysis workflow, and these surfaces could be isolated using custom Python-based scripts compatible with Imaris XTensions functionality. All parameters using Imaris, and their contribution to cell classification, are listed in Excel format in Supplementary Table 5.
For image analyses of the cremaster muscle, we generated our own analytical method for intravascular neutrophils called Automated Cell Migration Examination (ACME; available at https://doi.org/10.5281/zenodo.5638537). ACME was designed to perform automatic feature extraction for migrating cells, including automatic detection, segmentation and tracking of cells within vessels. Automated analysis with ACME increased the number of cells that could be analysed relative to manual annotation and reduced bias. In ACME we combined deep learning and machine learning blocks to segment, track and extract features from cells moving within blood vessels. ACME implements the following sequential processing pipeline: first, each 3D temporal instant in a 4D volume is fed into the 3D dual segmentation system, based on a strongly regularized 3D U-net convolutional neural network30 (CNN), which was trained using loss functions tailored to address the specific challenges of vessels (cylindrical structures), including high class imbalance between background, vessel wall and cell classes, strong data variability, and the requirement of high-precision detection. This module generates a mask outlining the area of the 3D block corresponding to the blood vessel, a set of masks containing the regions likely to be cells, and for each region a value that quantifies the probability of a region to be a cell. In a second step, the 4D cell volumes are passed to a 3D tracking system. The module relies on the temporal sequence of segmented regions to generate the trajectories in a multi-object tracking scenario thereby handing collisions between cells. This module is based on a three-pass 3D Kalman-filter tracking system31, which incrementally improves its performance by relying on successive segmentation refinement achieved after the first and second passes through collision detection and morphological post-processing modules, respectively. With information of the trajectories, blood vessel and cell segmentations, the feature extraction module represents the cell dynamics within a short temporal window around each time instant to generate ‘short-term cell features’. Short-term features are formed by aggregating two types of features: instantaneous features, related to the position and shape of cells in each time instant (that is, objects); and dynamic features, representing the evolution of these instantaneous variables in the temporal window as well as other features related to the trajectory of each cell (referred here as tracks). Finally, the last step is a cell selection module which was based on these short-term features and applied filters that aligned with known biological features of the cells (minimum trajectory length, valid position within the blood vessel, and volume range), to select the valid set of trajectories from the entire collection. ACME also incorporates a behaviour detection module that performs non-supervised behaviour discovery, hierarchically arranges the behavioural space and selects the most prominent features for each subset of behaviours.
Other image analysis platforms, such as Imaris, can be used however they should be adapted to the challenging conditions of the cremasteric vessels. A detailed technical description of ACME and its features will be described in future studies.
For the screening analyses in the cremaster muscle we used 2D video imaging (epifluorescence) and static (one time point only) 3D spinning disk imaging. For these analyses we favoured parameters that discriminated B3-type behaviour (see Extended Data Fig. 7a), that could be extracted by 2D imaging (kinetic features), and among morphometric 3D features those that used relative (rather than absolute) measures within the same cell, such as H/L ratios and cell shape. 2D motility analysis of crawling neutrophils in vessels, we used Fiji/ImageJ with the help of the Manual Tracking plugin (Fabrice Cordeliperes, Institut Curie, France). The plug-in allowed tracking neutrophil displacement by calculating x and y positions relative to the direction of blood flow and automatically computed total displacement, directionality and instantaneous velocities of cells. To analyse the morphology of neutrophils in our 3D confocal reconstructions, we used the ‘Cell’ function of Imaris.
Data analysis
We implemented parameter selection combined with dimensional reduction methods to enhance cell classification of our behavioural analyses (see Extended Data Fig. 1). However, use of all parameters together with standard pipelines used for single cell RNA sequencing (such as Seurat-v4) can be also implemented for these analyses without the need of supervised parameter selection (Extended Data Fig. 1i), and the strength of the selected parameters should be validated using ‘training’ experiments as in this manuscript. We note however that parameter selection improved cell classification by avoiding inclusion of parameters that were redundant or arbitrary, and by ensuring that both morphometric and kinetic features are included (Extended Data Fig. 1f–h). Various pipelines for data analyses were used for the different experimental datasets, as summarized in Supplementary Table 4. We did not perform data normalization in any of our imaging analyses since the absolute values for any given parameter were comparable between cells of each experiment.
To manage the data (including dataframes) we used the dplyr (1.0.6) package. All the heat maps were plotted with pheatmap (1.0.12), and to set the range of colours of those heat maps we used viridisLite (0.4.0) and viridis (0.6.1). To establish a consensus colour palette for the rest of the figures (including t-SNEs and UMAPs), we used RColorBrewer (1.1–2). We used the scater (1.19.9) package to plot multiple images in one figure with its multiplot function. Ggviolin from the ggpubr (0.4.0) package was used to generate violin plots.
Trachea dataset
For the analysis of the trachea datasets, we uploaded the final raw file to R Studio, including all the parameter values for each cell and time point, as well as their cell type defined by fluorescence protein expression (CFP and YFP). From the total set of 118 acquired and measured parameters we selected 31 that avoided redundancy or parameters with arbitrary values (for example, positional parameters), and their distribution and correlation visualized in the corresponding correlation network (see Extended Data Fig. 1, Supplementary Table 5). We also stored information of the identity of each cell based on its fluorescence profile that was only used to calculate the LRI/ARI values for each parameter. The input expression matrix, consisting of the 31 parameters and 7,008 cell reconstructions (corresponding to 343 individual cells), was scaled with the R base scale function, was used to perform non-linear reduction to generate t-SNE plots (function Rtsne from the package Rtsne that performs Principal Component Analysis, PCA). The resulting coordinates of t-SNE were represented using the ggplot2 package of RStudio. We then generated unbiased classification of cells over the t-SNE representation and used information from the fluorescence reporter mice (which were not used for data analysis) to project the correct cell type over these clusters and assess accuracy of the behavioural analyses. We then analysed each cell type from the individual clusters by excluding the non-dominant cell-type in each group (DCs in cluster 1, neutrophils in cluster 2) and subsetted them from the original representation using the Rtsne function, using the ggplot2 package for visual representation of each subset, and plotting the parameter value distribution for each group. To identify the differentially scored parameters between the two clusters, we selected those that showed at least 0.25-fold difference (log scale) between the two groups and used Seurat v432 for selection and plot generation.
Ischaemia–reperfusion and laser injury dataset
For the analysis of both ischaemia–reperfusion injury and laser injury data, we uploaded the final raw files to R Studio, which included all the measured parameter values belonging to each cell at each time point (object), as well as the actual identity of each cell (neutrophil, DC or macrophage), which was known beforehand and was used only for validation analyses. We used the same set of selected parameters (see Extended Data Fig. 1, Supplementary Table 2) to generate an input parameter expression matrix containing 31 parameters for 49,436 cell time points (objects: corresponding to 4,635 unique cells) in the ischaemia–reperfusion dataset, and for 32,323 cell time points (objects) corresponding to 1,228 individual cells in the laser injury dataset. We transformed the original matrix to a Seurat object and scaled the parameters. We performed principal component analysis (PCA) to reduce the dimensionality to the four top principal components in both cases. Cells were clustered based on k-nearest neighbour graphs using the Louvain algorithm. Finally, a non-linear reduction technique (t-SNE) was performed to visualize the data in a low-dimensional space. We used the ggplot2 package for the visual representation of each subset and for plotting the parameter value distribution for each group. The Seurat object was finally subsetted according to the different cell types within the object to generate the corresponding t-SNE plots. Each cluster corresponding to each cell type was plotted separately and the expression of every parameter over these clusters was projected again with ggplot2. The Seurat object was subsetted for the clusters obtained (clusters 0 to 2) to identify sub-clusters within each cluster. Finally, we used Seurat to estimate the differentially scored parameters and to generate the heat maps for these parameters.
Cremaster data
Raw data was uploaded to RStudio. The input parameter expression matrix had 73 parameters for 7,098 cell points (objects), corresponding to 459 unique cells, including metadata information. We first transformed the data matrix to a Seurat object and the parameters were scaled. Using Seurat we performed PCA to reduce the dimensionality to the four top principal components and generated UMAP plots of the dataset. We used the UMAP reduction method to better capture the relationship between the different behavioural states of intravascular neutrophils in the cremaster experiments, since inter-cluster relationships are better captured by this dimensional reduction method. Based on the groups of cells visually identifiable in the UMAP plots we then performed supervised identification of behavioural groups of cells, using as reference the coordinates of the three visually defined groups. We performed manual gating over the UMAP representation and assigned to each cluster an unbiased classification (group/behaviour 1, 2 and 3), adding a new metadata label that was used henceforth. To obtain the density plots over the UMAP representation, we used stat_density_2d_filled from the ggplot2 package. Using this segregated dataset, we generated a global heat map with all parameters to group the cells hierarchically (with either three or five behaviours), and generated violin plots to compare the score of selected parameters based on the selected behaviour. Finally, to identify the differentially scored parameters between groups we used a univariate model to determine outstanding predictors, divided according to their time dependency: for time-independent parameters we used a multinomial model with multinom function (nnet package)33, and for time-dependent parameters we used logistic regression with glmer function (package lme4)34, comparing all behaviours between them. Not adjustment for multiple testing was performed, but the P-value threshold was set to 0.01.
Non-supervised clustering and behavioural transitions in the cremaster analyses
To analyse transitions of cells within behavioural groups of the cremaster dataset, we first performed non-supervised clustering discovery using the behaviour detection module from ACME. This module selected the optimal number of behaviours (K) and organized cell objects into K clusters using a high-dimensional K-means algorithm35. In brief, K was selected by minimizing histogram intersection between behaviour proportions in the two main differential groups (control versus platelet-depletion), resulting in a K of 5. To represent this clusterization in two dimensions we used UMAP supervised by the 5 behaviours that were obtained from the K-means algorithm. The UMAP algorithm minimized the divergence of topological representations between the N-dimensional (73D) and the n-dimensional spaces (2D). The supervision of this algorithm built a new representation that combined the original representation (unsupervised) with a new representation (supervised) in which samples that do not belong to the same behaviour are farther apart depending on the regularizing parameter α. Finally, to calculate the transitions between groups, we examined the trajectories of each neutrophil over time to identify transitions from one behaviour to another. We set a minimum threshold of permanence (pth) equal to 3, so that a neutrophil must remain at least pth instants (3 time points) in the destination behaviour for it to be considered a transition.
Mathematical modelling
We used logistic regression to analyse the complete set of 118 kinetic and morphometric parameters (in general time dependent variables) measured in cells extracted from the trachea imaging dataset. Since previous information on leukocyte identities (DCs and neutrophils) was available, we computed for each parameter the LRI. To calculate the LRI, we used the McFadden LRI (RMcF2), which varies from 0 to 1 and provides a normalized measure of the classification capability of a logistic regression-based model with respect to a uniformly random discrete classification model. RMcF2 is defined as RMcF2 = 1 − log(LM)/log(L0), where LM and L0 are the likelihoods for the model being fitted and the null model, respectively. If the model being fitted had no predictive ability, its likelihood value would be equal to the likelihood of the null (that is, purely uniformly random) model, and thus LRI would be equal to zero, whereas a predictive model explaining most of the variability in the observations would yield a LRI close to one.
This method was combined with a correlation analysis that allowed us to construct correlation networks providing a Euclidean two-dimensional projection of parameters displaying a distribution on a graph aimed at identifying the most important parameters for leukocyte classification (trachea and laser injury datasets). These networks were built using multidimensional scaling techniques, employing Pearson’s distances as entries of the dissimilarity matrix. For the trachea dataset, we subsequently calculated the LRIs of multiparameter combinations from random samples of the complete set (118 parameters), as well as reduced sets consisting of 10, 25 and 50 parameters. From these, we produced series of violin plots using kernel density estimations with standard Gaussian kernel functions and utilized the observed trends to build a qualitative stochastic model capturing the relationship between the fraction of all known behavioural parameters vs a normalized classification index (with 1 representing perfect identification of cell type, and 0 purely uniform random assignment). In this stochastic model, the classification was dichotomous whereas each of the independent synthetic parameters (a total of 100) were generated from a half-normal distribution with equal scale parameter, with their outcomes being nonnegative real numbers (1,000 replicas per parameter). The relationship between the dependent parameter and the independent ones was modelled via a logistic function. We then created combinations of random samples with a fixed number (ranging from 1 up to 100) of synthetic parameters and computed the corresponding LRIs. These LRIs gave rise to a learning (banded) curve that depended on the percentage of parameters used.
For analysis of the cremaster dataset we extended the previous approach to the set of 73 parameters extracted. We employed a statistical model based on decision tree learning (a classification and regression tree algorithm). Information on leukocyte states based on imaging analyses based on non-supervised clustering was used to classify the cells in behaviours 1–3. To quantify the accuracy of the classification model, we employed the ARI. Combining this measure with the construction of a new correlation network, by means of multidimensional scaling techniques, we obtained a two-dimensional projection of parameters on a graph. This approach was also applied to the ischaemia-reperfusion dataset for the 118 parameters obtained with Imaris. We used RStudio for the analyses of all datasets. Violin plots and correlation networks were created employing the vioplot R and igraph R packages, respectively.
Generation of bone marrow transplanted mice and mixed bone marrow chimeras
In order to homogenize hosts for all mutant mice and to provide internal controls, we generated both full donor or mixed bone marrow chimeric mice by bone marrow transplantation. For full marrow chimeras, we harvested bone marrow cells from C57BL/6 or mutant donors by flushing the femur with PBS. We then injected 1 million bone marrow nucleated cells by intravenous injection to recipient wild-type C57BL/6 mice or CD45.1 congenic mice after lethal irradiation (two 6 Gy doses, 3 h apart).
For the mixed bone marrow chimeras, we harvested donor bone marrow cells from DsRedTg and non-fluorescent experimental mutant models (see Supplementary Table 1) and injected 1 million of a bone marrow nucleated cell mixture from both donors by intravenous injection into lethally irradiated C57BL/6 recipients, as indicated above. 6–8 weeks after transplantation, we assessed engraftment and chimerism of recipient animals in blood by flow cytometry before further experimentation.
Myocardial ischaemia–reperfusion
To estimate effects of genes or treatments on infarct size, we subjected 8- to 15-week-old male mice to 45 min occlusion of the left anterior descending (LAD) coronary artery followed by 1 h reperfusion. We performed the ischaemia–reperfusion procedure as previously reported13. In brief, fully anaesthetized animals were intubated, and temperature controlled throughout the experiment at 37.5 °C to prevent hypothermia-driven cardioprotection. Then, we performed thoracotomy and ligation of LAD with a nylon 8/0 monofilament suture for 45 min, and monitored the electrocardiogram (MP36R, Biopac Systems) to confirm total coronary artery occlusion (ST-segment elevation) throughout the 45 min ischaemia. At the end of the ischaemia, we closed the chest and animals were kept with 100% O2 and treated with buprenorphine (subcutaneous injection, 0.1 mg kg−1). For quantification of infarct size, we re-anaesthetized and re-intubated the mice, and re-occluded the LAD coronary by ligating the suture in the same position as the original infarction. Then, animals were euthanized and 1 ml of 1% Evans Blue dye (Sigma) was infused IV to delineate the area at risk (AAR: myocardium lacking blood flow, that is, negative for blue dye staining). The left ventricle (LV) was isolated, cut into transverse slices (5–7 1-mm thick slices per LV), and both sides were imaged. To delineate the infarcted (necrotic) myocardium, we incubated slices in triphenyltetrazolium chloride (TTC; Sigma) at 37 °C for 10 min. Next, we took new images and weighed the slices. Finally, we quantified regions negative for Evans Blue staining (AAR) and for TTC (infarcted myocardium) using ImageJ (NIH, Bethesda, MD). Percentage values for AAR and infarcted myocardium were corrected for weight (mg) independently for each slice. Absolute AAR and infarct size were determined as the mg:mg ratio of AAR:LV and infarcted myocardium:AAR, respectively. We assessed each sample blind to condition (mouse type or treatment).
For permanent myocardial Infarction, we subjected male 8- to 12-week-old mice to permanent occlusion of the left anterior descending (LAD) coronary artery for cardiac function and fibrosis measure. We measured cardiac function at basal time and days 3 and 28 post occlusion by echocardiography using a Vevo 2100 Ultra High Frequency ultrasound with support of the Advanced Imaging Unit of CNIC, and stained heart slices with haematoxylin and eosin to measure fibrosis.
Nephrotoxic injury and vascular permeability assay
To induce nephrotoxic injury we first pre-conditioned female mice (8–12 weeks of age) by intraperitoneal injection of 0.1 μg g−1 of LPS from Escherichia coli 0111:B4 (LPS; Sigma) alone (LPS only) or together with intravenous injection of 5 μl g−1 of sheep anti-mouse glomerular basement membrane nephrotoxic serum (batch number 90252, as in ref. 36) diluted with sterile PBS. Urine and plasma were obtained at day 2 post kidney injury induction for biochemical analysis performed with a Dimension RxL Max Integrated Chemistry System (Siemens Healthineers). For vascular permeability assays in the kidney, we intravenously injected 200 μl of 0.5% solution of Evans blue in sterile PBS into mice induced for nephrotoxic injury. After 15 min, we euthanized mice and extracted kidneys for weight and leakage. To measure leakage, we submerged kidneys in tubes containing 0.5 ml formamide at 55 °C for 24 h. After incubation, we centrifuged the tubes for 5 min at 645g and collected the supernatant. Finally, we measured the absorbance of supernatants at 610 nm using an xMark Microplate Spectrophotometer (BioRad) plate reader.
Infection models
Mice were intravenously infected with 1.25 × 10⁵ colony-forming units (CFU) of Candida albicans (SC5314 strain) or with 2.5 × 10⁷ CFU of Staphylococcus aureus (RNU4220 strain) and monitored for weight loss and general health following our institutional guidance. In the C. albicans infection model, we determined kidney weight and fungal burden at day 6 post-infection by plating organ homogenates in serial dilutions on YPD plates (Sigma). CFUs were counted after growth for 48 h at 30 °C. During staphylococcal infection, blood was collected at various time points for haematology.
In vivo NET formation during ischaemia–reperfusion
To perform ischaemia–reperfusion in the cremaster muscle, we exteriorized the tissue as described12 and induced ischaemia by clamping the tissue connecting the muscle to the body with a 60-mm Micro Serrefine clamp (Fine Science Tools) for 45 min. Subsequently, we accomplished reperfusion by removal of the clamp. 15 min after reperfusion we euthanized mice and the muscle was removed for analysis. We fixed the excised muscles in 4% paraformaldehyde (PFA) at 4 °C overnight and then we washed them three times in PBS containing 0.5% Triton X-100 (PBST) and blocked for 2 h in PBST 25% fetal bovine serum (FBS) at room temperature with shaking. We stained the samples with anti-cit-H3, anti-MPO and anti-CD31 in 10% FBS-PBST overnight at 4 °C with shaking. We then added secondary antibodies in 10% FBS-PBST for 4 h at room temperature. After secondary staining, we washed and mounted the samples in Mowiol 4–88 (31KDa; Sigma). We performed imaging of whole-mount cremaster muscles using a Nikon A1R confocal system coupled to a Nikon Eclipse-Ti inverted microscope with the following lines: diode 402 nm, argon laser 457, 476, 488, 514 nm, diode 561 nm, HeNe laser 642 nm using a Plan Apo 10×/0.45 dry objective and the software NIS Elements AR v.4.30.02 (Build 1053 LO, 64 bits, Nikon Instruments). We analyzed the images using Imaris (Bitplane). All imaging was performed at the Microscopy and Dynamic Imaging Unit of CNIC.
Transmission electron microscopy
For TEM analysis of mouse tissues, we fixed heart and kidney pieces in 1% glutaraldehyde and 4% PFA in PBS, overnight at 4 °C. Samples were post fixed in 1% osmium tetroxide for 60 min and dehydrated through a series of ethanol solutions (30%, 50%, 70%, 95% and 100%) and acetone. After the last dehydration step, we incubated the samples in a 1:3, 1:1, 3:1 mixture of Durcupan resin and acetone and cured at 60° for 48 h. We obtained ultrathin sections (50–60 nm) using a diamond knife (Diatome) in an ultramicrotome (Leica Reichert ultracut S) and collected them in 200-mesh copper grids. We then counterstained the sections with 2% uranyl acetate in water from 20 min followed by a lead citrate solution. After staining, we examined the samples with a JEOL JEM1010 electron microscope equipped with an Orius SC200 digital camera (Gatan) at the Transmission Electron Microscopy Laboratory (Interdepartmental Research Service, UAM). We analysed heart images with ImageJ by counting the total number of vacuoles and Weibel–Palade bodies per μm2 present on the endothelial cells of the blood vessel wall.
Neutrophil in vivo recruitment assays
Mixed chimeric mice generated by bone marrow transplantation of wild-type together with the indicated mutant mice were used for these experiments. For the model of zymosan-induced peritonitis, we treated the transplanted chimeras with zymosan (1 mg, intraperitoneal injection, Sigma). After 2 h, we took blood samples and performed peritoneal lavage for cytometric analyses and cell counts. We compared the ratios of neutrophils in the peritoneum vs blood from each donor to estimate the recruitment efficiencies of mutant cells (ratio in peritoneum/ratio in blood).
For the LPS-induced lung injury, anaesthetized mice were allowed to inhale 10 μl of 5 mg ml−1 of LPS solution from E. coli 0111:B4 (Sigma). The solution was placed drop by drop, while holding the mouse tongue, over the mouse nostrils and let the whole droplet to be inhaled before placing more solution to avoid suffocation. After 24 h, we performed bronchoalveolar lavage (BAL) in the LPS-treated mice. We euthanized the mice by injecting 100 μl of pentobarbital sodium (Dolethal) 200 mg ml−1 intravenously. Then we performed an incision over the mouse throat and pulled the salivary glands over to the sides to expose the trachea muscles. We dissected the trachea muscles with tweezers and exposed the airway. Using a 18G needle coupled to 1-ml syringe with 1 ml PBS, we pierced through soft trachea tissue and slowly injected the PBS. After 10–15 s, we recovered the lavage. We analysed the absolute numbers of neutrophils by flow cytometry after staining with an anti-Ly6G antibody.
Statistical analysis and reproducibility
Unless otherwise indicated, data are represented as mean ± s.e.m., and analysed using Prism software (GraphPad). Datasets were analysed by a D’Agostino–Pearsons normality test to define normality and implement the appropriate statistical test. Data consisting of only two data sets were analysed using two-tailed Studentś t-test unless otherwise stated. To identify statistically significant differences for treatment/genotype over time or more than two datasets we used two-way ANOVA or one-way ANOVA with Tukey’s or multiple comparisons tests, respectively. A P-value below 0.05 was considered statistically significant. Experimental findings were confirmed in independent experiments and found to be reproducible. All experiments were repeated at least two times using separate cohorts except for analyses in CT26 tumour-bearing mice (Extended Data Fig. 4f–h), which are from single experiments.
Extended Data
Extended Data Fig. 1 |. Selection of parameters for behavioral analyses.
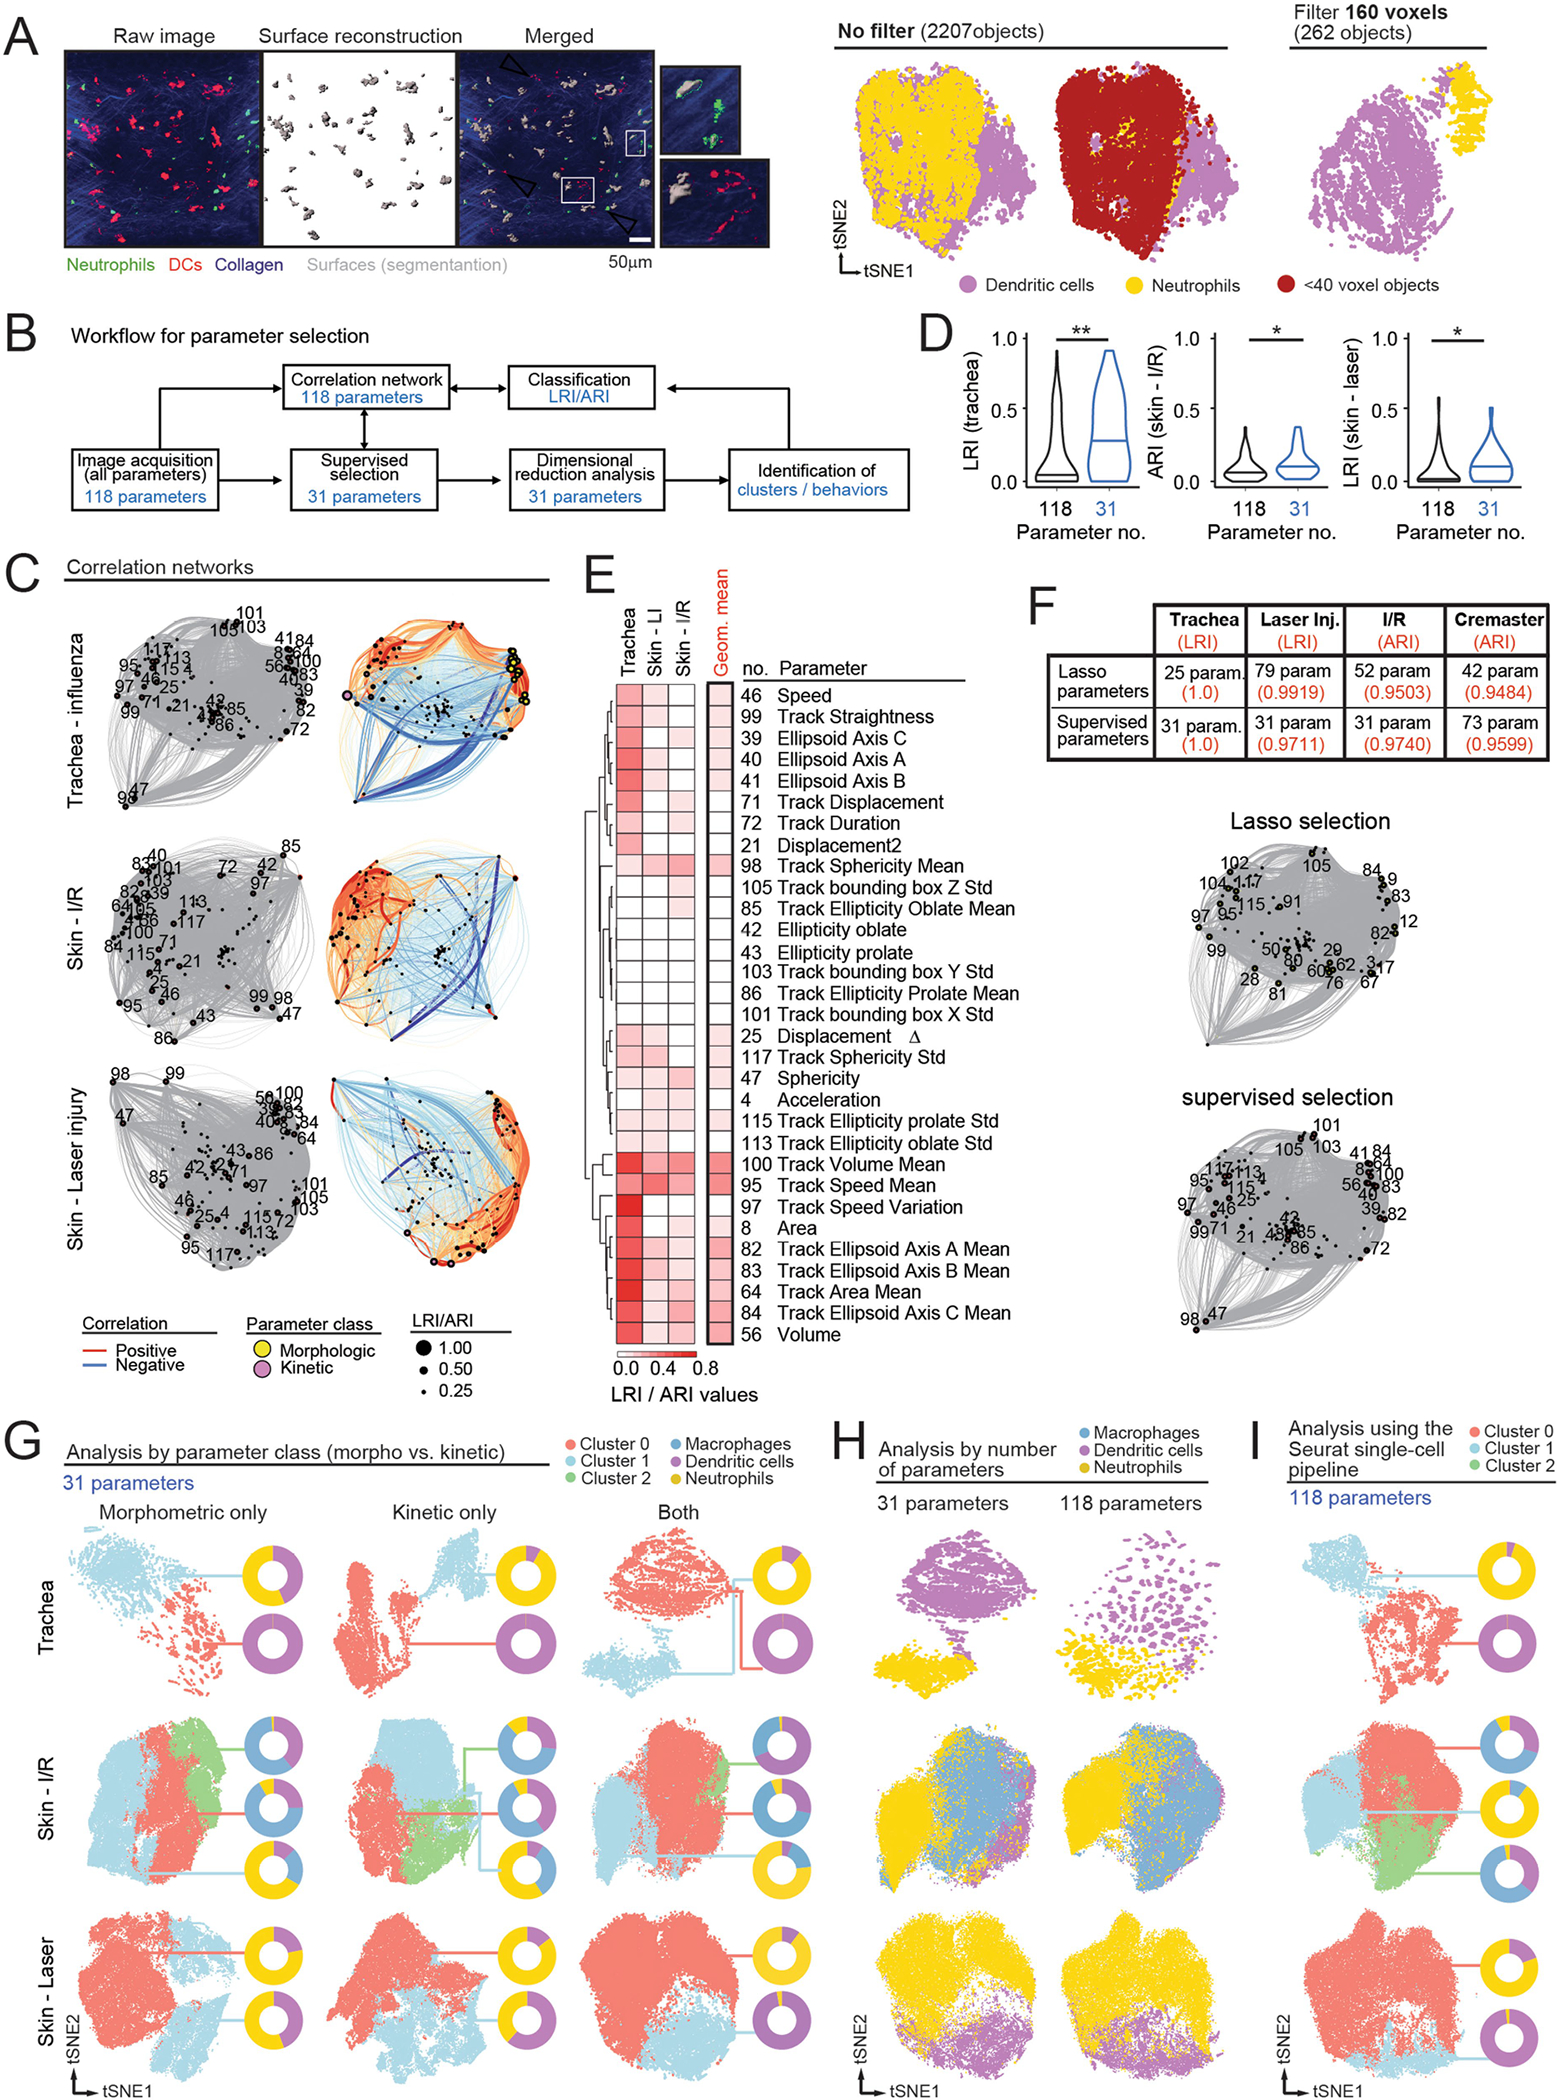
(A) Application of size filters. Left, representative images showing use of >40 voxel filter to eliminate subcellular objects in the trachea experiments. Comparison of the raw vs. surface reconstructed objects (see merged) eliminates fragment-like objects, as shown in the insets. Right, tSNE representation of the trachea dataset in which the filter for cell size was set to 0 (no filter) or 160 voxels, showing objects with sizes below 40 voxels (threshold used in our experiments). The number of objects for each representation are shown in brackets. Note that segregation of neutrophils and DCs into different visual clusters is compromised in the absence of filter. (B) Workflow for parameter selection. 4D images were analyzed to extract morphometric and kinetic parameters (118 in our experiments using Imaris software). We performed supervised selection of the best characteristics following criteria of redundancy, biological features of interest in the specific biological setup, or removal of non-biological parameters such as arbitrary position. In parallel we generated correlation networks for all parameters and each experiment (118 in the experiments reported here), and we visualized the distribution of the selected parameters in the correlation networks (see below). Finally, we reduced dimensionality using the selected parameters to identify behavioral clusters for further validation. For the “training” experiments shown here, where cell identities were known, we determined LRI/ARI to complement our correlation networks with the power of each parameter to classify cells correctly. The workflow is fully adaptable to other image analysis tools, as well as algorithms to establish correlation between parameters and for dimensional reduction, including elastic net regression methods. (C) Correlation networks used for the experiments shown in Fig. 1 with Imaris image analysis. Networks on the left column highlight the specific 31 parameters selected, which are identified by the number code shown in Supplementary Table 2. Correlation networks on the right column correspond to the three datasets shown in Fig. 1 (influenza infection in the trachea, ischemia-reperfusion in skin and laser injury in skin), showing parameters as circles whose diameters are proportional to their LRI, as well as the positive (red) and negative (blue) correlations between each pair of parameters. The thickness of the links is proportional to the absolute value of the Pearson correlation coefficient for each pair, and the distance between parameters reflect the similarity of the Pearson coefficients with the rest of parameters. (D) Violin plots showing LRI/ARI values for all 118 vs. the selected 31 parameters. Lines represent medians. Data compared by Mann-Whitney non-parametric test. (E) Heatmap showing the LRI/ARI values for each of the 31 selected parameters for each experiment, as well as the geometric mean for the three experiments combined, reflecting the average power of each parameter in our experiments. (F) Quality of parameter selection. Top, number of parameters selected, and predictive power (LRI or ARI in red) of the parameters selected by Lasso regression compared with our list of 31 selected parameters. Bottom, comparison of the distribution of the 25 parameters selected by Lasso regression and our 31 selected parameters across the correlation network for the trachea experiment. (G) tSNE plots generated by considering only the morphometric, or only the kinetic parameters, or both combined. Donut plots show the distribution of the analyzed cell types (macrophages, DCs and neutrophils) in each cluster. Note that the accuracy in identifying specific cell types for each cluster is always highest when both classes of parameters are combined. (H) tSNE plots generated by considering all 118 parameters or only the selected 31 across all three experimental setups (influenza infection in the trachea, ischemia-reperfusion in skin and laser injury in skin). Cell classification per cluster was better for the selected 31 parameters. (I) tSNE plots showing the classification of cells into clusters by using all 118 parameters and a standard single cell analytical pipeline (Seurat_v4). Donut plots indicate the distribution of the analyzed cell types (macrophages, DCs and neutrophils) in each cluster.
Extended Data Fig. 2 |. Behavioral landscape of the infected trachea.
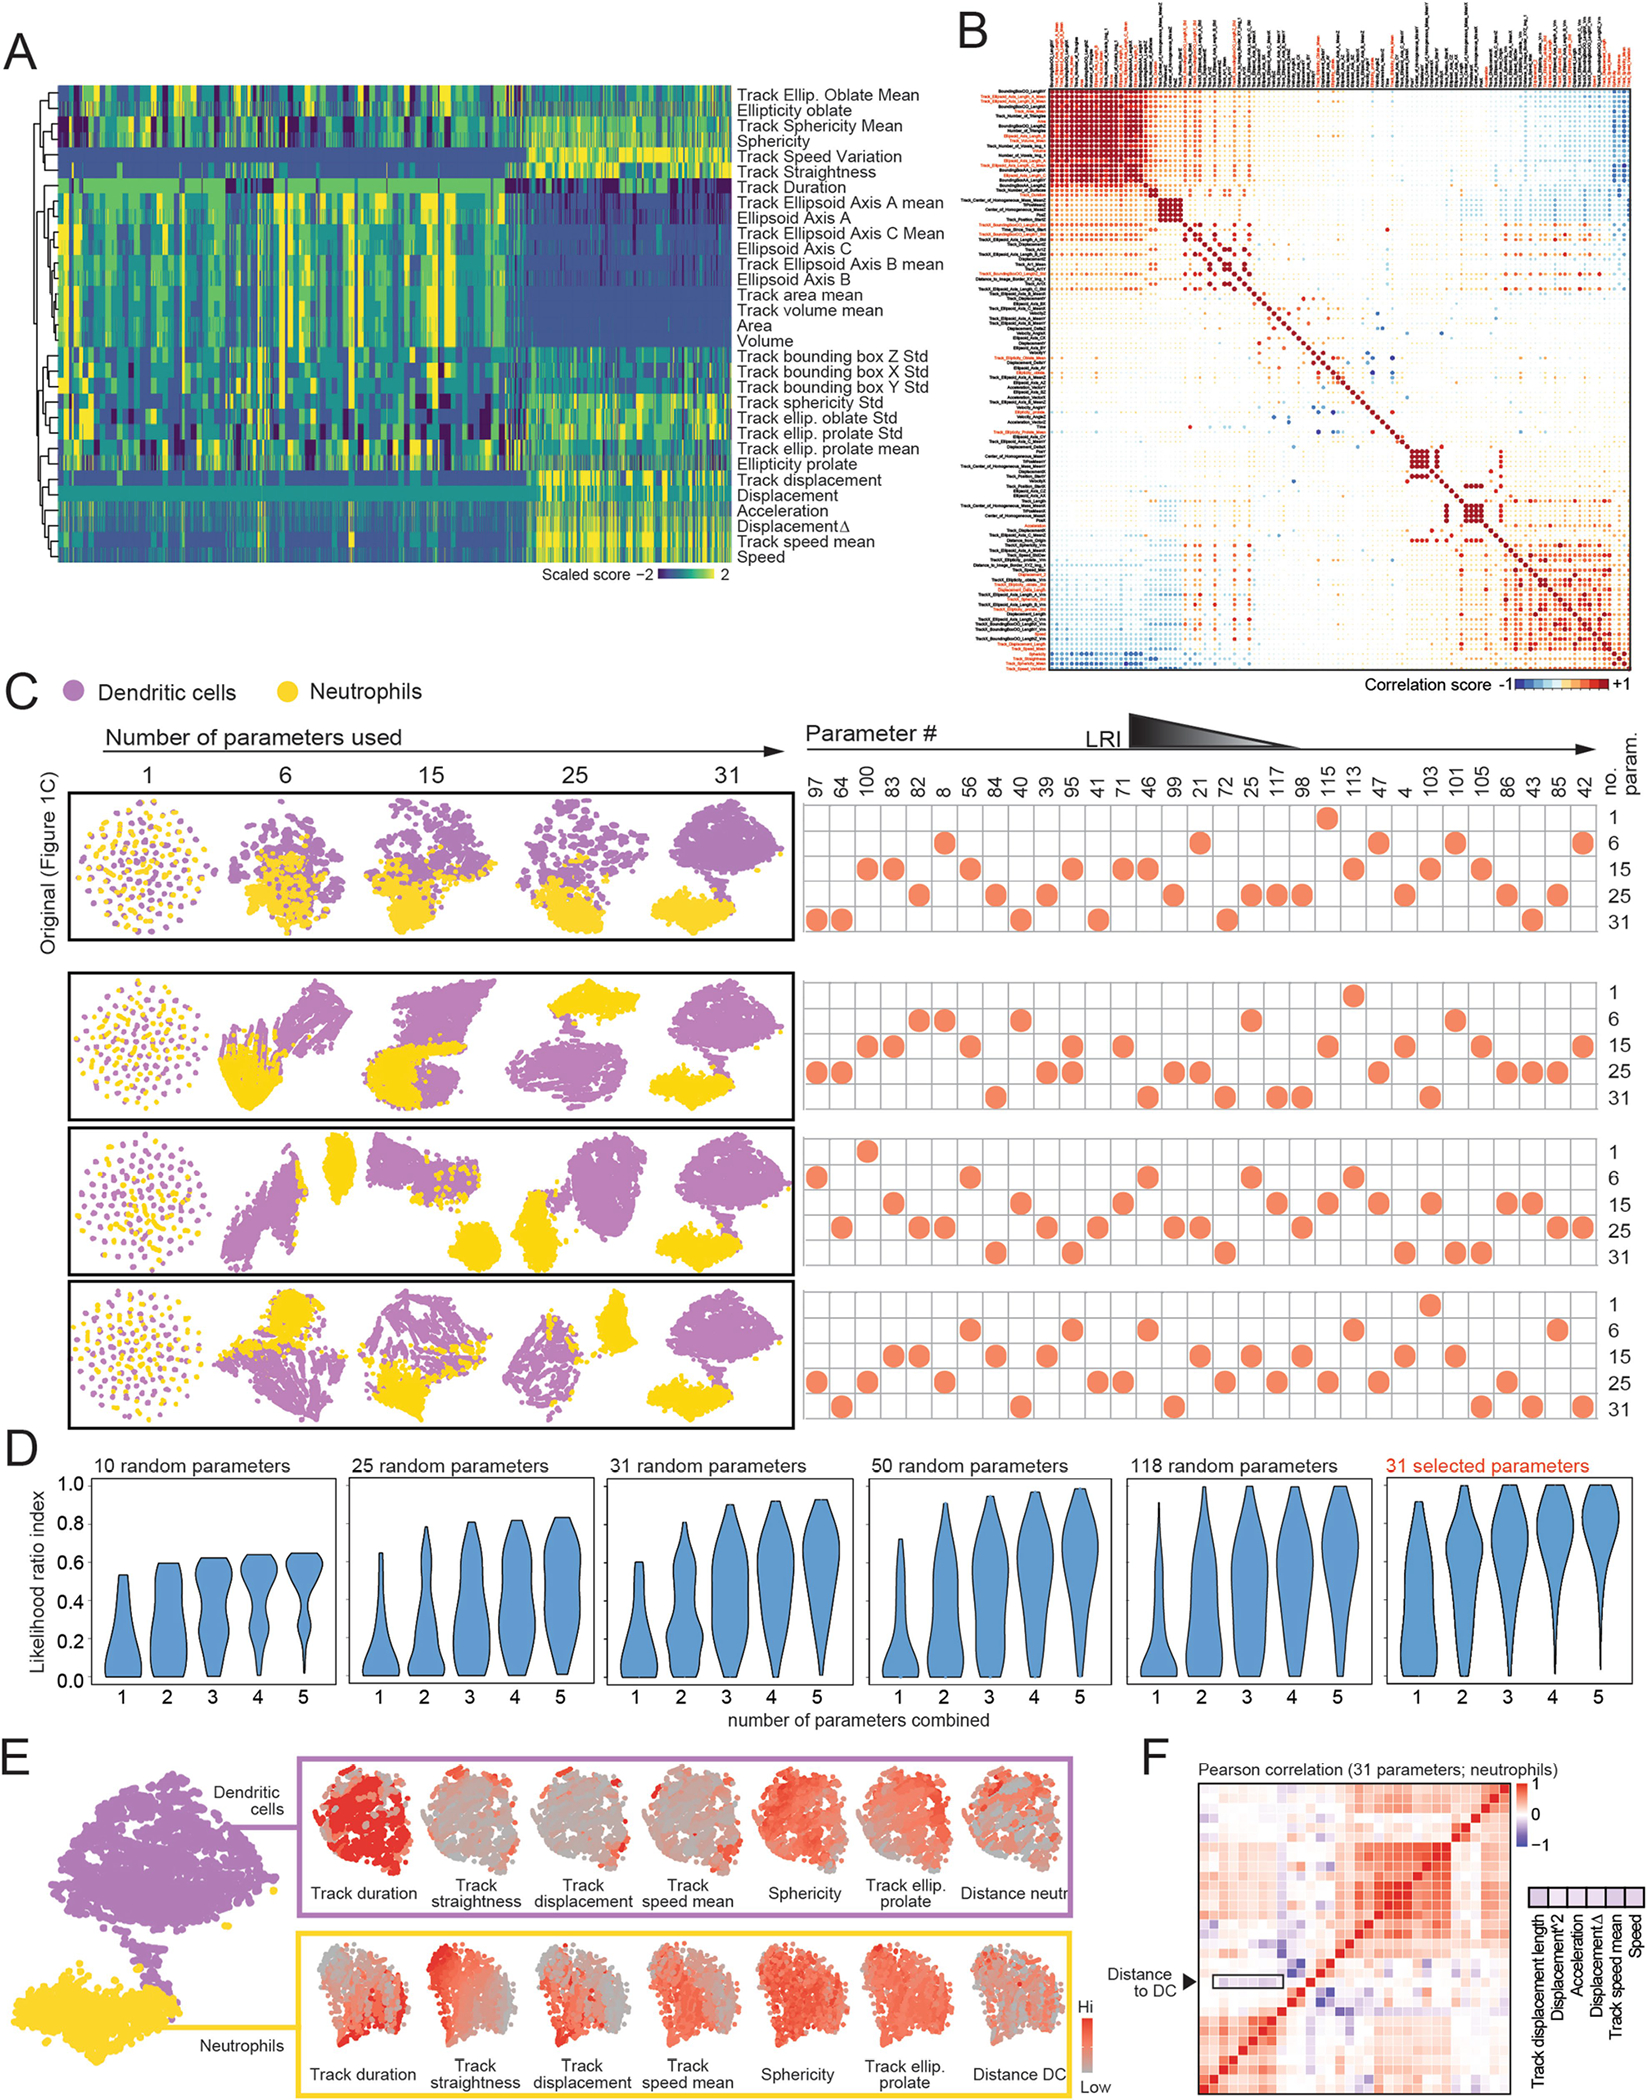
(A) Heatmap of the 31 behavioral parameters used for the trachea infection analysis. For a full list of all extracted parameters please refer to Supplementary Table 2. (B) Pearson correlation matrix for all 118 parameters extracted from the trachea imaging experiment, with the selected parameters marked in red font. (C) Segmentation of cells from the trachea by four different combinations of morpho-kinetic parameters. We randomly chose 1, 6, 15, 25 and 31 parameters (list of parameter code numbers shown at right) and used them to represent the separation of neutrophils and DCs using tSNE. The original set of parameters used in Fig. 1c is at the top. Parameters are ordered from higher to lower LRI (left to right) to better visualize the classification value of each parameter used in the plot analyses. (D) LRI (score of cell identities) are proportional to the number of parameters extracted from the imaging experiments and combined to infer identities. Violin plots show the distribution of LRIs when using 1–5 parameters to classify cells in the trachea experiment, assuming that only sets of 5, 25, 31, 50 or 118 parameters are available for analysis. Note that the LRIs shown here are for the full 118 parameter set, and are not comparable with the 31 subset of selected parameters, which feature higher LRI values, as shown in the violin plots on the far right. (E) Individual analyses of the behavior of DCs and neutrophils from the original dataset, shown as tSNE plots for each population. Each behavioral parameter can be visualized and compared across cell subsets and parameters to infer positive or negative correlations, as shown for Distance to DC which negatively correlates with cell speeds in the Pearson correlation matrix of the 31 parameters used in the final analysis (F).
Extended Data Fig. 3 |. Behavioral landscape of the skin under ischemia-reperfusion.
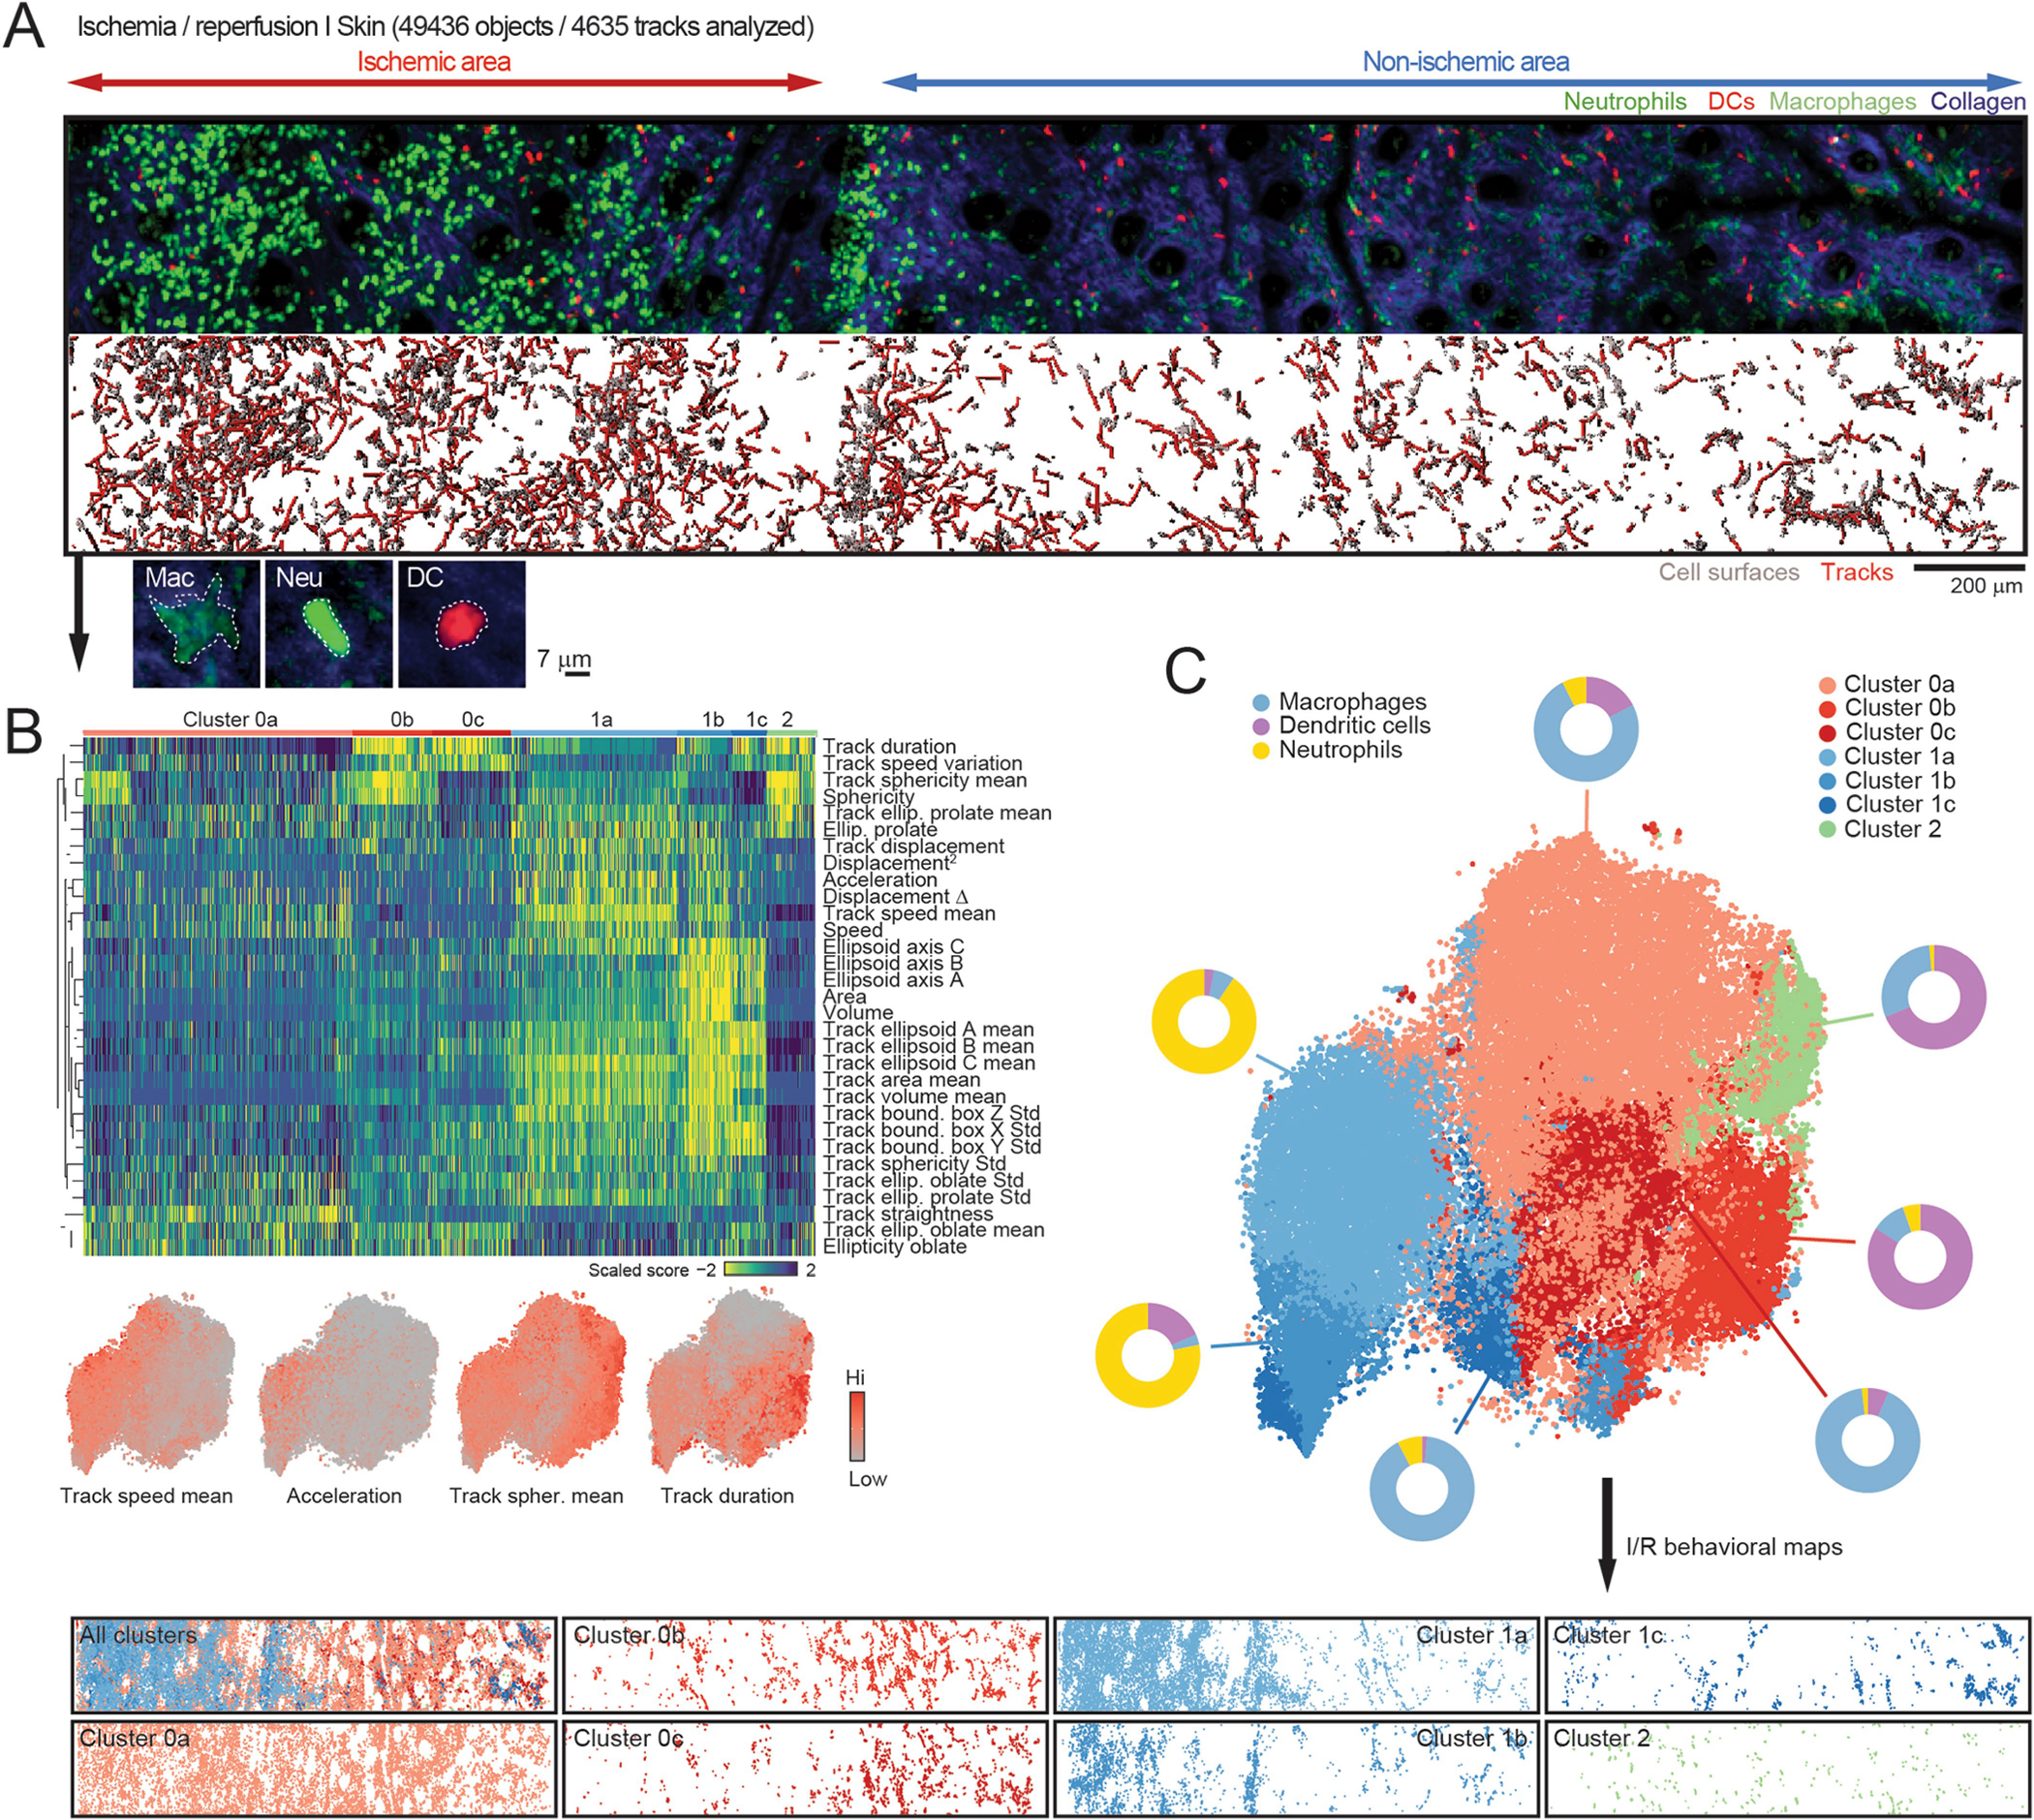
(A) Representative image of I/R injury of the skin (original image on top; reconstruction of volumes and tracks at bottom). Below, examples of a typical GFPlo macrophage, a GFPhi neutrophil and an YFP+ DC used to classify the cells post-analysis. (B) Heatmap of all parameters and classified by cluster (0, 1 y 2) from the plot in Fig. 1h, and further divided into subclusters shown in (C). Below, expression plots of selected parameters. (C) tSNE plot showing all subclusters identified in the heatmap in (B). Donut plots indicate the fraction of neutrophils, DCs and macrophages in each cluster. Bottom panels show the behavioral maps generated by back-gating each cluster into the original position for each cell so that maps show the position of cells with the same behavioral profile.
Extended Data Fig. 4 |. Behavioral landscape of laser injury in the skin.
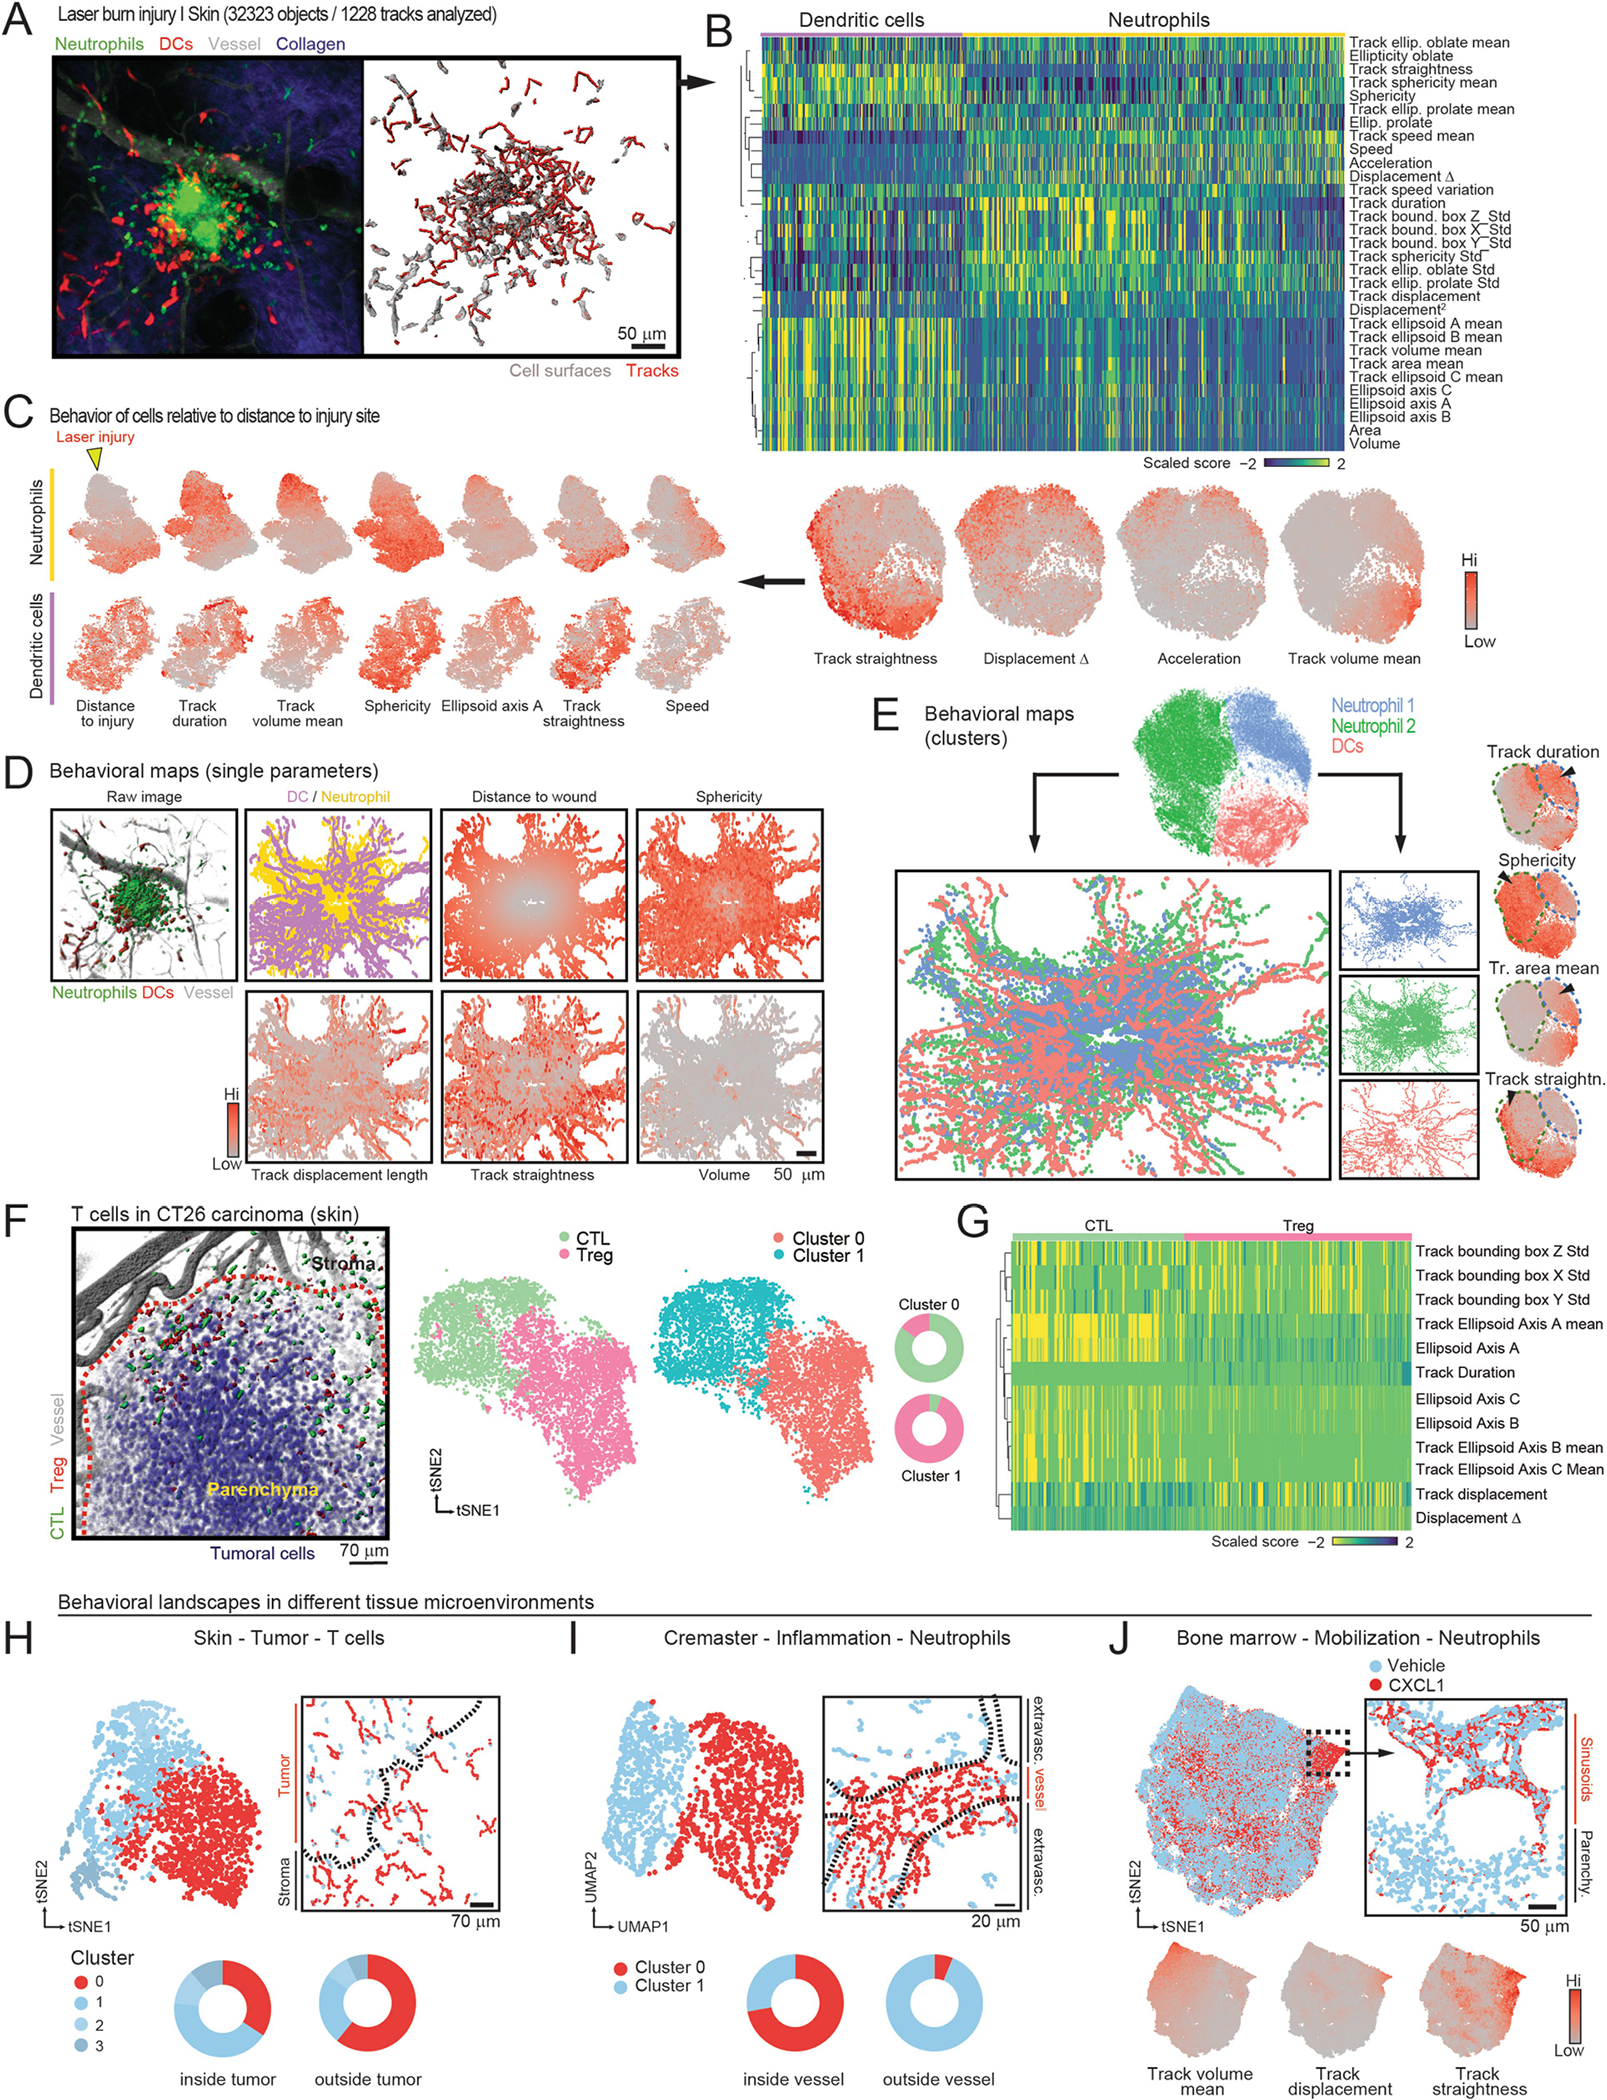
(A) Representative image of laser burn injury (original image left; reconstruction of volumes and tracks at right), (B) Heatmap of the all scored parameters, showing DCs and neutrophils. Expression tSNE plots of selected parameters are shown at bottom. (C) Individual analyses of the behavior of DCs and neutrophils from the original dataset, shown as tSNE plots for each population. Each behavioral parameter can be visualized and compared across cell subsets and parameters to infer random or gradient distribution for each population. For example, the location of the laser injury can be extracted as a parameter (left, yellow arrowhead) that shows graded behaviors of neutrophils relative to their distance to the wound, but not for DCs. (D) Examples of behavioral maps generated by projecting the intensity of specific parameters onto the XY location of individual cells at all time points. Actual image, plot-map by cell type and behavioral maps are shown. (E) Sub-clustering identifies two behavioral clusters of neutrophils and one for DCs (top), which were projected back onto their corresponding xyz position thus giving a profile of the distribution of behavioral clusters in the skin anatomy (middle). The neutrophil clusters feature differences in various parameters, as shown in the expression plots (arrowheads in the bottom tSNE plots). (F) Representative image of regulatory T cells (Treg) and cytotoxic T cells (CTL) in a CT26 carcinoma (red outline) in the skin, and tSNE plots of the cells classified by behavioral phenotype and by cell type. Donut plots show the match between both classifications. (G) Heatmap of the differentially scored parameters discriminating CTLs and Tregs. (H–J) Behavioral landscapes and maps of CTLs in carcinoma-bearing mice (H), neutrophils inside or outside inflamed vessels (I), and bone marrow neutrophils before and after administration of the mobilizing chemokine CXCL1 (J). Donut plots and expression plots illustrate the correlation between behavioral patterns or parameters and their localization in tissues. Dashed lines in the behavioral maps in (H–I) delineate tumor-stroma or vessel-parenchyma borders, respectively. Data are from one experiment per condition to visualize the distribution of cells in a single anatomical area.
Extended Data Fig. 5 |. Neutrophil states inside inflamed venules.
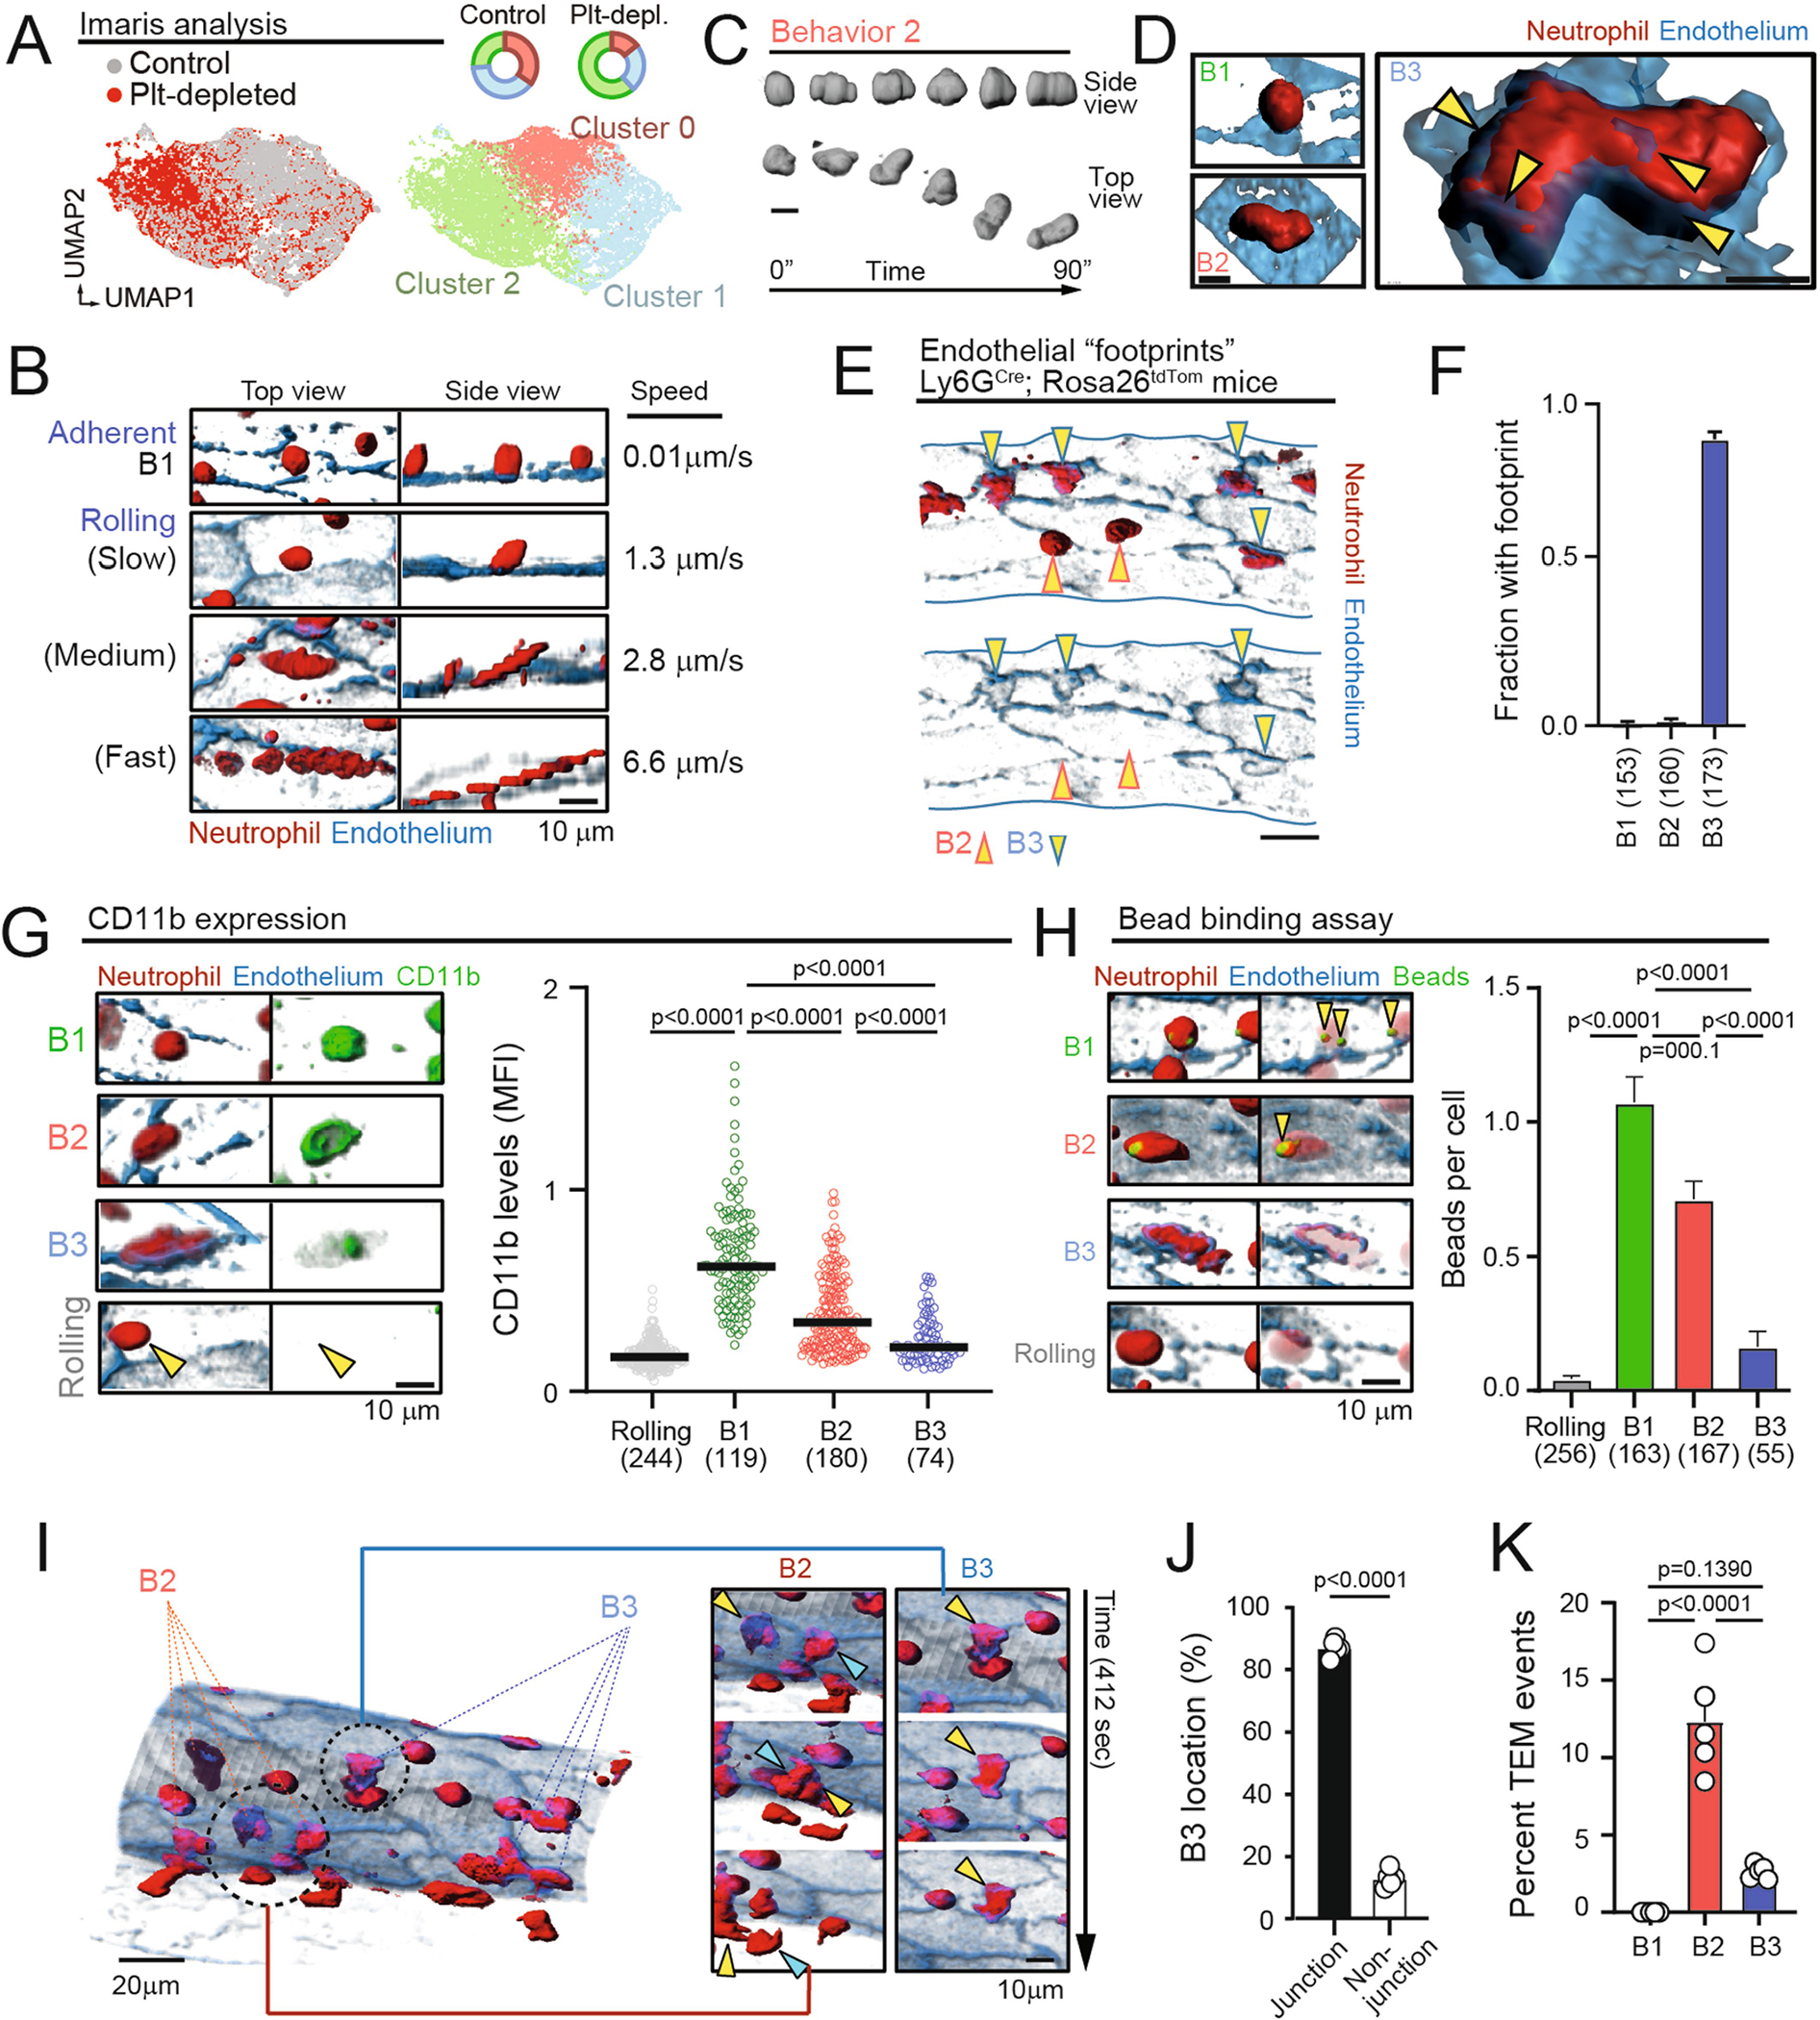
(A) Analysis of the cremaster dataset using Imaris software and UMAP representation show less defined behavioral clusters than using ACME (compare with Fig. 2d–f). Donut plots show the distribution of clusters in control and platelet-depleted mice. (B) Anomalous morphometric reconstructions of fast rolling cells, shown in top and side 3D views of cells moving at different speeds. Firmly adherent B1 neutrophils are shown for reference. (C) Rapid changes in morphology for neutrophils in the B2 group, following inchworm-type crawling during a 90 s recording; scale bar, 10 μm. (D) Membrane extensions (yellow arrowheads) forming around large oblate neutrophils in the B3 group, but not from B1 or B2; scale bar, 5 μm. (E) Representative micrograph of an inflamed vessel from Ly6GCre; Rosa26tdTom mouse with several neutrophils exhibiting B2 and B3 behavioral profiles (arrowheads), and “footprints” beneath B3 cells; scale bar, 10 μm. The presence of the footprints for each behavior is quantified in (F), where n is number of neutrophils analyzed. (G) Micrographs and quantification of CD11b expression measured by in vivo imaging across the different behavioral groups, with rolling neutrophils included as reference cells; data is from the indicated number of cells (in brackets), from 6 mice per group. (H) Micrographs and quantification of the number of beads phagocytosed by neutrophils from each behavioral group, including rolling cells; n is the number of cells (in brackets) from 6 mice analyzed per group. Scale bar, 5 μm. (I) Representative 3D image of an inflamed cremaster vessel showing examples of B2 and B3 neutrophils (left image), which were examined for extravasation across the endothelial wall over time (arrowheads in insets, right). (J) Percent of B3-type neutrophils that localize in junctional vs. non-junctional areas, and (K) the frequency of transendothelial migration (TEM) for each behavioral group of neutrophils; n is 5 mice per group, with the indicated number of analyzed cells (brackets). All bar graphs show mean ± SEM and data were analyzed by one-way ANOVA with Tukey’s multigroup comparison test (H, K) or unpaired two-tailed t-test (J). Number of analyzed cells per group from 3–5 mice each are indicated in brackets.
Extended Data Fig. 6 |. Transitional states of neutrophils in vessels.
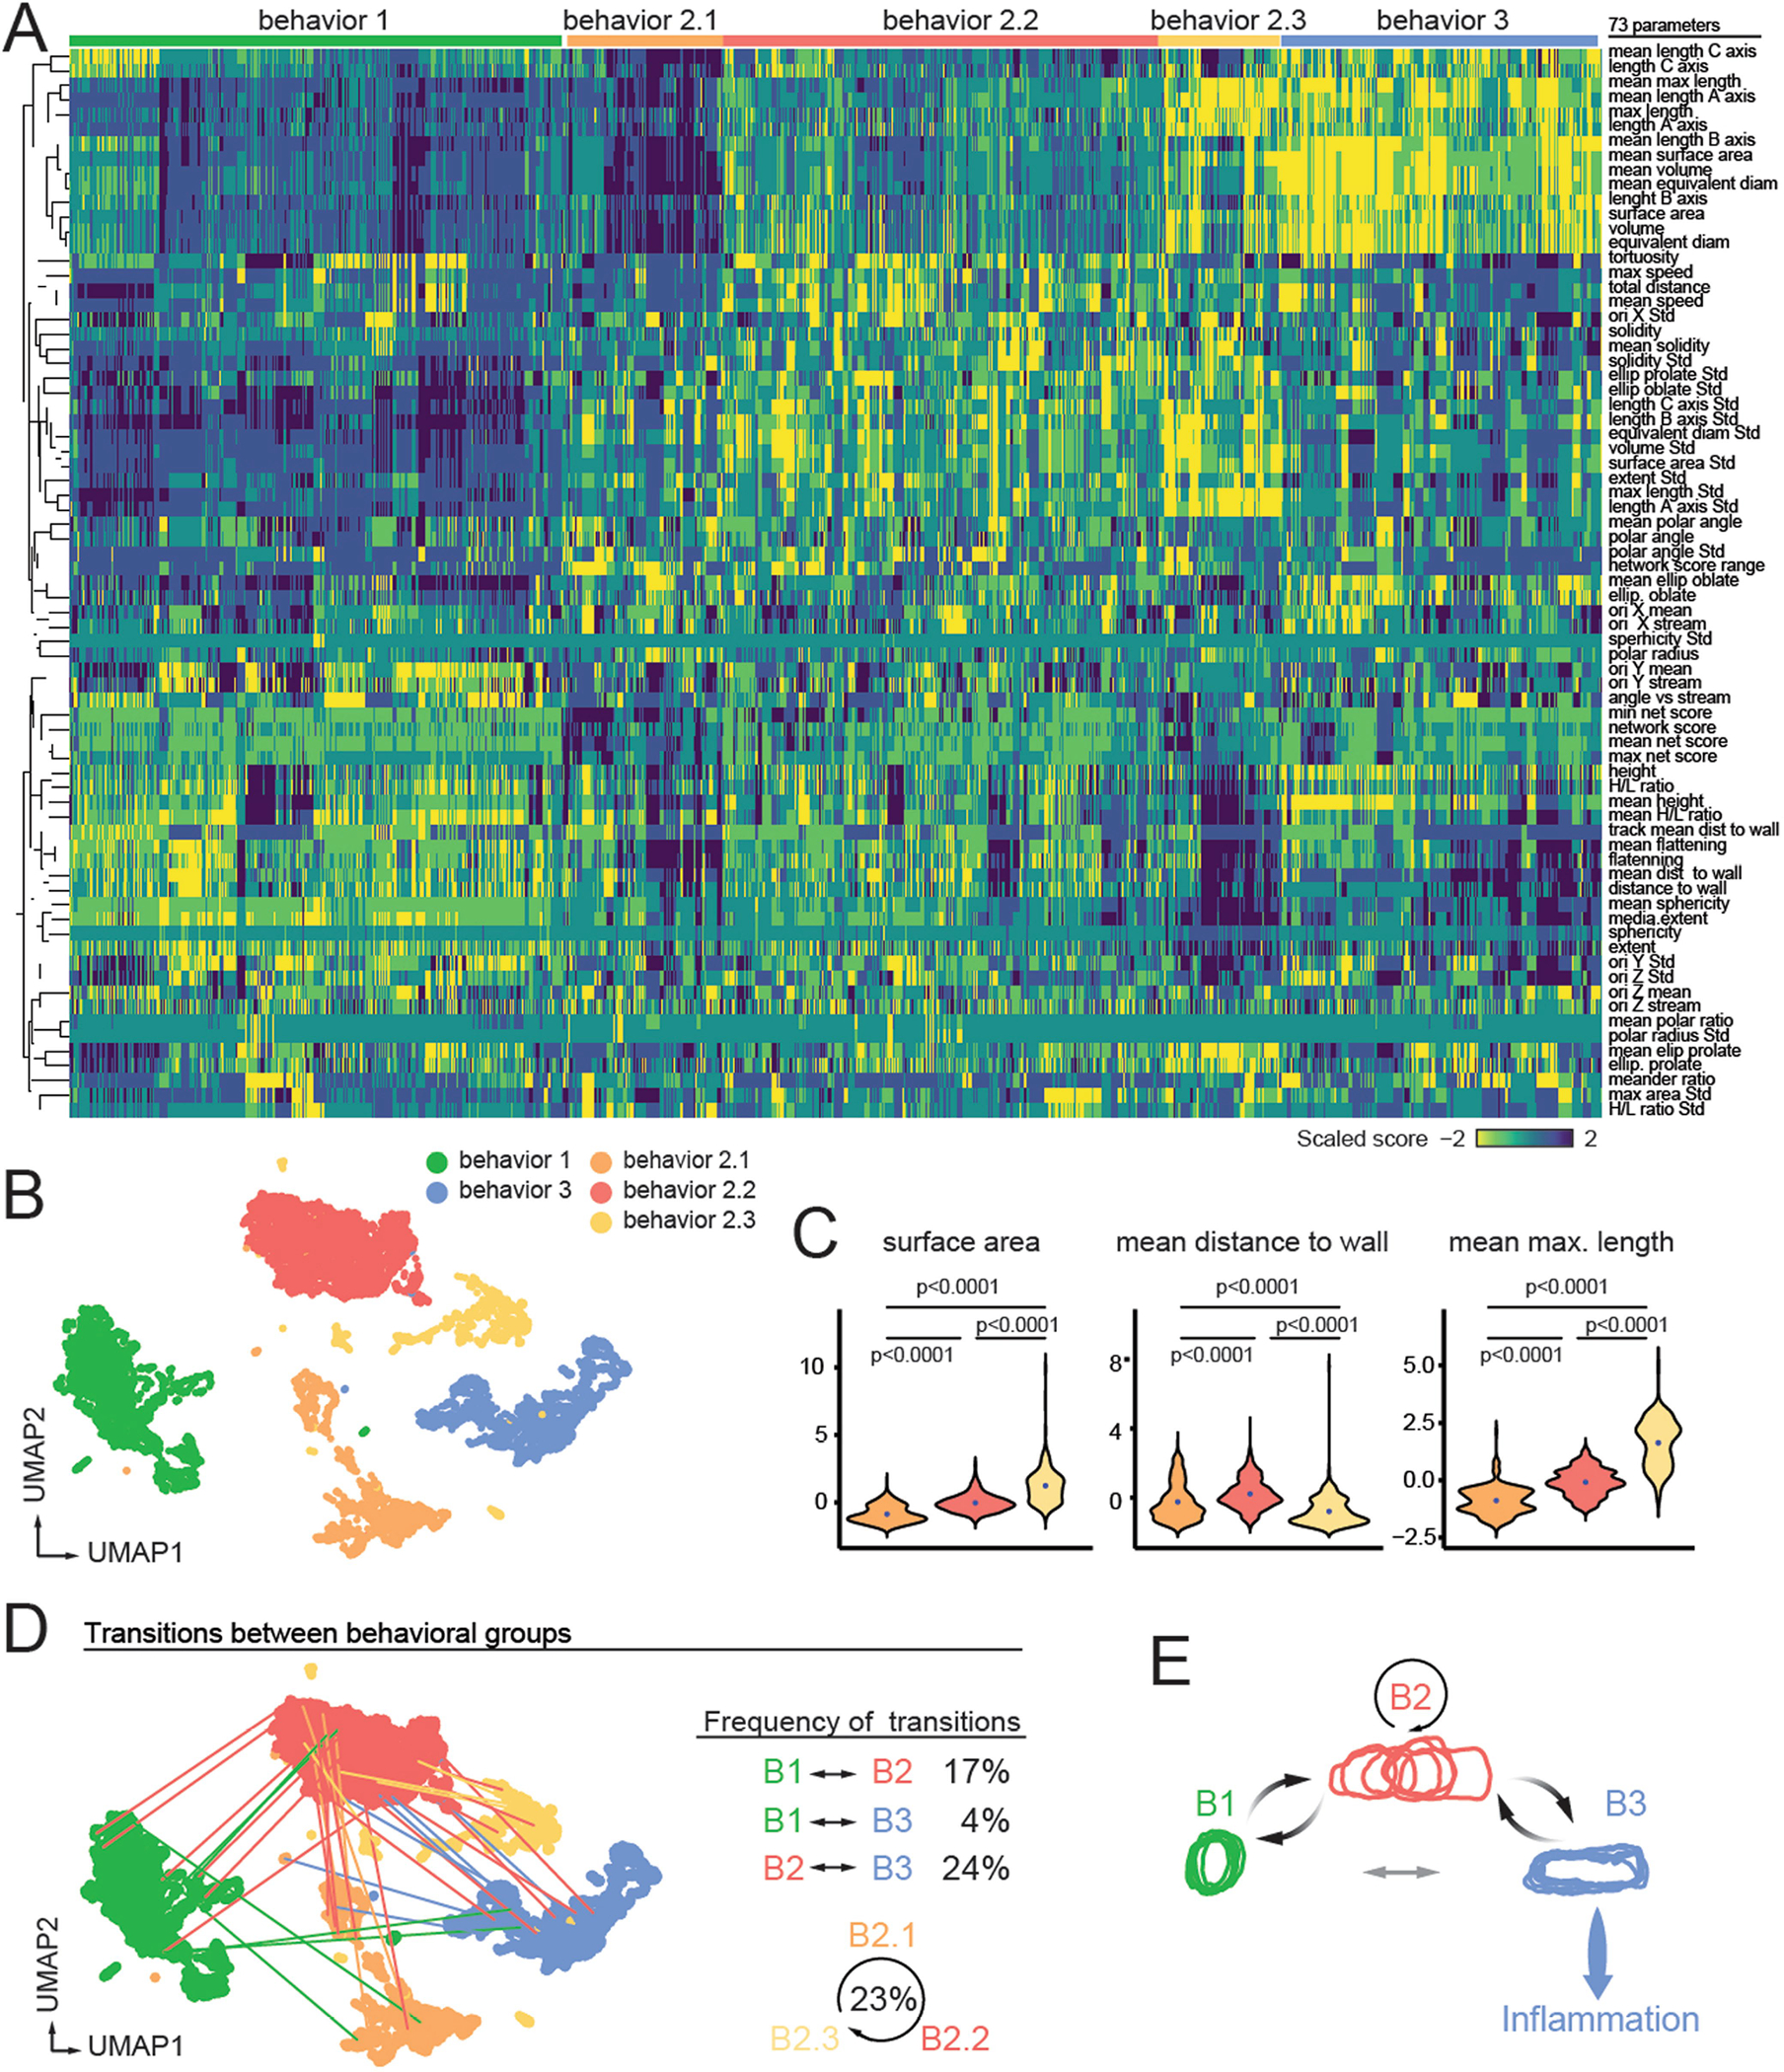
(A) Heatmap of all parameters across all behaviors, including the three sub-groups in B2. (B) UMAP based on hierarchical clustering to identify two additional behavioral clusters within B2. (C) Distribution of cells in each sub-cluster B2.1, B2.2 and B2.3 for the indicated parameters, showing for example that cells B2.3 feature sizes and distances to the vessel wall similar to those of B3. Data analyzed by one-way ANOVA. (D) Transitions between behavioral clusters shown graphically in the UMAP (left) and quantified at right. (E) Scheme illustrating the most common transitions typically involving passage through B2, suggesting that this is an obligate transitional stage for neutrophils in inflamed vessels. Drawings in each group represent the silhouettes of representative cells at different times as in Fig. 2h.
Extended Data Fig. 7 |. Track parameters in the behavioral screening.
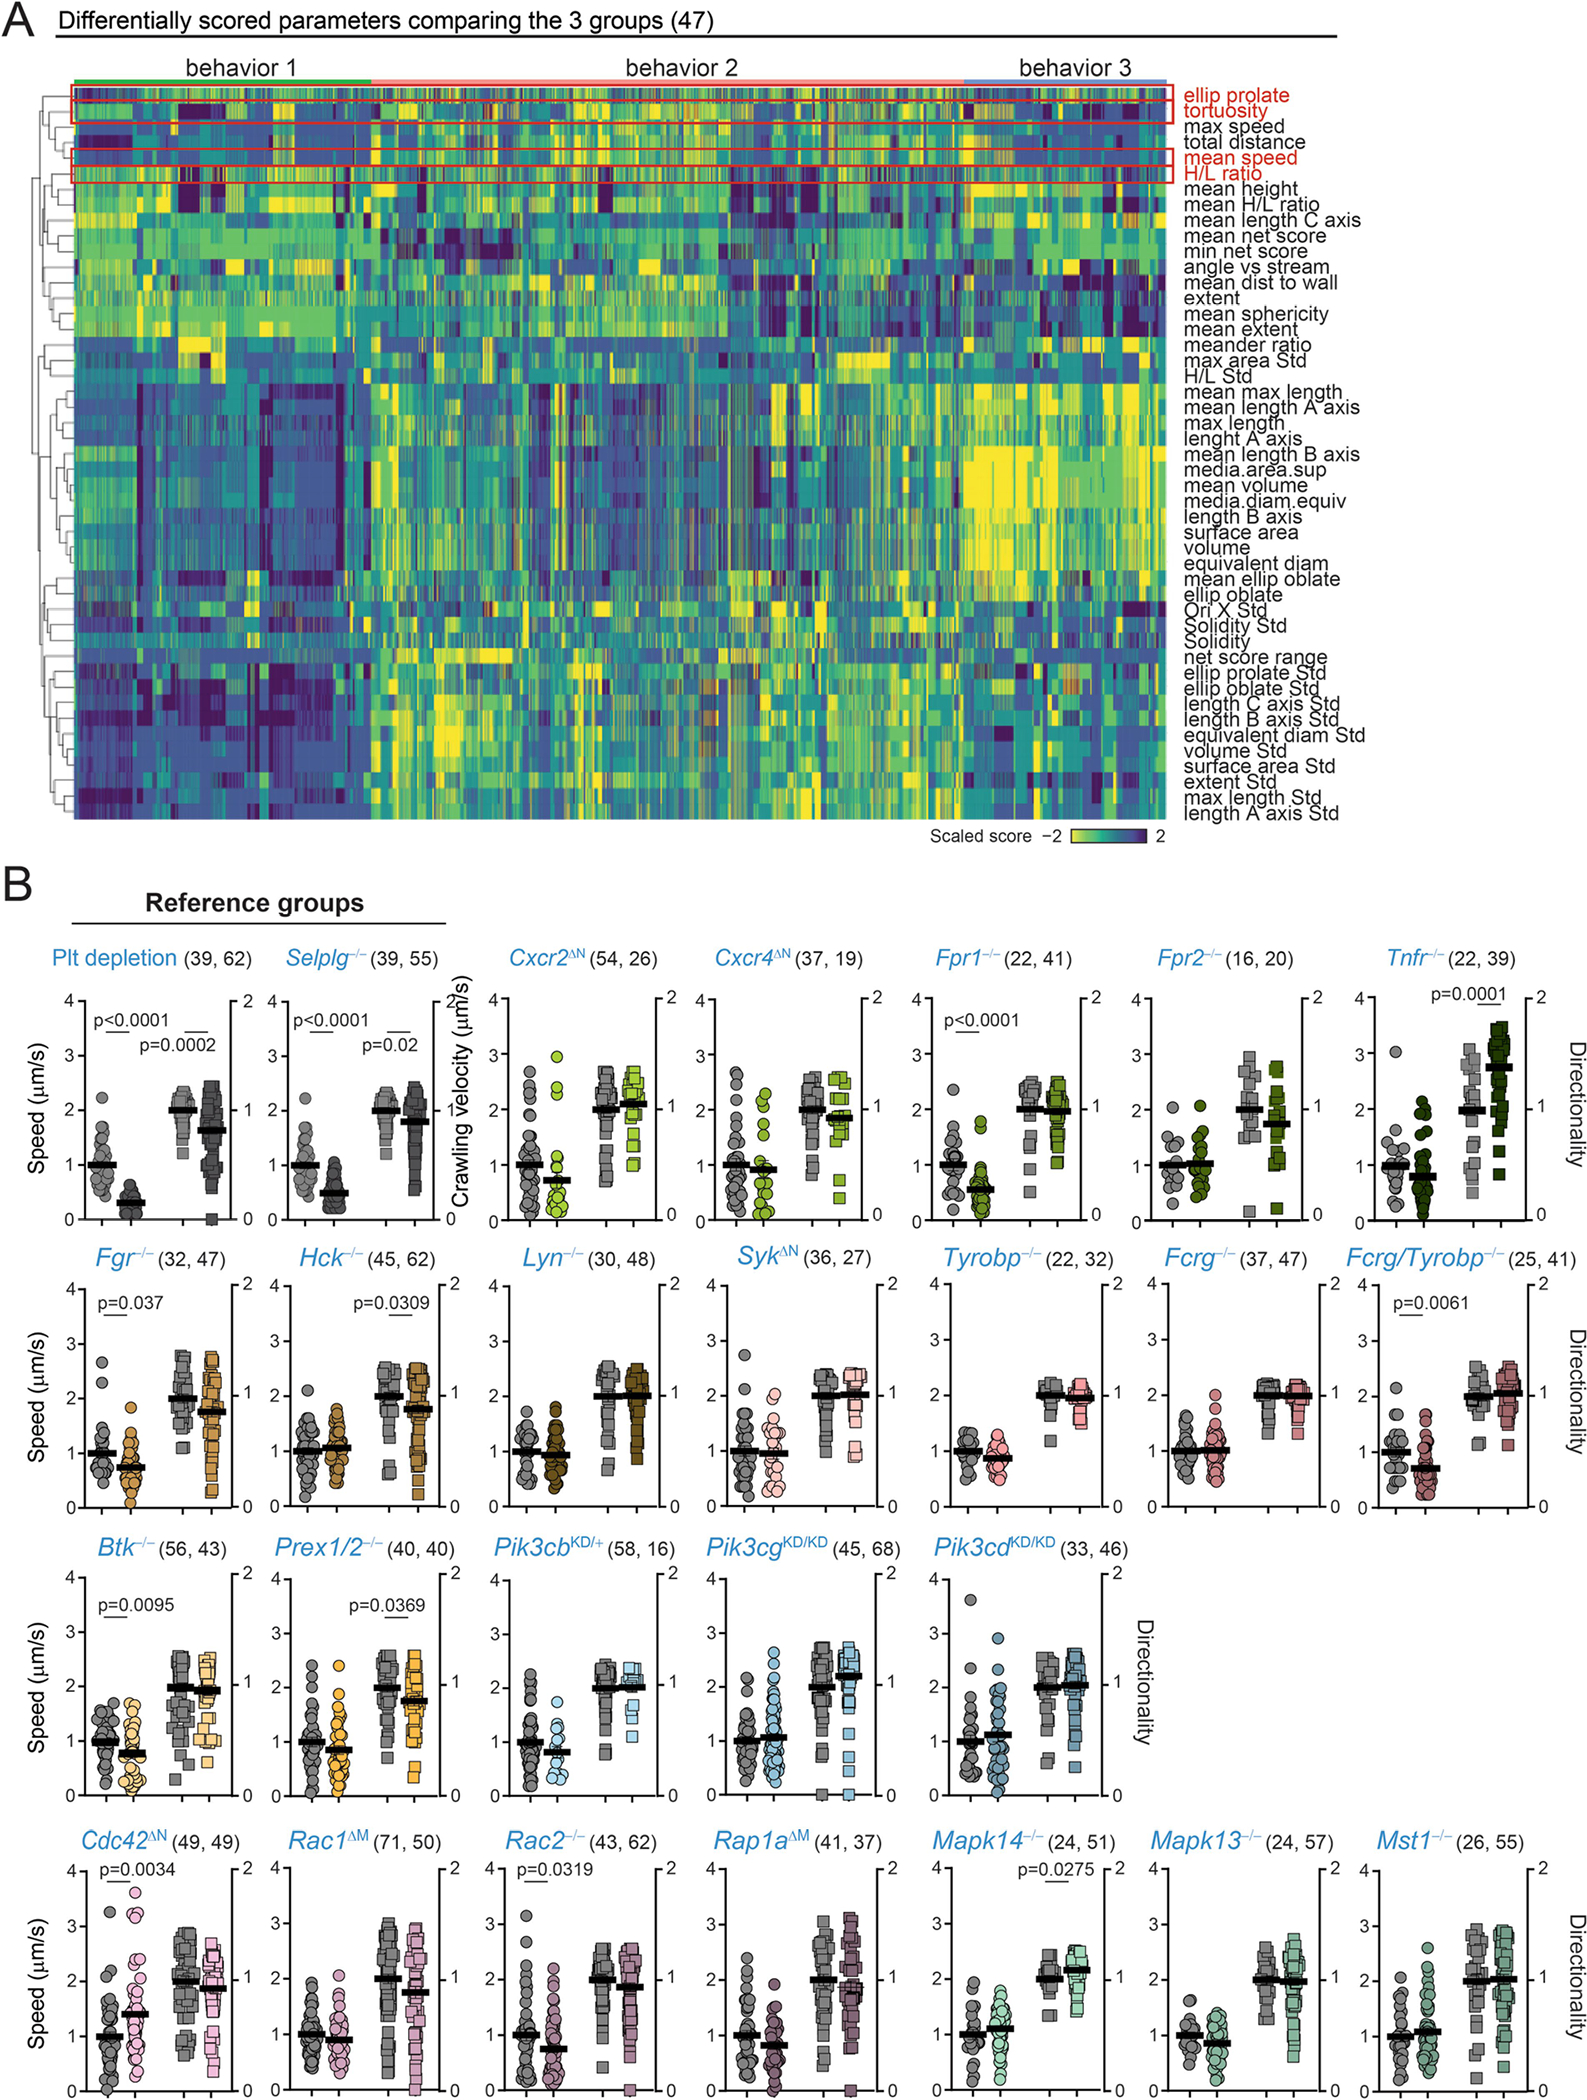
(A) Heatmap of the differentially scored behaviors among the three main behavioral groups (B1, B2 and B3). Outlined in red are the specific behaviors chosen for our screening in Fig. 3. Note that “tortuosity” is an inverse measure of “directionality”, which was used in our screening. (B) Speed and directionality obtained by epifluorescence (2D) analysis of cremasteric venules in mice with mixed chimeric bone marrow of wild-typeDsRed and non-fluorescent mutant donors, which provided internal controls for each group. Thick lines show means; The number of analyzed cells per group is shown in brackets as (control, mutant), and were obtained from at least 3 mice per group. Data analyzed by unpaired two-tailed t-test.
Extended Data Fig. 8 |. Morphometric parameters in the behavioral screening.
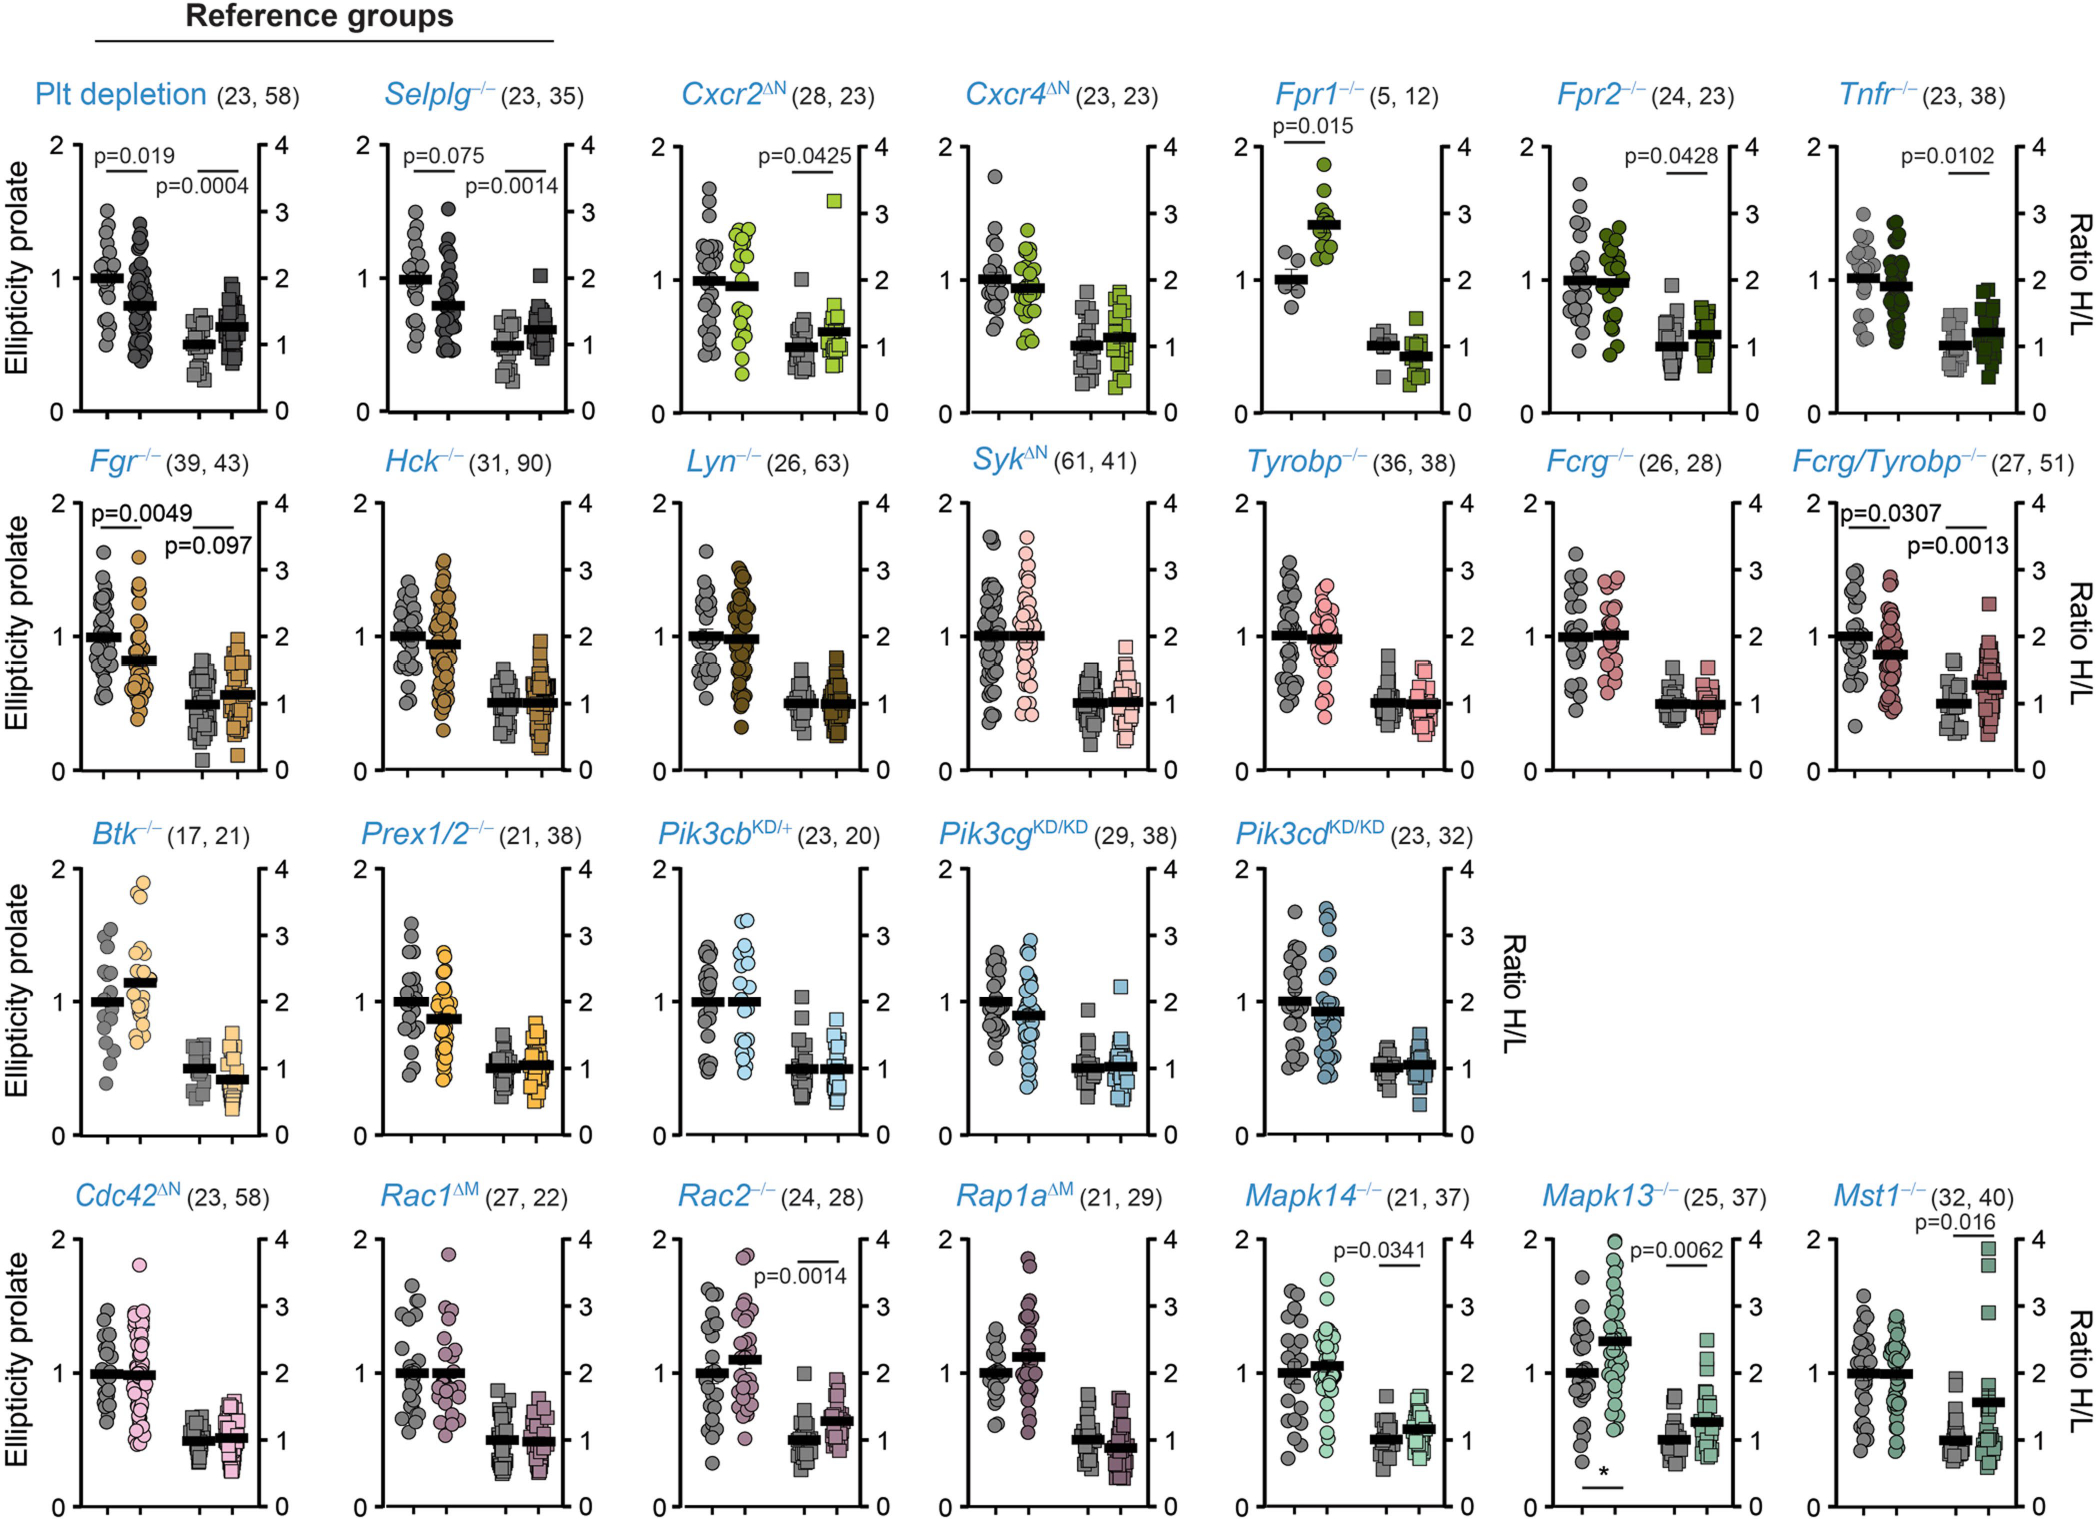
Ellipticity prolate and H/L ratios measured for individual cells in static 3D reconstructions from 24 mutant and 3 control groups as summarized in Fig. 3. Values are from cremasteric venules in mice with mixed chimeric bone marrow of wild-typeDsRed and non-fluorescent mutant donors, which provided internal controls for each group. Thick lines show means; The number of analyzed cells per group is shown in brackets as (control, mutant), and were obtained from at least 3 mice per group. Data analyzed by unpaired two-tailed t-test analysis.
Extended Data Fig. 9 |. Protection from myocardial injury by targeting Fgr.
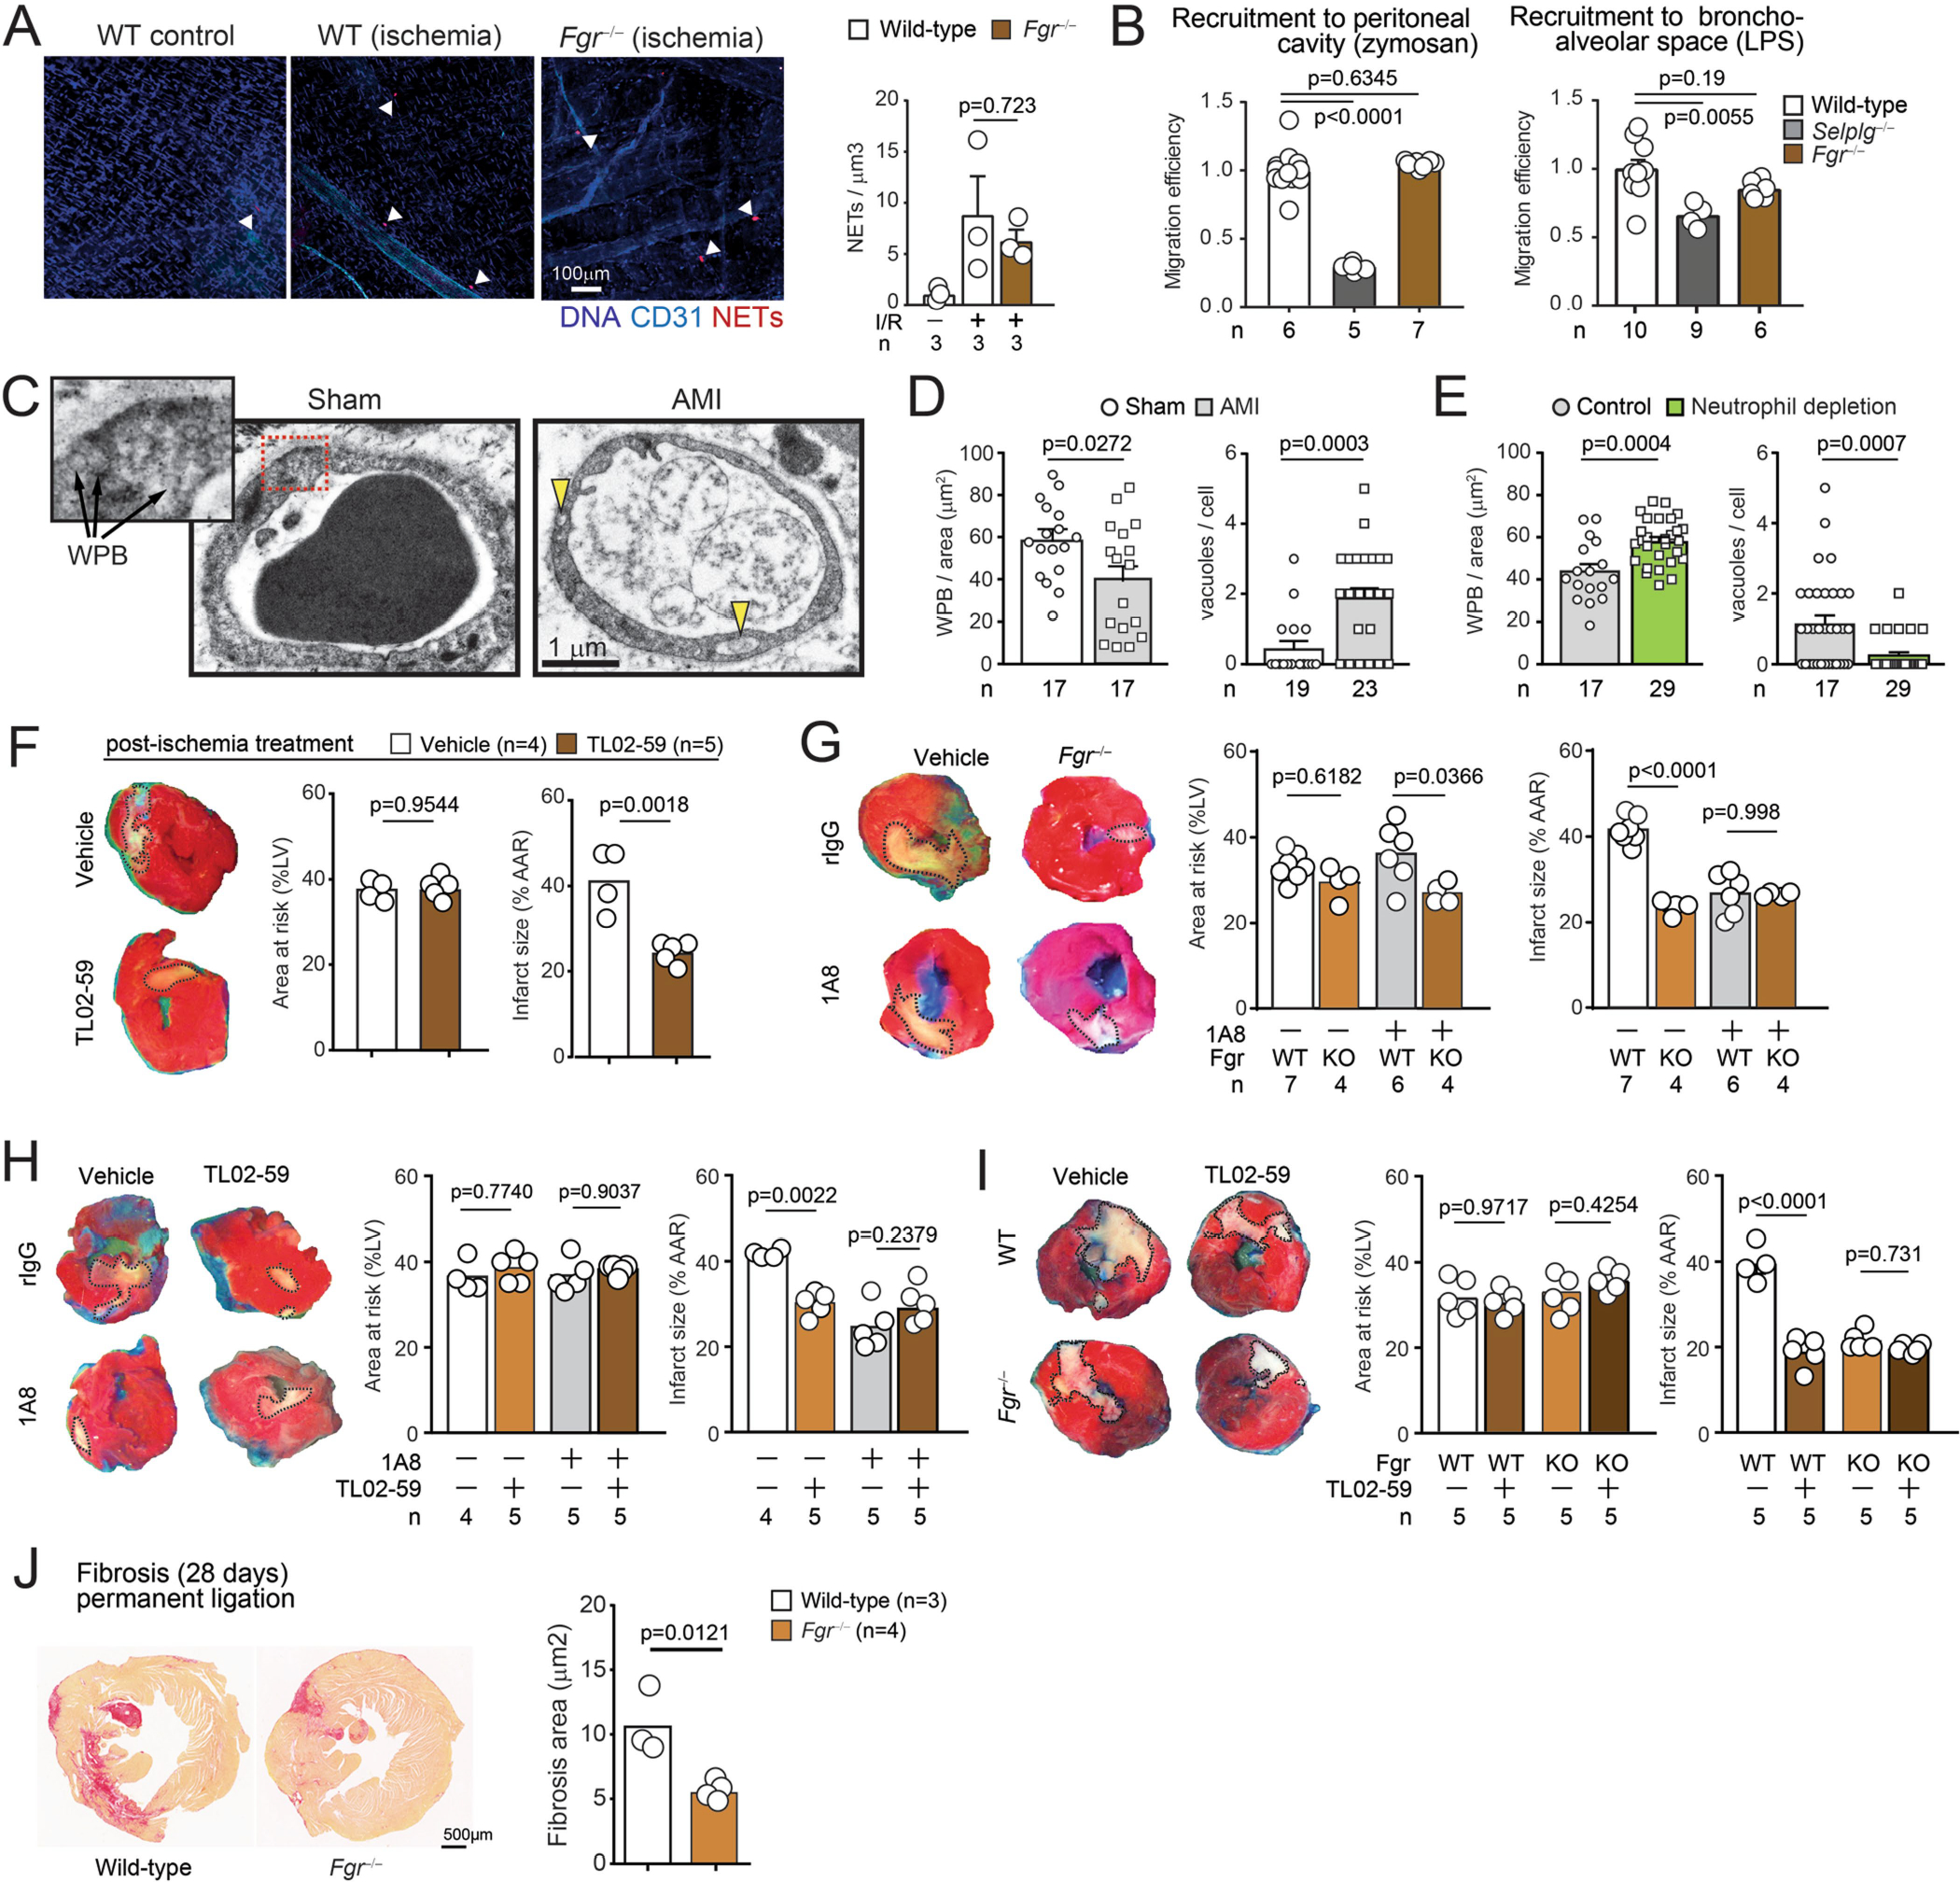
(A) Micrographs of NETs (positive for citH3 and MPO; red) and vessels (blue) in cremasteric venules of wild-type subjected or not to I/R, and Fgr−/− mice subjected to I/R. Right, quantification of NETs per tissue volume; Data shown as mean ± SEM and n are number of mice per group. (B) Competitive recruitment of wild-type and Fgr−/− neutrophils to the peritoneal cavity after zymosan injection, or to the bronchoalveolar space of lungs after LPS instillation in mixed chimeric mice; n are numbers of mice analyzed. Selplg−/− neutrophils are shown for comparison of impaired migration. Values are normalized to reference wild-type competitors across the different groups and given as migration efficiencies. Data shown as mean ± SEM and n are number of mice analyzed. (C) Micrographs of Weibel-Palade bodies (WPB) and vacuoles in myocardial vessels after sham or ischemic challenge, which are quantified in (D). These measures of vascular damage are dependent on neutrophils, as shown after experimental depletion with 1A8 antibody (E). Data shown as mean ± SEM, and n is the number of micrographs analyzed, from 2 mice. (F) Effect of the Fgr antagonist TL02–59 in myocardial death upon ischemia-reperfusion, when given after ischemia at the time of reperfusion. Micrographs of heart sections at left illustrate the protective effect on myocardial death (outlined whitish regions). Data are normalized to the area at risk (AAR) and shown as mean from 4 mice per group. (G) Combination of neutrophil depletion with 1A8 antibody, and Fgr deficiency in transplanted mice. The infarcted areas are normalized with the areas at risk; n is number of mice per group. (H) Combination of neutrophil depletion with the Fgr agonist TL02–59. Data shown as mean ± SEM; n are mice per group. (I) Combination of the Fgr inhibitor in hematopoietic Fgr−/− mice, with no effect in further protecting from myocardial death; n are mice per group. (J) Myocardial fibrosis (left ventricle) determined by hematoxylin and eosin staining in control wild-type and Fgr−/− mice subjected to permanent ischemia and analyzed after 28 days. The fibrosis area is represented at right; n are mice per group. All data from (A, B) was analyzed by one-way ANOVA with Tukey’s multiple comparison test; (G–I) was analyzed by two-way ANOVA with Tukey’s multiple comparisons test. All other panels are compared by two-tailed unpaired-t test (C-F and J). The number of replicates (n) per group is indicated in each panel.
Extended Data Fig. 10 |. Protection from nephrotoxic injury by targeting Fgr.
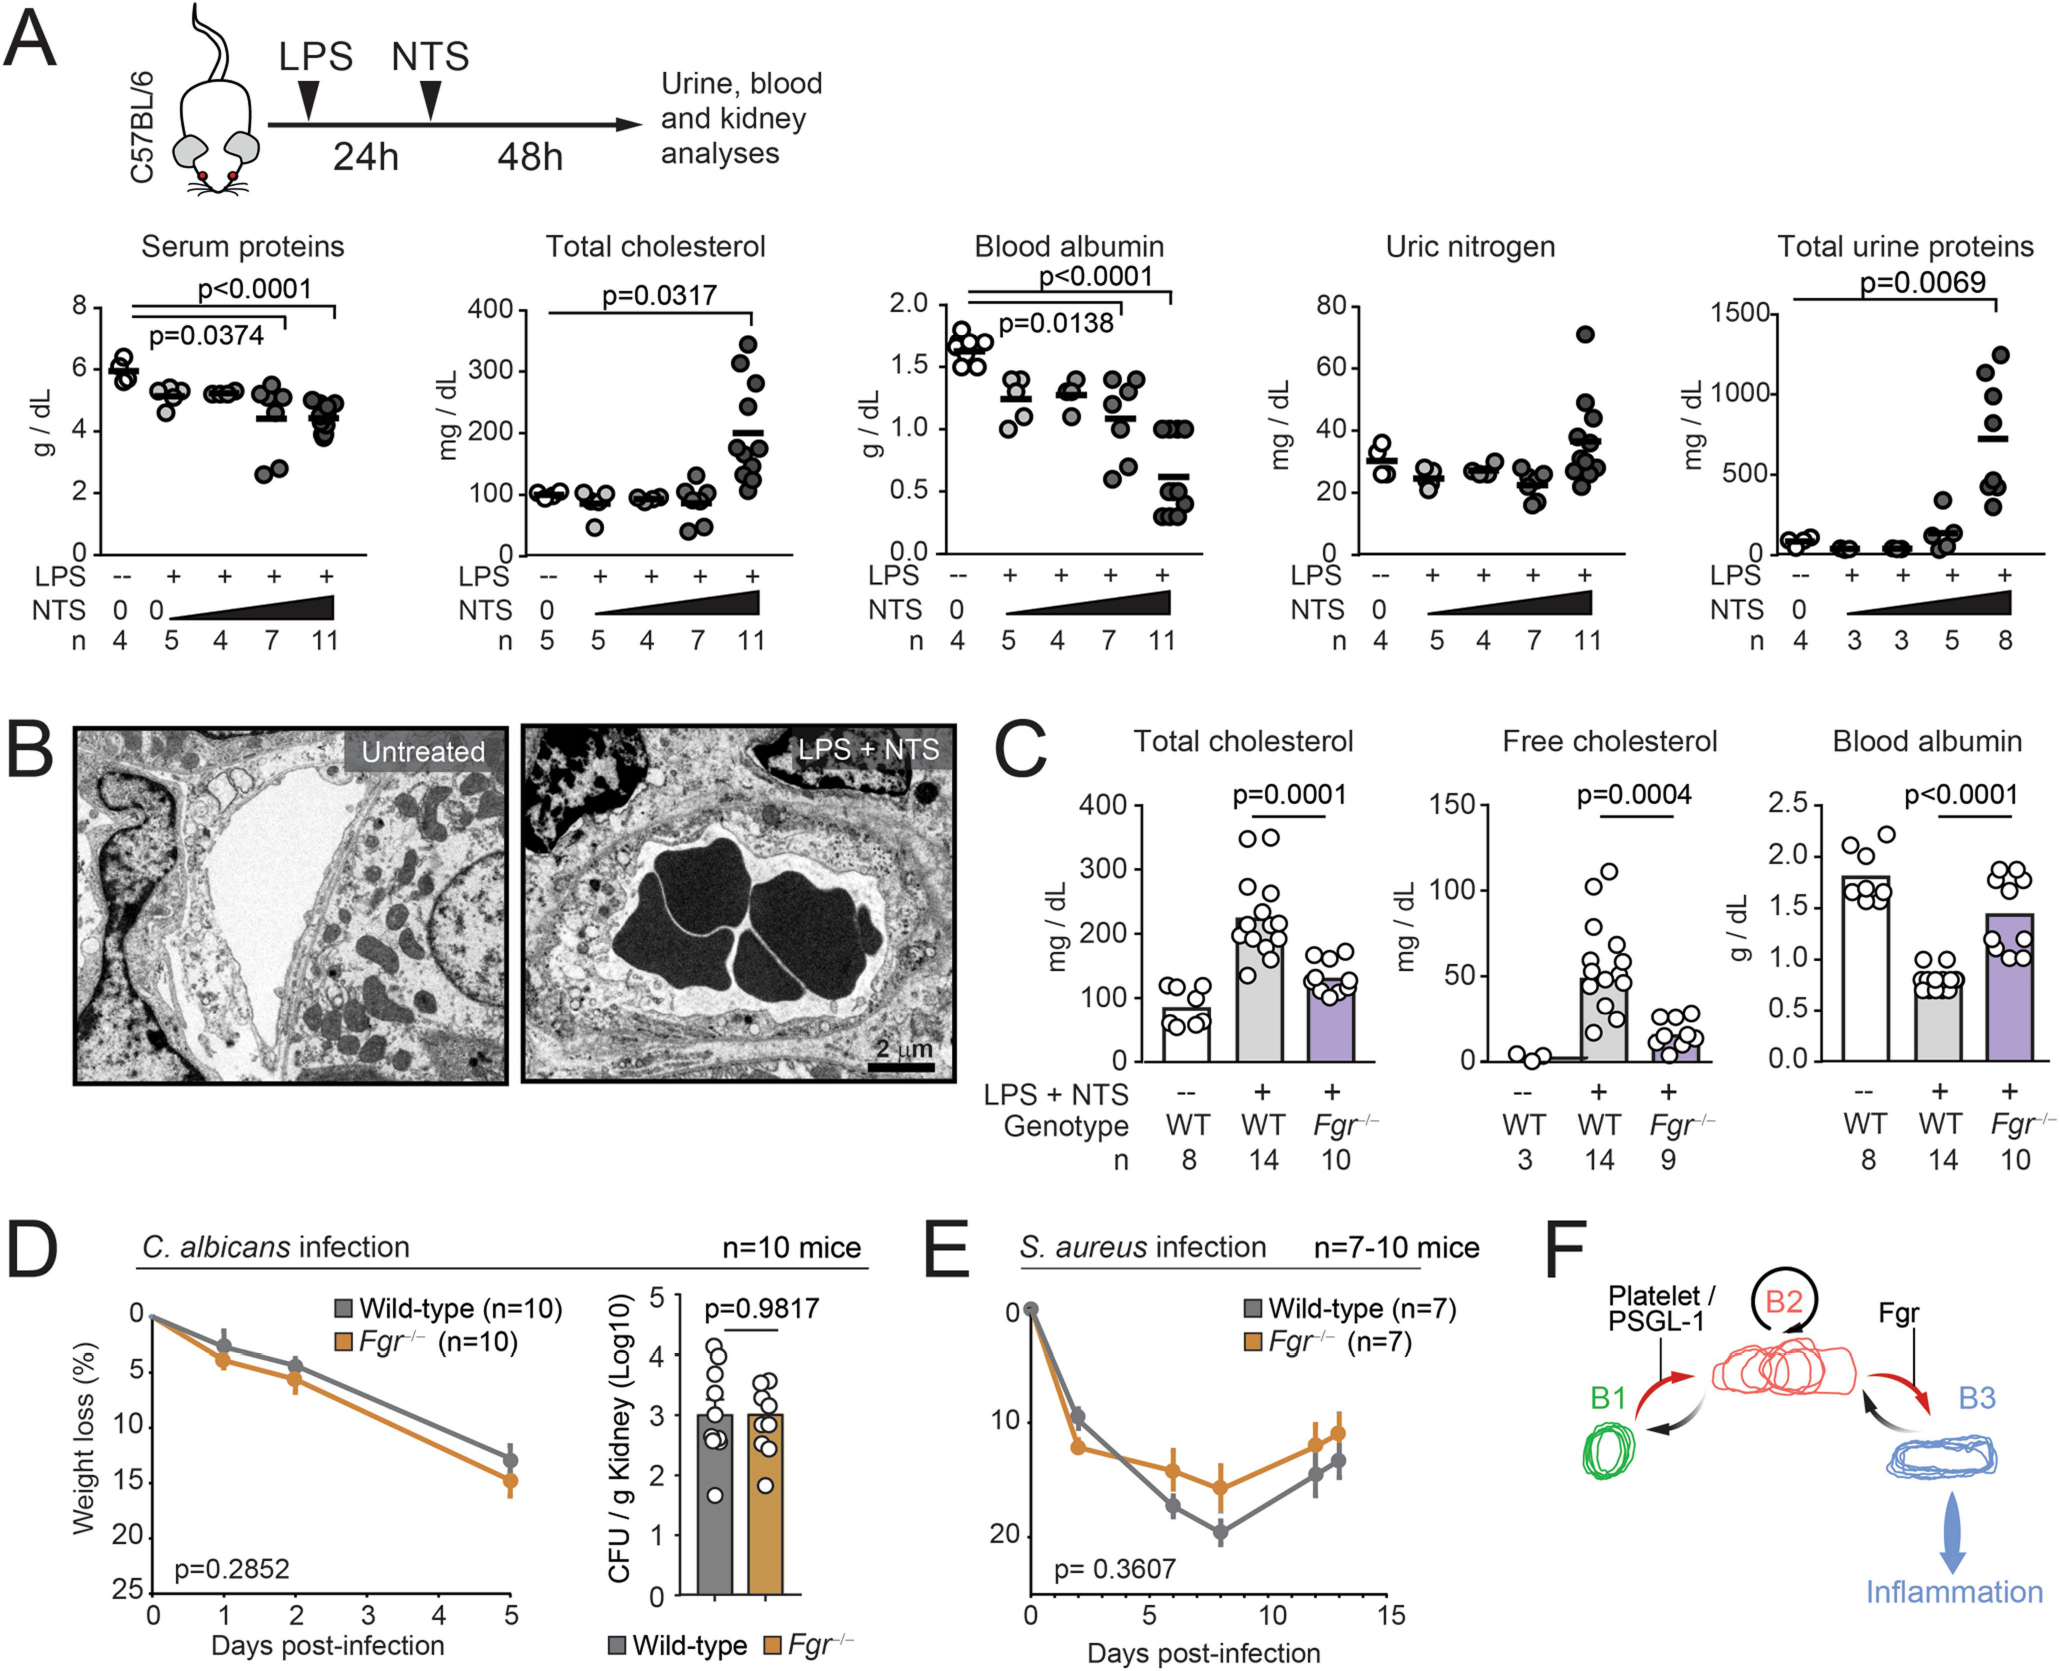
(A) Schematic of the nephrotoxic injury model (top) and setup of conditions combining endotoxin (LPS) with increasing amounts of nephrotoxic serum (NTS), resulting in gradual increase in markers of kidney damage in serum and urine; n are number of mice per dose. (B) Transmission electron micrograph of kidney venules showing an example of intravascular occlusion in the NTS-treated mice, from 2 mice and 25–30 images analyzed. (C) Levels of the indicated metabolites in plasma of control and Fgr−/− mice before and after induction of glomerulonephritis with LPS plus NTS. The control group was treated with LPS only; n are mice analyzed per group. (D–E) Mice reconstituted with marrow from wild-type or Fgr−/− donor mice were infected with C. albicans (D) or S. aureus (E) and infection progression was measured by weight loss, and in the case of C. albicans infection by scoring the fungal load in kidneys (CFU); n are mice analyzed per group and data in (A) was analyzed by unpaired t-test. For (D–E) groups were compared by two-way ANOVA analyses for weight loss, and unpaired t-test for CFUs. Data in (C) was analyzed by one-way ANOVA with Tukey’s multiple comparisons test. (F) Scheme modeling neutrophil states, transitions, and delivery of inflammatory signals to the host tissues from B3 cells. Each transition is proposed to be caused by different signals, e.g. delivered by platelets and PSGL-1 for initial transition from B1 to B2, and via Fgr for transitions from B2 to B3. The number of replicates (n) per group is indicated in each panel.
Supplementary Material
Acknowledgements
We thank all members of the Hidalgo laboratory and M. Desco for discussion; P. Frenette for inspiring this study; C. C. Goh and E. Y. Kim for seeding imaging experiments; the electron microscopy unit from the faculty of Medicine of Universidad Autonoma de Madrid for help with experiments; E. Marín, L. Cabezuela, E. Santos, R. Mota and the animal facility at CNIC for animal husbandry, animal procedures and histology; J. Rossaint, M. Gunzer, J.A. Enriquez, A. Mocsai, R.W. Hendricks, G. Sabio, M. Sperandio, E. Hirsch and B. Walzog for the generous gift of mutant mice; and C. Torroja, D. Jiménez and M. Desco for technical advice. This study was supported by RTI2018-095497-B-I00 from Ministerio de Ciencia e Innovación (MCIN), HR17_00527 from Fundación La Caixa, Transatlantic Network of Excellence (TNE-18CVD04) from the Leducq Foundation, and FET-OPEN (no. 861878) from the European Commission to A.H. M.P-S. is supported by a Federation of European Biochemical Societies and the EMBO ALTF (no. 1142–2020) long-term fellowships. J.S. is supported by a fellowship (PRE2019-089130) from MICINN and A.A.-C. is supported by fellowship CF/BQ/DR19/11740022 from La Caixa Foundation. J.L.Y.L. was supported by A*STAR and a Juan de la Cierva JCI-2017-33136 Fellowship from MICINN. S.D.C. is a recipient of a Marie Sklodowska-Curie fellowship (749731). M.G. is supported by SAF2017-89116R-P from MCIN and HR18_00120 from la Fundación La Caixa. T.R.M. is supported by grant NIH AI163223, L.G.N. is supported by SIgN core funding from A*STAR, and G.F.C. is supported by MCIN/AEI/10.13039/501100011033 (grant PID2019-110895RB-I00) and by Junta de Comunidades de Castilla-La Mancha (SBPLY/19/180501/000211). F.S.-C. is supported by MCIN (grant RTI2018-102084-B-I00), O.S. is supported by the Leducq Foundation (TNE-18CVD04), F.D.-d.-M. is supported by MCIN (TEC2017-84395-P), and T.E.S. is supported by the National Cancer Institute, NIH grant CA233576. The CNIC is supported by the MCIN and the Pro-CNIC Foundation.
Footnotes
Competing interests A.H. is a consultant for Flagship Pioneering. The other authors declare no competing interests.
Reporting summary
Further information on research design is available in the Nature Research Reporting Summary linked to this paper.
Code availability
All code used are available to any researcher for purposes of reproducing or extending these analyses. The code for ACME is available at https://doi.org/10.5281/zenodo.5638537.
Additional information
Supplementary information The online version contains supplementary material available at https://doi.org/10.1038/s41586-021-04263-y.
Peer review information Nature thanks Klaus Ley and the other, anonymous, reviewer(s) for their contribution to the peer review of this work.
Reprints and permissions information is available at http://www.nature.com/reprints.
Data availability
All data and materials used in the study are available to any researcher for purposes of reproducing or extending these analyses. Source data are provided with this paper.
References
- 1.Kwok I et al. Combinatorial single-cell analyses of granulocyte–monocyte progenitor heterogeneity reveals an early uni-potent neutrophil progenitor. Immunity 53, 303–318. e5 (2020). [DOI] [PubMed] [Google Scholar]
- 2.Amit I, Regev A & Hacohen N Strategies to discover regulatory circuits of the mammalian immune system. Nat. Rev. Immunol. 11, 873–880 (2011). [DOI] [PMC free article] [PubMed] [Google Scholar]
- 3.Lämmermann T et al. Neutrophil swarms require LTB4 and integrins at sites of cell death in vivo. Nature 498, 371–375 (2013). [DOI] [PMC free article] [PubMed] [Google Scholar]
- 4.Sreeramkumar V et al. Neutrophils scan for activated platelets to initiate inflammation. Science 346, 1234–1238 (2014). [DOI] [PMC free article] [PubMed] [Google Scholar]
- 5.Woodfin A et al. The junctional adhesion molecule JAM-C regulates polarized transendothelial migration of neutrophils in vivo. Nat. Immunol. 12, 761–769 (2011). [DOI] [PMC free article] [PubMed] [Google Scholar]
- 6.Papalexi E & Satija R Single-cell RNA sequencing to explore immune cell heterogeneity. Nat. Rev. Immunol. 18, 35–45 (2018). [DOI] [PubMed] [Google Scholar]
- 7.Sumen C, Mempel TR, Bazo IB & von Andrian UH Intravital microscopy: visualizing immunity in context. Immunity 21, 315–329 (2004). [DOI] [PubMed] [Google Scholar]
- 8.Lelkes E, Headley MB, Thornton EE, Looney MR & Krummel MF The spatiotemporal cellular dynamics of lung immunity. Trends Immunol. 35, 379–386 (2014). [DOI] [PMC free article] [PubMed] [Google Scholar]
- 9.Yamada KM & Sixt M Mechanisms of 3D cell migration. Nat. Rev. Mol. Cell Biol. 20, 738–752 (2019). [DOI] [PubMed] [Google Scholar]
- 10.Goh CC et al. Real-time imaging of dendritic cell responses to sterile tissue injury. J. Invest. Dermatol. 135, 1181–1184 (2015). [DOI] [PubMed] [Google Scholar]
- 11.Goh CC et al. The impact of ischemia–reperfusion injuries on skin resident murine dendritic cells. Eur. J. Immunol. 48, 1014–1019 (2018). [DOI] [PubMed] [Google Scholar]
- 12.Adrover JM et al. Programmed ‘disarming’ of the neutrophil proteome reduces the magnitude of inflammation. Nat. Immunol. 21, 135–144 (2020). [DOI] [PMC free article] [PubMed] [Google Scholar]
- 13.Adrover JM et al. A neutrophil timer coordinates immune defense and vascular protection. Immunity 50, 390–402.e10 (2019). [DOI] [PubMed] [Google Scholar]
- 14.Hasenberg A et al. Catchup: a mouse model for imaging-based tracking and modulation of neutrophil granulocytes. Nat. Methods 12, 445–452 (2015). [DOI] [PubMed] [Google Scholar]
- 15.Hidalgo A et al. Heterotypic interactions enabled by polarized neutrophil microdomains mediate thromboinflammatory injury. Nat. Med. 15, 384–391 (2009). [DOI] [PMC free article] [PubMed] [Google Scholar]
- 16.Mócsai A, Walzog B & Lowell CA Intracellular signalling during neutrophil recruitment. Cardiovasc. Res. 107, 373–385 (2015). [DOI] [PMC free article] [PubMed] [Google Scholar]
- 17.Weir MC et al. Selective inhibition of the myeloid Src-family kinase Fgr potently suppresses AML cell growth in vitro and in vivo. ACS Chem. Biol. 13, 1551–1559 (2018). [DOI] [PMC free article] [PubMed] [Google Scholar]
- 18.García-Prieto J et al. Neutrophil stunning by metoprolol reduces infarct size. Nat. Commun. 8, 14780 (2017). [DOI] [PMC free article] [PubMed] [Google Scholar]
- 19.Hirahashi J et al. Mac-1 (CD11b/CD18) links inflammation and thrombosis after glomerular injury. Circulation 120, 1255–1265 (2009). [DOI] [PMC free article] [PubMed] [Google Scholar]
- 20.McArdle S et al. Migratory and dancing macrophage subsets in atherosclerotic lesions. Circ. Res. 125, 1038–1051 (2019). [DOI] [PMC free article] [PubMed] [Google Scholar]
- 21.Mempel TR, Henrickson SE & von Andrian UH T-cell priming by dendritic cells in lymph nodes occurs in three distinct phases. Nature 427, 154–159 (2004). [DOI] [PubMed] [Google Scholar]
- 22.Boulch M et al. A cross-talk between CAR T cell subsets and the tumor microenvironment is essential for sustained cytotoxic activity. Sci. Immunol. 6, eabd4344 (2021). [DOI] [PubMed] [Google Scholar]
- 23.Ivanovitch K, Temiño S & Torres M Live imaging of heart tube development in mouse reveals alternating phases of cardiac differentiation and morphogenesis. eLife 6, e30668 (2017). [DOI] [PMC free article] [PubMed] [Google Scholar]
- 24.Lindquist RL et al. Visualizing dendritic cell networks in vivo. Nat. Immunol. 5, 1243–1250 (2004). [DOI] [PubMed] [Google Scholar]
- 25.Faust N, Varas F, Kelly LM, Heck S & Graf T Insertion of enhanced green fluorescent protein into the lysozyme gene creates mice with green fluorescent granulocytes and macrophages. Blood 96, 719–726 (2000). [PubMed] [Google Scholar]
- 26.Palomino-Segura M, Virgilio T, Morone D, Pizzagalli DU & Gonzalez SF Imaging cell interaction in tracheal mucosa during influenza virus infection using two-photon intravital microscopy. J. Vis. Exp. 58355 (2018). [DOI] [PMC free article] [PubMed] [Google Scholar]
- 27.Bauer CA et al. Dynamic Treg interactions with intratumoral APCs promote local CTL dysfunction. J. Clin. Invest. 124, 2425–2440 (2014). [DOI] [PMC free article] [PubMed] [Google Scholar]
- 28.Tran Cao HS et al. Development of the transgenic cyan fluorescent protein (CFP)-expressing nude mouse for ‘technicolor’ cancer imaging. J. Cell. Biochem. 107, 328–334 (2009). [DOI] [PMC free article] [PubMed] [Google Scholar]
- 29.Devi S et al. Neutrophil mobilization via plerixafor mediated CXCR4 inhibition arises from lung demargination and blockade of neutrophil homing to the bone marrow. J. Exp. Med. 210, 2321–2336 (2013). [DOI] [PMC free article] [PubMed] [Google Scholar]
- 30.Çiçek Ö, Abdulkadir A, Lienkamp SS, Brox T & Ronneberger O In MICCAI 2016. Lecture Notes in Computer Science Vol. 9901 (eds Ourselin S et al.) (Springer, 2016). [Google Scholar]
- 31.Welch G & Bishop G An introduction to the Kalman Filter. In Pract. (2006). [Google Scholar]
- 32.Hao Y et al. Integrated analysis of multimodal single-cell data. Cell 184, 3573–3587.e29 (2021). [DOI] [PMC free article] [PubMed] [Google Scholar]
- 33.Venables WN & Ripley BD Modern Applied Statistics with S 4th edn (Springer, 2002). [Google Scholar]
- 34.Bates D, Mächler M, Bolker BM & Walker SC Fitting linear mixed-effects models using lme4. J. Stat. Softw. 67, 1–48 (2015). [Google Scholar]
- 35.Lloyd SP Least squares quantization in PCM. IEEE Trans. Inf. Theory 28, 129–137 (1982). [Google Scholar]
- 36.Henique C et al. Genetic and pharmacological inhibition of microRNA-92a maintains podocyte cell cycle quiescence and limits crescentic glomerulonephritis. Nat. Commun. 8, 1829 (2017). [DOI] [PMC free article] [PubMed] [Google Scholar]
Associated Data
This section collects any data citations, data availability statements, or supplementary materials included in this article.
Supplementary Materials
Data Availability Statement
All data and materials used in the study are available to any researcher for purposes of reproducing or extending these analyses. Source data are provided with this paper.


