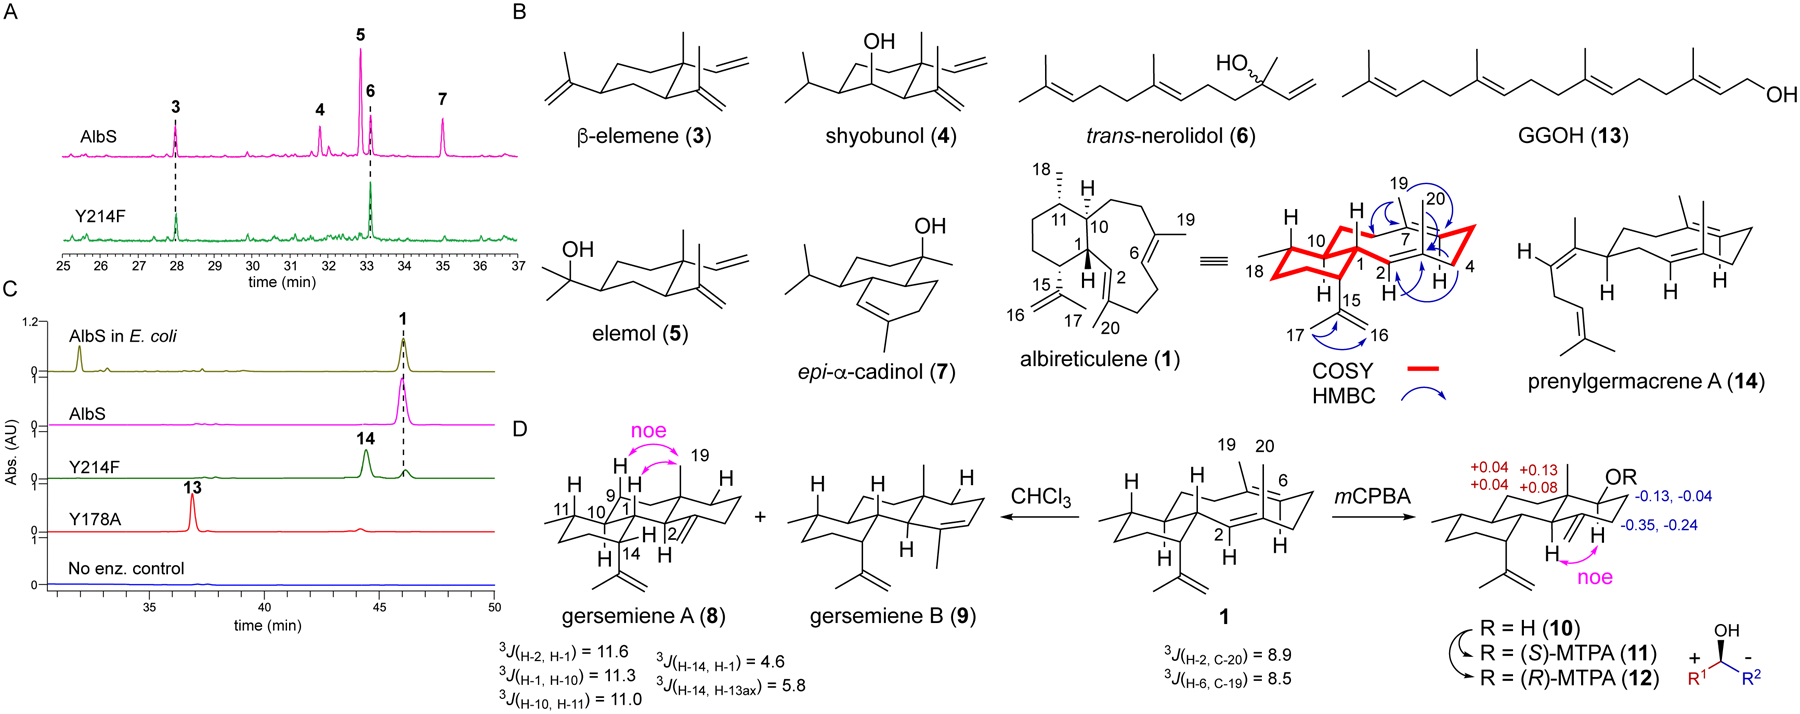
Figure 3. Enzymatic activity of AlbS and structurally determined sesquiterpene and diterpene products.

(A) GC-MS analysis of AlbS and AlbSY214F reactions with FPP. The y-axis is the relative abundance of total ions.
(B) Enzymatic products identified in this study. See also Figs. S4–S22 and S62–S69. Only key 2D NMR correlations are shown for 1. See also Table S4.
(C) HPLC-UV analysis of AlbS and mutant reactions with GGPP; 1 was also produced in vivo in albS-expressing E. coli. Absorbance was detected at 210 nm. See also Fig. S61.
(D) Structural elucidation of 1, 8, 9, and 10 using NMR spectroscopy, chemical degradation, and Mosher’s analysis. See also Figs. S23–S60.
