Abstract
In sumo wrestling, a traditional sport in Japan, many wrestlers suffer from injuries through bouts. In 2019, an average of 5.2 out of 42 wrestlers in the top division of professional sumo wrestling were absent in each grand sumo tournament due to injury. As the number of injury occurrences increases, professional sumo wrestling becomes less interesting for sumo fans, requiring systems to prevent future occurrences. Statistical injury prediction is a useful way to communicate the risk of injuries for wrestlers and their coaches. However, the existing statistical methods of injury prediction are not always accurate because they do not consider the long-term effects of injuries. Here, we propose a statistical model of injury occurrences for sumo wrestlers. The proposed model provides the estimated probability of the next potential injury occurrence for a wrestler. In addition, it can support making a risk-based injury prevention scenario for wrestlers. While a previous study modeled injury occurrences by using the Poisson process, we model it by using the Hawkes process to consider the long-term effect of injuries. The proposed model can also be applied to injury prediction for athletes of other sports.
Introduction
Sumo, a traditional sport dating back about 1500 years in Japan, is a form of competitive full-contact wrestling where two wrestlers fight in a ring [1, 2]. Since 1958, six grand tournaments of professional sumo wrestling that consists of six divisions have been held per year. Each tournament runs for 15 days, and each wrestler in the top two divisions has one match per day while the lower-ranked wrestlers compete in seven bouts about once every two days [3]. There were over 600 wrestlers from the bottom to top divisions in 2022, and the capacities of the top and second from top divisions were 42 and 28, respectively. Regarding worldwide interest in sumo, today, there are national clubs of amateur sumo wrestling in over 84 countries [4]. Member countries of the International Sumo Federation host an international World Sumo Championship each year. For various interesting papers on sumo, see e.g., [3, 5–7].
Injuries commonly occur in most professional sumo wrestlers and negatively affect their performance. The average weight of wrestlers is over 160 kg, so the physical load yielded in a bout frequently causes severe injury [8]. In particular, an anterior cruciate ligament (ACL) injury [9] is a common traumatic injury in professional wrestlers [7]. Wrestlers have a higher risk of second injuries after ACL reconstruction than athletes of other sports [7]. Consequently, wrestlers are sometimes required to be absent from grand sumo tournaments to heal severe injuries.
Kyujo is a state in which a sumo wrestler is absent from a bout in a grand sumo tournament due to injury or illness [2]. A kyujo occurrence is officially recorded for each wrestler, bout and tournament [2]. For example, in 2019, an average of 5.2 out of 42 sumo wrestlers in the top division were kyujo in each grand sumo tournament due to injury [10]. Because the kyujo for a bout is regarded as a loss, wrestlers tend not to be kyujo to maintain their rank score even if they have injuries in general. Consequently, wrestlers tend to have a serious injury when they are kyujo. In addition, as the number of kyujo occurrences of wrestlers increases, professional sumo wrestling becomes less interesting for sumo fans, requiring systems to prevent future occurrences. To prevent injuries, wrestlers and their coaches need to be better informed about the risk of injuries; however, such an indicator is unavailable.
Injury prediction [11, 12], which is used to predict potential injuries in the future, is a useful way to communicate the risk of injuries for athletes. It has been a challenging research topic in sports analytics owing to the practical use of big data such as activities and health conditions of athletes [13, 14]. Forecasting/identifying athletes who are prone to injury is useful and practical from both financial and health aspects, which is why the use of artificial intelligence (AI) knowledge has become increasingly popular in studies on sport-related injuries. Therefore, many existing studies developed injury prediction methods using risk factors that can be divided into modifiable and non-modifiable factors [9, 11]. Non-modifiable factors are those that cannot be altered by any means, such as age, gender, and previous injury history [15]. Modifiable factors are those that are potentially modifiable through physical training or behavioral approaches, such as body mass, muscle strength, and flexibility.
Related works of injury prediction have mainly used machine learning with risk factors. Hulin et al. [16] found that the acute:chronic workload ratio predicts injuries in elite rugby league players. Gabbett [17] modeled relationships between the training load and likelihood of injury to predict injuries in elite collision sport athletes. Rossi et al. [18] proposed an injury prediction method for professional soccer players by using GPS data and a machine learning technique. Rommers et al. [19] presented a machine learning model to predict injuries in elite-level youth football players with reasonable accuracy. However, injury prediction based on machine learning is not applicable for sumo wrestlers at the current stage because there is insufficient data except for kyujo records to build machine learning models in sumo wrestling.
Historical data of injury occurrences still provide important information for injury prediction [20, 21]. Such data can be modeled by stochastic processes (e.g., Poisson process), which enable us to simulate how injuries occur as a consequence of fatigue, previous trauma, lack of physical preparation, and bad luck. For example, [21] developed a Poisson process model of injury prediction for schoolboy rugby. The model provides the average probability of an injury occurrence. However, it is only applicable under the condition that all injuries occur independently because of its memoryless property [21, 22]. In other words, it cannot consider the long-term effects of injuries. Therefore, the Poisson process model is unsuitable for injury prediction in sumo wrestlers who are prone to re-injury due to previous injuries. For more accurate injury prediction, we should consider the long-term effect of injuries in the statistical model.
Thus, we propose a new statistical model of injury prediction for professional sumo wrestlers by considering the long-term effect of injuries. Recurrent events like injury occurrences are commonly observed in clinical studies [23, 24]. While previous research represented injury occurrences by using the Poisson process model, we describe it by using the Hawkes process model [22, 25]. The Hawkes process is a statistical model that is frequently used in risk analysis of finance [26, 27], epidemiology [28, 29], and seismology [30, 31]. It can express that past events can increase the likelihood of future events occurring. For example, in seismology, the Hawkes process well predicts times of the subsequent earthquake occurrences by considering the effect of aftershocks. In the same way, we use the Hawkes process to consider the long-term effect of injuries.
By using the proposed model, we perform injury prediction for sumo wrestlers by predicting potential kyujo occurrences in the future. The proposed model provides (i) the estimated probability of a kyujo occurrence for each wrestler and (ii) the predicted number of kyujo wrestlers due to injury in a grand sumo tournament. In addition, the estimated probability of a kyujo occurrence can be used to make a risk-based injury prevention scenario for wrestlers. Such a means of risk-based scenario planning is unique and beneficial for wrestlers and their coaches. Moreover, because the proposed model uses only time and injury history data, one can apply the proposed model to other sports.
The novelty of this paper is that this is the first application of the Hawkes process to an injury prediction model. The proposed model using the Hawkes process can consider the long-term effect of injuries while previous models using the Poisson process model cannot. Therefore, the proposed model is suitable for injury prediction of athletes who are frequently injured like professional sumo wrestlers.
Materials and methods
In this section, we first illustrate the characteristic properties of kyujo occurrences of professional sumo wrestlers. We then construct an injury prediction model for wrestlers based on the features. For the purpose of this study, we define an injury as a cause of kyujo. Thus, in injury prediction, we ignore relatively minor injuries that do not make wrestlers kyujo.
Injury data collection
To construct an injury prediction model for sumo wrestlers, we analyze kyujo occurrences. For this analysis, we refer to an open database [10] that consists of player hours at kyujo occurrences for each wrestler where player hours (unit: 1,000 bouts) are the sum of the number of wins, losses, and kyujo occurrences at a given period. We extracted two data sets from this open database as Data-A and Data-B.
Data-A, which includes a total of n = 209 sumo wrestlers who played their first match between 1973 and 2003 and belonged to the top divisions more than once, is used for estimating the parameters of the proposed model. Note that Data-A does not include data about wrestlers who had been dismissed once and reinstated afterward. Data-B, which includes all wrestlers who belonged to the top division in the grand sumo tournament of November 2020, is used for an illustrative example of the proposed injury prediction. To simplify the analysis in the next section, we regard consecutive kyujo occurrences as one kyujo occurrence.
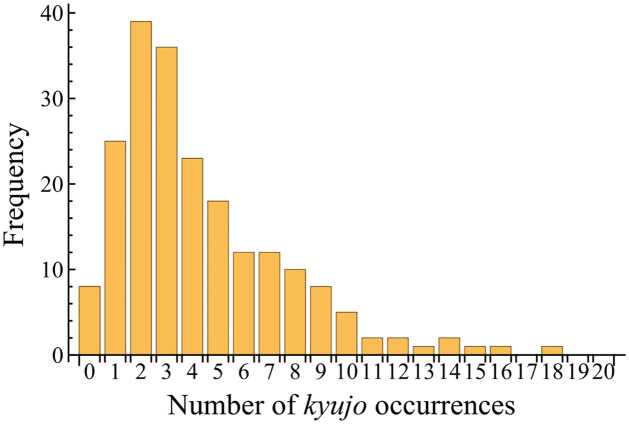
The kyujo data are partially subjected to informative censoring [32] which is also called dependent censoring [33]. That is, while sumo wrestlers likely end their careers for various reasons, the injuries leading to kyujo, repeated kyujo, or long player hours are likely the proximal cause in many cases. This type of censoring may have a negative effect on the results of the injury prediction. However, it is reasonable that with multiple events per player, the effects might be minimal. The histogram of the number of kyujo occurrences is shown in Fig 1, where 88% of wrestlers had one or more kyujo occurrences until they retired. In addition, a retirement and kyujo can be considered the same because wrestlers should be absent from a bout in both situations. Therefore, we assume that a retirement can be regarded as a kyujo occurrence. We will discuss that this assumption does not affect the performance of the injury prediction in the subsection on model validation.
Fig 1. Histogram of the number of kyujo occurrences.
Feature extraction
As useful information for modeling, we present the characteristic properties of kyujo occurrences of professional sumo wrestlers.
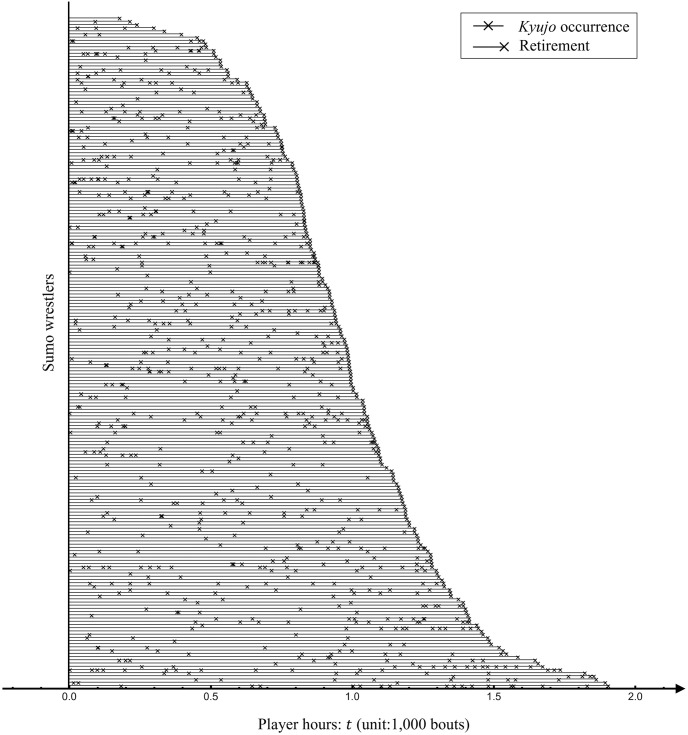
Fig 2 illustrates kyujo occurrences for player hours of each sumo wrestler in Data-A. In this figure, we can observe a feature that many kyujo occurrences happen sequentially. This fact indicates that wrestlers are likely to be kyujo again after one due to long-term effects of past injuries. In fact, occurrences of ipsilateral reinjury and contralateral ACL injury after ACL reconstruction in professional sumo wrestlers are relatively higher than those reported in previous studies on athletes in other sports [7].
Fig 2. Structure of kyujo occurrences of 209 professional sumo wrestlers in Data-A.
Each line represents data of a wrestler. t = 0 means the first bout of each wrestler. Wrestlers are sorted in ascending order of player hours at their retirement.
Another feature of kyujo occurrences of sumo wrestlers can be found through the failure rate (see [34, 35] for details of the failure rate). For given player hours t (> 0), we define the failure rate r(t) for a kyujo occurrence as follows.
| (1) |
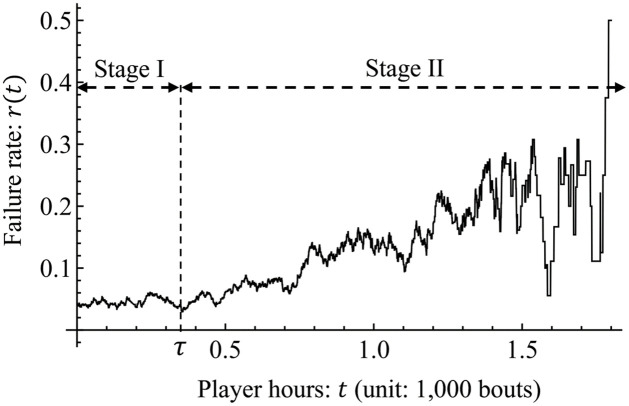
where dt > 0. Thus, the failure rate r(t) express the probability that wrestles becomes kyujo in the interval t to t + dt. Fig 3 represents the behavior of r(t) for the sumo wrestlers. In this observation, the failure rate has two distinct stages, namely Stages I and II. In Stage I, the failure rate is at a low and stable level until the average player hours of the first kyujo occurrence (i.e., for [0, τ = 0.342)). After τ, the failure rate increases as t increases in Stage II. The features of the failure rate in Stages I and II are known as the random failure period and wear-out failure period of products in reliability engineering [36], respectively.
Fig 3. Behavior of the failure rate r(t) for dt = 0.05, where τ = 0.342 is the average player hours of the first kyujo occurrence in Data-A.
Thus, the properties of kyujo occurrences are summarized as (i) a kyujo tends to occur successively, (ii) the failure rate is stable until the average player hours of the first kyujo occurrences, and (iii) the failure rate increases as player hours increase after the first kyujo occurrence. These properties must be considered in injury prediction models to ensure accurate prediction.
Statistical modeling
In this section, we first briefly introduce the Poisson process model. We then propose a statistical model of kyujo occurrences for sumo wrestlers based on the features of the data we discussed. The models require player hours at the kyujo occurrences for each wrestler. Let Tij be the random variable that represents the player hours at the j-th kyujo occurrence of the i-th sumo wrestler for i = 1, 2, …, n and j = 1, 2, …. Suppose Tij’s are characterized by an intensity function [22] that is the instantaneous likelihood of a kyujo occurrence at player hours t. The intensity function is usually used to analyze failure event data (see e.g., [37, 38]).
The models also require the following assumptions.
Assumption 1: All kyujo occurrences of sumo wrestlers follow an independent and identical stochastic process.
Assumption 2: Kyujo periods are shorter than play periods and can be ignored.
If Tij obeys a homogeneous Poisson process (HPP), the intensity function of the process, denoted by λ(t), is determined by a constant value as λ(t) = λ0 for λ0 > 0. Namely, the HPP model assumes that the likelihoods of kyujo occurrences are homogeneous and independent of previous kyujo occurrences. The HPP model is simple and suitable to predict injury occurrences if Tij’s are statistically independent for j = 1, 2, …. However, this model cannot consider the heterogeneous behavior of the intensity function as the failure rate in Stage II because of the memoryless property of the Poisson process.
Now, we propose an injury prediction model using a Hawkes process [22, 25, 39] to capture the behavior of the failure rate in Stages I and II. The proposed model assumes that Tij follows a Hawkes process determined by the following intensity function λ(t|Ht).
| (2) |
where i = 1, 2, …, n, j = 1, 2, …, λ0, a, b, α, β > 0, and Ht = {Tij|Tij < t} is the history of the point process on [0, t), i.e., the set of all kyujo occurrences on [0, t). This assumption represents that the likelihoods of kyujo occurrences are dependent on all previous kyujo occurrences for each sumo wrestler. Eq (2) is divided by cases to describe the behavior of the failure rate in Stages I and II. For t ≤ Ti1, Eq (2) represents the stable behavior of the failure rate in Stage I, and the expected value of Ti1 is given by 1/λ0. As for t > Ti1, Eq (2) describes the increasing behavior of the failure rate in Stage II. Specifically, its second factor means that wrestlers are more likely to be injured as player hours increase, and the third one expresses the positive effect of the long-term effect of all past kyujo occurrences on the current value of the intensity. The player hours Ti1 is the change point of the intensity [40]. The proposed model generalizes the Poisson process model [21] because Eq (2) corresponds to the intensity function of the Poisson process if a = α = 0. The model parameters should be statistically estimated from actual data. We describe an estimation method for the parameters in the next subsection.
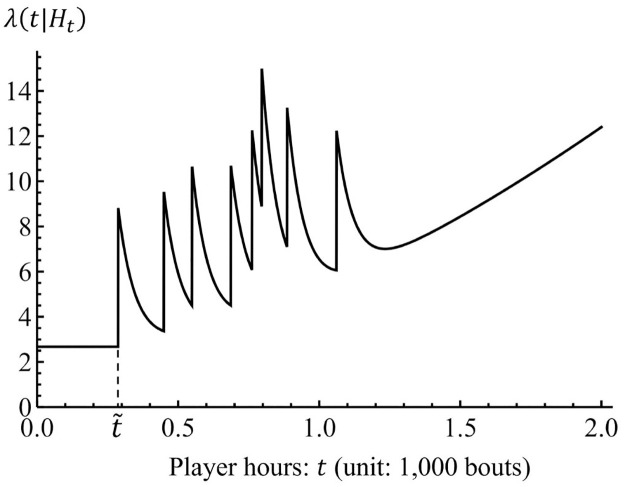
Fig 4 represents an example of the behavior of the proposed model for b > 1. The intensity is constant until the player hours of the first kyujo occurrence from t = 0 and jumps by a value of α. After the jump at , the intensity exponentially decays until the player hours of the next kyujo occurrence, and the jump and decay repeat again and again. If the kyujo event does not occur, the intensity polynomially increases as shown after t = 1.2. Hence, the proposed model captures the features of kyujo occurrences.
Fig 4. Illustration of the proposed model (b > 1).
The probability of a kyujo occurrence of a sumo wrestler in the future can be calculated by Eq (2). Let pij(w|t) be the probability of the j-th kyujo occurrence of the i-th wrestler within player hours w (> 0) under the condition that his player hours are t. Then, pij(w|t) is given by
| (3) |
In Eq (3), the injury probability of a sumo wrestler does not depend on the player hours t if he has never had a kyujo. Otherwise, the probability depends on w, t, and Ht.
The probability pij(w|t) is a useful criterion for each sumo wrestler to understand his injury risk at given player hours. For example, pij(0.015|t) expresses the probability of the next kyujo occurrence in a grand sumo tournament (N.B. the period of a tournament corresponds to 0.015 player hours). Hence, one can estimate probabilities that wrestlers will be injured in a tournament by using the data that can be obtained before the tournament starts.
By using pij(w|t), we can also predict the number of kyujo sumo wrestlers due to injury in the top division of a grand sumo tournament to where 42 wrestlers belong. Such a number is helpful for their coaches to understand an overview of wrestlers’ injury risks. Let X be a random variable that represents the number of kyujo wrestlers and qx ≡ Pr[X = x] be the probability mass function of X for x = 0, 1, 2, …, 42. Let ti be the player hours of the i-th wrestler at the first bout in a given tournament. Suppose that each wrestler will be kyujo with the probability of pij(w|ti). Then, X follows a Poisson binomial distribution [41], and qx is given by
| (4) |
where I = {1, 2, …, 42} and Sx are all subsets of x integers that can be selected from I. In addition, the expectation and variance of X are respectively as follows.
We can summarize injury risks of sumo wrestlers in a division of a grand sumo tournament by qx, E[X], and V[X].
Method of maximum likelihood
In this subsection, we explain the method of maximum likelihood to estimate parameters of a Hawkes process model λ(t|Ht), i.e., λ0, a, b, α, and β.
Let νi be the total number of kyujo occurrences of the i-th sumo wrestler until his retirement. Then, the log-likelihood function of a Hawkes process with the intensity λ(t|Ht), denoted by , is given by
| (5) |
According to Ogata [39], we obtain the following recursive formula of Eq (5).
| (6) |
where
By maximizing Eq (6), one can obtain , and as the maximum likelihood estimates of model parameters λ0, a, b, α, and β.
We note that the censoring of kyujo occurrences can be ignored in this estimation process because we assumed that retirements are the same as kyujo occurrences in the subsection on injury data collection. As a remark, one may use the inverse probability of censoring weights (IPCW) method [32] or copula-based approaches [33] to handle censoring. One relatively simple way to assess estimation performance for these methods is to set up simulation studies that implement the informative censoring.
Results and discussion
In this section, we first start with model validation by estimating the parameters of the proposed model with Data-A. We then present illustrative examples of injury prediction for professional sumo wrestlers with Data-B. Fig 5 visualizes the overall structure of the model validation and injury prediction processes. In this figure, boxes represent processes, and arrows represent the input and output of the corresponding processes.
Fig 5. Overall structure of model validation and injury prediction processes.
Parameter estimation
To model the injury occurrence of professional sumo wrestlers, we estimate the parameters of Eq (2) from Data-A by the method of maximum likelihood [39, 42]. The parameters can be estimated by maximizing the log-likelihood function given by Eq (6). Let , and be the estimates of λ0, a, b, α, and β, respectively. Let , , and be the estimates of λ(t|Ht), pij(w|t), and qx in which parameters λ0, a, b, α, and β are replaced by their estimates, respectively.
To select the best model, we use the Akaike information criterion (AIC) defined by , where k is the number of model parameters, and L is the maximized log-likelihood value. The first term of AIC acts as a penalty term to penalize models having many parameters. The second term acts as a measure of fitting to the data with smaller values to be preferred. Therefore, a smaller value of AIC gives a better fit.
Table 1 shows the estimation results. This table summarizes estimates, standard errors calculated by the Hessian matrix of the log-likelihood function [43], and AIC. All estimates are significant at the 5% level on the basis of the Wald test with the null hypothesis that each parameter corresponds to 0. In addition, we can see that the proposed model fits Data-A better than the simple Poisson process model because it leads to a smaller AIC value. According to a heuristic rule (p. 70 of [44]; see also [45]), which is useful for nested models, if a model has more than 10 AIC units lower than another, then it is considered significantly better than that model. In Table 1, as the AIC for the proposed model satisfies the rule (i.e., −1058.03 − (−1267.93)>10), it is a good choice over the Poisson process model.
Table 1. Estimation results of parameters and AIC for each model.
| Model | AIC | |||||
|---|---|---|---|---|---|---|
| Poisson process | 4.671* | – | – | – | – | −1058.03 |
| (0.149) | ||||||
| Proposed | 2.685* | 1.399* | 2.689* | 2.866* | 7.626* | −1267.93 |
| (0.170) | (0.298) | (0.300) | (0.630) | (2.663) |
Standard errors are given in parentheses.
* symbol denotes that a parameter is significant at the 5% level on the basis of the Wald test.
The estimation result of the proposed model is . Because , the expected player hours to the first kyujo occurrence is , and (N.B. 0.015 corresponds to the period of a tournament). This result indicates that an average professional sumo wrestler experiences their first kyujo occurrence within 0.372 player hours from the first bout in the proposed model. We can also see that each wrestler has a probability of 0.632 for the first kyujo occurrence until 0.372 player hours. This is obtained by the following calculation.
In other words, this expresses that, on average, each of about 132 wrestlers out of 209 (132 ≈ 0.632 × 209) has a risk of encountering their first kyujo occurrence by 372 bouts from their first bouts. After the first kyujo occurrence, wrestlers enter Stage II (see Fig 3). In particular, means that wrestlers have a wear-out failure period [34], and indicates that the long-term effect of injuries exists for them.
Model validation
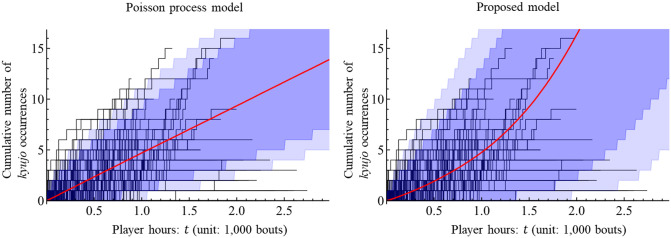
We validate the estimation result. By simulating [39] the Poisson process and Hawkes process with the estimated intensity function , we obtain the average number of kyujo occurrences of a sumo wrestler and its confidence interval [46] with respect to player hours. The 100(1 − c)% confidence interval with a significance level of c is computed by the percentiles of c/2 and 1 − c/2 of simulation results. Fig 6 illustrates the simulation results of the Poisson process model and the proposed model with the historical result given by Data-A. For example, it can be seen that the average number of kyujo occurrences of the wrestler is 4.8 for t = 1.0 in the proposed model. Fig 6 indicates that the pointwise 99% confidence interval of the proposed model is wider than that of the Poisson process model and covers most of the historical data.
Fig 6. Behavior of the estimated models on the actual numbers of kyujo occurrences of sumo wrestlers.
Each black line represents the actual cumulative numbers of kyujo occurrences of 209 wrestlers in Data-A. The red line is the average cumulative number of kyujo occurrences of the wrestler by Monte Carlo simulation of 10,000 iterations. The light and dark shaded areas are the pointwise 99% and 95% confidence intervals of the average cumulative number, respectively.
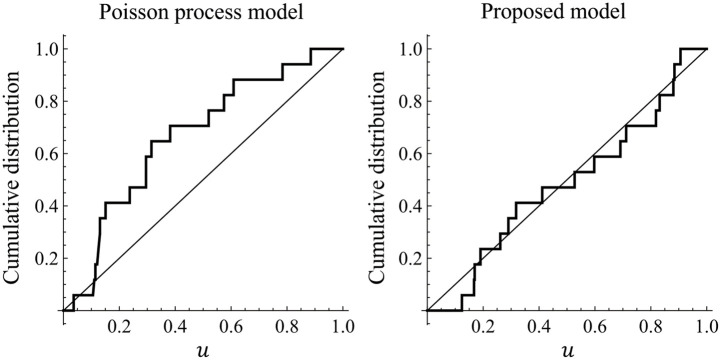
Next, we compare the residuals [30] of these prediction models for a more detailed comparison of the goodness of fit to Data-A. We investigate whether the estimated models can reproduce the major features of the given data. For i = 1, 2, …, n, let be a realization from a point process with a conditional intensity function λ(t|Ht). For any consecutive events tij−1 and tij, consider the integral of λ(t|Ht) as
By the random time change, we define as
Here, it is well known that the duration times τij − τij−1 = Λ(tij−1, tij) obey the exponential distribution with mean 1. This sequence data are called residuals [30]. Moreover, for j = 1, 2, …, νi are i.i.d. uniform random variables on [0, 1]. If the estimated intensity is a good approximation to the true λ(t|Ht), the transformed data are expected to follow the uniform distribution on [0, 1]. Fig 7, which is known as u-plot [47], shows the empirical distributions of data for a sumo wrestler in Data-A transformed by the Poisson process model and proposed model, respectively. The Kolmogorov-Smirnov goodness-of-fit test is a useful way to judge whether the residuals follow the uniform distribution. The residual given by the Poisson process model is not statistically significant at the 5% level, while that given by the proposed model is statistically significant. We performed the same procedure for all 209 wrestlers in Data-A. As a result, residuals of 31 wrestlers are not statistically significant at the 5% level for the Poisson process model, and those of 8 wrestlers are not statistically significant for the proposed model. That is, the proposed model fits Data-A better than the Poisson process model. Therefore, we only consider the proposed model for the injury prediction of wrestlers hereafter.
Fig 7. Empirical distributions of data for a sumo wrestler in Data-A transformed by the Poisson process model and proposed model, respectively.
Diagonal lines are the cumulative distribution function of the uniform distribution on [0, 1].
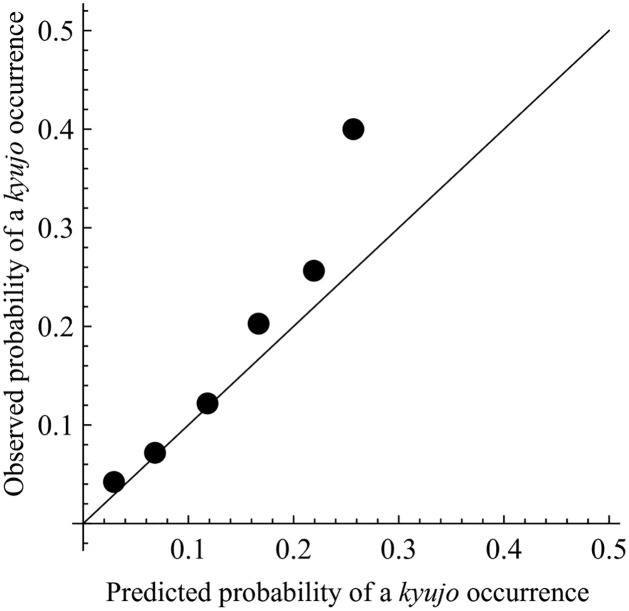
Finally, we perform calibration [48] of the proposed model to assess its predictive power and goodness of fit to Data-A. Calibration is to check the degree of approximation of the predicted probabilities to the actual probabilities. The procedure of the calibration is in the following steps.
Calculate the estimated probability of kyujo occurrences for all sumo wrestlers in Data-A at each grand sumo tournament from the first bout to retirement. Note that the probability is given by pij(0.015|t) for the wrestlers in the two top divisions or pij(0.007|t) for those in the lower-ranked divisions.
Divide the range [0,0.3] into a series of intervals with increments of 0.05, and group the estimated probabilities into each interval. Then, calculate the average of the probabilities for each interval as the predicted probability of a kyujo occurrence.
For each interval, calculate the number of actual kyujo occurrences divided by the sample size as the observed probability of a kyujo occurrence.
Draw a scatter plot with the predicted probability versus the observed one.
Fig 8 illustrates the calibration plot for all wrestlers in Data-A. Sample sizes for the probabilities in the intervals of [0, 0.05], [0.05, 0.1], [0.1, 0.15], [0.15, 0.2], [0.2, 0.25], and [0.25, 0.3] are 9438, 7075, 1485, 217, 39, and 5, respectively. We can see that the proposed model well predicts the actual kyujo occurrences on average because the points are plotted on the diagonal line. The point for the probability in the interval of [0.25, 0.3] is farthest away from the diagonal due to the small sample size, which indicates that the proposed model underestimates the predicted probability of a kyujo occurrence.
Fig 8. Calibration plot for the proposed model.
To summarize model validation results, the proposed model fits Data-A better than the Poisson process model and is well-calibrated. Therefore, we use the proposed model as a validated injury prediction model in the next subsection. In addition, these results indicate that the assumption in which a retirement can be regarded as a kyujo occurrence does not affect the performance of the injury prediction.
Illustrative example of injury prediction
Now, we demonstrate injury prediction for sumo wrestlers on the basis of the previous estimation result and model validation. As an illustrative example, we perform injury prediction for all wrestlers in Data-B. In the prediction process, we use the proposed model with the estimated parameters. Input data for the model are current player hours ti and player hours at the j-th kyujo occurrence of the i-th sumo wrestler for i = 1, 2, …, 42 and j = 1, 2, …, and output data are , i.e., the estimated probability of the next kyujo occurrence for the i-th wrestler. Table 2 shows the names and ID numbers of wrestlers included in Data-B. Note that five wrestlers (ID = 1, 2, 4, 5, 39) actually became kyujo due to injuries in the top division of the tournament.
Table 2. IDs and names of all sumo wrestlers in the top division of the grand sumo tournament of November 2020.
| ID | Name | ID | Name | ID | Name |
|---|---|---|---|---|---|
| 1 | Hakuho | 15 | Okinoumi | 29 | Meisei |
| 2 | Kakuryu | 16 | Hokutofuji | 30 | Sadanoumi |
| 3 | Takakeisho | 17 | Tobizaru | 31 | Enho |
| 4 | Asanoyama | 18 | Myogiryu | 32 | Yutakayama |
| 5 | Shodai | 19 | Kotoshoho | 33 | Kaisei |
| 6 | Mitakeumi | 20 | Takarafuji | 34 | Hoshoryu |
| 7 | Takanosho | 21 | Tamawashi | 35 | Ichinojo |
| 8 | Terunofuji | 22 | Tochinoshin | 36 | Chiyonokuni |
| 9 | Takayasu | 23 | Endo | 37 | Kotonowaka |
| 10 | Kiribayama | 24 | Aoiyama | 38 | Chiyotairyu |
| 11 | Wakatakakage | 25 | Terutsuyoshi | 39 | Kotoyuki |
| 12 | Onosho | 26 | Tokushoryu | 40 | Chiyoshoma |
| 13 | Daieisho | 27 | Kotoeko | 41 | Akua |
| 14 | Kagayaki | 28 | Ryuden | 42 | Shimanoumi |
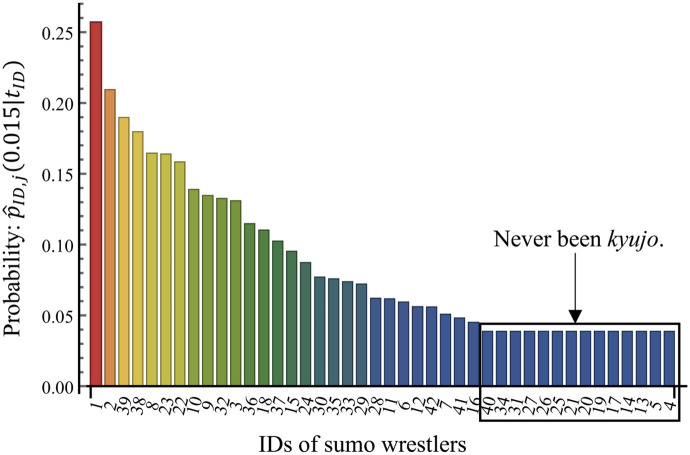
Fig 9 represents the estimated probability of the next kyujo occurrence for each sumo wrestler, that is, how likely a wrestler will be injured compared with other wrestlers in the grand sumo tournament. This result contributes to understanding their injury risk. The estimated probability is different for each wrestler. Hakuho (ID = 1 and j = 15) has the highest probability of 25.1% among the 42 wrestlers. Kakuryu (ID = 2 and j = 13) and Tochinoshin (ID = 22 and j = 8) have the second and third highest probabilities of 20.8% and 16.7%, respectively. In addition, 12 wrestlers have the same probability of 3.95% because they have never been kyujo. Tamawashi (ID = 21 and j = 1) has the largest player hours (1.286) among these 12 wrestlers. This means that Tamawashi has never been kyujo with a probability of .
Fig 9. Estimated probability of kyujo occurrences for 42 professional sumo wrestlers who belong to the top division in the grand sumo tournament of November 2020.
ID and names of wrestlers are shown in Table 2.
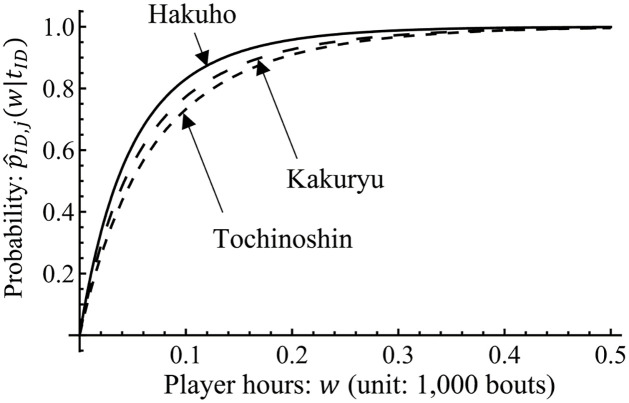
Fig 10 depicts the behavior of the cumulative distribution function for Hakuho, Kakuryu, and Tochinoshin. From this figure, we can see that the probability of the next kyujo occurrence within w player hours for a sumo wrestler having tID player hours. For example, Hakuho, Kakuryu, and Tochinoshin will be kyujo with a probability of more than 50% within 0.05 player hours from the first bout in the grand sumo tournament. Because Hakuho has the largest player hours and number of kyujo occurrences among the three, he is most likely to be injured in the future.
Fig 10. Probability of the next kyujo occurrence within player hours w for Hakuho (ID = 1 and j = 15), Kakuryu (ID = 2 and j = 13), and Tochinoshin (ID = 22 and j = 8).
The point of w = 0 corresponds to the first bout in the grand sumo tournament of November 2020.
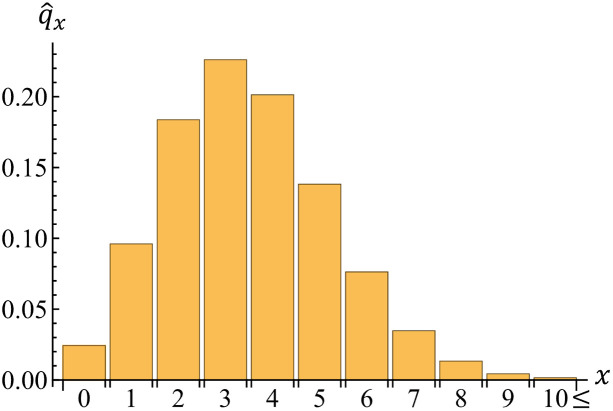
We can also estimate the potential number of kyujo sumo wrestlers X due to injury in the top division of the grand sumo tournament. Fig 11 shows the estimated distribution of X, which summarizes injury risks of wrestlers in the tournament. Such a number is helpful for their coaches to understand an overview of wrestlers’ injury risks. The expectation and standard deviation of X are 3.502 and 1.764, respectively. The 95% confidence interval of X is [1, 7], where its lower and upper bounds are computed by the percentiles of 2.5% and 97.5% of X, respectively. Because is given by Eq (4), we can see that the five wrestlers (ID = 1, 2, 4, 5, 39) actually became kyujo with a probability of 13.8% in this tournament.
Fig 11. Estimated distribution of the number of kyujo sumo wrestlers in the top division of the grand sumo tournament of November 2020.
Injury prevention scenario
We can use the proposed model to make injury prevention scenarios for professional sumo wrestlers. In general, wrestlers could reduce their injury risk through a long period of kyujo for recovery. However, a long period of kyujo leads to their rank score being decreased because a kyujo is regarded as a loss. From the aforementioned reason, wrestlers tend not to be kyujo to maintain their rank score even if they have injuries up to now. Therefore, making a good injury prevention scenario for each wrestler is important so that the wrestler maintains their rank score and prevents potential kyujo occurrences in the future.
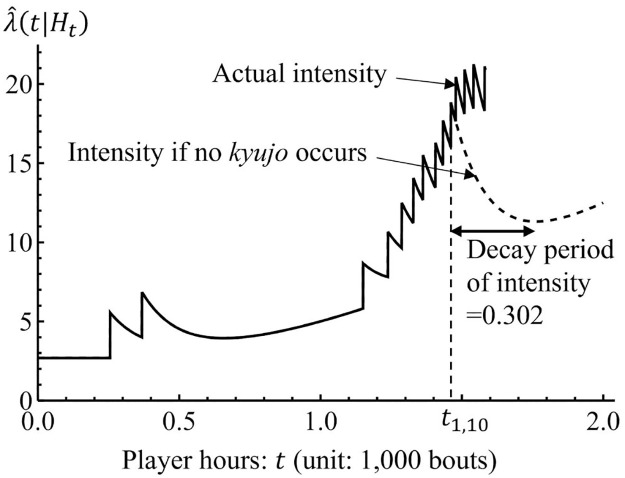
As Fig 4 shows, the intensity function λ(t|Ht) has a decay period after a kyujo occurrence, and takes an increasing period after sufficient player hours with no kyujo occurrence. This means that the probabilities of kyujo occurrences decrease for certain player hours. Therefore, wrestlers should avoid an additional kyujo occurrence during the decay period of the intensity function.
For example, let us consider the case of Hakuho (ID = 1). Hakuho had the 10th kyujo occurrence at the player hours t1,10 = 1.461 and additional four kyujo occurrences between t1,10 and the first day of the grand sumo tournament of November 2020 (t = 1.582) in reality. Fig 12 illustrates the behavior of the intensity function of Hakuho in the estimated proposed model. In this figure, the dashed curve means the intensity function under the assumption that Hakuho does not have kyujo occurrences after t1,10. Now, let us consider the case if Hakuho had consecutive kyujo from t1,10 to heal his injuries. Note that we assumed that consecutive kyujo occurrences were treated as one kyujo occurrence in the subsection on statistical modeling.
Fig 12. Behavior of the intensity function of Hakuho (ID = 1) until the grand sumo tournament of November 2020.
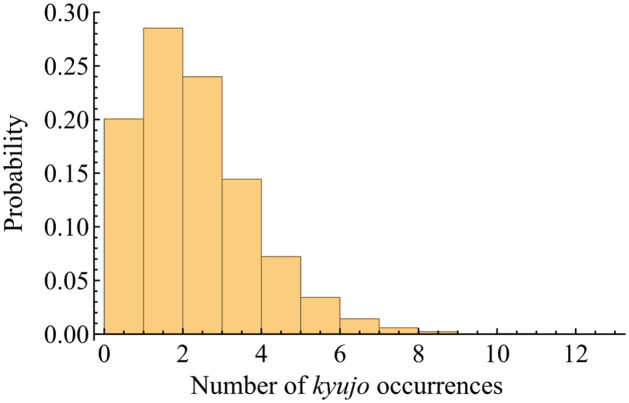
If Hakuho dared to have consecutive kyujo during a grand sumo tournament (i.e., t ∈ [1.461, 1.476 = 1.461+ 0.015]), the predicted distribution of the number of additional kyujo occurrences until t = 1.582 is illustrated by Fig 13 through a Monte Carlo simulation using the proposed model with 10,000 iterations. In the simulation result, Hakuho has 1.813 kyujo occurrences on average until t = 1.582. Thus, Hakuho would avoid 2.227(= 4 − 1.813) potential kyujo occurrences on average by taking the consecutive kyujo after t1,10. Note that the probability that Hakuho has four or more kyujo occurrences is 0.130 in this simulation. If the reduction of potential kyujo occurrences were valuable for Hakuho, he should have planned for the consecutive kyujo.
Fig 13. Hakuho’s predicted distribution of the number of kyujo occurrences for t ∈ [1.461, 1.582] through a Monte Carlo simulation using the proposed model with 10,000 iterations.
N.B. Hakuho had four kyujo occurrences for t ∈ [1.461, 1.582] in reality.
In the same way, we can make injury prevention scenarios for professional sumo wrestlers quantitatively by simulating the proposed model. For example, wrestlers can make a decision whether it is better to be kyujo than to participate in grand sumo tournaments when they have injuries. In addition, they can plan appropriate kyujo periods if they should be kyujo. Such a means of risk-based scenario planning is novel and beneficial for wrestlers and their coaches. In future work, further study is expected from the viewpoint of operations research to optimize decision-making for injury prevention.
Conclusion
In this paper, we have investigated injury prediction for professional sumo wrestlers. Through the feature extraction of actual data, we determined the characteristics of kyujo occurrences and have proposed a statistical model of kyujo occurrences. As a result of the parameter estimation of , we have also found the long-term effect of kyujo occurrences. The proposed model provides the estimated probability of an injury occurrence for a wrestler and the predicted number of kyujo wrestlers due to injury in a grand sumo tournament. The estimated probabilities help communicate the risk of injury to wrestlers.
The proposed model can be also applied to injury prediction for athletes of other sports if the failure rate of the athletes behaves similarly to that of sumo wrestlers. One can estimate the model parameters by only historical count data of injury occurrences. Some modification of the proposed model will be necessary to consider characteristics that are uniquely observed for injury occurrences of athletes. For example, one should add trend terms to Eq (2) if there is a seasonality in injury occurrences. After model validation, injury prediction for athletes is applicable by computing pij(w|t) given w and t.
A limitation of the proposed model based on Data-A is that it would underestimate the risk of relatively minor injuries. Because we only used player hours of prior kyujo occurrences as the input, the proposed model based on Data-A cannot predict acute, short, and moderate injuries. To solve the limitation, we need both kyujo and injury data from daily observations. This should enable us to modify the proposed model by using the new data.
Our ongoing work focuses on studying the effect of individual characteristics, especially modifiable risk factors, such as age, height, and weight on injury risk. By extending the proposed model to consider the characteristics, we can evaluate the relationship between injury occurrences and the characteristics. For example, we can determine how the probabilities of injury occurrences increase/decrease by using the extended model if athletes gain/lose weight. To extend the model, it is expected to consider the concept of survival analysis. In this paper, we modeled kyujo occurrences by the Hawkes process to consider the behavior of intensity changes. This model structure is also handled in survival analysis under the guise of multiple events, although typically without assuming intensity changes as the Hawkes process does. However, one could also implement a time-varying covariate that captured the number of previous kyujo occurrences by using multistate models [49, 50].
Supporting information
(NB)
Data Availability
All data are available from the Sumo reference’s database (URL: http://sumodb.sumogames.de).
Funding Statement
This study was supported by JSPS KAKENHI Grant Numbers 19K04892 and 21K14373 (Funder’s website: https://www.jsps.go.jp/english). The grants’ representatives were MK and SO, respectively. The funder had no role in study design, data collection and analysis, decision to publish, or preparation of the manuscript.
References
- 1. Ito K. The perfect guide to sumo. 2nd ed. Kyoto: Seigensha; 2019. [Google Scholar]
- 2.Nihon Sumo Kyokai (Japan Sumo Association). Nihon Sumo Kyokai [Internet]. 2022 [cited 2022 Aug 1]. Available from: https://www.sumo.or.jp/En
- 3. Duggan M, Levitt SD. Winning isn’t everything: corruption in sumo wrestling. Am Econ Rev. 2002;92(5): 1594–1605. doi: 10.1257/000282802762024665 [DOI] [Google Scholar]
- 4. Zabel T. Sumo skills: instructional guide for competitive sumo. Mico: Ozumo Academy Publishing; 2014. [Google Scholar]
- 5. Dietl HM, Lang M, Werner S. Corruption in professional sumo: an update on the study of Duggan and Levitt. J Sport Econ. 2010;11(4): 383–396. doi: 10.1177/1527002509349028 [DOI] [Google Scholar]
- 6. Tamiya R, Lee SY, Ohtake F. Second to fourth digit ratio and the sporting success of sumo wrestlers. Evol Hum Behav. 2012;33(2): 130–136. doi: 10.1016/j.evolhumbehav.2011.07.003 [DOI] [Google Scholar]
- 7. Shimizu S, Nagase T, Tateishi T, Nakagawa T, Tsuchiya M. Second anterior cruciate ligament injuries after anterior cruciate ligament reconstruction in professional sumo wrestlers: a case series. Orthop J Sports Med. 2020;8(2): 1–5. doi: 10.1177/2325967120903698 [DOI] [PMC free article] [PubMed] [Google Scholar]
- 8. Shimizu S, Nagase T, Tateishi T, Sato T, Nakagawa T, Tsuchiya M. Summary of professional sumo wrestlers’ injuries in Heisei era (in Japanese). Jap J Orthop Sports Med. 2021;41(3): 201–208. doi: 10.34473/jossm.41.3_201 [DOI] [Google Scholar]
- 9. Joyce D, Lewindon D (eds). Sports injury prevention and rehabilitation. New York: Routledge; 2016. [Google Scholar]
- 10.Sumo reference. Sumo reference [Internet]. 2022 [cited 2022 Mar 12]. Available from: http://sumodb.sumogames.de
- 11. Bahr R, Holme I. Risk factors for sports injuries—a methodological approach. Br J Sports Med. 2003;37(5): 384–392. doi: 10.1136/bjsm.37.5.384 [DOI] [PMC free article] [PubMed] [Google Scholar]
- 12. Pfirrmann D, Herbst M, Ingelfinger P, Simon P, Tug S. Analysis of injury incidences in male professional adult and elite youth soccer players: a systematic review. J Athl Train. 2016;51(5): 410–424. doi: 10.4085/1062-6050-51.6.03 [DOI] [PMC free article] [PubMed] [Google Scholar]
- 13. Andrada F. Data scientists are predicting sports injuries with an algorithm. Nature. 2021;592(7852): 10–11. doi: 10.1038/d41586-021-00818-1 [DOI] [PubMed] [Google Scholar]
- 14. Rossi A, Pappalardo L, Cintia P. A narrative review for a machine learning application in sports: an example based on injury forecasting in soccer. Sports. 2021;10(1):5. doi: 10.3390/sports10010005 [DOI] [PMC free article] [PubMed] [Google Scholar]
- 15. Hägglund M, Waldén M, Ekstrand J. Previous injury as a risk factor for injury in elite football: a prospective study over two consecutive seasons. Br J Sports Med. 2006;40(9): 767–772. doi: 10.1136/bjsm.2006.026609 [DOI] [PMC free article] [PubMed] [Google Scholar]
- 16. Hulin BT, Gabbett TJ, Lawson DW, Caputi P, Sampson JA. The acute: chronic workload ratio predicts injury: high chronic workload may decrease injury risk in elite rugby league players. Br J Sports Med. 2016;50(4): 231–236. doi: 10.1136/bjsports-2015-094817 [DOI] [PubMed] [Google Scholar]
- 17. Gabbett TJ. The training—injury prevention paradox: should athletes be training smarter and harder? Br J Sports Med. 2016;50(5): 273–280. doi: 10.1136/bjsports-2015-095788 [DOI] [PMC free article] [PubMed] [Google Scholar]
- 18. Rossi A, Pappalardo L, Cintia P, Iaia FM, Fernández J, Medina D. Effective injury forecasting in soccer with GPS training data and machine learning. PloS ONE. 2018;13(7): e0201264. doi: 10.1371/journal.pone.0201264 [DOI] [PMC free article] [PubMed] [Google Scholar]
- 19. Rommers N, Rössler R, Verhagen E, Vandecasteele F, Verstockt S, Vaeyens R, et al. A machine learning approach to assess injury risk in elite youth football players. Med Sci Sports Exerc. 2020;52(8): 1745–1751. doi: 10.1249/MSS.0000000000002305 [DOI] [PubMed] [Google Scholar]
- 20. Shrier I, Steele RJ, Hanley J, Rich B. Analyses of injury count data: some do’s and don’ts. Am J Epidemiol. 2009;170(10): 1307–1315. doi: 10.1093/aje/kwp265 [DOI] [PubMed] [Google Scholar]
- 21. Parekh N, Hodges SD, Pollock AM, Kirkwood G. Communicating the risk of injury in schoolboy rugby: using Poisson probability as an alternative presentation of the epidemiology. Br J Sports Med. 2012;46(8): 611–613. doi: 10.1136/bjsports-2011-090431 [DOI] [PubMed] [Google Scholar]
- 22. Rizoiu MA, Lee Y, Mishra S, Xie L. Hawkes processes for events in social media. In: Chang SF, ed. Frontiers of Multimedia Research. Association for Computing Machinery and Morgan & Claypool; 2017. pp. 191–218. [Google Scholar]
- 23. Su CL, Lin FC. Analysis of cyclic recurrent event data with multiple event types. Jpn J Stat Data Sci. 2021;4(2): 895–915. doi: 10.1007/s42081-020-00088-7 [DOI] [PMC free article] [PubMed] [Google Scholar]
- 24. Huang XW, Wang W, Emura T. A copula-based Markov chain model for serially dependent event times with a dependent terminal event. Jpn J Stat Data Sci. 2021;4(2): 917–951. doi: 10.1007/s42081-020-00087-8 [DOI] [Google Scholar]
- 25. Hawkes AG. Spectra of some self-exciting and mutually exciting point processes. Biometrika. 1971;58(1): 83–90. doi: 10.1093/biomet/58.1.83 [DOI] [Google Scholar]
- 26. Embrechts P, Liniger T, Lin L. Multivariate Hawkes processes: an application to financial data. J Appl Probab. 2011;48(A): 367–378. doi: 10.1239/jap/1318940477 [DOI] [Google Scholar]
- 27. Hawkes AG. Hawkes processes and their applications to finance: a review. Quant Finance. 2018;18(2): 193–198. doi: 10.1080/14697688.2017.1403131 [DOI] [Google Scholar]
- 28.Rizoiu MA, Mishra S, Kong Q, Carman M, Xie L. SIR-Hawkes: linking epidemic models and Hawkes processes to model diffusions in finite populations. In: Proceedings of the 2018 World Wide Web Conference; 2018 Apr 23-27; Lyon, France. Republic and Canton of Geneva: International World Wide Web Conferences Steering Committee; 2018. pp. 419–428.
- 29. Chiang WH, Liu X, Mohler G. Hawkes process modeling of COVID-19 with mobility leading indicators and spatial covariates. Int J Forecast. 2021;38(2): 505–520. doi: 10.1016/j.ijforecast.2021.07.001 [DOI] [PMC free article] [PubMed] [Google Scholar]
- 30. Ogata Y. Statistical models for earthquake occurrences and residual analysis for point processes. J Am Stat Assoc. 1988;83(401): 9–27. doi: 10.1080/01621459.1988.10478560 [DOI] [Google Scholar]
- 31. Zhuang J. Next-day earthquake forecasts for the Japan region generated by the ETAS model. Earth Planets Space. 2011;63(5): 207–216. doi: 10.5047/eps.2010.12.010 [DOI] [Google Scholar]
- 32. Blanche P, Dartigues JF, Jacqmin-Gadda H. Estimating and comparing time‐dependent areas under receiver operating characteristic curves for censored event times with competing risks. Statistics in medicine, 2013; 32(30): 5381–5397. doi: 10.1002/sim.5958 [DOI] [PubMed] [Google Scholar]
- 33. Emura T, Chen YH. Analysis of survival data with dependent censoring: copula-based approaches. Singapore: Springer; 2018. [Google Scholar]
- 34. Shooman ML. Reliability of computer systems and networks: fault tolerance, analysis, and design. New York: John Wiley & Sons; 2003. [Google Scholar]
- 35. Chiodo E, Lauria D. Some basic properties of the failure rate of redundant reliability systems in industrial electronics applications. IEEE Trans Ind Electron. 2015;62(8): 5055–5062. doi: 10.1109/TIE.2015.2404306 [DOI] [Google Scholar]
- 36. Trivedi KS. Probability & statistics with reliability, queuing and computer science applications. 2nd ed. Hoboken: John Wiley & Sons; 2016. [Google Scholar]
- 37. Ota S, Kimura M. A statistical dependent failure detection method for n-component parallel systems. Reliab Eng Syst Saf. 2017;167: 376–382. doi: 10.1016/j.ress.2017.06.022 [DOI] [Google Scholar]
- 38. Wu S. A failure process model with the exponential smoothing of intensity functions. Eur J Oper Res. 2019;275(2): 502–513. doi: 10.1016/j.ejor.2018.11.045 [DOI] [Google Scholar]
- 39. Ogata Y. On Lewis’ simulation method for point processes. IEEE Trans Inf Theory. 1981;27(1): 23–31. doi: 10.1109/TIT.1981.1056305 [DOI] [Google Scholar]
- 40. Inoue S, Yamada S. Software reliability assessment with multiple changes of testing-environment. IEICE Trans Fundamentals. 2015;E98-A(10): 2031–2041. doi: 10.1587/transfun.E98.A.2031 [DOI] [Google Scholar]
- 41. Chen SX, Liu JS. Statistical applications of the Poisson-binomial and conditional Bernoulli distributions. Stat Sin. 1997;7(4): 875–892. [Google Scholar]
- 42. Lehmann EL, Casella G. Theory of point estimation. 2nd ed. New York: Springer; 1998. [Google Scholar]
- 43. Serfling RJ. Approximation theorems of mathematical statistics. Toronto: John Wiley & Sons; 1980. [Google Scholar]
- 44. Burnham KP, Anderson DR. Model selection and inference: a practical information-theoretical approach. 2nd ed. New York: Springer; 1998. [Google Scholar]
- 45. Burnham KP, Anderson DR. Multimodel inference: understanding AIC and BIC in model selection. Sociol Methods Res. 2004; 33(2): 261–304. doi: 10.1177/0049124104268644 [DOI] [Google Scholar]
- 46. Dohi T, Zheng J, Okamura H. Data-driven software reliability evaluation under incomplete knowledge on fault count distribution. Qual Eng. 2020;32(3): 421–433. doi: 10.1080/08982112.2020.1757705 [DOI] [Google Scholar]
- 47. Abdel-Ghaly AA, Chan PY, Littlewood B. Evaluation of competing software reliability predictions. IEEE Trans Softw Eng. 1986;SE-12(9): 950–967. doi: 10.1109/TSE.1986.6313050 [DOI] [Google Scholar]
- 48. Gerds TA, Kattan MW. Medical risk prediction models: with ties to machine learning. Boca Raton: Chapman and Hall/CRC; 2021. [Google Scholar]
- 49. Therneau TM, Grambsch PM. Modeling survival data: extending the Cox model. New York: Springer; 2000. [Google Scholar]
- 50. Meira-Machado L, de Uña-Álvarez J, Cadarso-Suárez C, Andersen PK. Multi-state models for the analysis of time-to-event data. Stat Methods Med Res. 2009; 18(2): 195–222. doi: 10.1177/0962280208092301 [DOI] [PMC free article] [PubMed] [Google Scholar]


