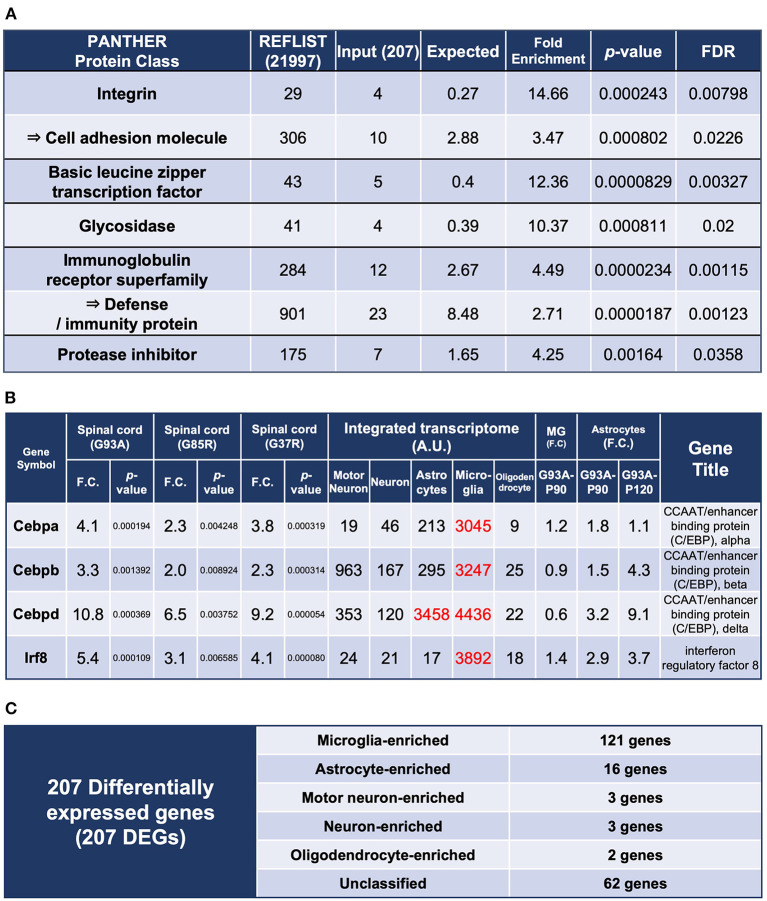
In the published article, there was an error in Figure 2 as published. The fourth column heading in Figure 2B was falsely written as “Spinal cord (G93A).” The correct column heading is “Spinal cord (G37R).” The corrected Figure 2 appears below.
Figure 2.
Enrichment analysis using the 207 DEGs and classification of each of the 207 DEGs by cell types with high expression. (A) Enrichment analysis using the 207 DEGs as an input. The first column shows the name of the PANTHER classification category. The second column shows the number of genes in the reference list that map to this particular PANTHER classification category. The total number of genes in the reference list is 21,997. The third column shows the observed number of genes in our input list that map to this PANTHER classification category. The fourth column shows the expected value, which is the number of genes we would expect in our list for this PANTHER category, based on the reference list. The fifth column shows the fold enrichment, which is the ratio of the value of column 3 (input: observed number) over that of column 4 (expected number). The sixth column shows the raw p-values. The seventh column shows the q-value (adjusted p-value, reflecting the false discovery rate) as calculated by the Benjamini-Hochberg procedure. Cell adhesion molecule is in the parent category of integrin, so it is shown in the row below. Similarly, defense/immunity protein is the parent category of immunoglobulin receptor superfamily. Therefore, they are indicated with arrows. (B) Representative transcription factors in the 207 DEGs. Three CCAAT/enhancer binding proteins and interferon regulatory factor 8 are shown. (C) All of the 207 DEGs were classified into cell types in which each gene is highly expressed; Unclassified are the genes that are not highly expressed in one particular cell type. MG, microglia.
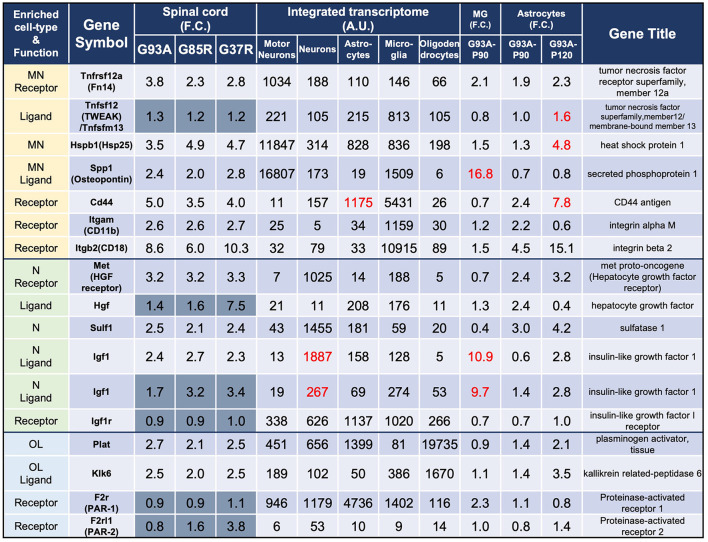
In the published article, there was an error in Figure 3 as published. The Tnfrs12a values shown in Figure 3 are different from the data in 207 DEGs. The corrected Figure 3 appears below.
Figure 3.
Representative motor neuron-enriched genes, neuron-enriched genes, and oligodendrocyte-enriched genes in 207 DEGs were analyzed using the integrated transcriptome and SOD1G93A cell-type transcriptome. The 3rd to 5th columns show the fold changes in each gene expression in SOD1G93A, SOD1G85R, and SOD1G37R mouse spinal cords compared to control samples, respectively. Genes with dark gray backgrounds in the 3rd to 5th columns that indicate fold changes (F.C.) are not included in the 207 DEGs. The 6th to 10th columns show the integrated transcriptome. The 11th column shows the fold change in expression of each gene in P90 SOD1G93A microglia relative to control microglia. The 12th to 13th columns show the fold change in expression of each gene in SOD1G93A astrocytes (P90 or P120) relative to control astrocytes. MN, motor neurons; N, neurons; MG, microglia; OL, oligodendrocytes.
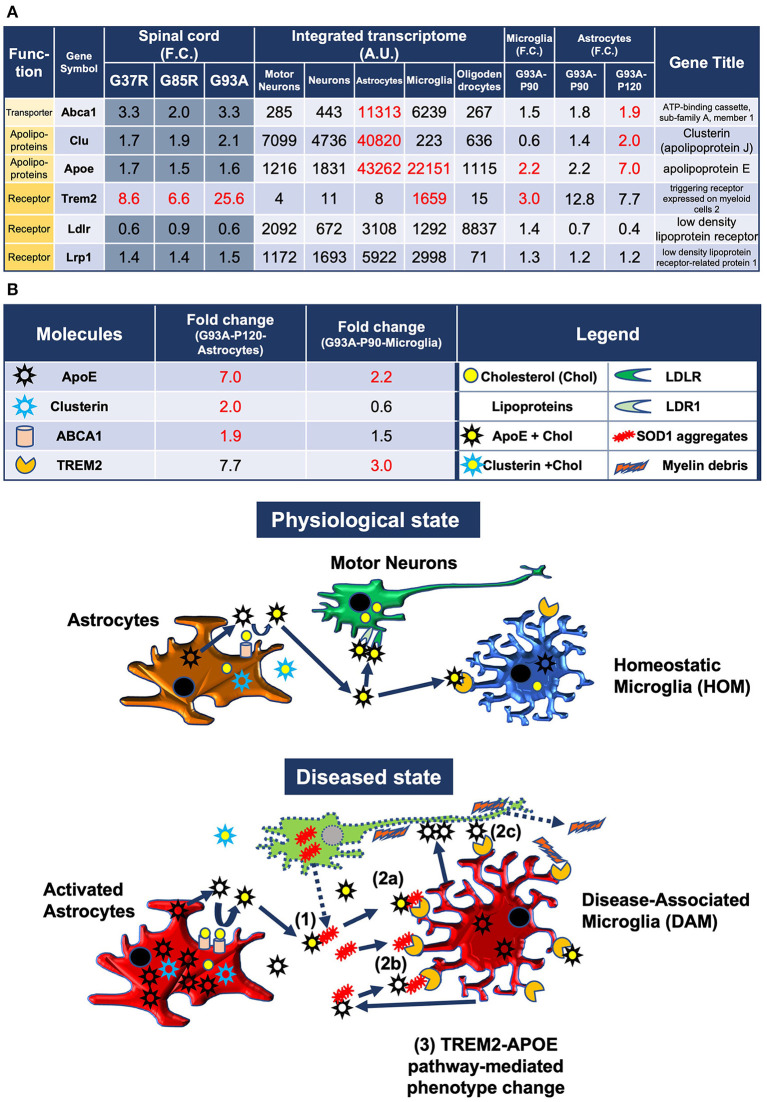
In the published article, there was an error in Figure 5 and text as published. The fold change of Abca1 in the spinal cords of SOD1G85R mice shown in Figure 5 is 2.0, but this is a rounded value, which was 1.9779. Abca1 is not included in Table S5, which shows the list of 207 DEGs with more than strict 2-fold change, although the 1.9779-fold change of SOD1G85R mice is statistically significant as well as the 3.3-fold changes in the spinal cords of SOD1G37R and SOD1G93A mice. The corrected Figure 5 appears below.
Figure 5.
Model of the pathomechanism among different cell types in spinal cords of mutant SOD1 mice related to TREM2, apolipoprotein E, and lipoproteins. (A) Gene expression analysis of the relevant transporter Abca1, apolipoproteins Apoe and Clu, and receptors Trem2, Ldlr, and Lrp1, using integrated and SOD1G93A cell type transcriptomes. (B) Physiological state: cholesterol is transported from astrocytes to motor neurons and microglia via lipoproteins. Diseased state: (1) Mutant SOD1 aggregates are released from diseased motor neurons and bind to lipoproteins in the intercellular space. (2a) Microglia phagocytose SOD1 aggregate-lipoprotein complexes via TREM2. (2b) Microglia phagocytose SOD1 aggregates with or without ApoE via TREM2. (2c) Microglia phagocytose ApoE-bound motor neurons via TREM2. (3) TREM2-mediated phagocytosis changes the phenotype from HOM to DAM in microglia via ApoE signaling. Excessive DAM activation may contribute to exacerbation of ALS pathology.
A correction has been made to Results and discussion, Predicted pathomechanism among different cell types in SOD1-ALS mice related to TREM2, apolipoprotein E, and lipoproteins, Astrocytic changes. This sentence previously stated:
“Abca1 was found in the 207 DEGs and was abundant in astrocytes and upregulated in P120 SOD1G93A astrocytes.”
The corrected sentence appears below:
“Abca1 was abundant in astrocytes and upregulated in P120 SOD1G93A astrocytes.”
In the published article, there was an error in Supplementary Table 5. Fold changes and p-value of three SOD1 mutant mice in Aspg, Casp12, Psmb8, Ctsd, Ctsc, Ctsh, Ctsl, Ctss, and Ctsz (214th to 222nd rows in uncollapsed sheet, columns H to M) were shifted one line by a handling error. The Supplementary Table 5 has been updated.
The authors apologize for this error and state that this does not change the scientific conclusions of the article in any way. The original article has been updated.
Publisher's note
All claims expressed in this article are solely those of the authors and do not necessarily represent those of their affiliated organizations, or those of the publisher, the editors and the reviewers. Any product that may be evaluated in this article, or claim that may be made by its manufacturer, is not guaranteed or endorsed by the publisher.


