Abstract
Ferroptosis is a non-apoptotic cell death mechanism characterized by the generation of lipid peroxides. While many effectors in the ferroptosis pathway have been mapped, its epitranscriptional regulation is not yet fully understood. Ferroptosis can be induced via system xCT inhibition (Class I) or GPX4 inhibition (Class II). Previous works have revealed important differences in cellular response to different ferroptosis inducers. Importantly, blocking mRNA transcription or translation appears to protect cells against Class I ferroptosis inducing agents but not Class II. In this work, we examined the impact of blocking transcription (via Actinomycin D) or translation (via Cycloheximide) on Erastin (Class I) or RSL3 (Class II) induced ferroptosis. Blocking transcription or translation protected cells against Erastin but was detrimental against RSL3. Cycloheximide led to increased levels of GSH alone or when co-treated with Erastin via the activation of the reverse transsulfuration pathway. RNA sequencing analysis revealed early activation of a strong alternative splice program before observed changes in transcription. mRNA stability analysis revealed divergent mRNA stability changes in cellular response to Erastin or RSL3. Importantly, codon optimality biases were drastically different in either condition. Our data also implicated translation repression and rate as an important determinant of the cellular response to ferroptosis inducers. Given that mRNA stability and codon usage can be influenced via the tRNA epitranscriptome, we evaluated the role of a tRNA modifying enzyme in ferroptosis stress response. Alkbh1, a tRNA demethylase, led to translation repression and increased the resistance to Erastin but made cells more sensitive to RSL3.
Keywords: mRNA stability, tRNA modifications, Alkbh1, Ferroptosis, Codon usage, mRNA translation
INTRODUCTION
Ferroptosis is a caspase-independent cell death mechanism that was discovered nearly a decade ago (Dixon et al., 2012). Since its discovery, ferroptosis-mediated cell death has been implicated in many disease mechanisms, such as: cancer, neurodegeneration, and ischemic injuries (Alim et al., 2019; Bao et al., 2021; Jiang et al., 2021). Large strides have been made in understanding the genetic and metabolic regulators of ferroptosis, with the advent of CRISPR and chemical screening as well as other high throughput approaches (Doll et al., 2017; 2019; Conlon et al., 2021). These approaches succeeded in mapping various effectors in the ferroptosis pathway and identifying different classes of ferroptosis inducing agents (Stockwell and Jiang, 2020).
While a large body of work has focused on the metabolic regulators of ferroptosis (Zheng and Conrad, 2020), the epitranscriptional regulators of ferroptosis are yet to be fully explored. For example, it is known that RNA and tRNA modifications play important roles in regulating cellular sensitivity to oxidative stresses (Fu and Zhuang, 2020; Rashad et al., 2020), however, these mechanisms are not fully explored in the context of ferroptosis. Furthermore, recent studies revealed a link between ferroptosis and the integrated stress response (Lin et al., 2021) and mitochondrial stress (Gao et al., 2019), both of which are known to be heavily regulated at the level of the epitranscriptome. Important differences also exist in the cellular metabolic response to ferroptosis induced by different classes of ferroptosis inducers (Soula et al., 2020). Interestingly, blocking translation via cycloheximide (CHX) appears to have different effects on ferroptosis induction via system xCT blockade or via GPX4 inhibition (Conlon et al., 2021). Understanding how these mechanisms contribute to cellular response to ferroptosis would be paramount in our understanding of ferroptosis regulation.
In this work we examined the impact of transcription and translation blockage on cellular response to ferroptosis. We identified a strong Alternative splicing (AS) program being activated during ferroptosis prior to transcriptional reprogramming, yet this program was different between system xCT inhibition and GPX4 inhibition induced ferroptosis. We also show that ferroptosis induction greatly influences mRNA stability via impacting codon usage and biases, in a ferroptosis class specific manner. Furthermore, we show a potential role of translation repression in regulating ferroptosis responses. We analyzed the role of translation in ferroptosis vis studying a tRNA modifying enzyme, Alkbh1, in glioma cells. Alkbh1 is a tRNA demethylase that represses protein translation (Liu et al., 2016). Our results revealed that Alkbh1 can greatly influence cellular response to different ferroptosis inducers via its translation repressing effect and via translational reprogramming.
EXPERIMENTAL PROCEDURES
Cell culture
B35 neuroblastoma cells were purchased from ATCC (Cat# CRL-2754, RRID: CVCL_1951). 9L gliosarcoma cells were a gift from Dr Ichiyo Shibahara (ATCC). Both cell lines were cultured in high glucose DMEM (Nacalai Tesque, Cat# 08457–55) containing 10% fetal bovine serum (FBS; Hyclone, GE-life sciences, USA. Cat# SH30910.03 for 9L cells or Corning, Cat# 35-79-CV for B35 cells). All B35 experiments were conducted on Poly L-lysine (PLL) coated plates and dishes. 9L experiments were conducted on non-coated plates and dishes.
Reagents and drugs
Erastin (Sigma, Cat# E7781). 1S-3R-RSL3 (RSL3, Sigma, Cat# SML-2234). Actinomycin D (ActD, Sigma, Cat# A9415), Cycloheximide (CHX, Sigma, Cat# C7698). Bodipy 581/591 C11 (Invitrogen, Cat# D3861). Cell count reagent SF (For WST-8 assay, Nacalai tesque, Cat# 07553–44). Calcein green (Invitrogen, Cat# C34852). Puromycin (Sigma, Cat# P8833). Ferrostatin-1 (Ferr-1, Sigma, Cat# SML0583). Sodium meta-Arsenite (Arsenite, Sigma, Cat# S7400). Rotenone (Sigma, Cat# R8875). Antimycin A (Sigma, Cat# A8674). Potassium Cyanide (KcN, Sigma, 60178). Sodium oxamate (Oxamate, Sigma, Cat# O2751). 2-Thenoyltrifluoroacetone (TTFA, Sigma, Cat# T27006).
Western blotting
Western blotting was performed as previously described (Rashad et al., 2020). In brief, Cells were homogenized in protein extraction buffer containing Triton-x, centrifuged, and the supernatant containing proteins separated. Protein concentrations were evaluated using Brachidonic acid assay kit (Thermo Fisher Scientific, Cat# 23227). Equal loads of proteins were separated on Mini-PROTEAN TGX gel (Bio-rad) and transferred to polyvinylidene difluoride membrane (Biorad) using semidry transfer. Membranes were blocked in 5% skim milk solution in PBS-T, incubated with primary antibody of choice overnight at 4 °C, incubated with secondary antibody (IgG detector solution) and the signal detected using chemiluminescence Western blotting detection reagents (Pierce ECL Western Blotting Substrate, Thermo Fisher Scientific Inc., Rockford, IL, the USA, Cat# 32106) on ChemiDoc machine (Bio-Rad). Membranes were stripped and re-probed using anti-beta actin antibody as a loading control.
Antibodies used were anti-Alkbh1 antibody (1:500 dilution, Abcam, Cat# ab195376). anti-beta actin antibody (1:5000 dilution, Cell signalling technologies, Cat# 4970 S). anti-puromycin antibody (1:2000 dilution, Millipore, Cat# MABE343). Secondary antibody used was IgG detector solution, HRP-linked (1:2000, Takara, Japan, Cat# T7122A-1).
Puromycin incorporation assay
Cells were incubated in full growth medium containing 10 μg/ml puromycin for 30 minutes, the collected as explained above and analyzed using western blotting using anti-puromycin antibody as demonstrated above.
Generation of stable Alkbh1 overexpressing glioma cell line
Alkbh1 Rat Tagged ORF Clone Lentiviral Particles and Mock control were purchased from Origene (Cat# RR214755L2V). Cells were transfected with lentiviral particles in the presence of polybrene (Sigma, Cat# TR-1003-G) as previously described and colonies selected via limiting dilution and single colony expansion (Rashad et al., 2020). Colonies were monitored and selected on the basis of their GFP expression. Following selection and expansion, western blotting was used to evaluate expression of exogenous Alkbh1, and to evaluate the stability of transfection over multiple passages. Multiple clones were successfully established, and one was selected at random for the purpose of this work.
Evaluation of cell death and ferroptosis
Cell viability after exposure to ferroptosis inducing agents was evaluated via different methods such as WST-8 assay to evaluate cell viability, Live cell imaging by Calcein green for living cells, and Propidium iodide (PI) staining for dead cells. Number of dead cells was counted using ImageJ software and presented a ratio between Alkbh1 overexpressing cells and Mock cells. Bodipy C11 was used to evaluate lipid peroxidation by observing the shifts in fluorescence emission as described previously (Martinez et al., 2020). Drug doses were determined via pilot studies (data not shown).
Analysis of cell growth and migration
Analysis of cell growth in Alkbh1 overexpressing 9L cells or Mock cells was performed by platting the cells at very low confluence (1000 cells/ well in 96 or 6 well plates). Cells were grown for 1 week and analyzed using WST-8 assay (96 wells), or grown for 2 weeks, then fixed, and stained using Cresol violet (6 wells).
Analysis of glioma migration was performed using scratch assay. Cells were plated in 6 well plates 24 hours before the test in order to be >90% confluent by the time of the test. A scratch was performed using a 200 μl pipette tip. The width of the gap was measured immediately after scratch (0 hour), and cells incubated for 24 hours in fresh growth medium, then the gap width was measured again. The ratio of migration was calculated using this equation:
UHPLC-MS/MS analysis
UHPLC-MS/MS was performed as detailed previously (Nishizawa et al., 2020). Samples were prepared by plating equal number of B35 cells in 6 well dishes (1 × 10⁶/well) and exposing the cells to Erastin (1 μM) or RSL3 (0.1 μM) with or without ActD (5 μg/ml) or CHX (100 μg/ml) for 8 hours. Cells were washed in ice cold PBS and suspended in 100 μl methanol containing internal standards, homogenized by sonication, deproteinized and analyzed by ultra HPLC triple quadrupole MS (UHPLC-MS/MS). The analysis was performed on an Acquity™ Ultra Performance LC I-class system (Waters Corp., Milford, UK) interfaced to a Waters Xevo TQ-S MS/MS system equipped with electrospray ionization. Details of the analysis were published previously (Nishizawa et al., 2020). The data were collected using the MassLynx version 4.1 software (Waters Corp.) and the ratio of the peak area of analyte to the internal standard was analyzed by Traverse MS (Reifycs Inc., Tokyo, Japan) (Nishizawa et al., 2020). The analysis was performed using 6 samples per group and data presented as Area/ratio. LC-MS/MS raw data are present in Supplementary Table 4.
RNA-sequencing
Cells were lysed in Qiazol (Qiagen, Cat# 79306) following exposure to drugs as indicated (B35 ferroptosis experiment) or without drug treatment (9L Alkbh1 overexpression experiment). RNA was extracted using Qiagen’s miRNeasy mini kit (Cat# 217084) with DNase digestion step. RNA concentration and purity was determined using nanodrop 1 (ThermoFisher). RNA integrity was analyzed using Agilent Bioanalyzer 2100 and Agilent’s RNA 6000 nano kit (Cat# 5067-1511). RNA integrity number (RIN) was above 9 in all samples used. mRNA sequencing was performed using NEBNext Ultra II Directional RNA Library Prep kit (Cat# E7765S) as per manufacturer’s instructions. Quality control of libraries was performed using Agilent DNA 1000 kit (Cat# 5067-1504). NEBNext Library Quant Kit (Cat# E7630L) was used for quantifying libraries. Libraries were pooled and sequenced on Hiseq-X ten (150 bp, paired end) by Macrogen Japan. All sequencing experiments were performed with 3 replicates per group.
RNA-sequencing data analysis
Quality control for Raw fastq files was performed using FastQC. Reads were trimmed using Trimmomatic (Bolger et al., 2014) and adaptor sequences and low-quality reads removed. Reads were aligned to Rattus norvegicus reference genome (mRatBN7.2/rn7 assembly from UCSC) using Hisat2 (Kim et al., 2019) with splice aware options using GTF file for reporting. Read counting and transcript assembly were performed using Stringtie (Pertea et al., 2016), and differential gene expression was performed using Limma-voom package (Ritchie et al., 2015). Fold change >1.5 (in the B35 ferroptosis experiment) or >2 (in the 9L Alkbh1 overexpression experiment) plus FDR < 0.05 were criteria for statistical significance of differentially expression genes (DEGs). Pre-ranked Gene set enrichment analysis was conducted using eVitta (Cheng et al., 2021).
For relative mRNA stability analysis, we looked into the changes of mRNAs relative to the total RNA pool. That is, whether after ActD or CHX treatment the normalized counts of a certain mRNA are increased in relation to the global pool of RNA before the treatment. In order to calculate the mRNA stability after ActD or CHX co-treatment with Erastin or RSL3, the co-treatment condition was normalized to the ferroptosis drug condition alone, then compared with the ActD or CHX only treatment normalized to the control:
The normalization and analysis was conducted in Limma.
Pearson’s correlation coefficients between different datasets were analyzed using R language programming using PerformanceAnalytics package.
Alternative splice (AS) analysis was performed using the rMATs-turbo suite (Shen et al., 2014). Statistical significance of alternative splicing events was considered when FDR < 0.05 and delta-Psi . Gene ontology and pathway analysis for AS was performed using Metascape (Zhou et al., 2019a). Only genes satisfying the selection criteria were selected for pathway analysis.
Real-time PCR (qPCR)
RNA was extracted as above, and cDNA synthesized from 1 μg RNA using Superscript III reverse transcriptase (ThermoFisher, Cat# 18080044). qPCR was performed using GoTaq qPCR Master Mix (Promega, Cat# A6102) on CFX96 thermal cycler (Bio-Rad). qPCR was conducted with 4 replicates per group. qPCR was analyzed using the ΔΔCT method with Actin-β as an internal control.
Primers used in this study:
| Actin-β: Forward: 5′GGAGATTACTGCCCTGGCTCCTA, Reverse: 5′GACTCATCGTACTCCTGCTTGCTG. |
| Acsl4: Forward: 5′AATTCCACCCTGATGGATGCTTAC, Reverse: 5′TTCAGTGCGGCTTCGACTTTC. |
| FSP1 (Aifm2): Forward: 5′CCATCCAGGCCTATGAGGACA, Reverse: 5′TTAATCTCTGCGGCCATCTCAAC. |
| Dcx: Forward: 5′CACTGACATCACAGAAGCGATCAA, Reverse: 5′TCAGGGCCACAAGCAATGAA. |
| Gja1: Forward: 5′AGGTCTGAGAGCCTGAACTCTCATT Reverse: 5′GGCACTCCAGTCACCCATGT. |
| Gpx4: Forward: 5′ATGCCCACCCACTGTGGAA, Reverse: 5′GGCACACACTTGTAGGGCTAGAGA. |
| Hsp70: Forward: 5′GCTCGAGTCCTACGCCTTCAATA, Reverse: 5′CTCAGCCAGCGTGTTAGAGTCC. |
| Hspa9 (GRP75): Forward: 5′CCGGAGACAACAAACTTCTAGGACA, Reverse: 5′TTGGCAGAAACGTGCACAATC. |
| Hspd1 (HSP60): Forward: 5′ACCGGAAGCCCTTGGTCATAA, Reverse: 5′TGGAGCTTTGACTGCTACAACCTG. |
| Lonp1: Forward: 5′TGACAGATGTGGCAGAAATCAA, Reverse: 5′GGTAGCCTCGGCCAATCTTA. |
| MMP2: Forward: 5′TCCCGAGATCTGCAAGCAAG Reverse: 5′AGAATGTGGCCACCAGCAAG. |
| MMP9: Forward: 5′AGCCGGGAACGTATCTGGA Reverse: 5′TGGAAACTCACACGCCAGAAG. |
| Oct4: Forward: 5′CATCTGCCGCTTCGAG, Reverse: 5′CTCAATGCTAGTCCGCTTTC. |
| Sirt1: Forward: 5′CGGACAGTTCCAGCCATCTCTG, Reverse: 5′GGATTCCTGCAACCTGCTCCAA. |
| Sirt3: Forward-5′AAGACATACGGGTGGAGCCT Reverse-5′GGACTCAGAGCAAAGGACCC. |
| Sirt5: Forward-5′TTACCACTACCGGAGGGAGG Reverse-5′TGATGACCACAACCCGTCTG. |
| Slc3a2: Forward: 5′CACTCCCAACTATAAGGGCCAGAA, Reverse: 5′CATCCCGAACTTGGAAACCATC. |
| Slc7a11: Forward: 5′GTGGGCATGTCACTGGTGTTC, Reverse: 5′GCTCGTACCCAATTCAGCATAAGA. |
| Sox2: Forward: 5′GTCAGCGCCCTGCAGTACAA, Reverse: 5′GCGAGTAGGACATGCTGTAGGTG. |
| Sox4: Forward: 5′TGGACGTATTTATACTGGCCAAACA, Reverse: 5′AATGGCGTGGGTAACAACACTAGA. |
| Stx1a: Forward: 5′GGCCGTCAAGTACCAGAGCAA, Reverse: 5′ATGATGATGCCCAGAATCACACA. |
| Ttyh1: Forward: 5′GACTTCTGCTCCAACCCAGACAC, Reverse: 5′AGCACGCTGGGACAGAGTCA. |
Statistical analysis
Statistical analysis was performed using SPSS v20 (IBM). All data are represented as mean ± standard deviation (SD). ANOVA with Turkey post Hoc was used to compare multiple groups and independent sample Student’s t-test was used to compare between 2 groups. P < 0.05 was considered to be statistically significance in addition to fold change (FC) > 1.5 when appropriate. All experiments were conducted in triplicates or more.
Codon analysis
Gene-specific codon counting algorithm.
A gene-specific codon counting algorithm (Tumu et al., 2012) was applied to discern the codon usage biases associated with the top up- and down-regulated genes in each condition. The algorithm calculated the number of times each codon appeared in each gene as well as the amino acid normalized codon frequency or the total codon frequency. The amino acid normalized codon frequency is calculated as:
where isoacceptor refers to the synonymous codons for the amino acid encoded by codon and n refers to the number of isoacceptors for a given amino acid (). The total codon frequency is calculated as:
where refers to the total number of codons used in the gene.
T-statistic calculations.
The t-statistic describing the codon frequency of a list of up- or down-regulated genes was calculated as:
where refers to the mean frequency for codon in the sample, refers to the mean frequency for codon across the rattus norvegicus genome, refers to the standard deviation of the frequency for codon in the sample, and n refers to the sample size.
Visualizing codon usage biases.
Codon usage biases across lists of up- and down-regulated genes were visualized by plotting the t-statistics describing the isoacceptor codon frequency for each codon in each tissue in a hierarchically clustered heat map. Hierarchical clustering was performed using the “one minus Pearson correlation” metric and “average” as the linkage method.
Principal component analysis.
Principal component analysis (PCA) was performed using the Unscrambler software. The t-statistics describing the codon frequency for the top 10 up- and down-regulated genes in each condition were input into the NIPALS algorithm for principal component analysis using 100 as the maximum number of iterations. The scores plot contains the conditions, while the loadings plot contains the codon frequencies for all 62 codons analyzed. The ellipse on the scores plot represents the Hotelling limit at P-value of 0.05. The outer ellipse on the correlation loadings plot indicates 100% explained variance, while the inner ellipse indicates 50% explained variance. The percentages of the observed variance explained by principal components 1 and 2 are indicated in parentheses along their respective axes.
Partial least squares regression analysis.
Partial least squares regression (PLSR) was performed using the Unscrambler software to interpret relationships between codon frequency and up- and down-regulation for each condition. The t-statistics describing the codon frequencies of the top 10 up- and down-regulated genes for each condition were used as the predictors and the log2 fold change values for each gene from mRNA stability data were used as the response values. PLSR analysis was performed using the NIPALS algorithm using 100 as the maximum number of iterations. The ellipse on the scores plot represents the Hotelling limit at P-value of 0.05. The outer ellipse on the correlation loadings plot indicates 100% explained variance, while the inner ellipse indicates 50% explained variance. Percentages of observed variances explained by factors 1 and 2 are indicated in parentheses along their respective axes.
Statistical analysis.
Pearson correlation coefficients were calculated to quantify correlations between data. To aid interpretation on statistical significance, P < 0.05, P < 0.01, P < 0.001, and P < 0.0001 are denoted as *, **, ***, and ****, respectively. All statistical analyses were performed using GraphPad Prism. Multivariate statistical analyses were performed using the Unscrambler (version 10.4).
RESULTS
Effect of translation or transcription inhibition on ferroptosis.
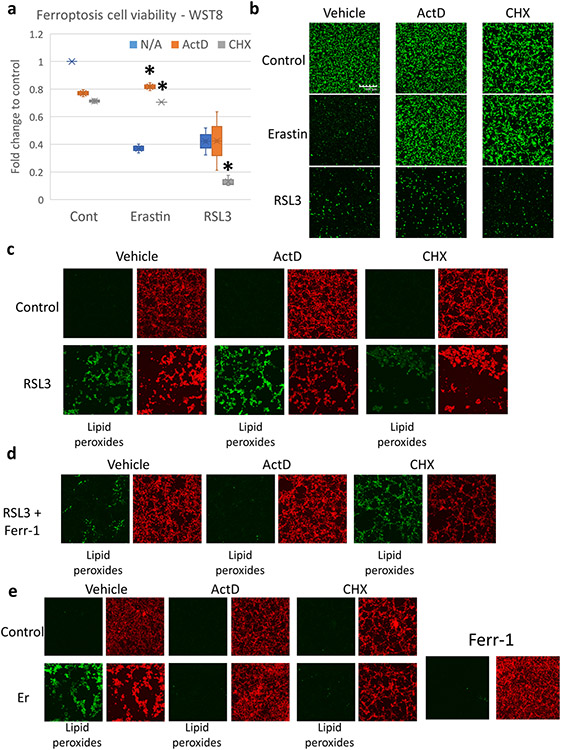
To interrogate the effect of transcription or translation inhibition on ferroptosis, we started by treating B35 neuroblastoma cells with the System xCT inhibitor Erastin (Class I ferroptosis inducing agent) or with the GPX4 inhibitor RSL3 (Class II ferroptosis inducing agent). First, we adjusted the drug concentrations for Erastin and RSL3 to achieve 40–50% cell viability on WST-8 assay after 8 hours of stress to be able to directly compare the results [Fig. 1a]. Next, we treated the cells with ferroptosis inducers alone or with the transcription inhibitor Actinomycin D (ActD) or the translation inhibitor cycloheximide (CHX). As previously observed (Zille et al., 2019; Conlon et al., 2021), blocking translation or transcription protected cells from Erastin induced ferroptosis. On the other hand, ActD had no effect on RSL3 treated cells while CHX greatly enhanced the cell death [Fig. 1a, b]. Next, we examined the presence of lipid peroxides with Bodipy C11 staining. Lipid peroxides were robustly expressed 4 hours after RSL3. While in the Erastin treatment group, they were observed 6 hours after treatment. In the RSL3 group, ActD treatment resulted in comparable lipid peroxide generation with the RSL3 only group. CHX, on the other hand, resulted in extensive cell death that interfered with the observation of lipid peroxides at the chosen timepoint [Fig. 1c]. Ferrostatin-1 (Ferr1; ferroptosis inhibitor), greatly mitigated the impact of RSL3 and RSL3 + ActD on the cells. It also reduced the level of cell death observed when the cells were treated with RSL3 + CHX, however, there was still extensive lipid peroxidation observable [Fig. 1d]. In the Erastin treatment group, Lipid peroxides were observed at 6 hours [not shown] and 8 hours along with extensive cell death [Fig. 1e]. Co-treatment with ActD, CHX, or Ferr1 abrogated the cell death and lipid peroxidation [Fig. 1e]. These results are in-line with previous observations (Conlon et al., 2021) and indicate that transcription or translation repression can be advantageous when ferroptosis is induced by Class I FIN (Ferroptosis inducers) which act on system xCT, but detrimental with Class II FIN which act on GPX4.
Fig. 1. Blocking transcription or translation rescues cells from Erastin but not RSL3 induced ferroptosis.
B35 cells were Incubated with Erastin (1 μM) or RSL3 (0.1 μM) In addition to Actinomycin D (ActD; 5 μg/ml) or Cycloheximide (CHX; 100 μg/ml). (a) WST-8 assay after 8 hours of Incubation showing recovery of cell viability when cells were co-treated by ActD or CHX and Erastin, while CHX worsened cell viability when co-treated with RSL3 (Experiment repeated thrice, 6 replicates each). Asterisk = statistically significant (P < 0.05) versus vehicle (N/A) group. (b) Calcein green live cell Imaging showing rescue of cell viability In the Erastin group with ActD or CHX co-treatment and the absence of effect In the RSL3 group (experiment repeated thrice with 2 replicates each). Scale bar = 300 μm (c) Bodipy C11 live cell Imaging 4 hours after exposure to RSL3 with ActD or CHX co-treatment showing the generation of lipid peroxides In all groups. RSL3 + CHX led to extensive cell death. Green = lipid peroxides. Red = unoxidized lipids. d. Ferrostatin-1 (Ferr-1) reduced lipid peroxidation after RSL3 and RSL3 + ActD treatment. Ferr-1 rescued cell viability to some extent in the RSL3 + CHX group, but Lipid peroxides were still evident. (e) Bodipy C11 staining in the Erastin group showing that ActD, CHX, and Ferr-1 all blocked lipid peroxides formation when co-treated with Erastin (Er). Bodipy experiments were repeated three times with two replicates per experiment.
Impact of translation or transcription inhibition on Glutathione levels
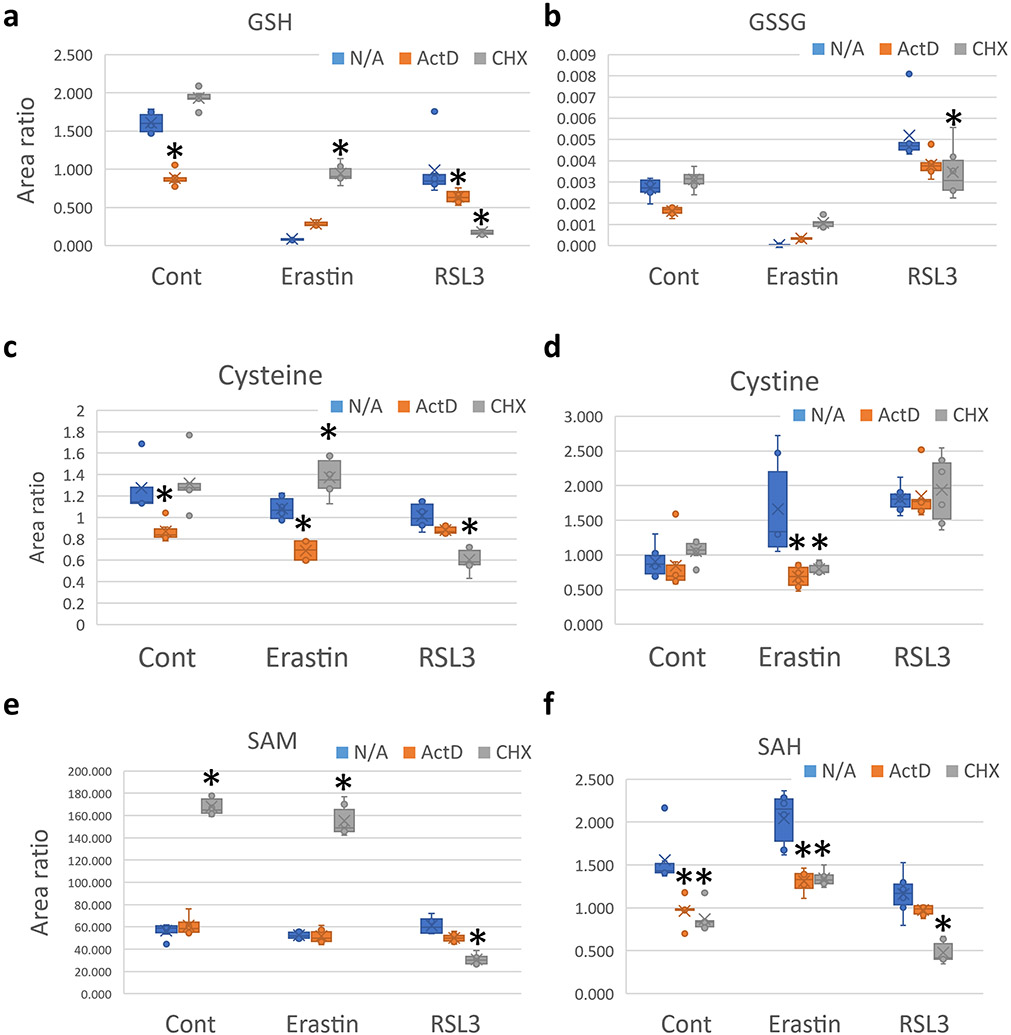
Ferroptosis is centered around the detoxifying activity of GPX4 along with reduced glutathione (GSH) (Yang et al., 2014). In order to evaluate the impact of transcription or translation inhibition on GSH, and other relevant metabolites, we performed liquid chromatography mass spectrometry (UHPLC-MS/MS), using the same groups shown in Fig. 1a, after 8 hours of ferroptosis stress exposure. We focused our analysis on the reverse transsulfuration pathway, which is responsible for GSH generation (Sbodio et al., 2019). ActD treatment, without RSL3 or Erastin, reduced GSH levels. On the other hand, CHX slightly increased GSH levels [Fig. 2a]. While this might appear counter intuitive, translation repression during stress was shown to shift the mRNA translation machinery towards the generation of stress proteins, and importantly GSH, via changes in transfer RNA (tRNA) transcripts expression levels and consequently mRNA codon usage and translation rates (Torrent et al., 2018). Erastin treatment caused GSH depletion, in line with its known mechanism of action (Dixon et al., 2012). ActD paradoxically increased the levels of GSH when cells were co-treated with Erastin, despite its GSH lowering effect in the absence of Erastin or RSL3. CHX co-treatment with Erastin greatly recovered the GSH levels [Fig. 2a]. RSL3 co-treatment with ActD or CHX lowered GSH levels, which appears paradoxical to the activity of CHX with Erastin or by itself. This might be a consequence of the extensive cell death caused by the co-treatment with RSL3 and CHX [Fig. 2a]. Oxidized glutathione (GSSG) was not detected after Erastin treatment, which can correlate with GSH depletion and the unavailability of GSH pools to interact with lipid peroxides [Fig. 2b]. This can be extrapolated from the detection of GSSG when CHX is used with Erastin, which led to GSH generation and therefore the availability of GSH to detoxify lipid peroxides.
Fig. 2. Cycloheximide rescues Glutathione depletion in Erastin and elevates SAM.
Mass spectrometry analysis showing the effect of ActD and CHX co-treatment with Erastin or RSL3 on the levels of (a) reduced glutathione (GSH), (b) oxidized glutathione (GSSG), (c) Cysteine, (d) Cystine, (e) S-adenosyl methionine (SAM), and (f) S-adenosyl homocysteine (SAH). Data is presented as Area ratio. Equal cell numbers were used for all experiments. Mass spectrometry was conducted with three replicates per group. Asterisk = statistically significant (P < 0.05) versus vehicle (N/A) treated group.
Several other related metabolites also showed similar changes that can be correlated with cell viability and lipid detoxification [Fig. 2c-f and Fig. 3]. Surprisingly, CHX caused an increase in cysteine (Cys) levels, the precursor for GSH synthesis (Stockwell and Jiang, 2020), when combined with Erastin, without an apparent increase in intracellular cystine, which is imported via the system xCT in exchange for glutamate (Stockwell and Jiang, 2020) [Fig. 2c]. ActD, on the contrary, reduced Cys levels alone and with Erastin co-treatment. This observation appears contradictory to the need for Cys for GSH synthesis and ferroptosis protection. It is notable that the levels of Cys did not change from control when RSL3 or Erastin were used alone. Looking at cystine levels, it is clear that both ActD and CHX reduced cystine when combined with Erastin [Fig. 2d]. The reasons for these changes are yet to be understood.
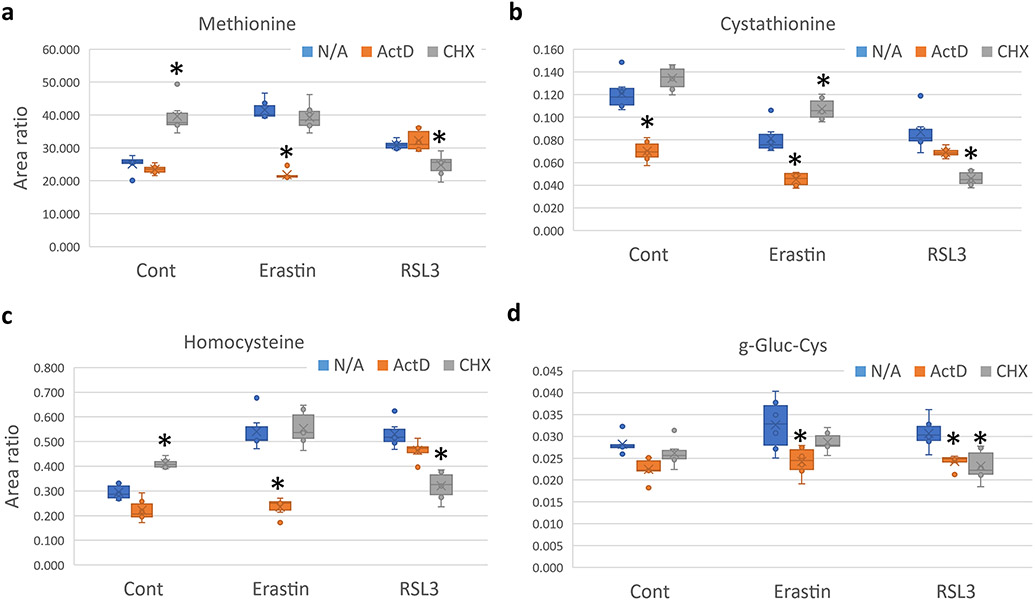
Fig. 3.
Mass spectrometry analysis showing the effect of ActD and CHX co-treatment with Erastin or RSL3 (Continued from Fig. 2). Asterisk = statistically significant (P < 0.05) versus vehicle (N/A) treated group.
S-adenosylmethionine (SAM), the main methyl donor in the cell (Ouyang et al., 2020), was extensively upregulated with CHX treatment or co-treatment with Erastin [Fig. 2e]. SAM is known to play an important role in oxidative stress (Li et al., 2017), however, its role in ferroptosis is yet to be established. Furthermore, the role of SAM in the protective protein translation repression response to stress, which might be mimicked by CHX in this case, is not known. On the contrary, RSL3 co-treatment with CHX reduced SAM levels, which might contribute to the increased cell death observed, or it might be a byproduct of that cell death. S-adenosyl homocysteine (SAH), another metabolite which is known to play important role in oxidative stress was also affected by ActD and CHX treatment. Both drugs decreased the levels of SAH alone or with Erastin co-treatment. While with RSL3, only CHX reduced SAH levels significantly [Fig. 2f]. SAH was shown to correlate and promote oxidative stress (Xiao et al., 2019), which can explain its increase with Erastin treatment. ActD and CHX offered protection against Erastin induced ferroptosis might act via reducing its levels along with other mechanisms. It’s important to note that SAH levels did not increase with RSL3, which might indicate that SAH does not play an important role in RSL3 mediated ferroptosis, and its reduction with CHX co-treatment might be an effect rather than a cause.
The upregulation of GSH, Cysteine, and SAM in the CHX group might indicate the activation of the reverse transsulfuration pathway, which was shown recently to protect against ferroptosis (Hayano et al., 2016; Cao et al., 2020; Liu et al., 2020a). Other metabolites also hinted to the activation of this pathway. Methionine was upregulated with CHX treatment, although its levels were comparable to the vehicle group after Erastin and CHX co-treatment [Fig. 3a]. Cystathionine, the precursor for Cysteine was also upregulated when CHX was co-treated with Erastin [Fig. 3b]. Homocysteine also showed the same pattern as with Methionine [Fig. 3c].
Overall, these results indicate that CHX and protein translation repression protect cells from Erastin induced lipid peroxidation via a mechanism that mimics cellular response to stress via translation repression, leading to generation of GSH. Both ActD and CHX might also protect the cells via reducing SAH and CHX might be acting also via increasing SAM levels, offering an antioxidant advantage to the cells. The transsulfuration pathway appears to play a role in CHX mediated protection only, and not in ActD. These mechanisms do not appear to be functioning in RSL3 mediated ferroptosis.
Transcriptional and epitranscriptional response to Erastin and RSL3
Our data indicate that transcription and translation play important roles in ferroptosis. Guided by this observation, we shifted our focus to the transcriptome in order to further understand the cellular response to ferroptosis. We chose to perform mRNA sequencing 4 hours after exposure to the drugs, due to the fact that at 8 hours we observed extensive cell death especially in the RSL3 + CHX group as evident from the cell viability analysis and from the reduction of many of the metabolites analyzed, which can be detrimental to the quality of RNA sequencing.
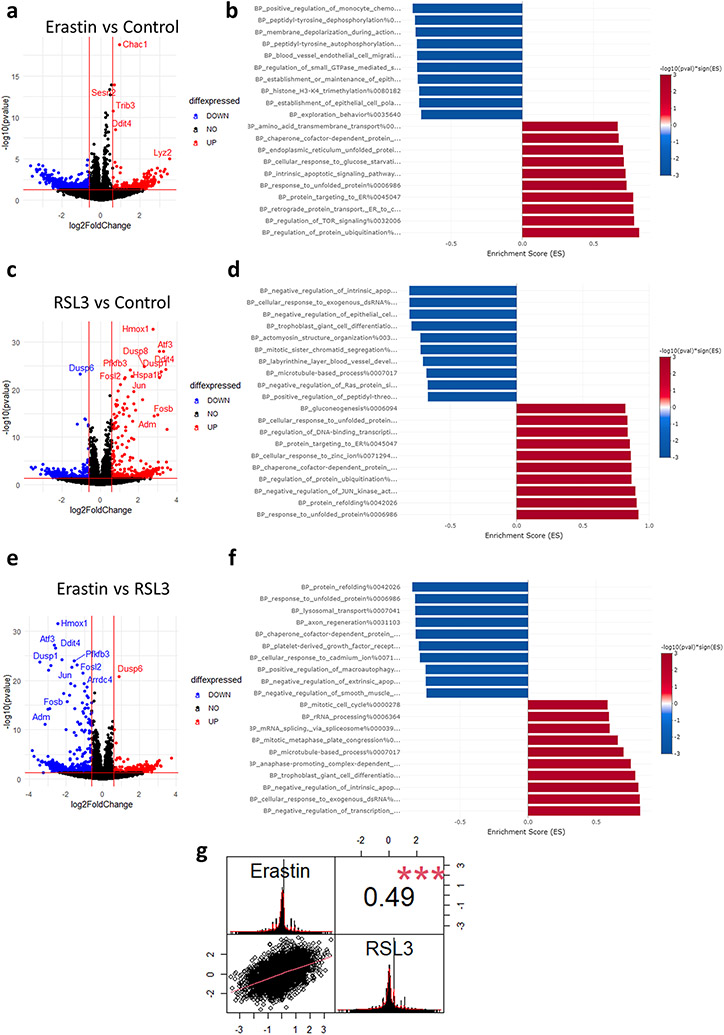
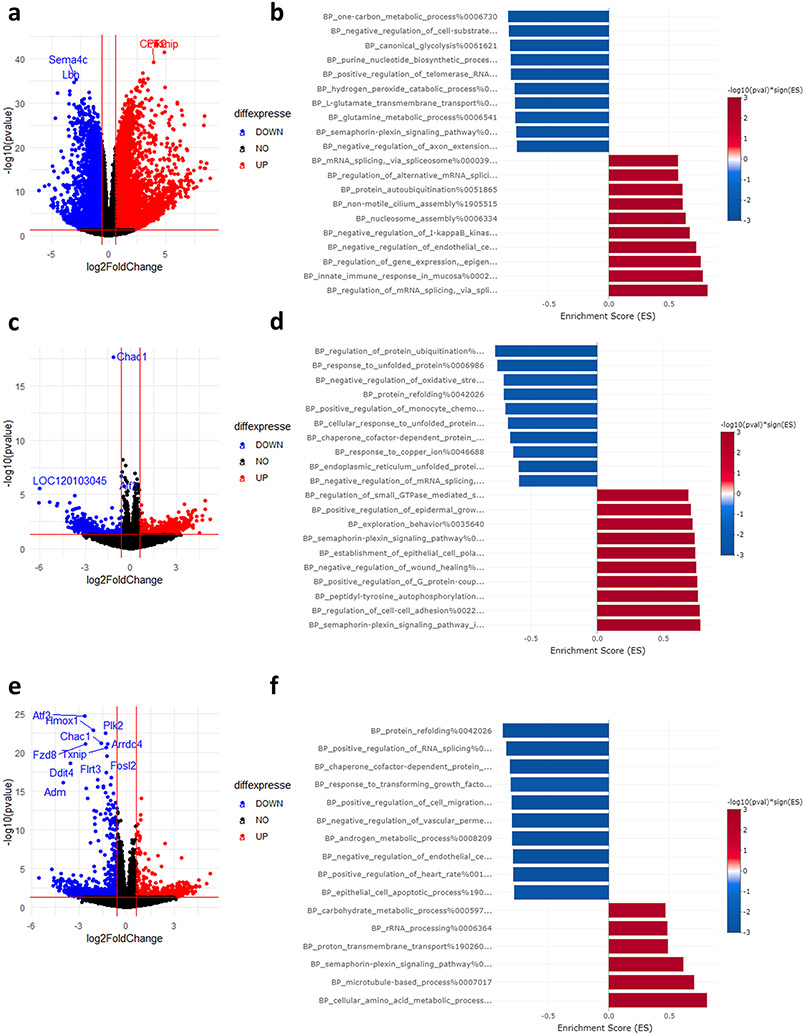
We first started by analyzing the differentially expressed genes (DEG) and pathways after RSL3 or Erastin treatment. After 4 hours of treatment, Erastin had minimal impact on DEGs according to the preset criteria for significance (Fold change > 1.5, FDR < 0.05) [Fig. 4a]. Gene ontology biological processes (GOBP) analysis revealed that Erastin stress activated pathways related to protein homeostasis. Several processes related to endoplasmic reticulum (ER) unfolded protein response (UPR), protein folding, and protein transport were enriched after Erastin [Fig. 4b]. RSL3, on the other hand, caused a much stronger effect after 4 hours of treatment [Fig. 4c]. GOBP analysis revealed a similar pattern of activation of ER stress and protein folding related pathways as observed with Erastin [Fig. 4d]. In order to reveal the differences in the transcriptional responses between Erastin and RSL3, we conducted a direct comparison between both conditions. At the gene level, the comparison of Erastin vs RSL3 appeared as a mirror image of the RSL3 vs Control comparison [Fig. 4e]. This is owing to the minimal effect of Erastin on DEGs. However, GOBP analysis revealed that protein folding and UPR pathways were significantly more enriched in RSL3, while transcription inhibition processes and mRNA splicing, and processes were enriched in Erastin [Fig. 4f]. Pearson’s correlation coefficient revealed a moderate correlation between the gene changes in both drugs [R = 0.49, P = 0.0001, Fig. 4g].
Fig. 4. Transcriptional impact of Erastin or RSL3.
(a) Volcano plot of differentially expressed genes (DEGs) after Erastin exposure. (b) Pre-ranked gene set enrichment analysis (GSEA) after Erastin exposure. (c) Volcano plot of DEGs after RSL3 exposure. (d) GSEA after RSL3 exposure. (e) Volcano plot comparing DEGs between Erastin and RSL3. (f) GSEA comparing enrichment when comparing Erastin to RSL3. (g) Pearson’s correlation coefficient analysis between Erastin and RSL3 datasets (shown in a and b). Asterisk indicates statistical significance. Value in upper right box indicates R (R = 0.49).
We next started looking deeper into the sequencing data, as the effect on transcription was weaker than what we expected especially with Erastin treatment, despite a robust cell death at the end point. Oxidative stress can induce a variety of responses in the cells, and not restricted to transcription. Alternative splicing (AS) is a well known mechanism that regulates cellular proteome diversity, protein translation, mRNA stability and mRNA expression as well as being a part of the oxidative stress response (Shalgi et al., 2014; Fontana et al., 2017; Mehmood et al., 2020). To explore the role of AS in ferroptosis response, we focused on local splice variants (LSV) analysis as our chosen method to analyze various AS types. We used the rMATs software (Shen et al., 2014) which is capable of detecting and comparing various forms of alternative splicing: Skipped exons (SE), Retained Introns (RI), Alternative 5′ splice site (A5SS), Alternative 3’ splice site (A3SS), and mutually exclusive exons (MXE). Since each splice type would have an effect on mRNA dynamics, this classification offers an interesting way of studying AS in ferroptosis response. For example, RI can affect introduce premature stop codons in the open reading frame (ORF) leading to translation termination (Shalgi et al., 2014; Zheng et al., 2020), but instead of activating mRNA degradation, mRNAs with RI are more stable (Wang et al., 2007) and remain in the RNA pool. Thus, in this example, the changes caused by RI would not be reflected on DEG data.
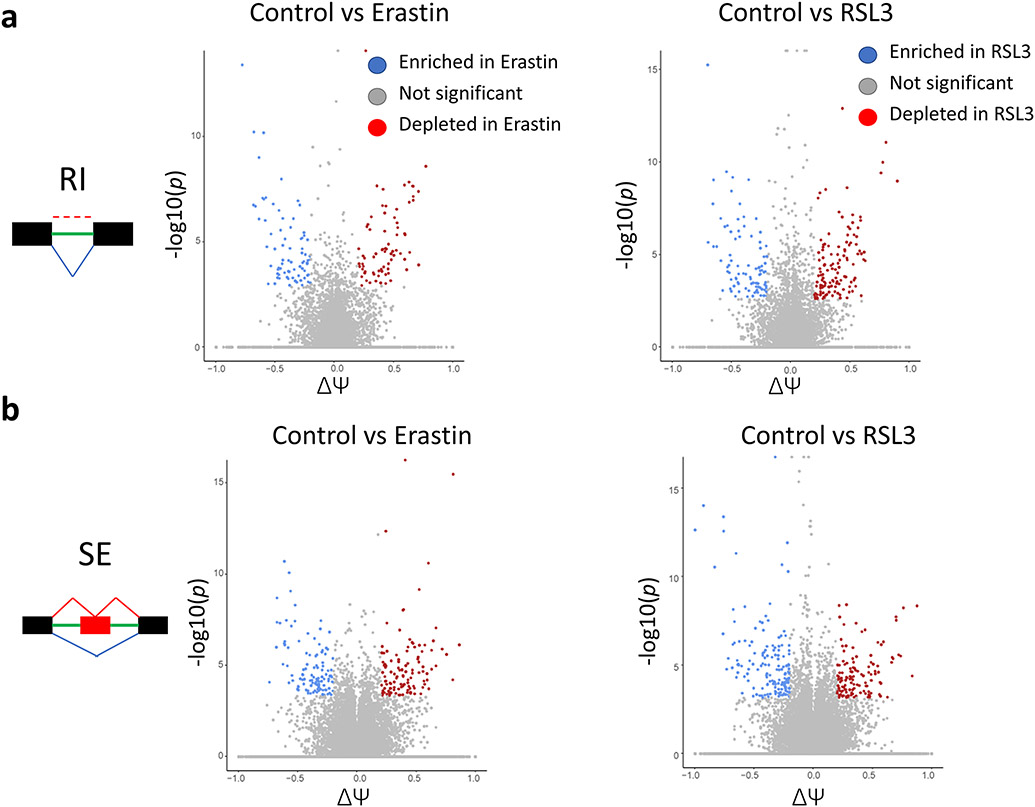
AS analysis revealed hundreds of genes to be differentially alternatively spliced (D-AS) in the Erastin and RSL3 groups in each of the AS types tested as compared to control samples [Fig. 5, Supplementary Fig. 1, Supplementary Tables 1 and 2]. The AS program enriched in each dataset was vastly different, as evident by the very low overlap between genes that underwent AS in each AS subtype in the Erastin and RSL3 datasets [Supplementary Tables 1 and 2]. Rather than focusing on single spliced genes or events, we opted to look into the AS events as a collective, arguing that they might be regulated via a common mechanism or themselves regulating certain aspects of ferroptosis response. To do so, we performed GO analysis using genes in each AS type as input to Metascape (Shalgi et al., 2014) via the multiple gene lists feature to evaluate which AS type was predominantly regulates certain pathways or processes. We analyzed the 3 gene ontology (GO) terms (GO Biological processes, GO Molecular functions, GO cellular components) for D-AS genes in the Control vs Erastin and Control vs RSL3 sets.
Fig. 5. RNA-seq revealed strong activation of Alternative splicing (AS) in Ferroptosis.
Volcano plots revealing the enrichment and depletion of hundreds of AS sites following both Erastin and RSL3 treatment. RI. retained introns. SE. skipped exons. ΔΨ. delta-psi.
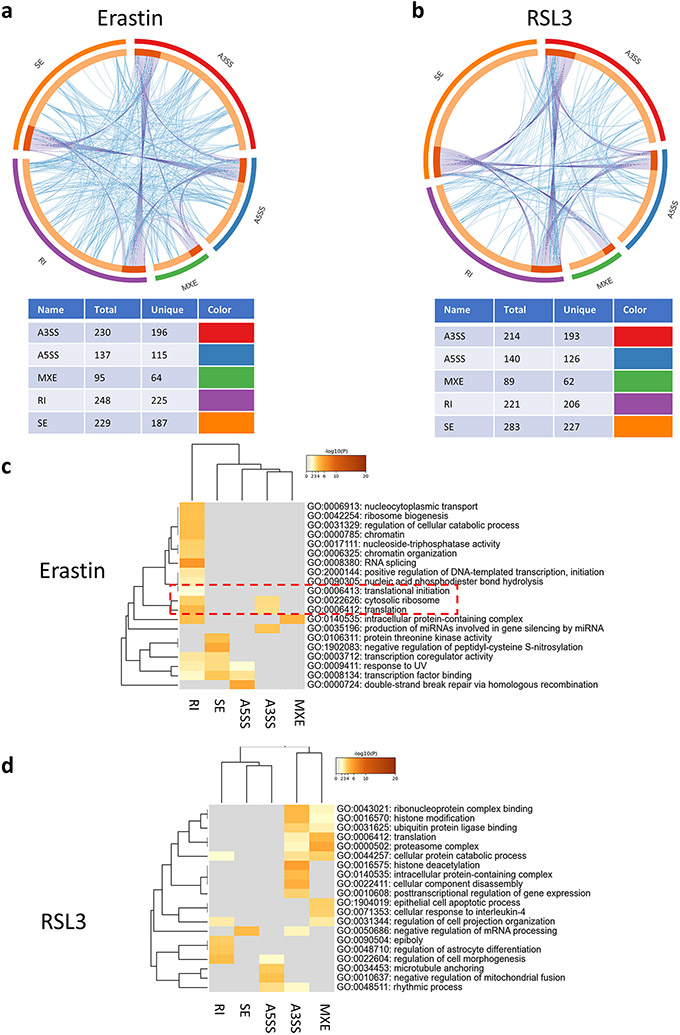
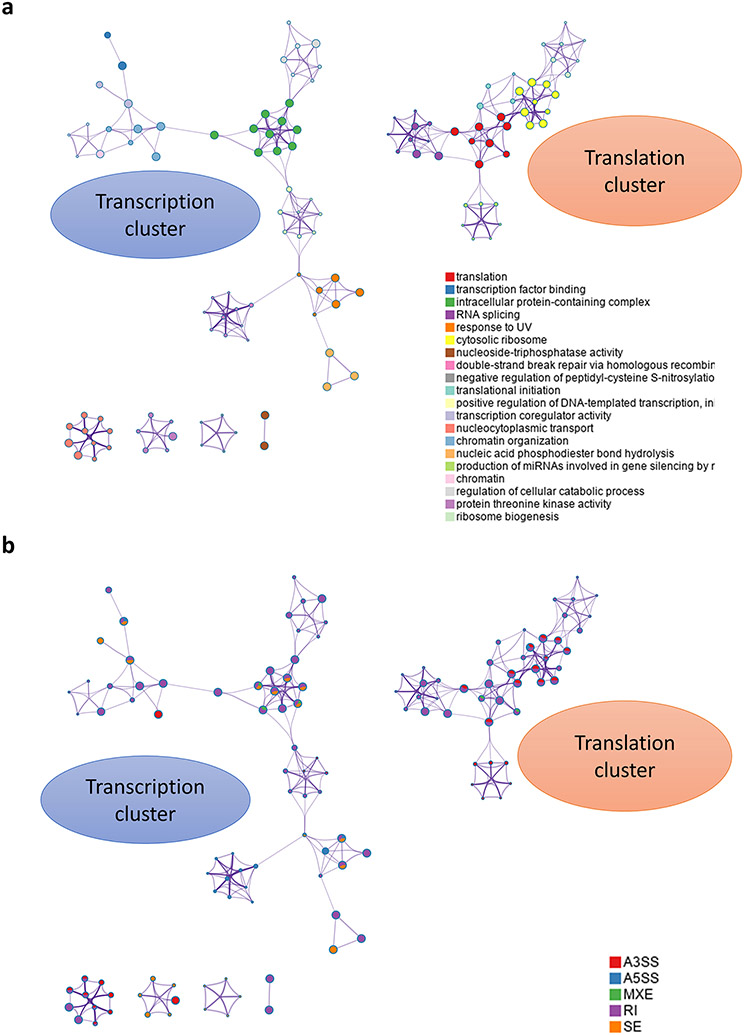
Looking into the number of events and overlap between spliced genes between AS events following Erastin treatment, RI, SE, and A3SS events had nearly equal number of genes. There was, however, minimal overlap between the genes present in each set [Fig. 6a]. In the RSL3 treatment group, the same pattern was present [Fig. 6b]. While several GO terms overlapped between various AS types in the Erastin group [Fig. 6a], the overlap was much lower for the SE events in relation to other AS types in the RSL3 group [Fig. 6b]. Analysis of the top enriched terms in the Erastin group [Fig. 6c, supplementary Fig. 2] showed various terms to be enriched. The top terms were significantly enriched for protein translation with terms such as “translation”, “cytosolic ribosome”, and “translation initiation”. Moreover, RNA splicing, transcription and other epitranscriptional processes were also enriched. Furthermore, it appears that RI events play an important role in regulating Erastin response, as most top enriched terms were enriched in the RI dataset alone or in combination with other AS types [Supplementary Fig. 2]. Cluster analysis of the enriched terms revealed 2 main clusters in the top enriched terms that can be divided into a “translation” related cluster and “transcription” related cluster [Fig. 7a]. RI events were the major contributor to these 2 major clusters [Fig. 7b]. These data put emphasis on these processes and their related epitranscriptional regulatory mechanisms in the Erastin stress response as well as the significant role of RI in their regulation.
Fig. 6. Alternative splicing events regulate various pathways impacting ferroptosis stress response.
(a, b) Circos plots showing the overlap between different AS events at the gene level (purple lines) or at the pathway enrichment level (blue lines) in Erastin (a) and RSL3 (b). The tables under the plots show the number of genes in each AS type and the number of unique genes belong to each AS event type. (c) Gene ontology (GO) analysis for the alternatively spliced genes in the Erastin group showing a dominance of RI events in regulating multiple pathways and the presence of a node related to regulation of translation (red dotted box). (d) GO analysis for the AS genes in RSL3.
Fig. 7. Cluster analysis of enriched pathways of the AS genes in the Erastin treatment group.
(a) Cluster analysis reveals 2 major clusters, a gene transcription relevant cluster and a translation cluster. (b) Analysis of the contribution of different AS types to each node in the clusters confirms the importance of RI in regulating transcription and translation in Erastin. A3SS also appears to play significant role in Erastin.
In the RSL3 dataset, the top enriched terms were related to histone modifications and regulation and various protein-related processes such as proteasome activity and ubiquitin ligase binding [Fig. 6d, supplementary Fig. 3]. Translation relevant mechanisms although were present, were not as high scoring as in the Erastin dataset. The dominance of RI in regulating the enriched pathways observed with Erastin was not observable in the RSL3 dataset. While RI was still important, A3SS was enriching more highly scoring pathways in the RSL3 AS analysis [Supplementary Fig. 3]. Cluster analysis revealed several small clusters, different from the major clustering pattern observed after Erastin treatment [Supplementary Fig. 4].
Altogether, this analysis evidently shows that AS plays an important unexplored role in cellular response to ferroptosis. This analysis also shows that AS mediated ferroptosis response is drastically different between Erastin and RSL3, with pathways regulating translation and transcription scoring high in Erastin, while pathways related to histone modifications and proteasome pathways scoring high in RSL3. Furthermore, the AS event type dominant in each group was different, with intron retention (RI) appearing to be playing an important role in Erastin response.
Transcription inhibition and ferroptosis
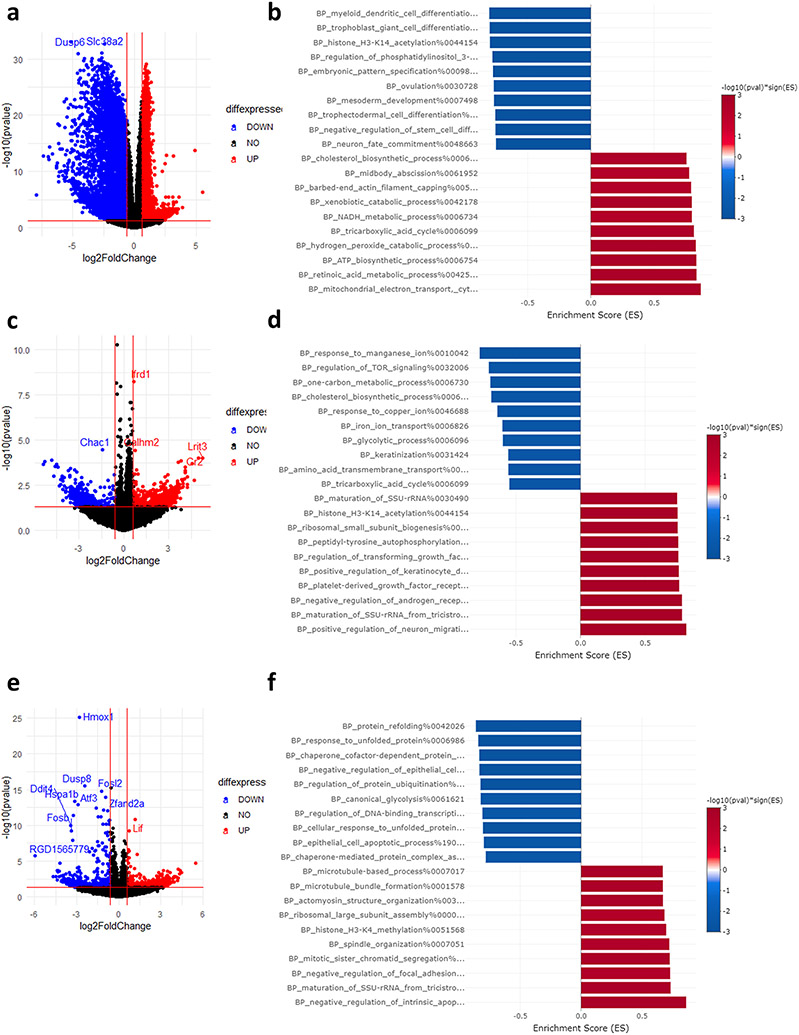
Transcription inhibition led to improved cell viability when ActD was co-treated with Erastin but had no impact on RSL3 induced ferroptosis. To elucidate the underpinnings of this observation, we analyzed RNA-seq data after ActD only treatment and ActD plus ferroptosis inducers. ActD blocks the transcription of RNA from DNA and is frequently used to analyze mRNA stability via this property (Yang et al., 2003). Following transcription blockade, mRNA half-life becomes a function of how effectively this mRNA is translated (Huch and Nissan, 2014), which is dependent on an array of epi and co-transcriptional factors. Therefore, it can be assumed that genes that are up or down regulated after ActD treatment are doing so not because of transcriptional changes, but due to changes in their stability. To that end, we looked into ActD treatment only (without ferroptosis induction) to analyze the impact on mRNA levels. Indeed, there were thousands of mRNAs that showed changes in their expression levels [Fig. 8a]. Given that mRNAs that will be more stabilized after ActD treatment will have their relative expression levels increase in comparison to the total RNA pool, and vice versa, we can assume that the upregulated mRNAs are more stable and the downregulated ones are less stable. To that end, we analyzed enriched GOBP pathways, which revealed the stabilization of various metabolic and energy processes such as those related to electron transport, ATP, and NADPH metabolism [Fig. 8b]. The stabilization of such processes would, in theory, influence how cells respond to oxidative stimuli. However, it does not reveal why the response is different between Erastin and RSL3.
Fig. 8. ActD promotes the analysis of mRNA stability.
(a, b) Volcano plot and GSEA of mRNA stability changes after ActD only treatment. (c, d) Volcano plot and GSEA of mRNA stability changes after Erastin treatment. (e, f) Volcano plot and GSEA of mRNA stability changes after RSL3 treatment.
To understand how ActD impacts cellular response to ferroptosis inducers, we analyzed the mRNA stability changes caused by ActD treatment in each condition [see methods]. In the Erastin group, several pathways were stabilized and destabilized after ActD treatment [Fig. 8c, d]. However, pathway analysis did not reveal ferroptosis or stress related pathways in the top enriched pathways [Fig. 8d]. On the other hand, ActD caused the destabilization of mRNAs related to unfolded protein responses and proteostasis in the RSL3 group [Fig. 8e, f], in a stark contrast to their transcriptional upregulation. This destabilization would impact the translational efficiency of these mRNAs, rendering the transcriptional response inefficient to counter the impact of RSL3, which may explain the lack of impact of ActD on RSL3. Correlation analysis revealed a moderate correlation between mRNA stability changes in the Erastin and RSL3 groups [R = 0.52, P = 0.001, Supplementary Fig. 5a]. However, it is not directly clear why ActD protects against Erastin from analyzing the gene lists in the dataset.
Translation inhibition and ferroptosis
The impact of CHX on Erastin or RSL3 was more profound. CHX protected cells against Erastin induced ferroptosis but was detrimental when combined with RSL3. CHX acts by “freezing” ribosomes on mRNAs, thus blocking translation (Santos et al., 2019). It is frequently used for translation inhibition during ribosome profiling experiments (Ingolia et al., 2012). It was also shown to stimulate ribosome biogenesis in budding yeast at the level of transcription (Santos et al., 2019). However, the transcriptional impact of CHX on eukaryotes is not known, let alone the impact of long exposure to CHX as in the case of our experiment. CHX treatment led to transcriptional upregulation of many RNA splicing and processing pathways, while several metabolic pathways were in the top downregulated pathways [Fig. 9a and b]. However, it was not clear if any of the observed pathways would have a direct impact on ferroptosis.
Fig. 9. CHX leads to altered transcription and mRNA stability.
(a, b) Volcano plot and GSEA of mRNA stability changes after CHX only treatment. (c, d) Volcano plot and GSEA of mRNA stability changes after Erastin treatment. (e, f) Volcano plot and GSEA of mRNA stability changes after RSL3 treatment.
CHX was previously shown to selectively impact the stability of certain mRNAs (Ohh and Takei, 1995; Chan et al., 2018). Hypothesizing a transcriptome wide effect on mRNA stability following CHX, we repeated the same analysis as with ActD. The effect to be observed, would theoretically be a result of both transcriptional changes and mRNA stability changes. In the Erastin group, CHX co-treatment led to the downregulation of pathways related to unfolded protein response, negative regulation of oxidative stress, and mRNA splicing [Fig. 9b, c]. The upregulated pathways included several related to semaphorin signaling. However, the role of semaphorin in ferroptosis is not characterized to draw direct conclusions. In the RSL3 group, similar pattern of downregulation of protein folding and RNA splicing was observed, albeit less than the Erastin group [Fig. 9e, f]. The upregulated pathways included terms such as amino acids metabolism and carbohydrate metabolism which would impact cellular metabolism and energy regulation during stress response. Correlation analysis between changes during translation inhibition and Erastin or RSL3 co-treatment revealed moderate correlation levels [R = 0.48, P = 0.001, Supplementary Fig. 5b].
It is unclear whether the activation of the pathways observed is the direct reason for the effect observed after CHX co-treatment with Erastin or RSL3. Nonetheless, it appears that global transcription or translation inhibition is the driving reason behind the observed effects on Erastin and RSL3, rather than specific pathways/genes.
Divergent synonymous codon usage (SCU) with different classes of ferroptosis inducers
Analyzing mRNA stability gave us clues to the reason behind the divergent response of the cells to transcription or translation inhibition with different ferroptosis inducers, however, there remained several questions to be answered. Importantly, it was not clear why transcription and translation inhibition protected the cells against ferroptosis induced via Erastin, while transcription inhibition had no impact on RSL3 induced ferroptosis, and translation inhibition aggravated the cell death. Given that mRNA stability is coupled with mRNA translation, and this coupling is mediated by codon composition of mRNAs (Wu et al., 2019), we sought to analyze the codon composition of differentially stabilized/destabilized mRNAs after CHX or ActD co-treatment with ferroptosis inducers starting by analyzing synonymous codon usage. Synonymous codon usage is calculated by analyzing the occurrence of a given codon in comparison to other codons encoding the same amino acid, giving us a look into codon usage biases and codon optimality during translation.
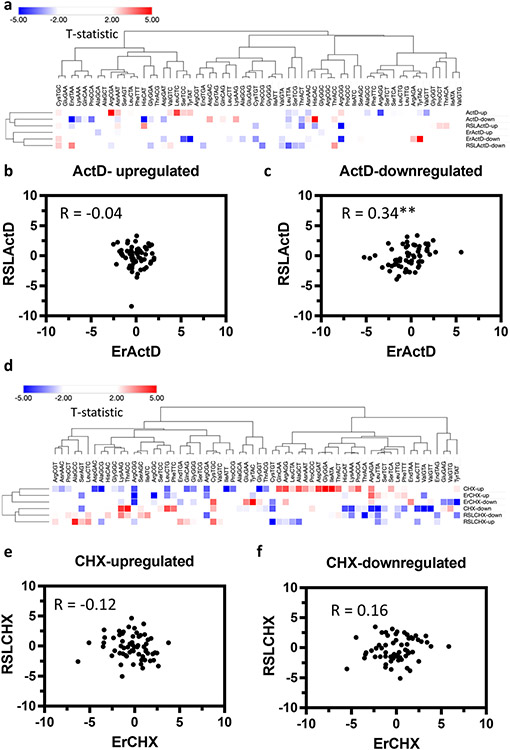
First, we looked at the ActD dataset. Principal component analysis (PCA) of the 3 groups in this dataset did not reveal clear-cut differences in codon composition between the groups in either up- (stabilized mRNAs) or down-regulated mRNAs (destabilized mRNAs) [Supplementary Fig. 6a]. Partial least square regression analysis (PLSR) on each of the conditions separately revealed clear cut differences in codon composition and usage between the up- and down-regulated mRNAs [Supplementary Fig. 7]. However, this distinction was less robust in the Erastin + ActD and RSL3 + ActD groups than in ActD only treatment. Analysis of individual codon usage in each condition via heatmap plot and clustering via hierarchical clustering revealed distinct and unique patterns of codon over or under usage in each condition’s up and down regulated (stabilized) mRNAs [Fig. 10a]. Clustering analysis did not, however, reveal significant clustering patterns of Erastin vs RSL3 co-treated with ActD [Fig. 10a]. To further elucidate the differences between Erastin and RSL3 co-treatment with ActD, we conducted Pearson’s correlation analysis between both conditions on up and down stabilized mRNAs separately. It was clear that in the upregulated (more stabilized) mRNAs, there was no correlation whatsoever between the two conditions (R = −0.04) [Fig. 10b]. While in the downregulated (less stabilized) mRNAs, there was a very modest correlation (R = 0.34) [Fig. 10c]. Compared with the more significant correlation observed when comparing the gene lists [Supplementary Fig. 5a], it becomes clear that analyzing codons as a measure of translational shifts provides a clearer understanding of the differences between the two conditions in terms of translational cellular responses.
Fig. 10. Synonymous codon usage (CSU) and optimality observed following mRNA stability alterations.
(a) Heatmap of codon usage in the ActD dataset. Up indicates genes with increased stability while down indicates genes with reduced stability. (b, c) Pearson’s correlation coefficient analysis between up and down regulated mRNAs (respectively) in the Erastin and RSL3 datasets. d. Heatmap of codon usage in the CHX dataset. (e, f) Pearson’s correlation coefficient analysis between up and down regulated mRNAs (respectively) in the Erastin and RSL3 datasets. Asterisk. Statistically significant (P < 0.001).
Next, we repeated the same analysis for the CHX dataset. While ActD improved cell viability after Erastin stress, but had no impact on RSL3, CHX had a more profound impact on RSL3 leading to extensive cell death. This led to the hypothesis that translation plays a more profound role in how cells respond to different canonical ferroptosis inducers, and thus we anticipated stronger patterns of divergence on codon analysis. Indeed, PCA revealed more divergent clustering of Erastin and RSL3 when co-treated with CHX [Supplementary Fig. 6b]. PLSR analysis for each of the conditions separately revealed clear cut differences in codon composition and usage between the up- and down-regulated mRNAs [Supplementary Fig. 8]. Importantly, we observed more separation between up and down stabilized mRNAs, and in consequence their codon composition, in CHX alone or with Erastin co-treatment compared to RSL3 plus CHX treatment [Supplementary Fig. 8]. Analysis of individual codon usage revealed distinct clustering patterns between RSL3 and Erastin [Fig. 10d]. For example, mRNAs up regulated (more stable) in the Erastin + CHX clustered closely with upregulated mRNAs in the CHX only group. On the other hand, the downregulated (less stable) mRNAs in the RSL3 + CHX group clustered more closely with the downregulated mRNAs in the CHX only group. There was also a clear clustering pattern of codons in which A/T ending codons were enriched in one cluster while G/C ending codons were enriched in another [Fig. 10d]. This codon clustering pattern was not observed in the ActD dataset [Fig. 10a]. Correlation analysis between the up and downregulated (up and down stabilized) mRNAs in the Erastin or RSL3 cotreatment with CHX revealed no correlation whatsoever (R = −0.12 and 0.16 respectively), which can be understood in light of the divergent cellular response to either drug in the presence of CHX.
Global codon usage (GCU) and mRNA stability in ferroptosis
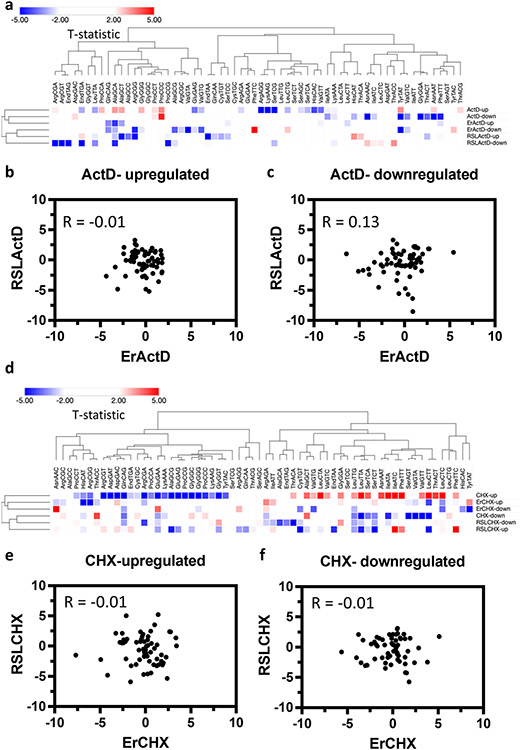
During oxidative stress, tRNA expression changes can significantly impact amino acid delivery to translation sites, altering the global mRNA translotome (Torrent et al., 2018). To understand global translational trends, we analyzed the Global codon usage (GCU), which is calculated by analyzing the occurrence of each codon relative to all other codons for all amino acids. Clustering patterns revealed minor differences from what was observed in the SCU analysis in both ActD and CHX datasets [Fig. 11a, d]. Pearson’s correlation coefficient also revealed no correlation between Erastin and RSL3 in both ActD and CHX [Fig. 11b, c and e, f]. In fact, there was less correlation compared to what was observed with SCU in some datasets. Interestingly, the clustering pattern of codons with A/T ending vs G/C ending observed in the SCU analysis of CHX datasets was not observed in GCU datasets, indicating that this clustering pattern is unique to codon bias and optimality but not to global codon usage in line with previously published work (Hia et al., 2019).
Fig. 11. Global codon usage (GCU) changes after ferroptosis.
(a) Heatmap of codon usage in the ActD dataset. Up indicates genes with increased stability while down indicates genes with reduced stability. (b, c) Pearson’s correlation coefficient analysis between up and down regulated mRNAs (respectively) in the Erastin and RSL3 datasets. (d) Heatmap of codon usage in the CHX dataset. (e, f) Pearson’s correlation coefficient analysis between up and down regulated mRNAs (respectively) in the Erastin and RSL3 datasets.
Overall, it is clear from our data that translational regulation of mRNA stability evident at codon level changes plays important role in regulating cellular stress responses to different ferroptosis inducers classes.
Alkbh1 mediated translation repression in glioma and ferroptosis sensitivity
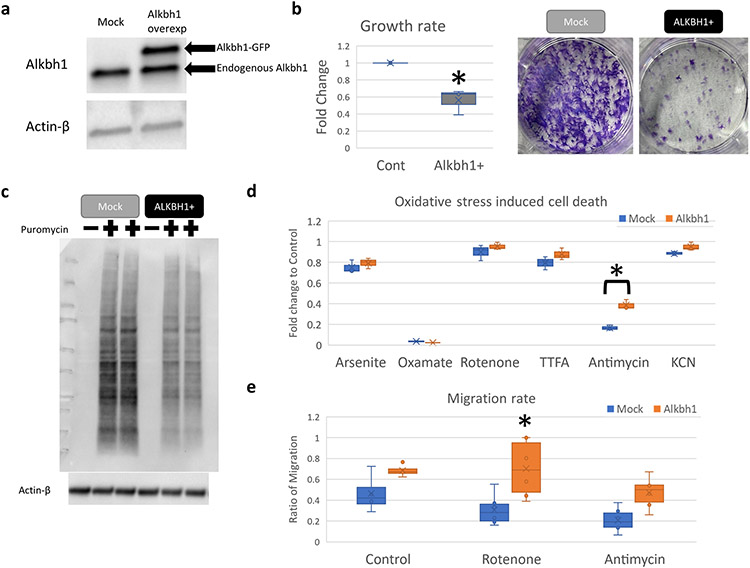
Based on our results, we hypothesized that a repressed global protein translation cellular landscape would be beneficial against Erastin but deleterious when cells are treated with RSL3. In addition to that, our data implicates mRNA stability changes, mediated via codon composition and translational shifts to play an important role in how cells respond to different ferroptosis inducing agents. It was shown that codon usage and composition impact on mRNA stability is mediated via tRNA levels (Wu et al., 2019;). Translation repression is known to occur in several cancers via tRNA modifications driven process (Rosselló-Tortella et al., 2020). Ferroptosis is important in cancer biology, with many aspects of tumor behavior and microenvironment heavily dependent on the tumor susceptibility or resistance to ferroptosis (Liu et al., 2020b; Xu et al., 2021). Moreover, several anti-cancer therapies for ferroptosis are being considered (Hassannia et al., 2018). Thus, understanding the nuances of tumor response to ferroptosis inducing agents is paramount in the quest to treat various cancers. To that end, we chose Alkbh1 as a target gene for our evaluation. Alkbh1 is associated with worse outcome in Glioblastoma (GB) patients (Xie et al., 2018). Alkbh1 is a tRNA demethylase that acts on 1-methyladenosine (m1A) leading to tRNA hypomodifications, reduced tRNA stability, and translation repression (Liu et al., 2016; Rashad et al., 2020;). Alkbh1 was also shown to modulate m5C and f5C modifications in tRNA (Arguello et al., 2022). To test for our hypothesis, we generated cells overexpressing Alkbh1 using lentiviral transfection of rat 9L gliosarcoma cell line, which simulates high grade glioma [Fig. 12a]. Cells overexpressing Alkbh1 had slower growth rates and protein translation rates, which are consistent with its previously observed tRNA demethylation activity (Liu et al., 2016) [Fig. 12b, c]. Alkbh1 overexpressing cells were more resistant to complex III inhibition via Antimycin A (contrary to previous observation (Rashad et al., 2020; Kawarada et al., 2017)) [Fig. 12d] and had paradoxical faster migration rates than control cells under normal conditions and in the presence of mitochondrial oxidative stress inducing agents that are known to induce mitochondrial dysfunction induced senescence (MIDAS) (Wiley et al., 2016); Antimycin A and Rotenone [Fig. 12e, supplementary Fig. 9]. Alkbh1 mediated resistance to MIDAS was more evident with Rotenone induced mitochondrial dysfunction, in-line with the role of Alkbh1 in regulating respiratory complex I activity (Kawarada et al., 2017).
Fig. 12. Alkbh1 overexpression in glioma cells alters growth and translation.
(a) Confirmation of Alkbh1 expression in 9L gliosarcoma cells using western blotting. Alkbh1 fused with GFP was robustly detected. (b) Alkbh1 overexpressing cells (Alkbh1 +) had slower growth rate as evident by WST-8 assay (Graph) and Cresol violet staining (Photos). (c) Western blot analysis of puromycin incorporation assay reveals reduced global protein translation in Alkbh1 + cells. (d) Glioma cells were exposed to toxic doses of Arsenite (endoplasmic reticulum stress, non-specific), sodium Oxamate (LDH inhibitor), Rotenone (Mitochondrial respiratory Complex I inhibitor), TTFA (Complex II), Antimycin (Complex III), and KcN (potassium cyanide; Complex IV). Alkbh1 + cells were more resistant to Complex III inhibition. (e) Analysis of cell migration using Scratch test shows that Alkbh1 + cells migrate faster than Mock cells, this is especially evident when Rotenone was added.
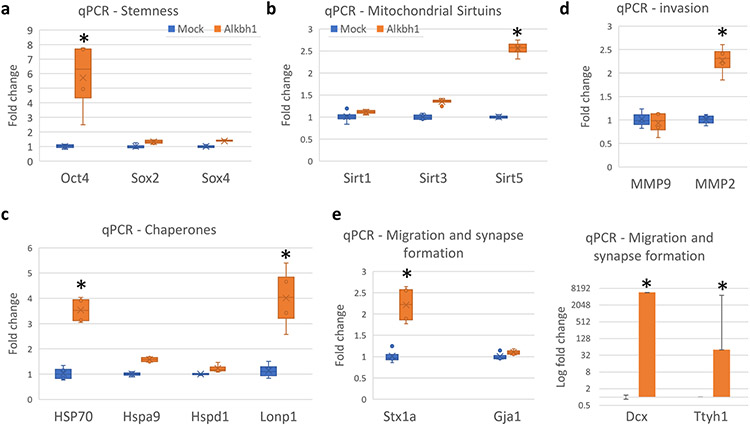
Next, we analyzed genes that can explain the observed behavior of Alkbh1 overexpressing cells or the cause of worsened outcome in glioblastoma with high Alkbh1 expression. qPCR analysis revealed upregulation of Oct4, the stemness marker which is associated with enhances proliferation and colony formation in glioma cells (Du et al., 2009) [Fig. 13a]. Sox2 and Sox4 expression did not change with Alkbh1 overexpression [Fig. 13a]. Alkbh1 is known to impact mitochondrial activity and to localize into the mitochondria (Kawarada et al., 2017; Rashad et al., 2020; 2021). To evaluate its impact on glioma mitochondrial function we evaluated several mitochondrial Sirtuin genes expression levels [Fig. 13b]. Only Sirt5 was upregulated after Alkbh1 overexpression. Sirt5 is associated with more resistance to MIDAS (Wiley et al., 2016) and can support tumorigenesis in breast cancer (Greene et al., 2019). Examination of the cytosolic and mitochondrial chaperones revealed strong upregulation of Hsp70 and Lonp1 [Fig. 13c], which signifies activation of the unfolded protein responses and better handling of misfolded proteins (Terrab and Wipf, 2020; Shin et al., 2021). Hsp70 plays important role on glioma pathogenesis via various mechanisms including apoptosis evasion, angiogenesis, and supporting mutated proteins and genome instability (Iglesia et al., 2019). Lonp1 also plays important role in glioma and is associated with worse outcome (Di et al., 2016). MMP2 expression was also upregulated signifying enhanced tumor invasion (Yu et al., 2017) [Fig. 13d]. Finally, we evaluated genes that are associated with glioma migration. Stx1a, Doublecortin (Dcx), and Ttyh1 were extremely upregulated after Alkbh1 expression [Fig. 13e]. Interestingly, these genes are associated not only with glioma migration and invasion, but also with synaptic development and intercellular communication and neurotransmitter signalling (Jung et al., 2019). This can represent an interesting mechanism by which Alkbh1 promotes glioma progression via activating the neurogenic pathways and synaptic development (Venkataramani et al., 2019). Overall, this data indicates that Alkbh1 supports glioma progression and invasion via multiple mechanisms including better proteostasis in the cells via protein translation repression and activation of the heat shock and chaperone proteins, promoting invasiveness, activation of mitochondrial Sirtuin network, and promoting synaptic formation.
Fig. 13.
qPCR gene expression analysis of various genes impacting glioma behavior in Alkbh1 + cells.
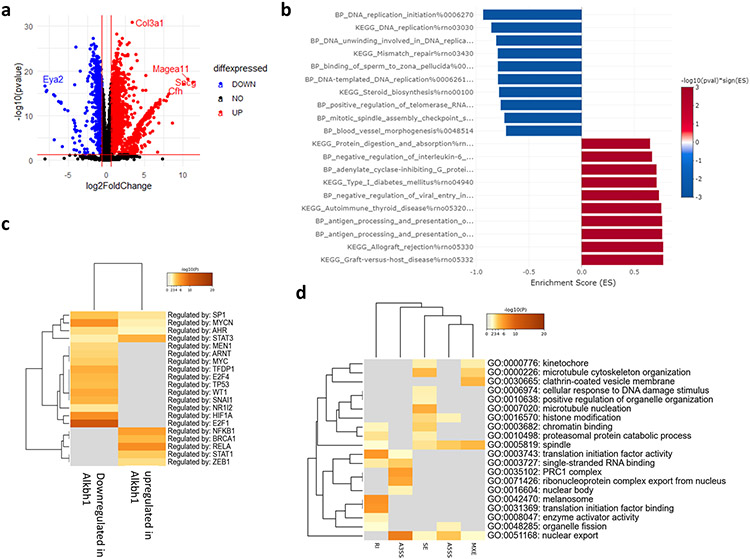
mRNA sequencing revealed hundreds of genes to be differentially expressed in Alkbh1 cells vs Mock transfected cells [Fig. 14a]. Gene enrichment analysis revealed a significance downregulation of pathways related to DNA replication and cell division and upregulation of pathways related to cellular immune responses [Fig. 14b]. Analysis of transcription factors motifs (TFs) that might be responsible for the gene expression pattern revealed E2F1 and HIF-1α motifs are the top enriched in the downregulated genes while RELA/P65 and NF-κβ targets are most enriched in upregulated genes [Fig. 14c]. E2F1 and HIF1A are associated with reduced migration and tumorigenesis in glioma (Fueyo et al., 1998; Méndez et al., 2010). Down-regulating gene targets of both TFs signifies enhanced invasion and migration of glioma cells, in concordance with our observations. Activation of NF-κβ/RELA/p65 pathway is on the other hands associated with enhanced migration, stemness, proinflammatory response in tumor, and resistance to therapy (Puliyappadamba et al., 2014; Bhargava et al., 2017; Srivastava et al., 2020). This is also in-line with our observations above. Alternative splicing analysis revealed enrichment and depletion of hundreds of AS events in Alkbh1 overexpressing cells. The most significant AS program was skipped exon (SE), while other types showed relatively equal number of LSV events [Supplementary Table 3]. GO analysis revealed several pathways related to protein translation and quality control as well as histone and chromatic related activities to be highly enriched in AS dataset [Fig. 14d]. Overall, Alkbh1 drives a transcriptional and epitranscriptional program that promotes glioma migration, invasion, immune modulation, and stemness while suppressing DNA replication and cell division at the same time.
Fig. 14. RNA-seq analysis of Alkbh1 impact on cellular transcriptome.
(a) Volcano plot showing hundreds of DEGs between Mock and Alkbh1 + cells. (b) GSEA analysis reveals downregulation of pathways related to DNA replication and cell growth and upregulation of immune-related pathways. (c) Transcription factors (TF) analysis reveals that the downregulated genes are mostly regulated via E2F1 and HIF-1α, while the upregulated genes are regulated via NF-κβ/RELA system. (d) Gene enrichment analysis of changes in alternative splicing induced by Alkbh1 overexpression.
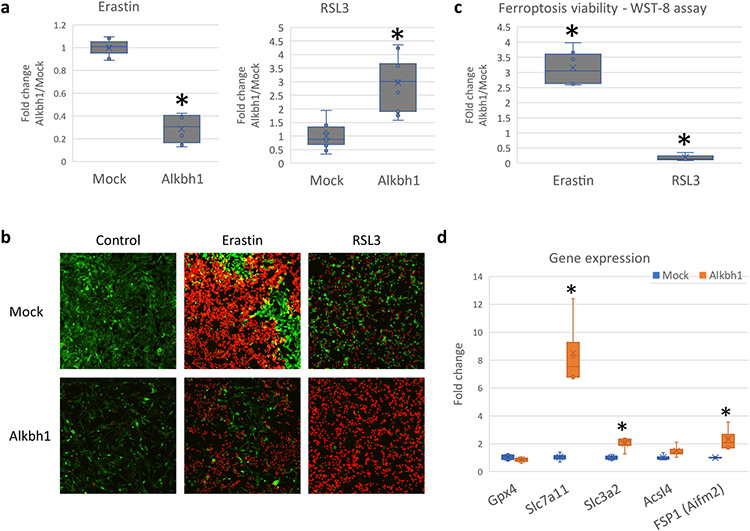
Finally, to test our hypothesis, cells were exposed to Erastin or RSL3 and cell death observed. Alkbh1 overexpressing cells were more resistant to Erastin induced ferroptosis but were more sensitive to RSL3 induced ferroptosis [Fig. 15a-c]. This observation supports our hypothesis that cells with global translational repression would be more sensitive to RSL3 but more resistant to Erastin. We further queried important effectors in cellular sensitivity to ferroptosis via qPCR. Alkbh1 led to enhanced expression of Slc7a11 and Slc3a2, both members of the system xCT [Fig. 15d]. This can further explain the resistance of Alkbh1 overexpressing cells to Erastin induced ferroptosis (Wang et al., 2020) but cannot explain the increased sensitivity to RSL3 induced ferroptosis. Ferroptosis suppressing protein 1 (FSP1, formerly known as Aifm2 (Doll et al., 2019)) was also upregulated in Alkbh1 overexpressing cells. FSP1 is known to protect against RSL3 induced ferroptosis (Doll et al., 2019). However, this appeared to be countered by the effect of the global translational landscape of Alkbh1 overexpressing cells, with a net outcome of more sensitivity to RSL3 induced ferroptotic cell death. Collectively, Alkbh1 protects glioma cells against Erastin induced ferroptosis via protein translation repression as well as via activating members of the system xCT. The sensitivity of Alkbh1 overexpressing cells to RSL3 is, at least to a large part, derived by the translation repressive effect of Alkbh1.
Fig. 15. Alkbh1 protects glioma cells from Erastin induced ferroptosis but make them vulnerable to RSL3 induced ferroptosis.
Cells were stress with Erastin (5 μM, 24 hours) or RSL3 (1 μM, 6 hours). (a) Analysis of PI staining for dead cell counting shows much lower dead cell count in Alkbh1 + cells after Erastin treatment with reversal of that effect after RSL3 treatment. Asterisk = statistically significant (P < 0.0005) versus Mock. (b) Example of PI staining. (c) WST-8 assay showing the difference in cell viability between Alkbh1 + cells and Mock cells after Erastin or RSL3 treatment. Asterisk = statistically significant (P < 0.0005). (d) Gene expression analysis of important genes known to impact ferroptosis sensitivity. Asterisk = statistically significant (P < 0.05, Fold change > 1.5) versus Mock.
DISCUSSION
In this work we identified a strong AS program that is activated earlier and to a greater extent than transcriptional changes during cellular response to ferroptosis. The landscape of this AS program is different between Erastin and RSL3 induced ferroptosis. Further supporting the notion that while both drugs have an end phenotype of ferroptotic cell death, the road leading to this end point is vastly different epitranscriptionally as it is metabolically (Soula et al., 2020). AS is regulated by several mechanisms, including RNA binding proteins (RBPs) (Weyn-Vanhentenryck et al., 2018) and RNA modifications (Zhou et al., 2019b). Recently, several RBPs were shown to regulate ferroptosis (Zhang et al., 2018; 2020). For example, ELAVL1 knockdown, which is known to impact AS of different mRNAs (Lee et al., 2021), was shown to protect against Erastin (Zhang et al., 2018). However, a global understanding of the functions of different RBPs and the role of Alternative splicing remains largely unexplored in ferroptosis.
Our data also provides novel links between CHX and the activation of the reverse transsulfuration pathway and this mechanism’s potential for protecting against Erastin induced ferroptosis. Transsulfuration pathway is a well-known process for the regeneration of GSH (Sbodio et al., 2019). Thus, in translationally repressed cells, a shift to GSH generation from Homocysteine can accommodate for the loss of Cystine, which is a consequence of Erastin induced inhibition of system xCT (Hayano et al., 2016; Liu et al., 2020a; Stockwell and Jiang, 2020). Interestingly, this mechanism appears to not be functioning in transcription repression mediated blockade of Erastin induced ferroptosis, nor it has any bearing on RSL3 induced ferroptosis.
One of the most interesting, and certainly more important finds, in this work, is the observed role of mRNA stability and codon usage on cellular response to different ferroptosis inducing agents. mRNA stability is mediated by various factors, including 3′UTR structure (Mishima and Tomari, 2016), mRNA secondary structure (Mauger et al., 2019), m6A mRNA modifications (Cho et al., 2021), codon optimality (Presnyak et al., 2015), and mRNA translation (Newbury et al., 1987). Codon optimality and usage have been implicated in the regulation of mRNA stability via their influence on mRNA translation fidelity, or via translational preferences for certain codons in several studies (Presnyak et al., 2015; Mishima and Tomari, 2016). mRNA stability was shown to play a role in bacterial and yeast responses to stresses (Marguerat et al., 2014; Vargas-Blanco and Shell, 2020), however, this was not studied in higher eukaryotes to the best of our knowledge. It’s known that during oxidative stress, tRNA expression changes (Torrent et al., 2018) or changes in tRNA modifications (Chan et al., 2012; Chionh et al., 2016) can lead to translational shifts and changes in codon usage and optimality to adapt to stress (Bae and Coller, 2022). These responses were characterized in yeast and bacteria but not very well understood in higher eukaryotes. Furthermore, the links between oxidative stress, translational shifts, and mRNA stability have not been studied previously. In this work we provide first evidence, to the best of our knowledge, that ferroptosis, as a model for oxidative stress, can lead to specific changes in mRNA stability that are mechanism-specific, as evident by the differences in codon usage and biases between Class I and II ferroptosis inducers. Importantly, it appears from our analysis that considering codons is more insightful to divergent or convergent mechanisms governing translational shifts during stress and impacting mRNA stability. It will be interesting in future work to further characterize how different stresses and programmable cell death (PCD) mechanisms impact mRNA stability and codon optimality and biases in mammalian cell lines and what conserved mechanisms do exist in cellular stress responses and what mechanisms are stress-type specific.
mRNA translation and stability have been shown to be regulated via tRNA levels and modifications (Wu et al., 2019). We previously observed a role of tRNA methylation in regulating cellular responses to different oxidative stresses (Rashad et al., 2020; 2021). Furthermore, the observed effect of CHX in our presented work on Erastin and RSL3 implicates translation repression, in addition to mRNA stability and codon usage, as important determinant for cellular responses to ferroptosis inducers. To that end, we evaluated the impact of tRNA modifications, mediated by Alkbh1, on cellular response to Erastin or RSL3. Alkbh1 demethylates m1A leading to translation repression (Liu et al., 2016; Rashad et al., 2020). Based on our hypothesis, this should lead to increased resistance of the cells to Erastin while it should lead to heightened sensitivity to RSL3, which we observed in our analysis. tRNA expression and modifications (the tRNA epitranscriptome) have been implicated in a number of cancers including breast and colon cancers (Goodarzi et al., 2016; Rosselló-Tortella et al., 2020). Thus, understanding the impact of tRNA changes on translation, codon usage, and mRNA stability can help identify synthetic lethality of cancer cells to different ferroptosis classes, and other cancer therapeutics. This can open the doors to the utilization of tRNA epitranscriptome as a biomarker for personalizing cancer therapy. Alkbh1 overexpression worsen the survival in glioblastoma patients (Xie et al., 2018). We can argue that identification of the molecular signature of Alkbh1 activity, such as reduced tRNA methylation can be used as a biomarker to identify synthetic lethality of glioma cells in patients with higher Alkbh1 expression.
Our work provides first evidence of the links between oxidative stress, mRNA stability, and codon usage, as well as the specificity of these effects to different stress inducers, even those acting on the same pathway or PCD. We acknowledge that these new mechanisms still need more research and validation to be fully comprehended. Furthermore, the causes of the observed changes in codon usage and biases needs to be elucidated, for example by looking at the tRNA epitranscriptome or other potential translational processes that regulate cellular stress responses.
In conclusion, our results provide important links between ferroptosis stress response, mRNA translation, and mRNA stability. Our results clearly indicate that analyzing codons is more insightful on how different stresses that are closely related can impact mRNAs. Our results also indicate that mRNA stability is an important determinant of cellular fate during stress, and more studies are needed to elucidate this role in higher eukaryotes.
Supplementary Material
ACKNOWLEDGMENT
The authors report no Conflict of interest nor there are any ethical adherences.
FUNDING
This work was supported by the Japanese society for promotion of science (JSPS) grants number 20K16323 and 20KK0338 and Tohoku University Young Joint Research Encouragement Research Fund (grant number 06006015) for Sherif Rashad. This work was also supported in part by the Tohoku Medical Megabank Project from MEXT, Japan Agency for Medical Research and Development (AMED; under grant numbers JP20km0105001 and JP20km0105002) for Daisuke Saigusa. Shane R Byrne was supported by NIEHS Training Grant in Environmental Toxicology (T32-ES007020). Jingdong Xiang was supported by MIT UROP program.
Abbreviations:
- AS
Alternative splicing
- ActD
Actinomycin D
- CHX
Cycloheximide
- tRNA
transfer RNA
- UHPLC-MS/mS
Ultra high performance liquid chromatography-tandem mass spectrometry
- PCA
Principal component analysis
- PLSR
Partial least squares regression
- FIN
Ferroptosis inducing agents
- Ferr-1
Ferrostatin-1
- GSH
Glutathione
- GSSG
Oxidized Glutathione
- SAM
S-adenosylmethionine
- SAH
S-adenosyl homocysteine
- ORF
Open read frame
- SE
Skipped exons
- RI
Retained introns
- AS
Mutually exclusive exons
- A3SS
Alternative 3-prime splice site
- A5SS
Alternative 5-prime splice site
- SCU
synonymous codon usage
- GCU
Global codon usage
- m1A
1-methyladenosine
Footnotes
APPENDIX A. SUPPLEMENTARY DATA
Supplementary data to this article can be found online at https://doi.org/10.1016/j.neuroscience.2022.08.009.
DATA AVAILABILITY
Raw sequencing data were deposited at the sequence read archive (SRA) project numbers PRJNA778943 and PRJNA779470. All other data are presented in the manuscript and Supplementary figures. The raw LC-MS/MS data are presented in Supplementary Table 5.
REFERENCES
- Alim I, Caulfield JT, Chen Y, Swarup V, Geschwind DH, Ivanova E, Seravalli J, Ai Y, et al. (2019) Selenium drives a transcriptional adaptive program to block ferroptosis and treat stroke. Cell 177:1262–1279.e1225. [DOI] [PubMed] [Google Scholar]
- Arguello AE, Li A, Sun X, Eggert TW, Mairhofer E, Kleiner RE (2022) Reactivity-dependent profiling of RNA 5-methylcytidine dioxygenases. Nat Commun 13:4176. [DOI] [PMC free article] [PubMed] [Google Scholar]
- Bae H, Coller J (2022) Codon optimality-mediated mRNA degradation: Linking translational elongation to mRNA stability. Mol Cell 82:1467–1476. [DOI] [PMC free article] [PubMed] [Google Scholar]
- Bao W-D, Pang P, Zhou X-T, Hu F, Xiong W, Chen K, Wang J, Wang F, et al. (2021) Loss of ferroportin induces memory impairment by promoting ferroptosis in Alzheimer’s disease. Cell Death Differ 28:1548–1562. [DOI] [PMC free article] [PubMed] [Google Scholar]
- Bhargava S, Visvanathan A, Patil V, Kumar A, Kesari S, Das S, Hegde AS, Arivazhagan A, et al. (2017) IGF2 mRNA binding protein 3 (IMP3) promotes glioma cell migration by enhancing the translation of RELA/p65. Oncotarget 8:40469–40485. [DOI] [PMC free article] [PubMed] [Google Scholar]
- Bolger AM, Lohse M, Usadel B (2014) Trimmomatic: a flexible trimmer for Illumina sequence data. Bioinformatics 30:2114–2120. [DOI] [PMC free article] [PubMed] [Google Scholar]
- Cao J, Chen X, Jiang L, Lu B, Yuan M, Zhu D, Zhu H, He Q, et al. (2020) DJ-1 suppresses ferroptosis through preserving the activity of S-adenosyl homocysteine hydrolase. Nat Commun 11:1251. [DOI] [PMC free article] [PubMed] [Google Scholar]
- Chan LY, Mugler CF, Heinrich S, Vallotton P, Weis K (2018) Non-invasive measurement of mRNA decay reveals translation initiation as the major determinant of mRNA stability. Elife 7:e32536. [DOI] [PMC free article] [PubMed] [Google Scholar]
- Chan CTY, Pang YLJ, Deng W, Babu IR, Dyavaiah M, Begley TJ, Dedon PC (2012) Reprogramming of tRNA modifications controls the oxidative stress response by codon-biased translation of proteins. Nat Commun 3:937. [DOI] [PMC free article] [PubMed] [Google Scholar]
- Cheng X, Yan J, Liu Y, Wang J, Taubert S (2021) eVITTA: a web-based visualization and inference toolbox for transcriptome analysis. Nucleic Acids Res 49:W207–W215. [DOI] [PMC free article] [PubMed] [Google Scholar]
- Chionh YH, McBee M, Babu IR, Hia F, Lin W, Zhao W, Cao J, Dziergowska A, et al. (2016) tRNA-mediated codon-biased translation in mycobacterial hypoxic persistence. Nat Commun 7:13302. [DOI] [PMC free article] [PubMed] [Google Scholar]
- Cho S, Lee G, Pickering BF, Jang C, Park JH, He L, Mathur L, Kim SS, et al. (2021) mTORC1 promotes cell growth via m(6)A-dependent mRNA degradation. Mol Cell 81:2064–2075.e2068. [DOI] [PMC free article] [PubMed] [Google Scholar]
- Conlon M, Poltorack CD, Forcina GC, Armenta DA, Mallais M, Perez MA, Wells A, Kahanu A, et al. (2021) A compendium of kinetic modulatory profiles identifies ferroptosis regulators. Nat Chem Biol 17:665–674. [DOI] [PMC free article] [PubMed] [Google Scholar]
- Di K, Lomeli N, Wood SD, Vanderwal CD, Bota DA (2016) Mitochondrial Lon is over-expressed in high-grade gliomas, and mediates hypoxic adaptation: potential role of Lon as a therapeutic target in glioma. Oncotarget 7:77457–77467. [DOI] [PMC free article] [PubMed] [Google Scholar]
- Dixon SJ, Lemberg KM, Lamprecht MR, Skouta R, Zaitsev EM, Gleason CE, Patel DN, Bauer AJ, et al. (2012) Ferroptosis: an iron-dependent form of nonapoptotic cell death. Cell 149:1060–1072. [DOI] [PMC free article] [PubMed] [Google Scholar]
- Doll S, Proneth B, Tyurina YY, Panzilius E, Kobayashi S, Ingold I, Irmler M, Beckers J, et al. (2017) ACSL4 dictates ferroptosis sensitivity by shaping cellular lipid composition. Nat Chem Biol 13:91–98. [DOI] [PMC free article] [PubMed] [Google Scholar]
- Doll S, Freitas FP, Shah R, Aldrovandi M, da Silva MC, Ingold I, Goya Grocin A, Xavier da Silva TN, et al. (2019) FSP1 is a glutathione-independent ferroptosis suppressor. Nature 575:693–698. [DOI] [PubMed] [Google Scholar]
- Du Z, Jia D, Liu S, Wang F, Li G, Zhang Y, Cao X, Ling EA, et al. (2009) Oct4 is expressed in human gliomas and promotes colony formation in glioma cells. Glia 57:724–733. [DOI] [PubMed] [Google Scholar]
- Fontana GA, Rigamonti A, Lenzken SC, Filosa G, Alvarez R, Calogero R, Bianchi ME, Barabino SM (2017) Oxidative stress controls the choice of alternative last exons via a Brahma-BRCA1-CstF pathway. Nucleic Acids Res 45:902–914. [DOI] [PMC free article] [PubMed] [Google Scholar]
- Fu Y, Zhuang X (2020) m(6)A-binding YTHDF proteins promote stress granule formation. Nat Chem Biol 16:955–963. [DOI] [PMC free article] [PubMed] [Google Scholar]
- Fueyo J, Gomez-Manzano C, Yung WK, Liu TJ, Alemany R, McDonnell TJ, Shi X, Rao JS, et al. (1998) Overexpression of E2F-1 in glioma triggers apoptosis and suppresses tumor growth in vitro and in vivo. Nat Med 4:685–690. [DOI] [PubMed] [Google Scholar]
- Gao M, Yi J, Zhu J, Minikes AM, Monian P, Thompson CB, Jiang X (2019) Role of Mitochondria in Ferroptosis. Mol Cell 73:354–363. e353. [DOI] [PMC free article] [PubMed] [Google Scholar]
- Goodarzi H, Nguyen HCB, Zhang S, Dill BD, Molina H, Tavazoie SF (2016) Modulated expression of specific tRNAs drives gene expression and cancer progression. Cell 165:1416–1427. [DOI] [PMC free article] [PubMed] [Google Scholar]
- Greene KS, Lukey MJ, Wang X, Blank B, Druso JE, Lin MJ, Stalnecker CA, Zhang C, et al. (2019) SIRT5 stabilizes mitochondrial glutaminase and supports breast cancer tumorigenesis. Proc Natl Acad Sci U S A 116:26625–26632. [DOI] [PMC free article] [PubMed] [Google Scholar]
- Hassannia B, Wiernicki B, Ingold I, Qu F, Van Herck S, Tyurina YY, Bayir H, Abhari BA, et al. (2018) Nano-targeted induction of dual ferroptotic mechanisms eradicates high-risk neuroblastoma. J Clin Invest 128:3341–3355. [DOI] [PMC free article] [PubMed] [Google Scholar]
- Hayano M, Yang WS, Corn CK, Pagano NC, Stockwell BR (2016) Loss of cysteinyl-tRNA synthetase (CARS) induces the transsulfuration pathway and inhibits ferroptosis induced by cystine deprivation. Cell Death Differ 23:270–278. [DOI] [PMC free article] [PubMed] [Google Scholar]
- Hia F, Yang SF, Shichino Y, Yoshinaga M, Murakawa Y, Vandenbon A, Fukao A, Fujiwara T, et al. (2019) Codon bias confers stability to human mRNAs. EMBO Rep 20:e48220. [DOI] [PMC free article] [PubMed] [Google Scholar]
- Huch S, Nissan T (2014) Interrelations between translation and general mRNA degradation in yeast. Wiley Interdiscip Rev RNA 5:747–763. [DOI] [PMC free article] [PubMed] [Google Scholar]
- Iglesia RP, Fernandes CFL, Coelho BP, Prado MB, Melo Escobar MI, Almeida G, Lopes MH (2019) Heat shock proteins in glioblastoma biology: where do we stand? Int J Mol Sci 20. [DOI] [PMC free article] [PubMed] [Google Scholar]
- Ingolia NT, Brar GA, Rouskin S, McGeachy AM, Weissman JS (2012) The ribosome profiling strategy for monitoring translation in vivo by deep sequencing of ribosome-protected mRNA fragments. Nat Protoc 7:1534–1550. [DOI] [PMC free article] [PubMed] [Google Scholar]
- Jiang X, Stockwell BR, Conrad M (2021) Ferroptosis: mechanisms, biology and role in disease. Nat Rev Mol Cell Biol 22:266–282. [DOI] [PMC free article] [PubMed] [Google Scholar]
- Jung E, Alfonso J, Osswald M, Monyer H, Wick W, Winkler F (2019) Emerging intersections between neuroscience and glioma biology. Nat Neurosci 22:1951–1960. [DOI] [PubMed] [Google Scholar]
- Kawarada L, Suzuki T, Ohira T, Hirata S, Miyauchi K, Suzuki T (2017) ALKBH1 is an RNA dioxygenase responsible for cytoplasmic and mitochondrial tRNA modifications. Nucleic Acids Res 45:7401–7415. [DOI] [PMC free article] [PubMed] [Google Scholar]
- Kim D, Paggi JM, Park C, Bennett C, Salzberg SL (2019) Graph-based genome alignment and genotyping with HISAT2 and HISAT-genotype. Nat Biotechnol 37:907–915. [DOI] [PMC free article] [PubMed] [Google Scholar]
- Lee S, Wei L, Zhang B, Goering R, Majumdar S, Wen J, Taliaferro JM, Lai EC (2021) ELAV/Hu RNA binding proteins determine multiple programs of neural alternative splicing. PLoS Genet 17:e1009439. [DOI] [PMC free article] [PubMed] [Google Scholar]
- Li Q, Cui J, Fang C, Liu M, Min G, Li L (2017) S-Adenosylmethionine attenuates oxidative stress and neuroinflammation induced by amyloid-β through modulation of glutathione metabolism. J Alzheimers Dis 58:549–558. [DOI] [PubMed] [Google Scholar]
- Lin CC, Ding CC, Sun T, Wu J, Chen KY, Zhou P, Chi JT (2021) The regulation of ferroptosis by MESH1 through the activation of the integrative stress response. Cell Death Dis 12:727. [DOI] [PMC free article] [PubMed] [Google Scholar]
- Liu F, Clark W, Luo G, Wang X, Fu Y, Wei J, Wang X, Hao Z, et al. (2016) ALKBH1-mediated tRNA demethylation regulates translation. Cell 167:816–828.e816. [DOI] [PMC free article] [PubMed] [Google Scholar]
- Liu N, Lin X, Huang C (2020a) Activation of the reverse transsulfuration pathway through NRF2/CBS confers erastin-induced ferroptosis resistance. Br J Cancer 122:279–292. [DOI] [PMC free article] [PubMed] [Google Scholar]
- Liu J, Xia X, Huang P (2020b) xCT: A critical molecule that links cancer metabolism to redox signaling. Mol Ther 28:2358–2366. [DOI] [PMC free article] [PubMed] [Google Scholar]
- Marguerat S, Lawler K, Brazma A, Bähler J (2014) Contributions of transcription and mRNA decay to gene expression dynamics of fission yeast in response to oxidative stress. RNA Biol 11:702–714. [DOI] [PMC free article] [PubMed] [Google Scholar]
- Martinez AM, Kim A, Yang WS (2020) Detection of ferroptosis by BODIPY™ 581/591 C11. Methods Mol Biol 2108:125–130. [DOI] [PubMed] [Google Scholar]
- Mauger DM, Cabral BJ, Presnyak V, Su SV, Reid DW, Goodman B, Link K, Khatwani N, et al. (2019) mRNA structure regulates protein expression through changes in functional half-life. Proc Natl Acad Sci U S A 116:24075–24083. [DOI] [PMC free article] [PubMed] [Google Scholar]
- Mehmood A, Laiho A, Venalainen MS, McGlinchey AJ, Wang N, Elo LL (2020) Systematic evaluation of differential splicing tools for RNA-seq studies. Brief Bioinform 21:2052–2065. [DOI] [PMC free article] [PubMed] [Google Scholar]
- Mendez O, Zavadil J, Esencay M, Lukyanov Y, Santovasi D, Wang S-C, Newcomb EW, Zagzag D (2010) Knock down of HIF-1α in glioma cells reduces migration in vitro and invasion in vivo and impairs their ability to form tumor spheres. Molecular Cancer 9:133. [DOI] [PMC free article] [PubMed] [Google Scholar]
- Mishima Y, Tomari Y (2016) Codon usage and 3’ UTR length determine maternal mRNA stability in zebrafish. Mol Cell 61:874–885. [DOI] [PubMed] [Google Scholar]
- Newbury SF, Smith NH, Robinson EC, Hiles ID, Higgins CF (1987) Stabilization of translationally active mRNA by prokaryotic REP sequences. Cell 48:297–310. [DOI] [PubMed] [Google Scholar]
- Nishizawa H, Matsumoto M, Shindo T, Saigusa D, Kato H, Suzuki K, Sato M, Ishii Y, et al. (2020) Ferroptosis is controlled by the coordinated transcriptional regulation of glutathione and labile iron metabolism by the transcription factor BACH1. J Biol Chem 295:69–82. [DOI] [PMC free article] [PubMed] [Google Scholar]
- Ohh M, Takei F (1995) Regulation of ICAM-1 mRNA stability by cycloheximide: role of serine/threonine phosphorylation and protein synthesis. J Cell Biochem 59:202–213. [DOI] [PubMed] [Google Scholar]
- Ouyang Y, Wu Q, Li J, Sun S, Sun S (2020) S-adenosylmethionine: A metabolite critical to the regulation of autophagy. Cell Prolif 53: e12891. [DOI] [PMC free article] [PubMed] [Google Scholar]
- Pertea M, Kim D, Pertea GM, Leek JT, Salzberg SL (2016) Transcript-level expression analysis of RNA-seq experiments with HISAT, StringTie and Ballgown. Nat Protoc 11:1650–1667. [DOI] [PMC free article] [PubMed] [Google Scholar]
- Presnyak V, Alhusaini N, Chen YH, Martin S, Morris N, Kline N, Olson S, Weinberg D, et al. (2015) Codon optimality is a major determinant of mRNA stability. Cell 160:1111–1124. [DOI] [PMC free article] [PubMed] [Google Scholar]
- Puliyappadamba VT, Hatanpaa KJ, Chakraborty S, Habib AA (2014) The role of NF-κβ in the pathogenesis of glioma. Mol Cell Oncol 1: e963478. [DOI] [PMC free article] [PubMed] [Google Scholar]
- Rashad S, Han X, Sato K, Mishima E, Abe T, Tominaga T, Niizuma K (2020) The stress specific impact of ALKBH1 on tRNA cleavage and tiRNA generation. RNA Biol 17:1092–1103. [DOI] [PMC free article] [PubMed] [Google Scholar]
- Rashad S, Tominaga T, Niizuma K (2021) The cell and stress-specific canonical and noncanonical tRNA cleavage. J Cell Physiol 236:3710–3724. [DOI] [PubMed] [Google Scholar]
- Ritchie ME, Phipson B, Wu D, Hu Y, Law CW, Shi W, Smyth GK (2015) limma powers differential expression analyses for RNA-sequencing and microarray studies. Nucleic Acids Res 43:e47. [DOI] [PMC free article] [PubMed] [Google Scholar]
- Rosselló-Tortella M, Llinàs-Arias P, Sakaguchi Y, Miyauchi K, Davalos V, Setien F, Calleja-Cervantes ME, Piñeyro D, et al. (2020) Epigenetic loss of the transfer RNA-modifying enzyme TYW2 induces ribosome frameshifts in colon cancer. Proc Natl Acad Sci U S A 117:20785–20793. [DOI] [PMC free article] [PubMed] [Google Scholar]
- Santos DA, Shi L, Tu BP, Weissman JS (2019) Cycloheximide can distort measurements of mRNA levels and translation efficiency. Nucleic Acids Res 47:4974–4985. [DOI] [PMC free article] [PubMed] [Google Scholar]
- Sbodio JI, Snyder SH, Paul BD (2019) Regulators of the transsulfuration pathway. Br J Pharmacol 176:583–593. [DOI] [PMC free article] [PubMed] [Google Scholar]
- Shalgi R, Hurt JA, Lindquist S, Burge CB (2014) Widespread inhibition of posttranscriptional splicing shapes the cellular transcriptome following heat shock. Cell Rep 7:1362–1370. [DOI] [PubMed] [Google Scholar]
- Shen S, Park JW, Lu ZX, Lin L, Henry MD, Wu YN, Zhou Q, Xing Y (2014) rMATS: robust and flexible detection of differential alternative splicing from replicate RNA-Seq data. Proc Natl Acad Sci U S A 111:E5593–E5601. [DOI] [PMC free article] [PubMed] [Google Scholar]
- Shin CS, Meng S, Garbis SD, Moradian A, Taylor RW, Sweredoski MJ, Lomenick B, Chan DC (2021) LONP1 and mtHSP70 cooperate to promote mitochondrial protein folding. Nat Commun 12:265. [DOI] [PMC free article] [PubMed] [Google Scholar]
- Soula M, Weber RA, Zilka O, Alwaseem H, La K, Yen F, Molina H, Garcia-Bermudez J, et al. (2020) Metabolic determinants of cancer cell sensitivity to canonical ferroptosis inducers. Nat Chem Biol 16:1351–1360. [DOI] [PMC free article] [PubMed] [Google Scholar]
- Srivastava C, Irshad K, Gupta Y, Sarkar C, Suri A, Chattopadhyay P, Sinha S, Chosdol K (2020) NFκβ is a critical transcriptional regulator of atypical cadherin FAT1 in glioma. BMC Cancer 20:62. [DOI] [PMC free article] [PubMed] [Google Scholar]
- Stockwell BR, Jiang X (2020) The chemistry and biology of ferroptosis. Cell Chem Biol 27:365–375. [DOI] [PMC free article] [PubMed] [Google Scholar]
- Terrab L, Wipf P (2020) Hsp70 and the unfolded protein response as a challenging drug target and an inspiration for probe molecule development. ACS Med Chem Lett 11:232–236. [DOI] [PMC free article] [PubMed] [Google Scholar]
- Torrent M, Chalancon G, de Groot NS, Wuster A, Madan Babu M (2018) Cells alter their tRNA abundance to selectively regulate protein synthesis during stress conditions. Sci Signal:11. [DOI] [PMC free article] [PubMed] [Google Scholar]
- Tumu S, Patil A, Towns W, Dyavaiah M, Begley TJ (2012) The gene-specific codon counting database: a genome-based catalog of one-, two-, three-, four- and five-codon combinations present in Saccharomyces cerevisiae genes. Database. [DOI] [PMC free article] [PubMed] [Google Scholar]
- Vargas-Blanco DA, Shell SS (2020) Regulation of mRNA stability during bacterial stress responses. Front Microbiol 11:2111. [DOI] [PMC free article] [PubMed] [Google Scholar]
- Venkataramani V, Tanev DI, Strahle C, Studier-Fischer A, Fankhauser L, Kessler T, Korber C, Kardorff M, et al. (2019) Glutamatergic synaptic input to glioma cells drives brain tumour progression. Nature 573:532–538. [DOI] [PubMed] [Google Scholar]
- Wang HF, Feng L, Niu DK (2007) Relationship between mRNA stability and intron presence. Biochem Biophys Res Commun 354:203–208. [DOI] [PMC free article] [PubMed] [Google Scholar]
- Wang L, Liu Y, Du T, Yang H, Lei L, Guo M, Ding H-F, Zhang J, et al. (2020) ATF3 promotes erastin-induced ferroptosis by suppressing system Xc–. Cell Death Differ 27:662–675. [DOI] [PMC free article] [PubMed] [Google Scholar]
- Weyn-Vanhentenryck SM, Feng H, Ustianenko D, Duffié R, Yan Q, Jacko M, Martinez JC, Goodwin M, et al. (2018) Precise temporal regulation of alternative splicing during neural development. Nat Commun 9:2189. [DOI] [PMC free article] [PubMed] [Google Scholar]
- Wiley CD, Velarde MC, Lecot P, Liu S, Sarnoski EA, Freund A, Shirakawa K, Lim HW, et al. (2016) Mitochondrial dysfunction induces senescence with a distinct secretory phenotype. Cell Metab 23:303–314. [DOI] [PMC free article] [PubMed] [Google Scholar]
- Wu Q, Medina SG, Kushawah G, DeVore ML, Castellano LA, Hand JM, Wright M, Bazzini AA (2019) Translation affects mRNA stability in a codon-dependent manner in human cells. eLife 8:e45396. [DOI] [PMC free article] [PubMed] [Google Scholar]
- Xiao Y, Xia J, Cheng J, Huang H, Zhou Y, Yang X, Su X, Ke Y, et al. (2019) Inhibition of S-adenosylhomocysteine hydrolase induces endothelial dysfunction via epigenetic regulation of p66shc-mediated oxidative stress pathway. Circulation 139:2260–2277. [DOI] [PubMed] [Google Scholar]
- Xie Q, Wu TP, Gimple RC, Li Z, Prager BC, Wu Q, Yu Y, Wang P, et al. (2018) N(6)-methyladenine DNA Modification in Glioblastoma. Cell 175:1228–1243.e1220. [DOI] [PMC free article] [PubMed] [Google Scholar]
- Xu H, Ye D, Ren M, Zhang H, Bi F (2021) Ferroptosis in the tumor microenvironment: perspectives for immunotherapy. Trends Mol Med. [DOI] [PubMed] [Google Scholar]
- Yang WS, SriRamaratnam R, Welsch ME, Shimada K, Skouta R, Viswanathan VS, Cheah JH, Clemons PA, et al. (2014) Regulation of ferroptotic cancer cell death by GPX4. Cell 156:317–331. [DOI] [PMC free article] [PubMed] [Google Scholar]
- Yang E, van Nimwegen E, Zavolan M, Rajewsky N, Schroeder M, Magnasco M, Darnell JE Jr (2003) Decay rates of human mRNAs: correlation with functional characteristics and sequence attributes. Genome Res 13:1863–1872. [DOI] [PMC free article] [PubMed] [Google Scholar]
- Yu CF, Chen FH, Lu MH, Hong JH, Chiang CS (2017) Dual roles of tumour cells-derived matrix metalloproteinase 2 on brain tumour growth and invasion. Br J Cancer 117:1828–1836. [DOI] [PMC free article] [PubMed] [Google Scholar]
- Zhang Z, Yao Z, Wang L, Ding H, Shao J, Chen A, Zhang F, Zheng S (2018) Activation of ferritinophagy is required for the RNA-binding protein ELAVL1/HuR to regulate ferroptosis in hepatic stellate cells. Autophagy 14:2083–2103. [DOI] [PMC free article] [PubMed] [Google Scholar]
- Zhang Z, Guo M, Li Y, Shen M, Kong D, Shao J, Ding H, Tan S, et al. (2020) RNA-binding protein ZFP36/TTP protects against ferroptosis by regulating autophagy signaling pathway in hepatic stellate cells. Autophagy 16:1482–1505. [DOI] [PMC free article] [PubMed] [Google Scholar]
- Zheng J, Conrad M (2020) The metabolic underpinnings of ferroptosis. Cell Metab 32:920–937. [DOI] [PubMed] [Google Scholar]
- Zheng JT, Lin CX, Fang ZY, Li HD (2020) Intron Retention as a Mode for RNA-Seq Data Analysis. Front Genet 11:586. [DOI] [PMC free article] [PubMed] [Google Scholar]
- Zhou KI, Shi H, Lyu R, Wylder AC, Matuszek Ż, Pan JN, He C, Parisien M, et al. (2019) Regulation of co-transcriptional pre-mRNA splicing by m(6)A through the low-complexity protein hnRNPG. Mol Cell 76:70–81.e79. [DOI] [PMC free article] [PubMed] [Google Scholar]
- Zhou Y, Zhou B, Pache L, Chang M, Khodabakhshi AH, Tanaseichuk O, Benner C, Chanda SK (2019) Metascape provides a biologist-oriented resource for the analysis of systems-level datasets. Nat Commun 10:1523. [DOI] [PMC free article] [PubMed] [Google Scholar]
- Zille M, Kumar A, Kundu N, Bourassa MW, Wong VSC, Willis D, Karuppagounder SS, Ratan RR (2019) Ferroptosis in neurons and cancer cells is similar but differentially regulated by histone deacetylase inhibitors. eNeuro 6. [DOI] [PMC free article] [PubMed] [Google Scholar]
Associated Data
This section collects any data citations, data availability statements, or supplementary materials included in this article.
Supplementary Materials
Data Availability Statement
Raw sequencing data were deposited at the sequence read archive (SRA) project numbers PRJNA778943 and PRJNA779470. All other data are presented in the manuscript and Supplementary figures. The raw LC-MS/MS data are presented in Supplementary Table 5.


