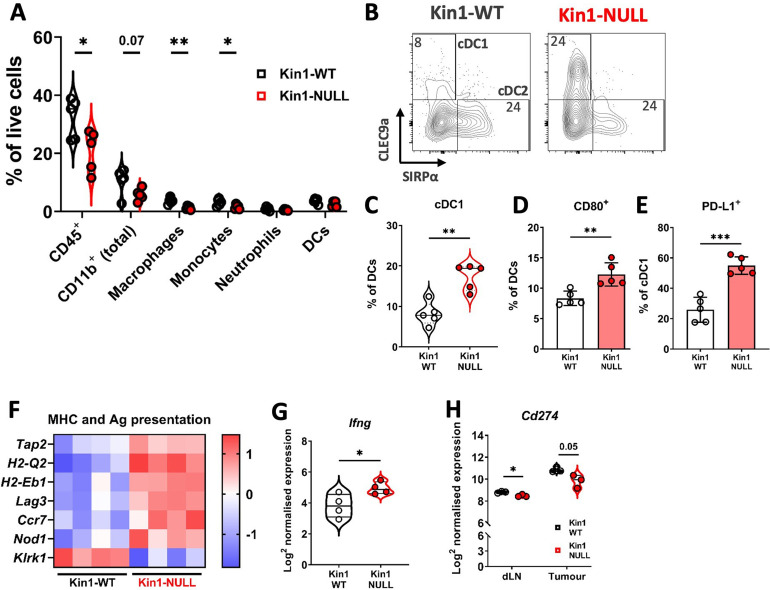
Figure 2. Loss of Kindlin-1 reduces tumor associated macrophages and increases cDC1 dendritic cells.
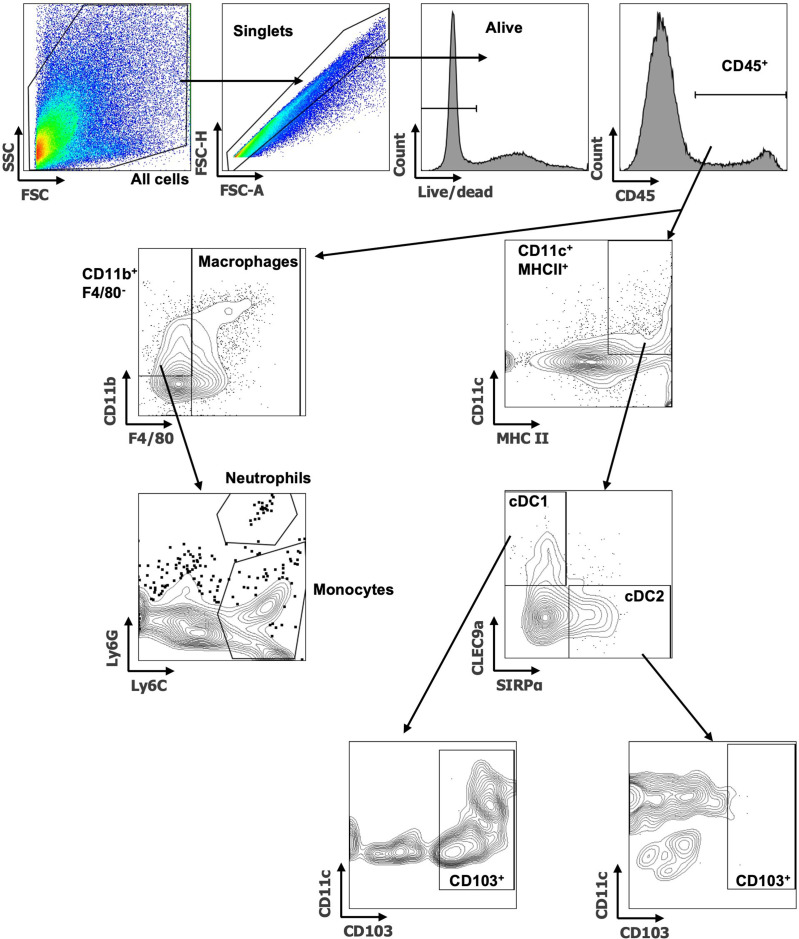
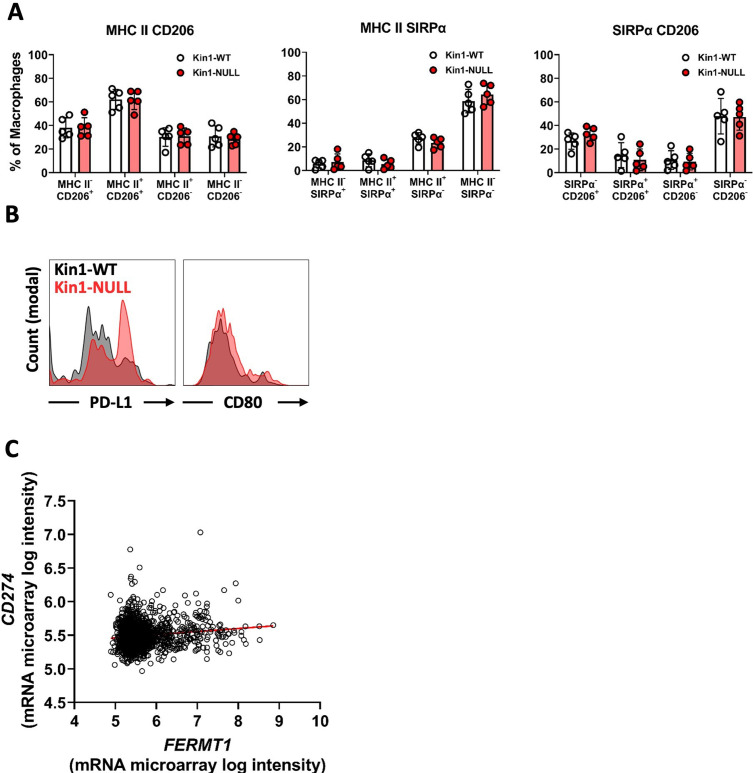
(A) Met-1 Kin1-WT or Kin1-NULL tumors were established via subcutaneous injection in FVB mice, and harvested at day 10 for immunophenotyping by flow cytometry. Major myeloid populations were quantified as a percentage of live (total) cells. Gating demonstrated in Figure 2—figure supplement 1. (B) Raw FACS plots demonstrating gating of cDC1 and cDC2 cells, and quantified (C) as a percentage of total DCs (CD11c+ MHC II+). (D) Quantification of CD80 expression on total DCs by flow cytometry. (E) Quantification of PD-L1 expression on cDC1 cells. (F) As in A but bulk tumors were harvested for RNA expression analysis using Nanostring PanCancer Immune panel. Differentially expressed genes related to the gene sets ‘MHC’ and ‘Antigen (Ag) presentation’ are shown. (G) Expression of Ifng using Nanostring PanCancer Immune panel comparing Met-1 Kin1-WT and Kin1-NULL cells. (H) Expression of Cd274 (PD-L1) on isolated CD45+ cells using Nanostring Immune Exhaustion panel comparing draining lymph nodes (dLN) and tumors from Met-1 Kin1-WT and Kin1-NULL tumor bearing mice. Example of two independent experiments (A–E), n=3–5 per group, error bars = SD. For F, fold change cut off = 1.2, FDR =< 0.05. Unpaired t-test with * =< 0.05, ** =< 0.01, *** =< 0.001. Further macrophage and dendritic cell profiling shown in Figure 2—figure supplement 2.


