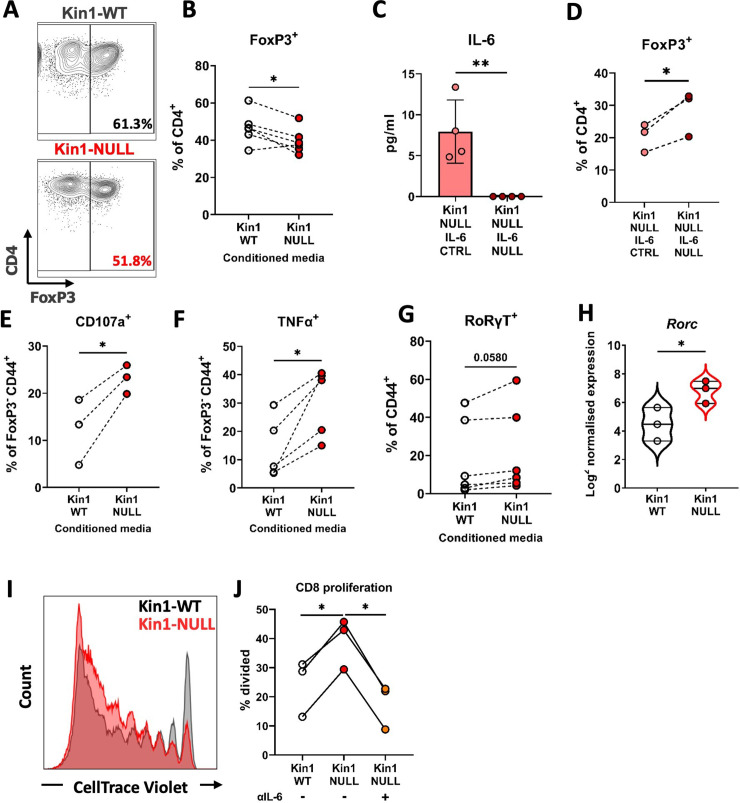
Figure 6. Loss of Kindlin-1 leads to modulation of Treg differentiation and function.
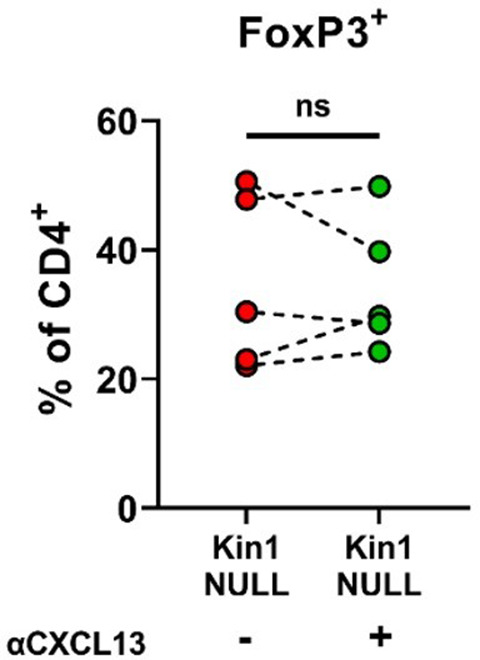
(A–B) Met-1 Kin1-WT or Kin1-NULL cells were cultured for 48 hr before conditioned media (CM) was harvested. Naïve CD4+ T cells were isolated from FVB mice spleens and stimulated in the presence of either Met-1 Kin1-WT or Kin1-NULL CM. At day 5 T cells were harvested for analysis of Treg differentiation by expression of FoxP3 (A). Example of gating is shown together with, (B) quantification as percentage of CD4+ cells. (C) Genetic knockout of IL-6 was performed in Met-1 Kin1-NULL cells (Kin1-NULL IL-6 NULL), with a no crRNA control (Kin1-NULL IL-6 CTRL). IL-6 knockout was assessed by ELISA of CM. (D) Naive CD4+ differentiation assay was performed as in A, using CM from Met-1 Kin1-NULL IL-6 NULL and CTRL cells. Analysis of Treg differentiation was conducted. Same is shown for CXCL13 blocking in Figure 6—figure supplement 1. (E, F) As in A with expression of degranulation marker CD107a (E) and functional cytokine TNFα (F) production in FoxP3- CD4 T cells. (G) As in A with quantification of RoRγT expression as a percentage of CD4+ FoxP3- CD44+ cells. (H) Rorc gene expression in isolated CD45+ cells from either Met-1 Kin1-WT or Kin1-NULL tumors as shown as Log2 normalised expression. (I) CD8+ CD4- CD25- and CD8- CD4+ CD25hi (Treg) cells were sorted from FVB spleens. CD8+ cells were labelled with CellTrace Violet and co-cultured with Tregs under stimulation at a ratio of 1:8 (Treg:CD8), in the presence of conditioned media +/-anti-IL-6 blocking antibody. At day 5, cells were harvested and analysis of proliferation of CD8 cells was conducted. Example histogram of CellTrace Violet staining with (J) quantification of CD8 proliferation shown. n=3–7 per group, error bars = SD. Unpaired t-test with * =< 0.05 and ** =< 0.01.
Figure 6—figure supplement 1. Blocking CXCL13 does not alter Treg differentiation in vitro.


