

Abstract
Cuba and Denmark represent states with different welfare models that have reached the same level of life expectancy. The purpose was to investigate and compare mortality changes in the two countries. Systematically collected information on population numbers and deaths for the entire Cuban and Danish populations was the basis of life table data used to quantify differences in the change in age-at-death distributions since 1955, age-specific contributions to differences in life expectancy, lifespan variation, and other changes in mortality patterns in Cuba and Denmark. Life expectancy in Cuba and Denmark converged until 2000, when the increase in life expectancy for Cuba slowed down. Since 1955, infant mortality has fallen in both countries but mostly in Cuba. Both populations experienced compression of mortality as lifespan variation decreased markedly, primarily due to postponement of early deaths. Given the different starting point in the mid-1900s and living conditions for Cubans and Danes, health status achieved among Cubans is striking. A rapidly ageing population is challenging both countries, but Cuban health and welfare are further burdened by a deteriorating economy in recent decades.
Keywords: Access to care, Age-at-death distribution, Life expectancy, Lifespan variation, Mortality, Welfare policy
Introduction
For decades, mortality rates have decreased in Cuba and Denmark. Accordingly, life expectancy has increased in both countries but at very different paces and with a period of stagnation before the early 1990s for both populations (Fig. 1). Recently, life expectancy in Cuba was among the highest in Central America and the Caribbean and nearly equivalent to that in Denmark, where life expectancy has increased less rapidly than in the other Nordic and European countries. Life expectancy for Cuban men caught up with that of Danish men in the 1970s, and life expectancy among women in Cuba reached the same level as Danish women in the mid-1990s (Fig. 1). Since 1955, the life expectancy gap between Cuba and Denmark of more than 10 years vanished in 2000. However, the difference in life expectancy has increased again, as depicted in Fig. 1.
Fig. 1.

Life expectancy at birth in Cuba and Denmark 1950–2020 (source: UNdata, United Nations, 2022)
The capacity of a society to ensure population prosperity and health can be elucidated by investigating mortality trends and relating them to social and health policies. For many years, infant mortality and life expectancy have served as primary indicators of population health development. However, these indicators are not sufficient to provide a more complete picture of population mortality in countries that have successfully reduced infant mortality (Gillespie et al., 2014). During the last century, most countries have experienced decreasing mortality in young ages and a postponement of adult mortality (Ortiz-Ospina, 2021). These trends, combined with the marked decline in infant mortality, have moved the age-at-death distribution to older ages and compressed deaths into a shorter age interval around the modal age of adult death (van Raalte, 2021). This compression of mortality or rectangularisation of the survival curve has been studied for many years by demographers and epidemiologists with a particular focus on ageing and old-age mortality and, more recently, with increasing interest in the distribution of age at death (Aburto et al., 2018; Ebeling et al., 2018; Robine, 2018; Vaupel & Canudas-Romo, 2003). This study compares mortality patterns in Cuba and Denmark, which have reached the same life expectancy over the past 50 years despite different initial patterns.
Since the introduction of the life table entropy (Leser, 1955; Keyfitz, 1977; Demetrius, 1978), various measures of lifespan variation or lifespan inequality indices have been developed—for an overview, see (Shkolnikov et al., 2003; van Raalte & Caswell, 2013). Indices that measure the uncertainty in average age at death are highly correlated with each other (van Raalte & Caswell, 2013; Vaupel et al., 2011). Furthermore, a threshold age that separates premature and late deaths can be estimated when mortality decreases in all ages except among the oldest old (Zhang & Vaupel, 2009; van Raalte & Caswell, 2013; Gillespie et al., 2014; Aburto et al., 2019; Aburto et al., 2020; Zhang & Li, 2021). High life expectancy is generally associated with low lifespan variation (Németh, 2017; Shkolnikov et al., 2011; Wilmoth & Horiuchi, 1999) and is due to progress in reducing premature mortality (Vaupel et al., 2011). However, this association is not always observed (Aburto & van Raalte, 2018; Aburto et al., 2020; Brønnum-Hansen et al., 2021; van Raalte et al., 2018). Thus, the coupling of changes in life expectancy and lifespan variation has gained increasing interest among demographers and policy makers. Recently, Shi et al. (2021) suggested measuring differences in mortality patterns by the degree of overlap or lack thereof in age-at-death distributions. This summary measure captures the difference in both life expectancy and age-at-death distribution between groups in a single number and can further elucidate different mortality patterns between populations. While (period) life expectancy is an indicator of overall mortality of a population or subpopulation in a specific time period, lifespan variation captures the variability of age at death and quantifies the heterogeneity of population mortality at the macro level. Lifespan variation can also be interpreted as the uncertainty of length of life at the micro level of individuals. With exceptions, life expectancy and lifespan variation are strongly and negatively correlated, regardless of which indicator is used, reflecting the fact that trends in lifespan variation across the whole age range are driven over the long run primarily by mortality changes below the threshold age (van Raalte, 2021). Any avoidable death increases life expectancy regardless of the age at which it occurs, whereas a change in lifespan inequality depends on whether a death occurs before or after the threshold age. Therefore, changes in the age-at-death distribution, e.g., lifespan inequality and overlap of distributions, are useful in comparing the evolution of mortality.
The purpose of the study was to describe changes in and characteristics of mortality in the Cuban and Danish populations and to quantify differences in mortality patterns between them. The change in age-at-death distributions in Cuba and Denmark since 1955 were assessed and age-specific contributions to differences in life expectancy between the countries were calculated. Lifespan variation and a measure of the non-overlapping proportion of age-at-death distributions for both populations were examined. Finally, the contributions of early and late life mortality to increasing life expectancies in both countries were compared.
Why Cuba and Denmark?
Various cross-country comparisons of mortality have been done between Cuba and other countries in Latin America and the Caribbean (Alvarez et al., 2020; Palloni & Pinto-Aguirre, 2011) and between Denmark and other Nordic or European countries (Aburto et al., 2018; Ballester et al., 2019; Brønnum-Hansen et al., 2021; Jørgensen et al., 2019; Leon, 2011). In this study, we were interested in comparing two countries that differ in climate, history, ethnicity, culture, and political and economic systems but have developed welfare policies including free universal access to social, educational and health benefits. Cubans admired the Nordic welfare system (University of Stavanger, 2020) and, after the revolution, the educational and health systems were developed with inspiration and assistance from Sweden in particular (http://www.cuba.cu/gobierno/discursos/1975/esp/f290675e.html). However, the Soviet Union and other Eastern Europe countries provided paramount economic assistance, particularly in 1961–1989.
Cuba and Denmark have attained the same level of life expectancy despite very different baseline statuses and development possibilities. Consequently, it is interesting to investigate whether common features of their welfare models contribute to similarities in their mortality patterns during the last half of the twentieth century. Characteristics of the welfare of societies can be measured by indicators such as development indices and proxies for health care and level of education. Figure 2 presents associations between selected indicators (Human Development Index, Gender Development Index [GDI], physician density, and government education expenditure) and life expectancy in 2000 and calendar years close to 2020 for Cuba and Denmark and selected neighbouring countries using data from the United Nations Development Programme (2021), Global Health Observatory data repository (WHO, 2022), United Nations Statistics Division (2022), and United Nations Population Division (2021). Cuba outperforms the other countries in the Latin American and Caribbean region with the exceptions of GDI and life expectancy in Costa Rica and outperforms all selected countries for physician density and government education expenditures. Life expectancy in Denmark is lower than that of the other Nordic countries. Denmark’s performance on the other indicators is similar to that of other Nordic countries, with the exception of a higher level of government education expenditures. The two panels (A and B) in Fig. 2 show the change in life expectancy as seen in Fig. 1. The difference in the other indices is consistent, with the exception of a higher increase in government education expenditure in Cuba than in Denmark and a slower growth in selected indices in Cuba.
Fig. 2.

The association between life expectancy and selected structural indicators and selected countries in 2000 and calendar years close to 2020
The Cuban welfare model
First established in 1900 with subsequent vigorous development, the welfare policy of Cuba continued to progress between 1959 and 1989. The Soviet Union and other European communist countries supported Cuba in 1961–1989 (Albizu-Campos Espiñeira & Cabrera, 2014) and, by 1989, Cuba was ahead of most Latin American countries on indicators of education, health, social security, employment and income distribution (Mesa-Lago, 2005, 2017). The collapse of the Soviet Union, along with the increased US embargo and later global financial crisis of 2008–2009, created a severe economic crisis that led to a decline of most social indicators (Mesa-Lago, 2017). Despite these challenges, Cuba continued to report social indicators comparable to those of high-income nations such as Denmark. This progress can be explained by a system characterised by two fundamental pillars: a public healthcare system providing universal services that are entirely state financed and administered and a universal education system publicly funded by the state (Mesa-Lago, 2017).
The achievements of the Cuban healthcare system have been linked to high state healthcare investment and a strong focus on a preventive approach to medicine centred on neighbourhood family doctor’s offices serving 600–700 individuals. Community-based polyclinics staffed with specialists such as paediatricians and gynaecologists serve catchment areas of 30,000–60,000 individuals and hospitals and speciality centres (Cárdenas et al., 2018; Pattison, 2018). Increasing the physician supply translated into significant reductions in infant and maternal mortality, eradication of several transmissible diseases and a sharp decline in sexually transmitted diseases, hepatitis and acute respiratory diseases (Cooper et al., 2006; Mesa-Lago, 2017).
Similarly, the Cuban education system achieved important milestones in 1959–1989. Illiteracy decreased from 21 to 4%, secondary education enrolment increased from 20 to 88% and post-secondary enrolment increased from 3 to 23% (Mesa-Lago, 2017). Currently the Cuban education system faces many challenges, such as teacher shortages and scarcity of books, equipment, food and transportation, that have impacted education quality (Breidlid, 2007; Mesa-Lago, 2017). Despite these major obstacles, Cuba continues to offer education for all and maintains almost universal adult literacy (99.8%) and high primary and secondary school enrolment at 97% and 87%, respectively (Mesa-Lago, 2017). In addition to the pillars of the healthcare and education systems, Cuban welfare policy includes other social programs, such as public contributory pensions that are primarily state financed and social assistance for vulnerable groups, which has also contributed to low population mortality. Over the last decade, the economy has worsened, causing substantial cuts in social expenditures, including healthcare (Mesa-Lago & Díaz-Briquets, 2021). In particular, Cuba is challenged by the COVID-19 pandemic and rising healthcare expenditures due to the rapidly ageing population.
The Danish welfare model
The Danish welfare state was established during the twentieth century. “Welfare state” refers to government provision of social security for citizens, such as core economic benefits in case of accidents, illness, ageing, or unemployment. The tax-financed welfare model in Denmark is part of the Scandinavian model characterised by similar social benefits for all citizens that are conditional on certain circumstances but independent of position in the social hierarchy or familial affiliations (Ploug et al., 2004). In twentieth century industrialisation, Denmark transformed from a primarily agricultural society to the current knowledge society. Parallel to the Cuban post-revolutionary history, the golden age of the Danish welfare state was 1952–1973, when Danish society was defined by growth and prosperity. By approximately 1960, Denmark was fully industrialised; working class norms of separate work and leisure hours and paid holidays had become standard for all employees. Female participation in the labour force doubled from 1950 to 1980, creating the need for day care and kindergartens. Schools, sports centres, residential homes and hospitals were constructed. This social expansion consolidated the welfare state (Hansen & Henriksen, 1980). The oil crises in 1973 and 1979 quadrupled energy prices and were the most significant signs of the recession that began in the 1970s and lasted throughout the 1980s, bringing high rates of unemployment and inflation, decreasing disposable wages and a budget deficit (https://danmarkshistorien.dk/vis/materiale/oliekriserne-og-deres-betydning-for-dansk-oekonomi-1973-1991/). The economy was kick-started early in the 1990s, and Denmark experienced a highly robust economy before the financial crisis in 2008–2009 and again before the Covid-19 pandemic (https://www.dst.dk/da/Statistik/nyheder-analyser-publ/bagtal/2019/2019-03-29-faktaark-om-dansk-oekonomi). During the different crises, liberal governments in particular have reduced the level of services in the social welfare system. Nevertheless, the tax-financed free educational system and healthcare systems were never questioned (Ploug et al., 2004).
The healthcare system is financed by a general proportional income tax covering 10.1% of GDP (2017). Outpatient care (general practitioner visits and outpatient care within and outside hospitals) accounts for one third of all expenditures. Only 2.5% of healthcare spending was allocated to preventive programs. Out-of-pocket payments, particularly for dental care and medications, accounted for 16% of all healthcare expenditures (https://read.oecd-ilibrary.org/social-issues-migration-health/denmark-country-health-profile-2019_5eede1c6-en).
The education system is free and tax-financed by the state or municipalities. Danish comprehensive integrated public schools cover primary and lower secondary education. Education is compulsory for ten years starting from the year the child turns six. Parents may choose a private school for their children. In 2014–2015, 16% of pupils attended private schools. Figures from 2014 show that 93% of a birth cohort completed a youth education program and 62% completed a higher education program. The percentage of total national expenditure spent on education (including state grants to students) was 15.2% in 2011 (https://ufm.dk/en/publications/2016/files/the_danish_education_system_pdfa.pdf).
Compared to other countries, wages and income taxes are high in Denmark. Three elements of the labour market comprise the triangle of the flexicurity model coupling flexible and security: flexible rules for employers related to hiring and firing, a relatively high level of unemployment benefits, and an active labour market policy (McAllister et al., 2015). The system ensures a flexible labour force for employers while ensuring a safety net including unemployment and other social benefit systems (unemployment benefit, social cash benefit, sickness absence benefit, and disability pension) for employees. Due to public sector cutbacks, the universal welfare system is under pressure, and recent labour market reforms have reduced the duration of unemployment benefits, lowered means-tested benefits, and phased out early retirement pensions originally introduced in 1979 for the benefit of worn-out workers (Jensen et al., 2019).
Material and methods
In 1955, the populations in Cuba and Denmark included 6.3 million and 4.4 million individuals, respectively, and grew to 11.5 million and 5.8 million today (United Nations, 2021). The human mortality database (HMD) was utilised (Barbieri et al., 2015; https://www.mortality.org/). Unfortunately, the HMD does not include data for Cuba. Cuban life table data were based on systematically collected information on population size and deaths for the entire population stored and extracted from the National Office of Statistics and Information. Danish sex- and age-specific death rates were available from HMD, and Cuban rates were estimated as the average of sex- and age-specific rates for a 5-year period centered on the calendar year of interest.
Construction of complete life table data for Cuba required a three-stage process. First, tables published by other authors, notably Álvarez and Toirac (1975) and Farnós Morejón (1976), were reconstructed for 1900–1970. Reconstruction was needed to address the fact that they established abbreviated and closed tables in very early years for individuals aged 80 and over in one case and 85 and over in another case. Complete tables prepared by Albizu-Campos Espiñeira (2002) were directly included for 1975–1995, which cover all ages up to the final open group of 100 years and over, following the same methodology used by both Álvarez-Toirac and Farnós. For the period 2000–2020, complete life tables were constructed, using the procedure described by Albizu-Campos Espiñeira 2018). For more details, see the "Appendix".
(Period) life expectancy is an estimate of the average years of lifetime in a population assuming constant age-specific mortality in the future. Thus, life expectancy should be interpreted as an age-standardised indicator of population mortality in a specific year or calendar period, not as an estimate of expected lifespan. To disentangle age-group specific contributions to mortality differences between Cuban and Danish populations, life expectancies were decomposed as suggested by Arriaga (1984).
Various indicators of lifespan variation have been developed (Goldman & Lord, 1986; Vaupel, 1986; Vaupel & Canudas-Romo, 2003). Lifespan variation or lifespan inequality reflects variability in age at death and measures the uncertainty of age at death for individuals in a population. Age patterns in mortality are particularly useful in studies of mortality compression or expansion. There is a unique threshold age below and above which mortality improvements decrease and increase lifespan variation when mortality improves in all ages except among the very oldest (Zhang & Vaupel, 2009; van Raalte & Caswell, 2013; Gillespie et al., 2014; Aburto et al., 2019, 2020; Zhang & Li, 2021). This study makes use of the threshold age introduced by Zhang & Vaupel (2009) on the basis of the lifespan variation measure defined by years of life lost. Thus, the age-at-death distribution, d(x), where x denotes age, is the life table function of the proportion of deaths, ∑d(x) = 1. Lifespan variation, e†(a), is defined as the average number of life years lost due to death among survivors to age a and can also be interpreted as the average remaining life expectancy at death conditional upon survival to age a (details in "Appendix"). The threshold age, a†, is characterised by separating early or premature deaths and late deaths; saving lives at early ages, i.e., postponing deaths before age a† (premature deaths) compresses lifespan variation, while deaths after the threshold age expand variation (Zhang & Vaupel, 2009). Zhang & Vaupel (2009) also developed a formula for decomposing by age the contributions of early and late life mortality components to increasing life expectancy (details in the "Appendix").
A measure, Sij, of the non-overlapping proportion of the age-at-death distributions for two populations i and j has been suggested by Shi et al. (2021). Sij varies between 0 and 1. Populations i and j have equal age-at-death distributions if Sij = 0, while Sij = 1 if the distributions have no overlap (details in the "Appendix"). This index, SCuba,DK, is also presented to compare the age-at-death distributions of the Cuban and Danish populations in 1955, 2000, and 2020.
Results
Age-at-death distributions
The shapes of the age-at-death distribution, d(x), in 1955, 2000, and 2020 are shown in Fig. 3. In both countries, a pronounced decline in infant mortality is seen. In Cuba, from 1955 to 2020, infant mortality decreased from 8.9 to 0.5% of all male deaths and from 7.0 to 0.4% of all female deaths. In Denmark, over the same time period, it declined from 2.8 to 0.3% of all male deaths and from 2.3 to 0.3% of all female deaths. Furthermore, Cuba experienced significantly more compression of mortality from 1955 to 2000 than Denmark, reflecting the marked decline in mortality in Cuba during this period. Since 2000, mortality compression is more noticeable in Denmark. The non-overlapping proportion of age-at-death distributions, SCuba,DK, changed from 0.33 (1955) to 0.17 (2000) and 0.24 (2020) for men and from 0.29 to 0.14 and 0.23 for women at the same intervals (Fig. 3).
Fig. 3.

Age-at-death distributions in 1955, 2000, and 2020 in Cuba and Denmark
Age-specific contributions to difference in life expectancy
Survival curves and the contributions of age-specific mortality to differences in life expectancy between Cuba and Denmark are shown in Fig. 4. The vertical axis to the left indicates survival probability (curves shown in black) while the axis to the right indicates contributions to differences in life expectancy (contributions shown in grey). In 1955, all age groups contributed to longer life expectancy in Denmark. In comparison, high mortality before the age of five years in Cuba contributed 37% and 33% of the difference in life expectancy for men and women, respectively. In 2000, life expectancy for men was highest in Cuba, and the difference with Denmark arose from lower mortality in ages above 65 years that exceeded the contribution from higher mortality in younger age groups. For women, lower mortality over the age of 70 counterbalanced the contribution from higher mortality in younger age groups. After 2000, the pattern changed and all age groups contributed to lower life expectancy among Cubans, compared with Danes. Thus, the difference between Cuba and Denmark that narrowed and almost disappeared in 2000 was followed by a growing difference.
Fig. 4.

Survival and age specific contributions to the difference in life expectancy between Cuba and Denmark, 1955, 2000, and 2020 (Decomposition: Denmark minus Cuba)
Changes and differences in lifespan variation
Figure 5 shows that lifespan variation for Cuban men decreased a total of 8.0 years, from 19.1 years (1955) to 13.0 years (2000) and 11.1 years (2020). For Danish men, lifespan variation decreased from 12.9 years in 1955 to 11.1 in 2000 and 9.9 years in 2020. Among women, lifespan variation decreased by 6.6 years in Cuba and 2.6 years in Denmark in 1955–2020. Figure 5 depicts an exception to the general association between increasing life expectancy and decreasing lifespan variation in the simultaneous increase in both from 1970 to 1980 in the Cuban female population. At the beginning of this decade, the increase in life expectancy weakened, but, despite a similar weakening of the increasing life expectancy for Cuban men, no such break in the overall trend of lifespan variation was seen. A closer look at the age-at-death distributions for Cuban women reveals a maximum compression of mortality in 1970 (data not shown).
Fig. 5.

Lifespan variation in Cuba and Denmark, 1955 and 2020
To further explore changes in mortality patterns, we calculated the contribution of early and late mortality to increases in life expectancy since 1955. Increments in life expectancy up to the year 2000 were decomposed by age to capture the contributions of early and late mortality relative to the threshold age, a†, in 1955. The gain of 16.5 years of life expectancy for Cuban men from 1955 to 2000 was mainly due to postponement of early deaths before the threshold age of 61 years, which accounted for 12.9 years, whereas mortality after age 61 years accounted for 3.6 years (Fig. 6). The threshold age for Cuban women was 67 years in 1955, and the contributions of early and late deaths were 12.3 years and 3.8 years, respectively. The smaller gain in life expectancy in Denmark was also primarily due to postponement of early mortality by 3.3 years for men and 3.6 years for women (Fig. 6). The contributions of early and late mortality in 2000–2020 are also shown in Fig. 6. In Cuba, late deaths (after age 72 for men and age 76 for women) contributed negatively to increased life expectancy, and the contribution of early deaths was modest. In Denmark, where threshold ages for men and women were 71 and 76 years, respectively, early deaths contributed one year more than late deaths did since 2000 for both sexes. Figures 5 and 6 quantify the compression of mortality as visualised in Fig. 3.
Fig. 6.
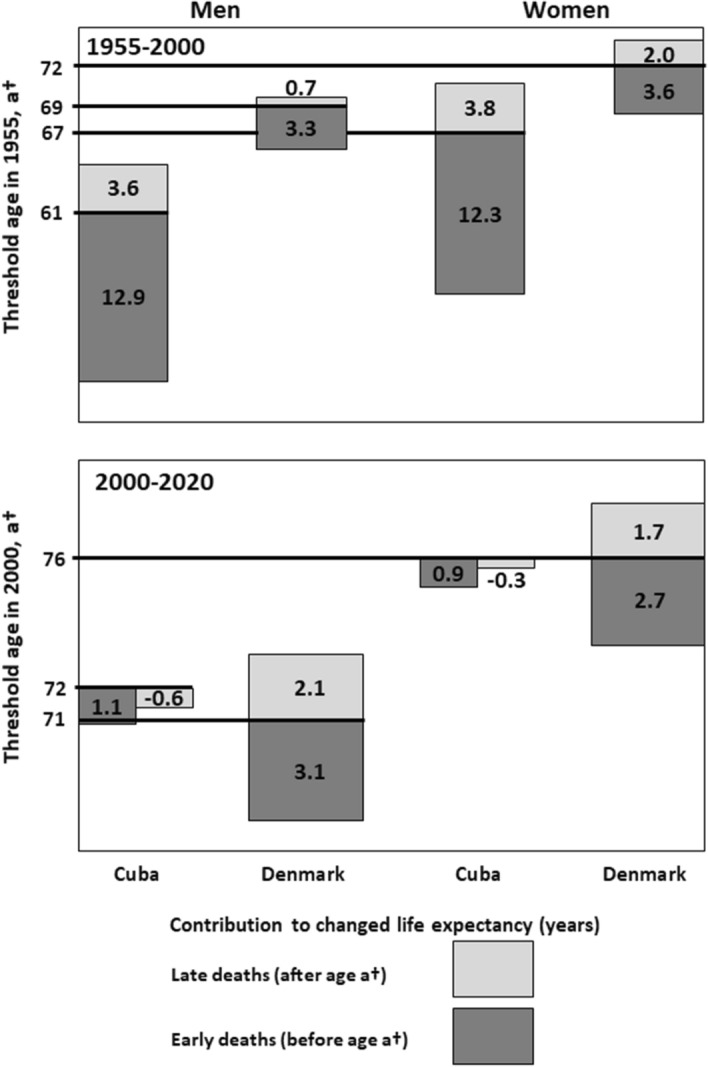
Contributions of early and late life mortality to life expectancy increases from 1955 to 2000 and from 2000 to 2020 in Cuba and Denmark
Discussion
This study compared the patterns of changes in selected measures of mortality in Cuba and Denmark, countries with very different contexts (e.g., geography, climate, history, traditions, and political systems). Age-at-death distributions were flatter in 1955 than in 2020 for both countries but more so for Cuba (Fig. 3). Lifespan variation was much greater for Cuba than for Denmark, as was the non-overlapping index of the age-at-death distributions in 1955. In 2000, the distributions tended to be more equal with more overlap and had moved to the right and compressed deaths into a shorter interval around the modal age of death. Postponement of deaths at early ages, due primarily to reduced infant mortality was the main contributor to gains in life expectancy in Cuba. However, the infant mortality rate started to decline before the revolution; in 1900–1959, pre-revolutionary Cuba ‘became Latin America's unlikely champion of mortality decline despite experiencing slow economic growth and high income inequality’ (McGuire & Frankel, 2005). This could indicate that reductions in infant mortality, maternal deaths and infectious disease mortality were already on the way. However, in the first decade after the revolution, disease patterns in Cuba remained similar to those of developing countries. An advanced healthcare system soon contributed to the epidemiological transition, and noncommunicable and age-related diseases became the primary causes of death (Omran, 1971). The epidemiological transition describes long-term changing patterns of population age distributions, mortality, fertility, life expectancy, and causes of death in a specific population and has been revised (Omran, 1998) and discussed recently (Mackenbach, 2022).
Around the turn of the twenty-first century, mortality patterns in Cuba and Denmark were almost identical, although historical mortality experiences differed substantially. This historical difference may have affected the perception of survival expectations differently in the two populations, which may have influenced decision-making (Nepomuceno et al., 2021). However, our study was based on period life tables, precluding the advantages of preferable cohort life tables, which would have required complete and very long-term historical mortality series for both countries.
The consistency and comparability of data for Cuba and Denmark was validated by comparing our life expectancy results with data from the United Nations (UN) (https://population.un.org/wpp/Download/Standard/Mortality/). According to UN data, 1955 life expectancy (i.e., the average life expectancy between 1950–1955 and 1955–1960) was 59.3 years for men and 62.7 years for women in Cuba. In our study, 1953–1957 life expectancy in Cuba was 58.4 years for men and 62.9 years for women. Similarly, life expectancy for Denmark, according to UN data, was 70.0 years for men and 73.0 for women and, according to HMD for 1955, 70.4 years and 73.5 years for men and women, respectively. Taking into account the broad calendar period used in UN data, the differences are negligible.
The selected indicator of the lifespan variation, e†, in our study was based on the formula for the threshold age, a†. However, as mentioned earlier, the various definitions of lifespan variation indicators are strongly correlated. For instance, the estimated Gini coefficients (lifespan variation) for men were 24.3 and 13.4 for Cuba and Denmark in 1955. In 2020, the Gini coefficients were 10.6 and 8.9 for Cuban and Danish men.
Figure 5 shows similar patterns of life expectancy development in Cuba and Denmark from 1975 to 2005. Both countries experienced stagnation in life expectancy in 1975–1995 but for different reasons. In Cuba, growth in life expectancy abated from 1970 and stagnated from 1980 to1994. The stagnation may be explained by political changes, emigration and epidemiological transition. Emigration and political changes are often closely connected and may be due to rapid changes in Cuban society with nationalisation of all private enterprises. In 1959–1989, approximately 844,000 primarily young, healthy and well-educated men and women emigrated, largely to the US, inducing a brain drain. In 1990–2010, approximately 570,000 people emigrated (Ruiz & Foladori, 2013). Economic reforms enacted in 2011 failed, and the Cuban economy has faced stagnation or even rollbacks since 2015, including the 2016 economic decline attributable largely to the crisis in Venezuela and the damage inflicted by hurricane Irma in 2017. Economic stagnation impacts the quality of social, educational and health care systems (Mesa-Lago, 2017). It is expected that the COVID-19 pandemic has contributed to an increased difference between Cuba and Denmark in life expectancy at the end of the study period. Denmark did not experience excess mortality during the pandemic (Aburto et al., 2022), while Cuba was in a less fortunate situation, according to Albizu-Campos Espiñeira. However, the Cuban estimates for 2020 in this study were not influenced by COVID-19.
Changes related to epidemiological transitions often coincide with demographic, social and economic changes. The fertility rate fell from 4.6 in 1964 to 1.6 in 2000 (The World Bank, 2022). The primary causes of death in 1970–1990 were increasing rates of heart disease, diabetes mellitus, accidents and suicide but decreasing rates of influenza, pneumonia and bronchitis (Porrata et al., 2000). In the same period, the prevalence of obesity, hypertension and diabetes mellitus increased. However, life expectancy began to increase after 1994. Cuba experienced a prolonged economic crisis caused by the collapse of the Soviet Union, known as the ‘Special Period’ with ‘sustained shortages in the food-rationing system’ that reduced per capita daily energy intake (Franco et al., 2007). Combined with the increase in energy expenditures due to reliance on physically demanding forms of transportation, net nutrition was reduced, and obesity rates were halved. Although causality is not established, this may have contributed to important reductions of deaths attributed to diabetes, coronary heart diseases and strokes (Franco et al., 2007). A larger gain in life expectancy in Cuba could have been achieved by more successful prevention efforts directed at the very high prevalence of smoking (Ng et al., 2014). The change in causes of death is correlated with the rampant economic crisis and decline in life expectancy in the 1990s. The decrease in mortality during the 1980s of children under five years of age, particularly of infant mortality, as well as of people aged 75 and over contributed positively to life expectancy, but it could not offset the negative impact of mortality increases in other ages. From the beginning of the 1990s, life expectancy began to increase once again. However, the conditions of survival were impacted by the deterioration of the social and economic conditions in general and of life in Cuba (Albizu-Campos Espiñeira, 2014). These deteriorations may also explain why the Human and Gender Development Indices (see Fig. 2) increased more slowly in Cuba than in Denmark.
For many years, Denmark has been among the countries with the highest life expectancy in the world. According to the UN, Denmark ranked fifth in life expectancy in 1955, while Cuba ranked 70th. Denmark lost this favourable position, ranking 41st in 2000 and 38th in 2022, while Cuba climbed to the fourth highest life expectancy in the world in 2000 before falling back to 57th today. (https://population.un.org/wpp/Download/Standard/Mortality/). Denmark lost its favourable ranking primarily due to higher consumption of alcohol and tobacco, which also plays a major role in health inequalities (OECD, 2019; Östergren et al., 2019), causes of death that could be prevented through more efficient public health and preventive policies. Life expectancy in Denmark for women stalled from 1975 to 1995, due to a cohort effect among women born in 1915–1945 (Lindahl-Jacobsen et al., 2016). Danish life expectancy still lags behind other Western European countries, and Denmark is performing badly in efforts to reduce social inequalities in mortality. Furthermore, Denmark has not succeeded in transforming economic growth and prosperity into health and longevity.
Indices of life expectancy in Cuba and Denmark converged despite large differences in income levels and history of social welfare. A potential explanation is policies with a strong focus on prevention and addressing social determinants of health and the conditions in which people are born, grow, live, work and age (https://www.who.int/social_determinants/en/). Our findings demonstrate that improvements in health and mortality can be achieved with limited resources. However, political will is required, and the robust, universal and mature health program in Cuba benefitted from important external funding, especially from the former Soviet Union and from Venezuela in early 2000 (Albizu-Campos Espiñeira & Cabrera, 2014).
This study compared the compression of the age-at-death distributions in Cuba and Denmark, which have welfare models characterised by universal and free education and health care. These characteristics are considered crucial conditions for population health and may explain the growth in life expectancy in Cuba. Living and working conditions among Cubans and Danes differ, as do political and economic systems in the two countries. However, Cuba and Denmark have developed somewhat similar welfare systems to protect population social life and health and provide universal free access to healthcare. Although baseline conditions were very different across countries, the similarity of their welfare systems may help explain the convergence of mortality patterns over time. However, since 2000, the increasing economic pressure on Cuban society, its low fertility rate and ageing population are serious challenges to the sustainability of the social, educational and health welfare of Cuban citizens.
Appendix
I Construction of complete mortality tables for Cuba. 1900–2020
The three-stage process of constructing complete mortality tables for Cuba for 1900–2020 began with reconstructing those that had already been published by other authors, notably Álvarez and Toirac (1975) and Farnós Morejón (1976). Very early versions included abbreviated and closed tables for individuals aged 80 years and over in one case and 85 years and over in another. That exercise covered the subperiod 1900–1970.
For 1975–1995, the complete tables prepared by Albizu-Campos for his doctoral thesis (Albizu-Campos Espiñeira, 2002) were included as published. They cover all ages up to the final open group of 100 years and over and were constructed following the same methodology used by both Álvarez and Toirac (1975) and Farnós Morejón (1976).
To complete the study period and due to the availability of comprehensive information for 2000–2020, complete five-year tables were constructed by sex for 2000, 2005, 2010, 2015, and 2020 using the procedure described in detail in Cuba. New mortality tables for 2001–2003 to 2012–2014 (Albizu-Campos Espiñeira 2018).
Complete mortality tables for the period 1900–1995
Reconstruction of the complete mortality tables in the cited texts and their conversion into abbreviated tables for 1900–1970 was carried out in three stages:
Determination and smoothing of the probabilities of death by age starting from those calculated by other authors for age groups.
Adjustment to the level of specific mortality rates from 1 to 99 years.
Calculation of the remaining functions of the complete tables.
Determination of the probabilities of death by age starting from those calculated by other authors for age groups.
Heligman and Pollard proposed a method by means of an 8-parameter equation (Heligman, 1981; Heligman & Pollard, 1980; Rogers & Gard, 1991), in which the observed probabilities of death proposed by Álvarez and Toirac and Farnós, for the age groups 0, 1–4, 5–9, …, are regularised for each combination of sex and five-year period through a least squares model according to the originally proposed curve:
where x is age, qx is the probability of death, and A, B, C,…, H are the parameters of the equation estimated according to the mentioned criterion, which minimises the sum of the squares of the proportional differences between estimated and observed probabilities for the selected age groups.
For age 0, the term is undefined, so a particular case of the equation is applied in which it is eliminated, leaving:
The original equation could also be applied using x = 1–10, a value very close to 0. It provides the same result.
A practical solution in this step was to use the UNABR application included in the MORTPAK program package, version 4.3 (United Nations Population Division, 2013). Once the observed probabilities of death by age groups have been entered for the age groups 0, 1–4, 5–9, …, 95, 100 + , the corresponding functions mx, qx, lx and eox are obtained directly from the original function proposed by their authors.
-
2.
Adjustment to the level of specific mortality rates from 1 to 99 years.
The values of mx obtained for the corresponding ages from MORTPAK were adjusted using a constant multiplier, with a value of approximately 1, so that once the complete life table was reconstructed, the corresponding value of life expectancy at birth was reproduced as proposed by each author, for each calendar year ending in zero and five for each sex, and for both sexes.
Considering the robustness of the calculations that were carried out in the studies underlying these estimates, from which the observed probabilities of death derive and to which the Heligman-Pollard formula is applied to calculate them by age, the authors assumed that the mortality pattern by age obtained at each moment is contained in that of the age groups. Therefore, the complete table must reproduce at least the level of life expectancy at birth from the abbreviated table.
-
3.Calculation of the remaining functions of the complete tables.
-
3.1Survivors at each exact age x:
-
3.1
-
3.2Deaths between x and x + 1:
-
3.3Stationary population at age x:
- For age 0: ; where is implicit in the abbreviated tables.
- For ages 1 ≤ x ≤ 99:
- For the final open group:
is considered by different authors (Barclay, 1962; Benjamin & Haycocks, 1970; Greville, 1943; Keyfitz & Flieger, 1971; Ortega, 1987) as the best way to calculate the central mortality rate of the stationary population, which results from the assumptions that support the model constant over time.
-
3.4Stationary population at ages from x to w:
-
3.5Life expectancy at age x:
It was not considered necessary to change the level of the specific mortality rates at age 0 (m0). The quality of the calculations carried out by Álvarez-Toirac and Farnós is a sufficiently solid argument, and the values they derived were corroborated years later in an independent exercise carried out by González and Ramos (González Quiñones & Ramos, 1994 and 1996), in "Balance of Demographic Indicators Estimated for the Period 1900–1959", using the inverse projection technique (Whatcher, 1986) and incorporating new information from other secondary sources.
Verification of the probability of death for children under one year of age was carried out by recalculating it from its corresponding specific mortality rate using the formula proposed by Reed and Merrell (1939). It is regarded as “unquestionably the most satisfactory” (Greville, 1943) when only the specific mortality rate at age 0 is available, as is the case in this study and based on those proposed by the other authors.
Complete life tables for the period 2000–2020
For the period 1975–1995, complete tables opened to the group aged 100 years and over were included. They originated from previous calculations that had already used for other studies, particularly of the epidemiologic transition of mortality in Cuba in the twentieth century and its relationship to aspects of the simultaneous historical context. The study subperiod was covered, so we proceeded to construct complete mortality tables for the simple years ending in zero and five in 2000–2020, also open to those aged 100 years and over.
For this, the construction process consisted of four stages:
Calculation of specific five-year mortality rates by age groups and sex.
Determination of the probabilities of “observed” death.
Estimation and smoothing of the probabilities of death by age.
Calculation of the other functions of the complete tables.
Calculation of specific five-year mortality rates by age groups and sex.
Given that these are 5-year interval mortality tables and the small size of the Cuban population, the authors decided to accomplish this step by calculating mortality rates for age groups, as is done for constructing abbreviated life tables, thus avoiding the irregularities that appear when the calculation is done starting from specific rates for single ages. Abbreviated rates were calculated according to the formula:
where “N” is the population on June 30 or the annual average population, “D” is the number of deaths, “x” is the lower age limit of the interval, “n” is the width of the age interval, “s” is the sex and “z-2, z + 2” are the limit years of the five-year period in question for which z constitutes the central year. For the numerator, deaths by age groups (0, 1–4, 5–9, 10–14,…, 95–99, 100 and over) were used from the death certificates databases produced annually by the National Statistics Directorate of the Ministry of Public Health. The quality and completeness of the databases as the basis of the country's vital statistics registration system have been certified as “virtually complete” in evaluation exercises carried out in conjunction with international organisations and experts (Puffer, 1974) (JUCEPLAN, 1975) (Rojas Ochoa & Ríos Massabut, 1976) (Hollerbach, 1979) (Directorate of Demography, 1980) (United Nations, 1996).
To produce average populations by sex and age groups, the denominator of the rates, the estimates prepared in "Cuba. New mortality tables. 2001–2003 to 2012–2014" (Albizu-Campos Espiñeira, 2018, pp. 7–9) were used in such a way that the total, male, and female populations were reproduced as they appeared in the Demographic Yearbook of Cuba, 2012 (ONEI-CEPDE, 2013), estimated for the intercensal years in 1981–2012.
For the years from 2015 onward, population projections by age and sex published in "Cuba. Demographic scenarios towards 2030" (Albizu-Campos Espiñeira, 2015) were used. The population published in the Demographic Yearbooks is not considered satisfactory because it is derived from the compensating equation, based on the estimated population as of December 31, 2014. Compared to the 2013 estimate, it is a reversal of the migratory balance to a positive direction, which is implausible, and it does not take into consideration the emigration boom of 2015, or the secondary sources required to adequately quantify them. The National Bureau of Statistics and Information considers that Cuban individuals residing abroad who maintain updated passports have not emigrated. In fact, to return to Cuba to visit relatives, citizens of other countries are required to have a current Cuban passport, rather than the passport of the country of which they are citizens.
The reader is urged to consult the bibliography cited at the end of this appendix, which accounts for new demographic scenarios that incorporate the magnitude of the emigratory potential of the Cuban population because official projections assume the disappearance of emigration (ONE, 2010).
-
2.
Determination of the “observed” probabilities of death.
For this, the Reed and Merrell method was used, as follow:-
For age 0:
-
For ages from 1 to 4:
-
For five-year age groups:
- For the final opened group of 100 and over:
-
-
3.
Estimation and smoothing of the probabilities of death by age.
In this step, the same procedure described on the first page of the appendix was used, i.e., applying the Heligman-Pollard 8-parameter formula in such a way to avoid mortality differences that can be found in the tables throughout the entire period and are attributable to biases that may have been introduced by incompatible methods used. Thus, the life tables ensure a significant level of comparability of results over time.
The observed probabilities of death by age groups were then introduced into the MORTPAK programs package and the corresponding functions mx, qx, lx and eox were directly obtained by sex and age.
-
4.
Calculation of the other functions of the complete tables.
The remaining functions in the tables were obtained using the same relationships described above.
Because the results correspond to the complete life tables, their conversion to abbreviated tables is recommended by extracting them properly from complete tables in such a way that life expectancy at birth is reproduced in both types of tables.
-
5.Extraction of abbreviated life tables from complete tables.
- Selection of the values of the lx function for ages 0, 1, 5, 10, 15, …, 85, 90, 95 and 100, from the complete table.
- Calculation of deaths for five-year intervals age groups (ndx):
- Determination of the probabilities of death between x; x + n-1 (nqx):
-
Stationary population at ages from x to x + n−1 (nLx):where Lx is the corresponding function of the stationary population at age x in the complete life table.
- Stationary population at ages from x to w:
- Life expectancy at age x:
II Methods
The age-at-death density function, d(x), where x denotes age, is the life table function of the proportion of deaths, ∑d(x) = 1. Lifespan variation, e†, measures lifetime losses and e†(a) is defined as the average number of life years lost due to death at older ages than a:
approximated by the formula (a = 0 in this study)
where l is the survival function, and e is life expectancy.
The threshold age, a†, is defined as the solution to the equation
where H is the cumulative hazard function
and is the age-specific hazard of death (Zhang & Vaupel, 2009).
a† distinguishes between early deaths and late deaths. Avoiding deaths before age a†, reduces lifespan variation and compresses mortality, while deaths after a† expand lifespan variation.
Increasing life expectancy can be decomposed by age to estimate contributions from early and late life mortality, where early and late are defined in relation to life expectancy at the start of the observation period (Zhang & Vaupel, 2009)
where is the threshold age in 1955 and is the age-specific rate of mortality reduction from 1955 to 2000. Results for a similar decomposition for the period 2000 to 2020 are presented in Fig. 6.
The non-overlapping proportion of the age-at-death distributions for two groups i and j is defined by the formula (Shi et al., 2021):
Sij varies between the 0 and 1. The i and j populations have equal age-at-death distributions if Sij = 0, and Sij = 1 if the distributions have no overlap. The index is presented for Cuban and Danish populations in 1955 and 2010 (i = Cuba and j = Denmark).
Author Contribution
HBH planed and designed the study. HBH and JCACE processed the register data from Denmark and Cuba, respectively. HBH conducted the analysis and drafted the work. All authors contributed with writing and interpretation of the results of the manuscript.
Funding
This research received no specific grant from any funding agency in the public, commercial or not-for-profit sectors.
Availability of data and material
Data available from first author.
Declarations
Code availability
Not applicable.
Conflict of interest:
None.
Ethics approval
Not applicable.
Consent to participate
Not applicable.
Consent for publication
Not applicable.
Footnotes
Publisher's Note
Springer Nature remains neutral with regard to jurisdictional claims in published maps and institutional affiliations.
References
- Aburto, J.M., Alvarez, J.-A., Villavicencio, F., & Vaupel, J.W. (2019). The threshold age of the lifetable entropy. Demographic Research, 41, 83–102. https://www.demographic-research.org/volumes/vol41/4/.
- Aburto, J.M., Villavicencio, F., Basellini, U., Kjærgaard, S., & Vaupel, J.W. (2020). Dynamics of life expectancy and life span equality. Proceedings of the National Academy of Sciences of the United States of America, 117, 5250–5259. https://www.pnas.org/content/117/10/5250. [DOI] [PMC free article] [PubMed]
- Aburto, J.M., Schöley, J., Kashnitsky, I., Zhang, L., Rahal, C., Missov, T.I., Mills, M.C., Dowd, J.B., & Kashyap, R. (2022). Quantifying impacts of the COVID-19 pandemic through life-expectancy losses: a population-level study of 29 countries. International Journal of Epidemiology, 51, 63–74. https://academic.oup.com/ije/article/51/1/63/6375510?login=true. https://pubmed.ncbi.nlm.nih.gov/34564730/. [DOI] [PMC free article] [PubMed]
- Aburto JM, van Raalte AA. Lifespan dispersion in times of life expectancy fluctuation: the case of Central and Eastern Europe. Demography. 2018;55:2071–2096. doi: 10.1007/s13524-018-0729-9. [DOI] [PMC free article] [PubMed] [Google Scholar]
- Aburto JM, Wensink M, van Raalte AA, Lindahl-Jacobsen R. Potential gains in life expectancy by reducing inequality of lifespans in Denmark: an international comparison and cause-of-death analysis. BMC Public Health. 2018;18:831. doi: 10.1186/s12889-018-5730-0. [DOI] [PMC free article] [PubMed] [Google Scholar]
- Albizu-Campos Espiñeira, J.C. (2002). Mortalité et survie à Cuba dans les année mille neuf cents quatre-vingt-dix. Lille, Nord-Pas-de-Calais, France: Atelier National de Reproduction de Thèses. Université de Lille 3 - Charles de Gaulle. Obtenido de. https://www.theses.fr/2002PA100060.
- Albizu-Campos Espiñeira, J.C. (2014a). Mortalidad en Cuba. Centro de Estudios Demográficos-Universidad de La Habana. ISBN 978–959–7005–83–4. La Habana, 143–168.
- Albizu-Campos Espiñeira, J.C., & Cabrera, F.C. (2014). Mortality in Cuba according to the color of the skin. Novedades en población, 10, 31–61. http://www.novpob.uh.cu/index.php/NovPob/article/view/202/0.
- Albizu-Campos Espiñeira, J.C. (2015). Cuba. Escenarios demográficos hacia 2030. Novedades en Población, XI (enero-junio)(21), 1–25.
- Albizu-Campos Espiñeira, J.C. (2018). Cuba. La esperanza de vida en años terminados en cero y cinco. 1900–2015. La Habana, Cuba: Centro de Estudios Demográficos-Universidad de La Habana. https://revistas.uh.cu/novpob/article/view/441/382
- Albizu-Campos Espiñeira JC. La esperanza de vida en Cuba en los 90. Centro de Estudios Demográficos-Universidad de La Habana; 2003. [Google Scholar]
- Albizu-Campos Espiñeira JC. Mortalidad en Cuba. Centro de Estudios Demográficos-Universidad de La Habana; 2014. [Google Scholar]
- Álvarez, L. (1961). Estimación de la mortalidad de Cuba. 1943–1953. Centro Latinoamericano de Demografía.
- Álvarez, E., & Toirac, L. (1975). Cuba: Tablas de mortalidad estimadas por sexos para los años calendario terminados en cero y cinco durante el período 1900–1950 (Serie I - Estudios Demográficos ed., Vol. 3). La Habana, Cuba: Centro de Estudios Demográficos-Universidad de La Habana. Instituto de Economía.
- Alvarez JA, Aburto JM, Canudas-Romo V. Latin American convergence and divergence towards the mortality profiles of developed countries. Population Studies. 2020;74:75–92. doi: 10.1080/00324728.2019.1614651. [DOI] [PubMed] [Google Scholar]
- Arriaga EE. Measuring and explaining the change in life expectancies. Demography. 1984;21:83–96. doi: 10.2307/2061029. [DOI] [PubMed] [Google Scholar]
- Ballester B, Robine J-M, Herrmann FR, Rodó X. Effect of the great recession on regional mortality trends in Europe. Nature Communications. 2019 doi: 10.1038/s41467-019-08539-w. [DOI] [PMC free article] [PubMed] [Google Scholar]
- Barbieri, M., Wilmoth, J.R., Shkolnikov, V.M., Glei, D., Jasilionis, D., Jdanov, D., Boe, C., Riffe, T., Grigoriev, P., & Winant, C. (2015). Data resource profile: The human mortality database (HMD). International Journal of Epidemiology, 44, 1549–1556. https://www.ncbi.nlm.nih.gov/pmc/articles/PMC4707194/pdf/dyv105.pdf. [DOI] [PMC free article] [PubMed]
- Barclay G. Técnicas del Análisis de la Población. Instituto Interamericano de Estadística; 1962. [Google Scholar]
- Benjamin B, Haycocks HW. The analysis of mortality and other actuarial statistics. Cambridge University Press; 1970. [Google Scholar]
- Brass, W. (1971). Seminario sobre métodos para medir variables demográficas (fecundidad y mortalidad) (Serie DS ed., Vol. 9). Centro Latinoamericano de Demografía, San José
- Breidlid A. Education in Cuba—an alternative educational discourse: lessons to be learned? Compare. A Journal of Comparative and International Education. 2007;37:617–634. doi: 10.1080/03057920701582491. [DOI] [Google Scholar]
- Brønnum-Hansen, H., Östergren, O., Tarkiainen, L., Hermansen, Å., Martikainen, P., van der Wel, K.A., & Lundberg, O. (2021). Change in life expectancy and lifespan variability by income quartiles in four Nordic countries: A study based on nationwide register data. BMJ Open;11:e048192. https://bmjopen.bmj.com/content/11/6/e048192.full. [DOI] [PMC free article] [PubMed]
- Camposortega CS. Análisis demográfico de la mortalidad de México: 1940–1980. 1. El Colegio de México; 1992. [Google Scholar]
- Cárdenas, L.T.G., Mejías, L.C., Perea, L.P., Labrador, M.C.P., Díaz, I.E.F., Díaz, T.dl.C.P., Chacón, S.E.G., & Charbonier, C.P. (2018). The Family Doctor and Nurse Program: development of the health care model in Cuba. [El Programa del médico y enfermera de la familia: desarrollo del modelo de atención médica en Cuba]. Revista panamericana de salud publica = Pan American journal of public health, 42, e31. https://www.ncbi.nlm.nih.gov/pmc/articles/PMC6386125/?report=printable. [DOI] [PMC free article] [PubMed]
- CEE-CELADE. (1981). Tablas completas de mortalidad para Cuba, 1977–1978. Nivel Nacional: Metodología y resultados. Comité Estatal de Estadísticas-Centro Latinoamericano de Demografía. La Habana
- Cooper, R.S., Kennelly, J.F., & Orduñez-Garcia, P. (2006). Health in Cuba. International Journal of Epidemiology, 35, 817–824. https://www.deepdyve.com/lp/oxford-university-press/health-in-cuba-zdwoH40n04. [DOI] [PubMed]
- de Demografía D. Cuba: Evaluación en 1974 de los registros de defunciones. Comité Estatal de Estadísticas; 1980. [Google Scholar]
- Demetrius, L. (1978). Adaptive value, entropy and survivorship curves. Nature, 275, 213–214. https://www.nature.com/articles/275213a0. [DOI] [PubMed]
- Dirección de Demografía (JUCEPLAN) La esperanza o expectativa de vida. Junta Central de Planificación; 1974. [Google Scholar]
- Ebeling M, Rau R, Baudisch A. Rectangularization of the survival curve reconsidered: The maximum inner rectangle approach. Population Studies. 2018;72:369–379. doi: 10.1080/00324728.2017.1414299. [DOI] [PubMed] [Google Scholar]
- Farnós Morejón, A. (1976). Cuba: Tablas de mortalidad estimadas por sexo. Período 1955–1970 (Serie I - Estudios Demográficos ed., Vol. 8). La Habana, Cuba: Centro de Estudios Demográficos-Universidad de La Habana. Instituto de Economía.
- Franco, M., Orduñez, P., Caballero, B., Granados, J.A.T., Lazo, M., Bernal, J.L., Guallar, E., & Cooper, R.S. (2007). Impact of energy intake, physical activity, and population-wide weight loss on cardiovascular disease and diabetes mortality in Cuba, 1980–2005. American Journal of Epidemiology, 166, 1374–1380. https://academic.oup.com/aje/article/166/12/1374/82812. [DOI] [PubMed]
- García Quiñones R. La transición de la mortalidad en Cuba. Un estudio socio-demográfico. Centro de Estudios Demográficos; 1996. [Google Scholar]
- Gillespie, D.O.S., Trotter, M.V., & Tuljapurkar, S.D. (2014). Divergence in age patterns of mortality change drives international divergence in lifespan inequality. Demography, 51, 1003–1017. https://read.dukeupress.edu/demography/article/51/3/1003/169447. [DOI] [PMC free article] [PubMed]
- Goldman N, Lord G. A new look at entropy and the life table. Demography. 1986;23:275–282. doi: 10.2307/2061621. [DOI] [PubMed] [Google Scholar]
- González Quiñones, F., & Debasa, R. (1970). Cuba: Evaluación del censo de 1953 y las estadísticas de nacimientos y defunciones entre 1943 y 1958. Tabla de mortalidad por sexos 1952–1954 (Serie C ed., Vol. 124). Centro Latinoamericano de Demografía, Santiago de Chile.
- González G, Correa G, Errazuriz MM. Estrategia de desarrollo y transición demográfica. El caso Cuba. Centro Latinoamericano de Demografía; 1978. [Google Scholar]
- González Quiñones F, Ramos O. Indicadores demográficos estimados para el siglo XIX y la primera mitad del siglo XX utilizando el método de proyección inversa. Centro de Estudios Demográficos-Universidad de La Habana; Comité Estatal de Estadísticas; 1994. [Google Scholar]
- González Quiñones F, Ramos O. Cuba: Balance e indicadores demográficos estimados del período 1900–1959. Centro de Estudios Demográficos-Universidad de La Habana; 1996. [Google Scholar]
- Greville TE. Short methods of constructing abridged life tables. Record of the American Institute of Actuaries. 1943;32(29):34–40. [Google Scholar]
- Hansen, S.A., & Henriksen, I. (1980). Velfærdsstaten 1940–78. [The Welfare State]. Copenhagen: Gyldendal 1980. Dansk socialhistorie - Google Bøger.
- Heligman, L. (1981). Construction of new United Nations model life tables system. Seminar on methodology and data collection in mortality studies. IUSSP, Dakar.
- Heligman L, Pollard JH. The age pattern of mortality. Journal of the Institute of Actuaries. 1980;107, part 1(434):49–80. doi: 10.1017/S0020268100040257. [DOI] [Google Scholar]
- Hernández Castellón R. El proceso de la revolución demográfica en Cuba. Centro de Estudios Demográficos-Universidad de La Habana; 1986. [Google Scholar]
- Hollerbach P. Mortality related policies and trends in pre and post-revolutionary Cuba. The Population Council. Center for Policy Studies-The Population Council; 1979. [Google Scholar]
- INSIE . Tablas completas de mortalidad calculadas para Cuba en el bienio 1981–1982. Comité Estatal de Estadísticas; 1983. [Google Scholar]
- INSIE . La esperanza de vida en Cuba y provincias, período 1986–1987. Comité Estatal de Estadísticas; 1990. [Google Scholar]
- INSIE . La esperanza de vida en Cuba en el bienio 1988–89. Comité Estatal de Estadísticas; 1992. [Google Scholar]
- Jensen, N.K., Brønnum-Hansen, H., Andersen, I., Thielen, K., McAllister, A., Burström, B., Barr, B., Whitehead, M., Diderichsen, F. (2019). Too sick to work, too healthy to qualify: a cross-country analysis of the effect of changes to disability benefits. Journal of Epidemiology and Community Health, 73, 717–722. https://jech.bmj.com/content/73/8/717. [DOI] [PubMed]
- Jørgensen TSH, Fors S, Nilsson CJ, Enroth L, Aaltonen M, Sundberg L, Brønnum-Hansen H, Strand BH, Chang M, Jylhä M. Ageing populations in the Nordic countries: mortality and longevity from 1990–2014. Scandinavian Journal of Public Health. 2019;47:611–617. doi: 10.1177/1403494818780024. [DOI] [PubMed] [Google Scholar]
- JUCEPLAN . Cifras sobre la niñez y la juventud cubanas. La Habana: Junta Central de Planificación; 1975. [Google Scholar]
- Keyfitz N (1977) Applied Mathematical Demography. Wiley. https://www.abebooks.com/Applied-Mathematical-Demography-Keyfitz-N-Wiley/30770346097/bd.
- Keyfitz N, Flieger W. Population. Facts and methods of demography. Freeman and Company; 1971. [Google Scholar]
- Leon, D.A. (2011). Trends in European life expectancy: a salutary view. International Journal of Epidemiology, 40, 271–277. https://academic.oup.com/ije/article/40/2/271/735545. [DOI] [PubMed]
- Leser C. Variations in mortality and life expectation. Population Studies. 1955;9:67–71. doi: 10.1080/00324728.1955.10405052. [DOI] [Google Scholar]
- Lindahl-Jacobsen R, Rau R, Jeune B, Canudas-Romo V, Lenart L, Christensen K, Vaupel JW. Rise, stagnation, and rise of Danish women’s life expectancy. Proceedings of the National Academy of Sciences. 2016;113:4015–4020. doi: 10.1073/pnas.1602783113. [DOI] [PMC free article] [PubMed] [Google Scholar]
- Mackenbach JP. Omran’s ‘Epidemiologic Transition’ 50 years on. International Journal of Epidemiology. 2022 doi: 10.1093/ije/dyac020. [DOI] [Google Scholar]
- McAllister A, Nylen L, Backhans M, Boye K, Thielen K, Whitehead M, Burström B. Do 'flexicurity' policies work for people with low education and health problems? A comparison of labour market policies and employment rates in Denmark, The Netherlands, Sweden, and the United Kingdom 1990–2010. International Journal of Health Services. 2015;45:679–705. doi: 10.1177/0020731415600408. [DOI] [PubMed] [Google Scholar]
- McGuire, J.W., & Frankel, L.B. (2005). Mortality Decline in Cuba, 1900–1959: Patterns, Comparisons, and Causes. Latin American Research Review, 40, 83–116. https://www.jstor.org/stable/3662802?seq=1#metadata_info_tab_contents.
- Mesa-Lago, C. (2005). Social and economic problems in Cuba during the crisis and subsequent recovery. CEPAL Review 86. https://www.un-ilibrary.org/content/journals/16840348/2005/86/10.
- Mesa-Lago, C. (2017). The Cuban welfare state system. With special reference to universalism. The Routledge International Handbook to Welfare State Systems: Routledge 2017. https://www.routledgehandbooks.com/doi/10.4324/9781315613758.ch6
- Mesa-Lago C, Díaz-Briquets S. Healthcare in Cuba: Sustainability challenges in an ageing system. Journal of Latin American Studies. 2021;53:133–159. doi: 10.1017/S0022216X20001236. [DOI] [Google Scholar]
- Mezquita, R. (1970). Cuba: Estimación de la mortalidad. Tabla de vida para los períodos 1919–1931 y 1931–1943 (Vols. serie C, no. 121). Centro Latinoamericano de Demografía
- Németh L. Life expectancy versus lifespan inequality: A smudge or a clear relationship? PLoS ONE. 2017;12(9):e0185702. doi: 10.1371/journal.pone.0185702. [DOI] [PMC free article] [PubMed] [Google Scholar]
- Nepomuceno MR, Cui Q, van Raalte AA, Aburto JM, Canudas-Romo V. The cross-sectional average inequality in lifespan (CAL† ): A lifespan variation measure that reflects the mortality histories of cohorts. Demography. 2021 doi: 10.1215/00703370-9637380. [DOI] [PubMed] [Google Scholar]
- Ng, M., Fleming, M.K., Robinson, M., Dwyer-Lindgren, L., Thomson, B., Wollum, A., Sanman, E., Wulf, S., Lopez, A.D., Murray, C.J.L., & Gakidou, E. (2014) Smoking prevalence and cigarette consumption in 187 countries, 1980–2012. Journal of the American Medical Association, 311, 183–192. https://jamanetwork.com/journals/jama/fullarticle/1812960. [DOI] [PubMed]
- OECD. (2019). State of health in EU. Denmark: Country Health Profile 2019. https://read.oecd-ilibrary.org/social-issues-migration-health/denmark-country-health-profile-2019_5eede1c6-en.
- Omran, A.R. (1971). The epidemiologic transition: a theory of the epidemiology of population change. The Milbank Memorial Fund Quarterly, 49, 509–538. https://www.jstor.org/stable/3349375?seq=1. [PubMed]
- Omran, A.R. (1998). The epidemiologic transition theory revisited thirty years later. World Health Statistics Quarterly, 51, 99–119. https://apps.who.int/iris/bitstream/handle/10665/330604/WHSQ-1998-51-n2-3-4-eng.pdf.
- ONE . Proyecciones de la población cubana. 201–2030. La Habana: Oficina Nacional de Estadísticas; 2010. [Google Scholar]
- ONEI-CEPDE. Anuario Demográfico de Cuba 2012. Oficina Nacional de Estadísticas e Información; 2013. [Google Scholar]
- Ortega, A. (1987). Tablas de Mortalidad (Serie E, nº. 1004. ed.). San José, San José, Costa Rica: Centro Latinoamericano de Demografía.
- Ortiz-Ospina, E. (2021). Global Health. https://ourworldindata.org/health-meta
- Östergren O, Martikainen P, Tarkiainen L, Elstad JI, Brønnum-Hansen H. Contribution of smoking and alcohol consumption to income differences in life expectancy: Evidence using Danish, Finnish, Norwegian and Swedish register data. Journal of Epidemiology and Community Health. 2019;73:334–339. doi: 10.1136/jech-2018-211640. [DOI] [PMC free article] [PubMed] [Google Scholar]
- Palloni, A., & Pinto-Aguirre, G. (2011). Adult mortality in Latin America and the Caribbean. In: Rogers, R.G., Crimmins, E.M. (Eds), International handbook of adult mortality. Springer, Dordrecht, pp 101–132. 10.1007/978-90-481-9996-9.
- Pattison, K. (2018). The family doctor and nurse: The dynamic duo of cuban healthcare. International Journal of Studies in Nursing 3, 106. http://journal.julypress.com/index.php/ijsn/article/view/313.
- Ploug, N., Henriksen, I., & Kærgaard, N. (2004). Den danske velfærdsstat - udvikling og indhold. [The Danish Welfare State - development and content.]. In: Ploug, N., Henriksen, I., Kærgaard, N. (Eds), Den danske velfærdsstats historie. [The History of the Danish Welfare State.], 10–21. Copenhagen: SFI, 2004.
- Porrata, C., Rodríguez-Ojea, A., & Jiménez, S. (2000). The epidemiologic transition in Cuba. In: Peña, M., Bacallao, J. (Eds), Obesity and poverty: A new public health challenge, pan american health organization, pan american sanitary bureau, regional office of the world health organization. scientific publication No. 576, 51–66. 9275115761.pdf (paho.org).
- Puffer RR. Informe acerca de la calidad y cobertura de las estadísticas vitales y sobre investigaciones de mor-talidad perinatal e infantil en Cuba. Pan-American Health Organization. Pan-American Health Organization; 1974. [Google Scholar]
- Reed L, Merrell M. A short method of constructing an abridged life table. American Journal of Hygiene. 1939;30:33–38. doi: 10.1007/978-3-642-81046-6_7. [DOI] [PubMed] [Google Scholar]
- Robine J-M. Age at death, the return of an old metric whose importance is growing. Aging Clinical and Experimental Research. 2018;30:1147–1149. doi: 10.1007/s40520-018-1037-3.pdf. [DOI] [PubMed] [Google Scholar]
- Rogers A, Gard K. Aplicaciones al modelo de valores de mortalidad de Heligman/Pollard. Boletín De Población De Las Naciones Unidas. 1991;30:90–120. [Google Scholar]
- Rojas Ochoa F, Ríos Massabut EN. Los sistemas de información estadística para obstetricia y ginecología en Cuba. Revista Cubana De Administración De Salud. 1976;2:181–192. [Google Scholar]
- Ruiz, J.H., & Foladori, G. (2013). La dinámica poblacional en el socialismo cubano. [The population dynamics in Cuban socialism]. Revista Latinoamericana de Población, 7, 133–158. https://www.redalyc.org/articulo.oa?id=323830084005.
- Shi, J., Aburto, J.M., Martikainen, P., Tarkiainen, L., & van Raalte, A.A. (2021). Beyond differences in means: Rising mortality stratification among income groups in Finland, 1996-2014. https://osf.io/preprints/socarxiv/wb9pm/.
- Shkolnikov, V.M., Andreev, E.E., Begun, A.Z. (2003). Gini coefficient as a life table function: computation from discrete data, decomposition of differences and empirical examples. Demographic Research, 8, 305–358. https://www.demographic-research.org/volumes/vol8/11/8-11.pdf.
- Shkolnikov, V.M., Andreev, E.M., Zhang, Z., Oeppen, J., & Vaupel, J.W. (2011). Losses of expected lifetime in the United States and other developed countries: Methods and empirical analyses. Demography, 48, 211–239. https://pubmed.ncbi.nlm.nih.gov/21359621/. [DOI] [PubMed]
- The World Bank. (2022). DataBank. Development Indicators. worldbank.org. Assessed Feb 2022.
- United Nations. (2021). World Population Prospects 2019. Department of Economic and Social Affairs. 2019. https://population.un.org/wpp/. Assessed Feb 2022.
- United Nations Development Programme. (2021). 2021/22 Human Development Reports. http://hdr.undp.org/. Assessed Feb 2022.
- United Nations. (2022). UNdata http://data.un.org/. Assessed Feb2022.
- United Nations . Demographic Yearbook, 1996. United Nations; 1996. [Google Scholar]
- United Nations Population Division . MORTPAK for Windows, Version 4.3. New York: United Nations; 2013. [Google Scholar]
- University of Stavanger. (2020). The situation in Cuba. Look to Scandinavia – the museum of the good parts of the capitalism, says Vegard Bye in this interview by Siv Oltedal. University of Stavanger, Norway. https://www.uis.no/en/situation-cuba
- van Raalte AA. What have we learned about mortality patterns over the past 25 years? Population Studies. 2021;75:105–132. doi: 10.1080/00324728.2021.1967430. [DOI] [PubMed] [Google Scholar]
- van Raalte, A.A., & Caswell, H. (2013). Perturbation analysis of indices of lifespan variability. Demography, 50: 1615–1640. 10.1007/s13524-013-0223-3. [DOI] [PubMed]
- van Raalte AA, Sasson I, Martikainen P. The case for monitoring life-span inequality. Science. 2018;362:1002–1004. doi: 10.1126/science.aau5811 . [DOI] [PubMed] [Google Scholar]
- Vaupel, J.W. (1986). How change in age-specific mortality affects life expectancy. Population Studies, 40, 147–157. https://www.arabgeographers.net/up/uploads/14243080981.pdf. [DOI] [PubMed]
- Vaupel, J.W., & Canudas-Romo, V. (2003). Decomposing change in life expectancy: A bouquet of formulas in honor of Nathan Keyfitz’s 90th birthday. Demography, 40, 201–216. 10.1353/dem.2003.0018. [DOI] [PubMed]
- Vaupel, J.W., Zhang, Z., & van Raalte, A.A. (2011). Life expectancy and disparity: an international comparison of life table data. BMJ Open, 1:e000128. https://bmjopen.bmj.com/content/1/1/e000128. [DOI] [PMC free article] [PubMed]
- Whatcher KW. Ergodicity and inverse projection. 1986. [Google Scholar]
- WHO. Global Health Observatory data repository. (2022). http://apps.who.int/gho/data/view.main.92100, Assessed Feb 2022.
- Wilmoth JR, Horiuchi S. Rectangularization revisited: variability of age at death within human populations. Demography. 1999;36:475–495. doi: 10.2307/2648085. [DOI] [PubMed] [Google Scholar]
- Zhang, Z., & Vaupel, J.W. (2009). The age separating early deaths from late deaths. Demographic Research, 20, 721–730. https://www.demographic-research.org/volumes/vol20/29/.
- Zhang Z, Li Q. The ratio of expansion to compression: A new measure of lifespan disparity. PLoS ONE. 2021;15(12):e0243482. doi: 10.1371/journal.pone.0243482. [DOI] [PMC free article] [PubMed] [Google Scholar]
Associated Data
This section collects any data citations, data availability statements, or supplementary materials included in this article.
Data Availability Statement
Data available from first author.