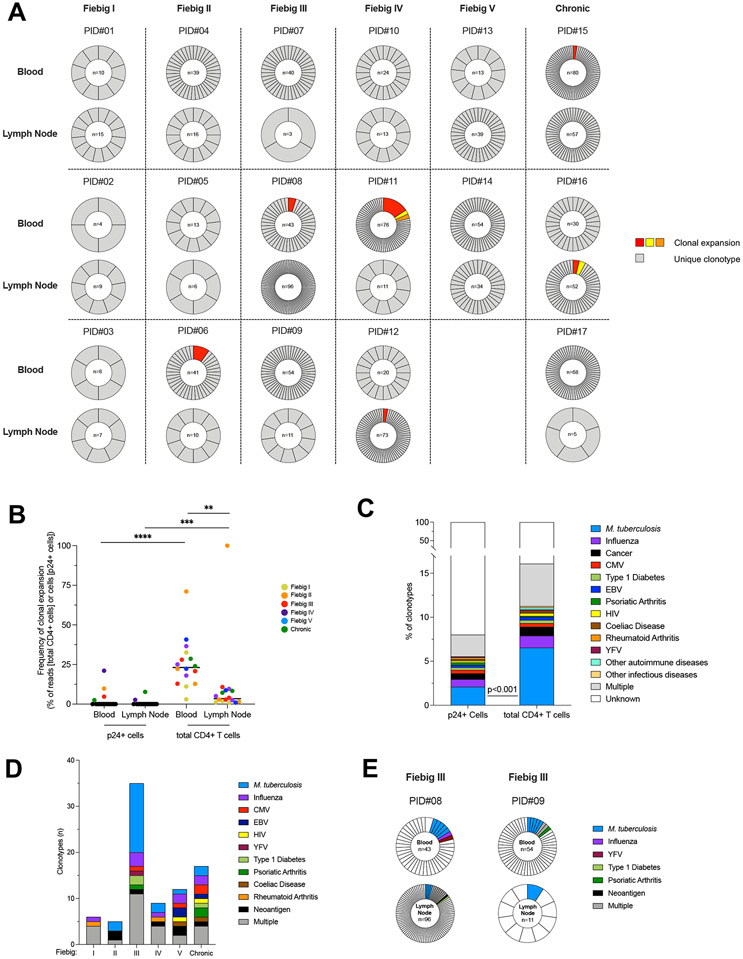
Fig. 4. Productive HIV infection is established in clonotypically distinct T cells since the earliest stages of HIV infection.
A. Frequencies of TCRβ clonotypes in p24+ cells are represented for n=17 participants (PID#01 to #17) and ordered according to the stage of acute infection (Fiebig I to V) followed by chronic controls (columns) and according to the compartment (i.e. blood and lymph node, rows). For each sample, the proportion of each clonotype in the pool of p24+ cells is represented in a pie chart. The number of p24+ cells analyzed is indicated in the center of the pie. Expanded clonotypes are depicted in colors; Unique clonotypes are depicted in grey. B. The proportion of clonal expansions in the pool of p24+ or total CD4+ T cells is depicted for each participant. Frequencies were calculated as follows: (1) for p24+ cells, the proportion of expanded cells within the pool of p24+ cells; and (2) for total CD4+ T cells, the number of reads of expanded cells within the total number of reads in CD4+ T cells. C. The frequency of predicted antigen specificities is represented in the pool of p24+ or total CD4+ T clonotypes recovered from 17 participants. The frequency of M. tuberculosis specific clonotypes was lower in p24+ cells than in total CD4+ T cells (Fisher’s exact Test; p<0.001). D. The number of predicted antigen specificities for p24+ clonotypes is represented according to the stage of infection (n=34 samples). E. Example of two participants who harbored distinct p24+ clonotypes with common antigenicity (M. tuberculosis). Significant differences are highlighted (Wilcoxon; p<0.05, *; p<0.01**; p<0.001, ***; p<0.0001 ****).

