Abstract
Patient-based CT phantoms, with realistic image texture and densities, are essential tools for assessing and verifying CT performance in clinical practice. This study extends our previously presented 3D printing solution (PixelPrint) to patient-based phantoms with soft tissue and bone structures. To expand the Hounsfield Unit (HUs) range, we utilize a stone-based filament. Applying PixelPrint, we converted patient DICOM images directly into FDM printer instructions (G-code). Density was modeled as the ratio of filament to voxel volume to emulate attenuation profiles for each voxel, with the filament ratio controlled through continuous modification of the printing speed. Two different phantoms were designed to demonstrate the high reproducibility of our approach with micro-CT acquisitions, and to determine the mapping between filament line widths and HU values on a clinical CT system. Moreover, a third phantom based on a clinical cervical spine scan was manufactured and scanned with a clinical spectral CT scanner. CT image of the patient-based phantom closely resembles the original CT image both in texture and contrast levels. Measured differences between patient and phantom are around 10 HU for bone marrow voxels and around 150 HU for cortical bone. In addition, stone-based filament can accurately represent boney tissue structures across the different x-ray energies, as measured by spectral CT. This study demonstrates the feasibility of our 3D-printed patient-based phantoms to be extended to soft-tissue and bone structure while maintaining accurate organ geometry, image texture, and attenuation profiles for spectral CT.
Keywords: Computed Tomography, 3D printing, Image Quality Phantoms, Quality Assurance
1. INTRODUCTION
Anthropomorphic patient-based phantoms are essential tools in computed tomography (CT) research and clinical practice. Academic and clinical CT communities would benefit from a fast and inexpensive manufacturing method to produce patient-based phantoms compared to currently available commercial solutions.
Over the last decade, several approaches for 3-dimensional (3D) printing of tissue-mimicking phantoms have been proposed for validation and evaluation of CT imaging technology.1–3 We recently introduced PixelPrint,4,5 which has illustrated the capability to generate patient-specific lung phantoms with accurate attenuation profiles and textures. This method directly translates DICOM image data into G-code, eliminating the need for slicing software utilized in common conventional 3D printing methods. By this, our method does not require segmentation and triangulation of surface geometry models and thus enables the generation of sophisticated patient-based phantoms.
In this study, we applied PixelPrint with a new type of filament (StoneFil) to enable 3D printing of soft tissue and bone structures. The filament, consisting of 50% gravimetric powdered stone filling, is 37% denser than regular PLA. First, we manufactured three identical phantoms to evaluate the reproducibility of our printing patterns with a micro-CT system. Next, we generated a calibration phantom to calibrate printed filament ratios with Hounsfield Units (HU). Finally, a patient-specific cervical phantom was generated and evaluated with a clinical spectral CT system. We demonstrated that PixelPrint can readily and reliably produce realistic patient-based phantoms for representing various anatomical structures.
2. MATERIALS AND METHODS
2.1. Printer and filament
In this study we used a fused-filament 3D printer (Lulzbot TAZ 6 with M175 tool head, Fargo Additive Manufacturing Equipment 3D, LLC Fargo, ND, USA) and a 0.40 mm brass nozzle. StoneFil filament with a diameter of 1.75 mm (FormFutura, AM Nijmegen, the Netherlands) was extruded at a nozzle temperature of 200 °C. To generate different x-ray attenuations, printing speeds were varied between 6.0 to 30 mm/s, producing line widths from 0.2 to 1.0 mm. Printer head acceleration was set to 500 mm/s2 and the jerk setting (or acceleration threshold) was kept at 8 mm/s.
2.2. PixelPrint
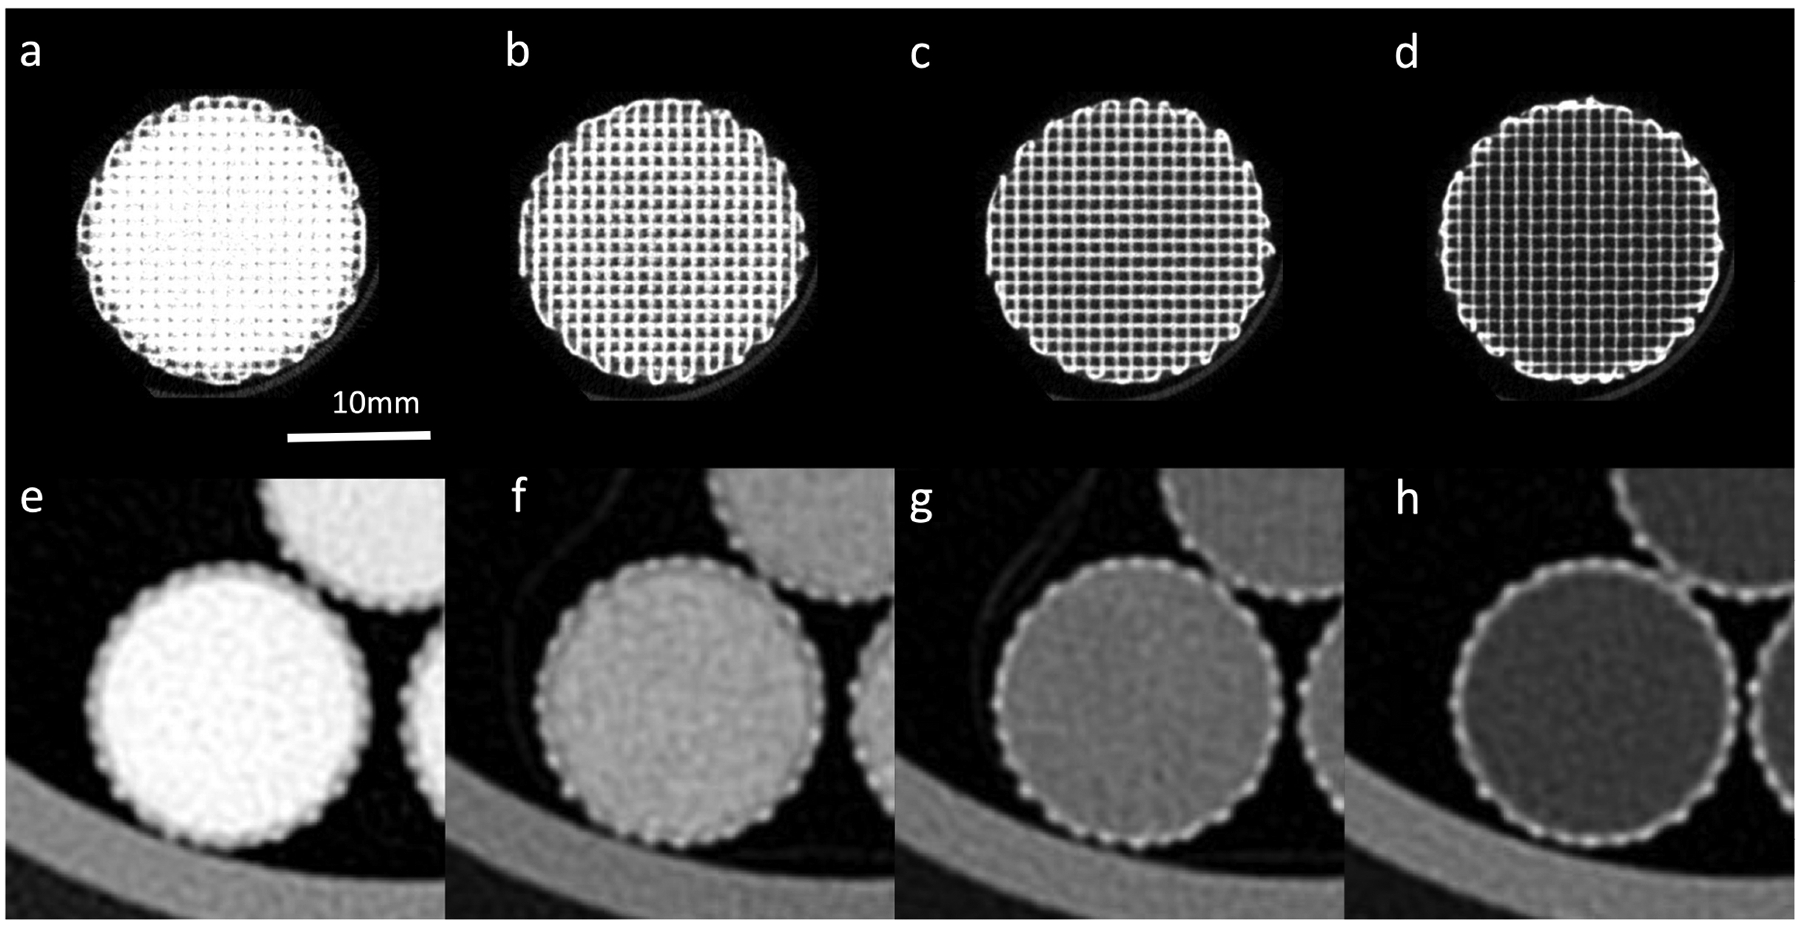
For each phantom in this study, G-code was automatically generated by PixelPrint through translating input images, i.e., DICOMs, into printer instructions. The generated G-code files contain instructions for the 3D printer to produce multiple 2D layers. Each printed layer consisted of an array of spaced parallel filament lines at a fixed spacing but of varying line widths, causing a partial volume effect that corresponds to the desired densities and resulting HU values in the final CT slice. Here, the infill ratio is defined as the amount of filament occupying a given unit volume, entailing printed line widths that are wider for high-density areas and narrower for low-density areas. Figure 1 illustrates the internal structure of 2D layers imaged with a micro-CT and the resulting partial volume effects in clinical CT scans. Further details regarding the PixelPrint technique can be found in our previous publication.4
Figure 1.

Micro-CT (first row, window min/max = −1000/2500 HU) and clinical CT images (second row, window min/max = −1000/1000 HU) of the four sections of a micro-CT phantom, with infill ratios of 1.0, 0.7, 0.5 and 0.3 (from left to right).
2.3. Phantoms
2.3.1. Micro-CT phantom
Three cylindrical phantoms were generated to evaluate the reproducibility of PixelPrint, utilizing both micro-CT and clinical CT imaging. Each phantom was printed as a small rod, with a diameter of 20 mm and a length of 60 mm, that consisted of four sections with different infill ratios (100%, 70%, 50%, and 30%). StoneFil filament lines were printed at a spacing of 1 mm, and the corresponding line widths were 1, 0.7, 0.5, and 0.3 mm, respectively. A thin outer layer was added to each phantom to support the structure (crucial for low density sections). The three phantoms were printed using the same G-code input and 3D printer.
2.3.2. Calibration phantom
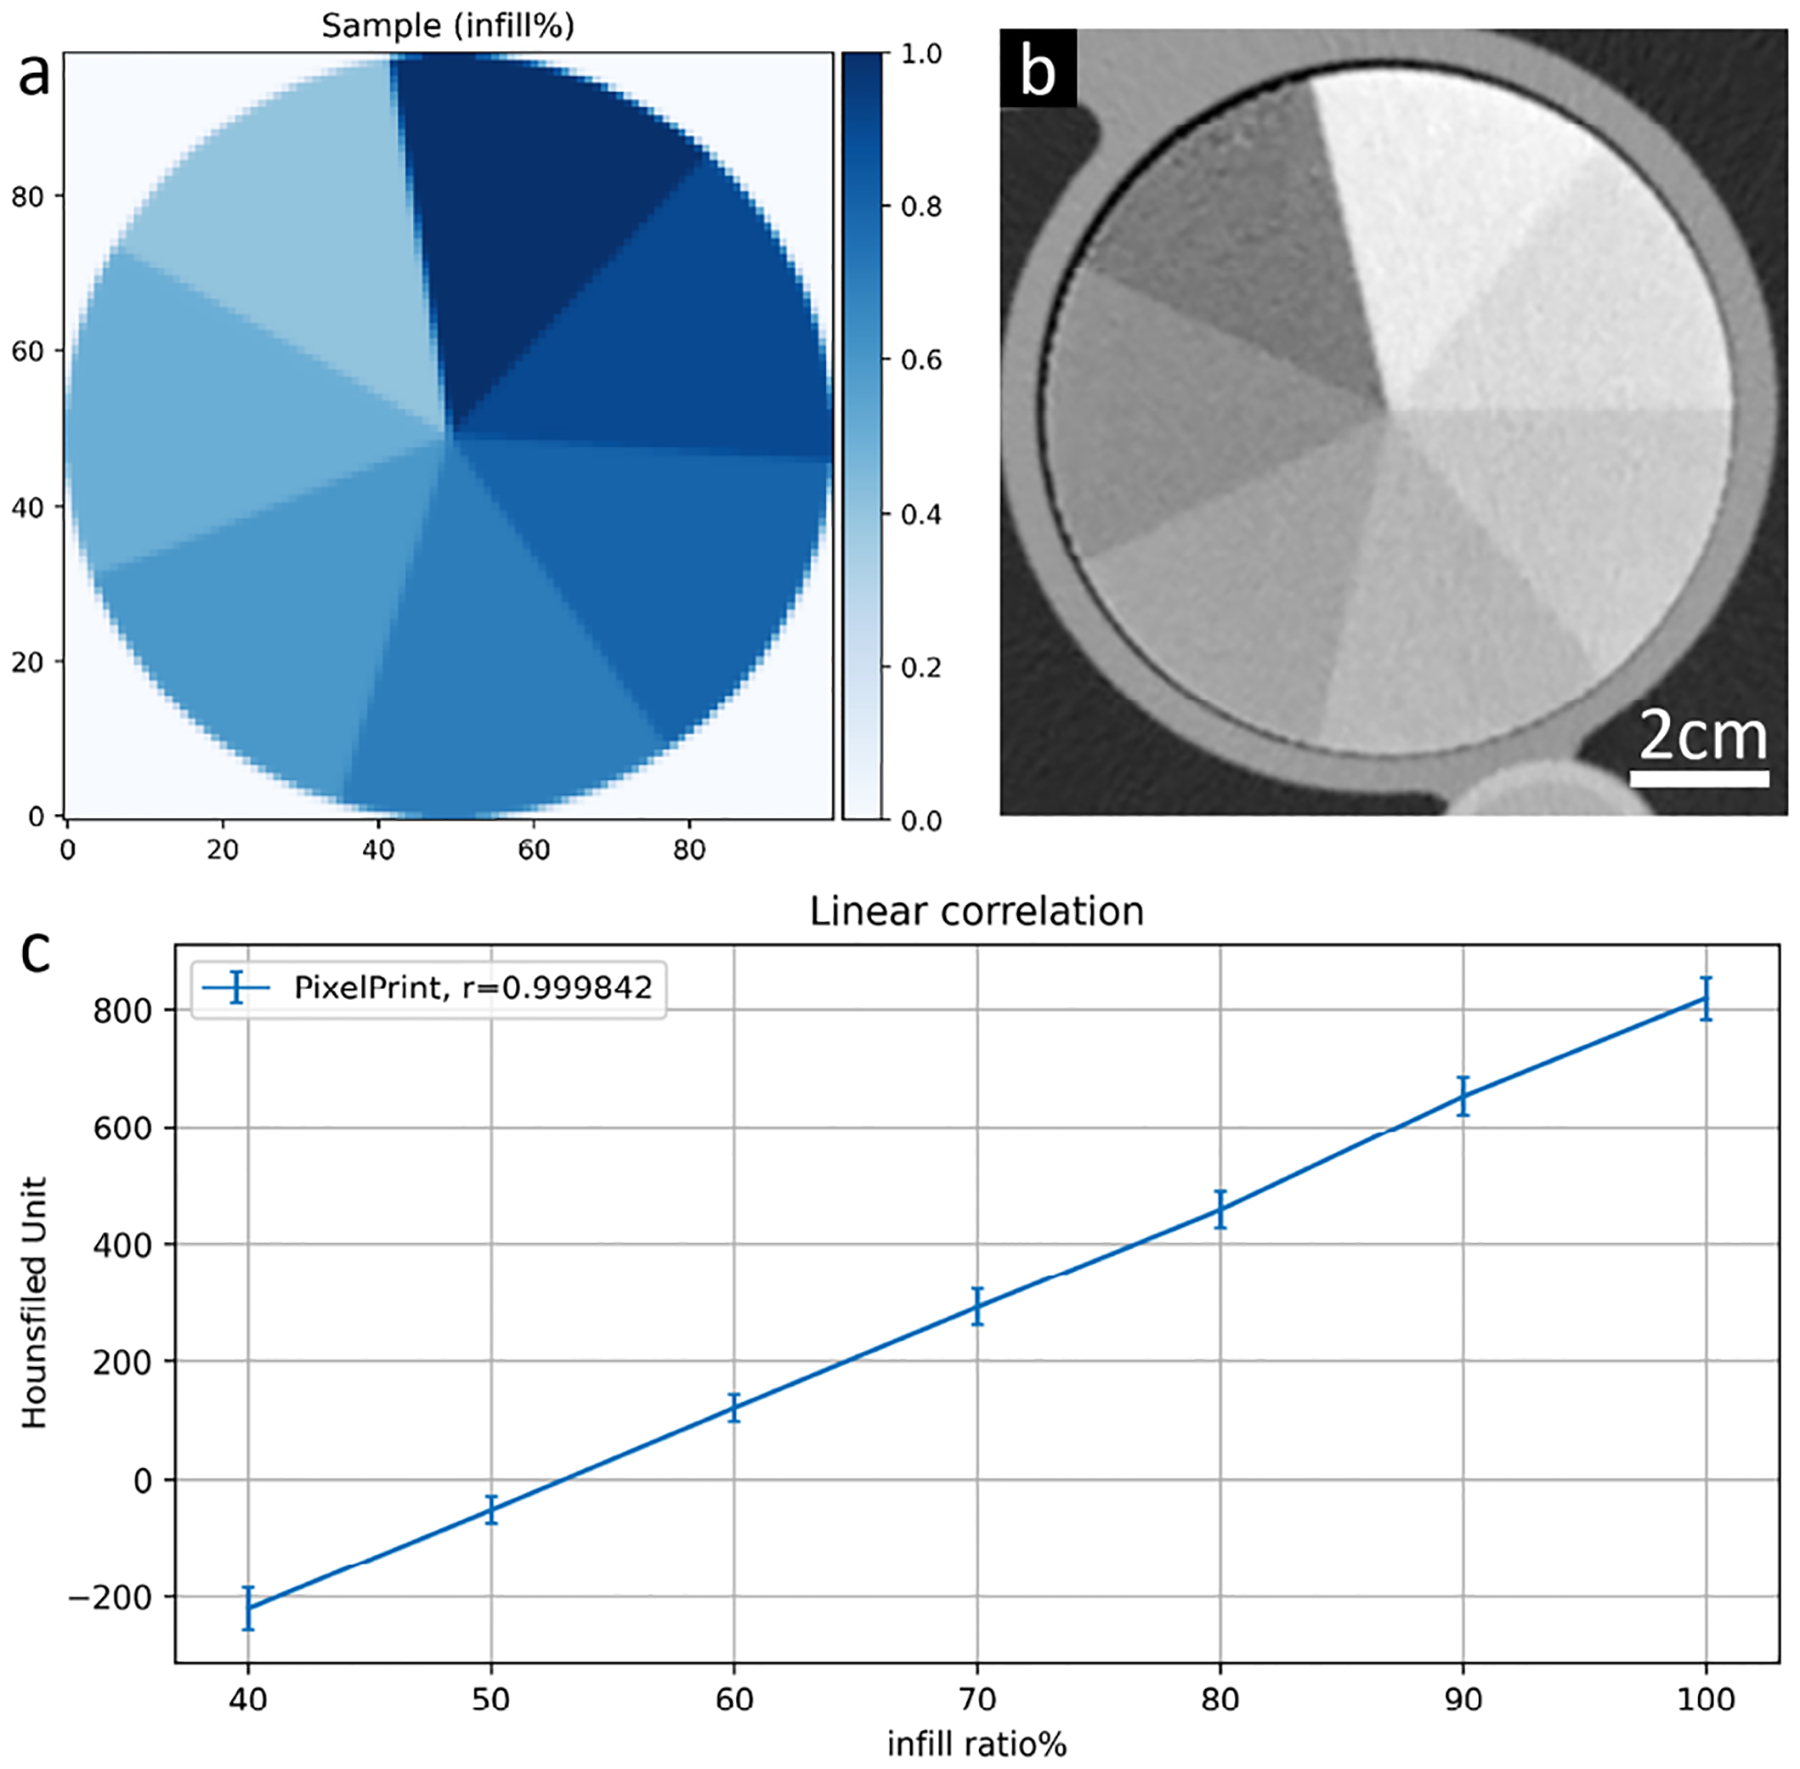
A calibration phantom was designed to further evaluate the performance of PixelPrint when utilizing the StoneFil filament. The phantom is designed as a cylinder, with a diameter of 10 cm and a height of 1 cm, that includes seven equally divided pie-shaped sections. Each section was printed with a fixed line spacing of 0.5 mm but at variable filament line widths (0.2–0.5 mm), corresponding to different infill ratio (40–100%, with 10% intervals).
2.3.3. Cervical phantom
The Institutional Review Board (IRB) approved this retrospective study. A cervical phantom was created based on a patient-specific image volume (10 × 10 × 10 cm3) that was acquired on a clinical CT scanner (Siemens SOMATOM Definition Edge, Siemens Healthcare GmbH, Erlangen, Germany) at 120 kVp with a standard diagnostic dose (CTDIvol: 8.8 mGy). See Table 1 for detailed acquisition parameters for the patient and phantom scans.
Table 1.
Scan Protocols for the Micro CT Phantom
| Micro CT scan | Clinical CT scan | |
|---|---|---|
| Scanner model | MILabs U-CT | Philips IQon Spectral CT |
| Tube voltage | 50 kVp | 120 kVp |
| Tube current | 0.21 mA | 130 mA |
| Exposure time | 54 s | 1.923 s |
| Spiral pitch factor | Axial scan | 0.39 |
| Exposure | 11.3 mAs | 250 mAs |
| CTDIvol | 69 mGy | 16.4 mGy |
| Collimation wdith | - | 0.625 / 40.0 mm |
| Slice thickness | 0.08 mm | 0.67 mm |
| Convolution kernel | - | YC |
| Field of view | 22.16 × 22.16 mm2 | 100 × 100 mm2 |
| Matrix size | 277 × 277 pixel2 | 512 × 512 pixel2 |
| Pixel Spacing | 0.080 mm | 0.195 mm |
Collimation width values are notes as single / total collimation width.
The patient data consist of four cervical vertebrae (C4 to C7), including a clear view of trachea and esophagus. A circular region of interest with a diameter of 10 cm was cropped in the axial slices, forming a cylindrical phantom to fit in the bore of a QRM chest phantom (QRM GmbH, Möhrendorf, Germany). HUs were converted to infill ratios, based on the results from the calibration phantom, where the maximum HU the StoneFil filament can reach was 1000 HU. Further, the maximum infill ratio was 100% (0.5 mm line width), and the minimum was 40% (0.2 mm line width).
2.4. CT scan and image analysis
The three micro-CT phantoms were scanned on a commercial micro-CT (U-CT system, MILabs, CD Houten, the Netherlands) with a tube voltage of 50 kVp in three consecutive scans. In addition, the phantom was also scanned on a clinical CT system (IQon spectral CT, Philips Healthcare, the Netherlands) at 120 kVp with a high-resolution protocol and a small field-of-view. Additional acquisition parameters of the two scans are listed in Table 1.
Micro-CT images were exported from the scanner and reprocessed with a multi-planar reconstruction algorithm (MPR) in Horos (Horos Project, Annapolis, MD, USA). Mean and standard deviation HU values of the four sections in the sagittal slices were measured, and their linearity was assessed.
The calibration and cervical phantom were scanned inside the QRM chest phantom with a clinical CT system (IQon spectral CT, Philips Healthcare, the Netherlands). The protocol parameters approximately matched those of the original clinical examination of the patient (see Table 2).
Table 2.
Scan Protocol of the Patient Data and Phantom Scan
| Patient scan | Phantom scan | |
|---|---|---|
| Scanner model | Siemens SOMATOM Definition Edge | Philips IQon Spectral CT |
| Tube voltage | 120 kVp | 120 kVp |
| Tube current | 105 mA | 105 mA |
| Exposure time | 1.0 s | 1.248 s |
| Spiral pitch factor | 0.8 | 1.0 |
| Exposure | 131 mAs | 131 mAs |
| CTDIvol | 8.8 mGy | 9.9 mGy |
| Collimation wdith | 0.6 / 38.4 mm | 0.625 / 40.0 mm |
| Slice thickness | 0.60 mm | 0.67 mm |
| Convolution kernel | I26s\3 | C |
| Field of view | 99.75 × 99.75 mm2 | 224 × 224 mm2 |
| Matrix size | 228 × 228 pixel2 | 512 × 512 pixel2 |
| Pixel Spacing | 0.4375 mm | 0.4375 mm |
Collimation width values are notes as single / total collimation width.
For the calibration phantom, mean and standard deviation HU values of seven areas were measured. Square regions of interest (ROI) of 15 × 15 mm2 were manually placed in each density region. For the cervical phantoms, images are exported and registered to the original patient images using the OpenCV Library (https://opencv.org). The dual-energy CT acquisition was utilized to measure HU at various virtual monoenergetic levels to quantity the spectral performance of our phantom.
3. RESULT
Underlying grid-like structure generated by PixelPrint are visible in micro-CT images however appear as constant regions in high-resolution clinical images due to the partial volume effect (Figure 1). In the micro-CT images, printed lines were observed having equal spacings (1 mm) and a constant line width within each region. A layered structure with introduced offsets is distinctly visible in orthogonal views. When comparing the three identically manufactured phantoms, one can appreciate the high reproducibility that Pixelprint offers. In both micro- and clinical CT scans, an accurate linear relationship between infill ratios and mean HU was measured (r = 0.984 and 0.982).
For the calibration phantom (Figure 2), each of the seven regions had homogeneous intensities with excellent linearity. The highest infill ratio (100%) region has a mean of 819 HU and a standard deviation of 37 HU, while the lowest infill ratio (40%) has a mean of −220 HU and a standard deviation of 36 HU. A Pearson’s correlation coefficient of 0.99 indicated a very high linear correlation between infill ratios and HUs.
Figure 2.

Calibration phantom for Stonefil filament (a) Ground truth design of the phantom: a cylinder that is equally divided into areas with infill ratios of 40–100%, with 10% intervals. (b) Phantom images from a clinical CT scanner. Window max/min is −1000/1000 HU. (c) Mean HU values of the seven areas versus the corresponding infill ratios, with standard deviations indicated as error bars.
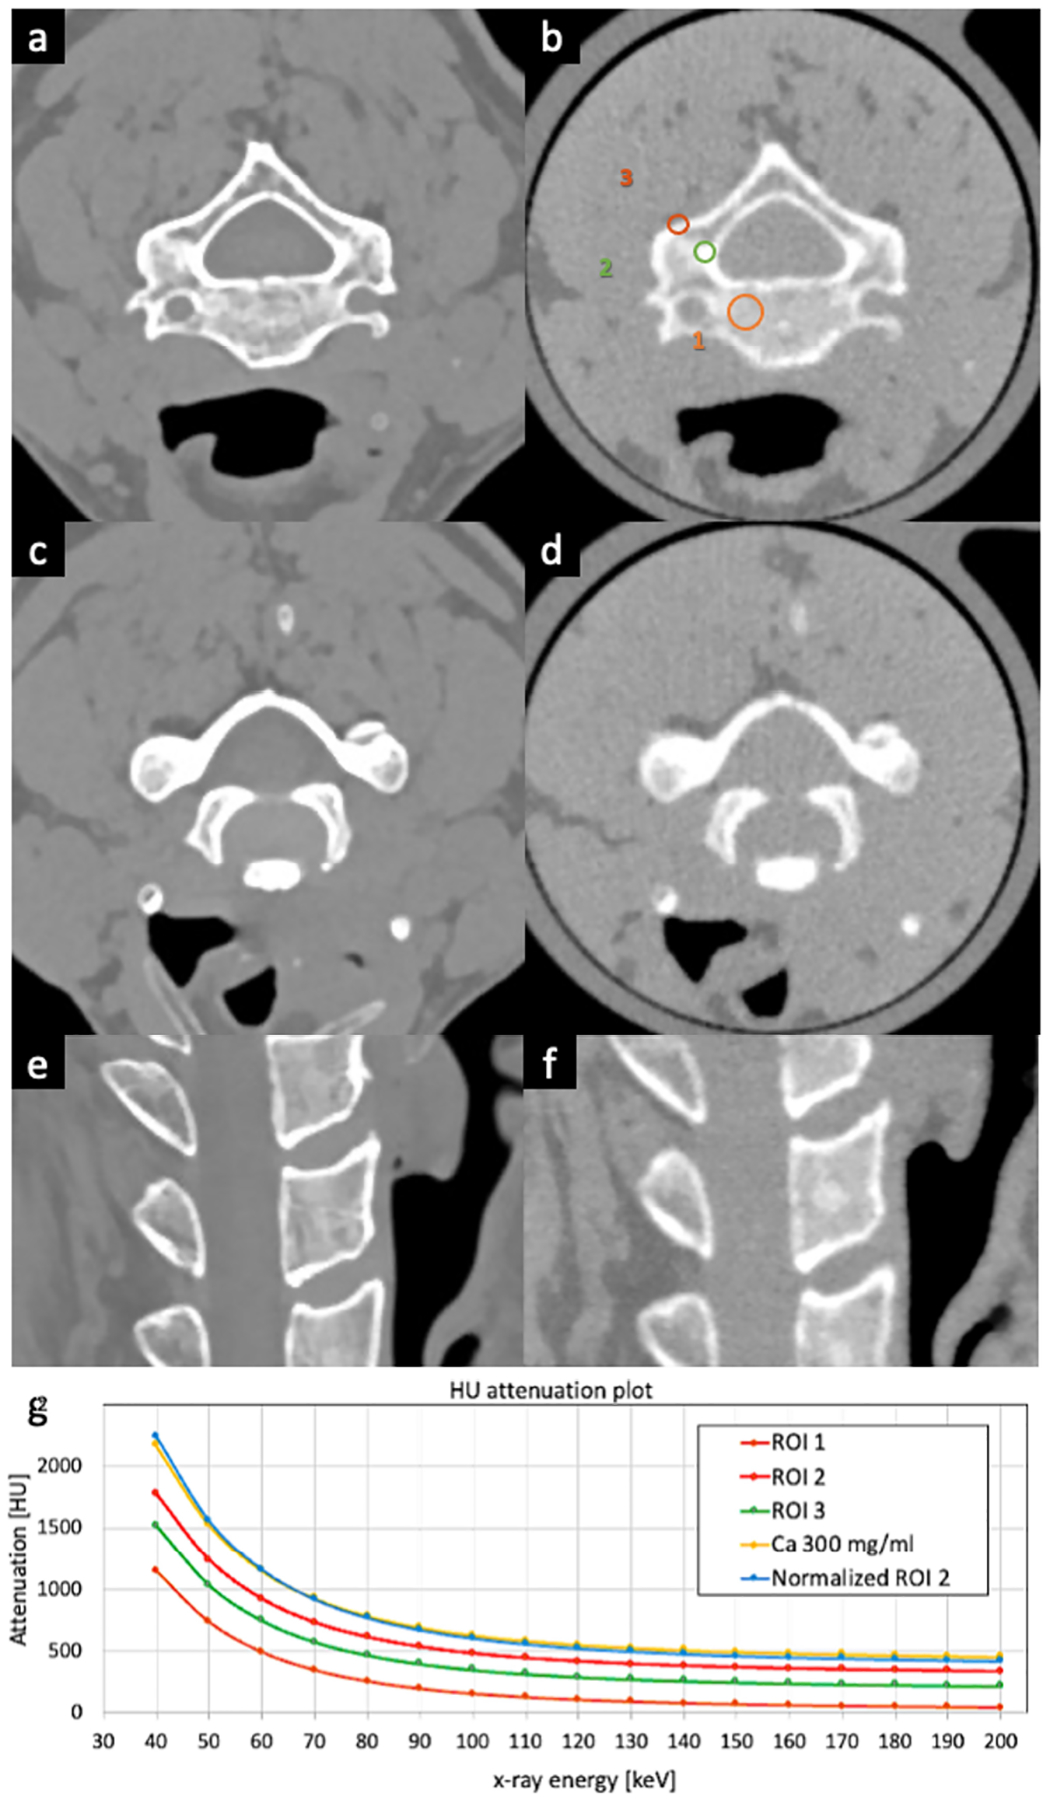
Qualitatively, the CT image of the patient-based phantom closely resembles the original CT image both in texture and contrast levels, including various small bone and soft tissue structures. Mean virtual monoenergetic HU values of vertebra voxels from spectral CT reconstructions of the phantom scan show high corresponds to those of a 300 mg/ml calcium insert, with an RMSE of 138 HU after accounting for density differences. (Figure 3g). The intensity of bone marrow in the phantom (Region 1 in Figure 3b) is about 10 HU different from the corresponding value in the original patient image. Limited by the density of the StoneFil filament, cortical bone voxels (regions 2–3 in Figure 3b) are about 150 HU less than expected.
Figure 3.

Patient image and the PixelPrint cervical phantom. (a) (c) and (e) Original CT images utilized by PixelPrint to create the cervical phantom. (b) (d) and (f) CT images of the cervical phantom. All images have window level of 0 HU and width of 1200 HU. (g) Virtual monoenergetic HU measured with spectral CT at the denoted ROIs in (b) alongside reference values from a 300 mg/ml calcium insert (marked in yellow).
4. DISCUSSION
Continuing our previous work on producing patient-based lung phantoms, we demonstrated that PixelPrint combined with higher density filament is capable of creating soft tissue and bone phantoms. We demonstrate PixelPrint’s high level of reproducibility and robustness by examining the underlying grid-like structure with micro-CT scans, which cannot be resolved with high-resolution clinical CT acquisitions. In addition, we show a high correspondence in attenuation values for boney structures across the entire x-ray energy range.
Our study has limitations; the maximum Hounsfield unit created from StoneFil was approximately 819 HU in the patient-based cervical spine phantom. Further investigations are necessary to extend the dynamic range of PixelPrint, potentially by working with a dual-filament 3D printer.
5. CONCLUSION
The present study demonstrates the feasibility of our 3D-printed patient-based phantoms to be extended to soft-tissue and bone structure while maintaining accurate organ geometry, image texture, and spectral attenuation profiles.
ACKNOWLEDGMENTS
The authors acknowledge support through the National Institutes of Health (R01EB030494).
REFERENCES
- [1].Mitsouras D, Liacouras PC, Wake N, and Rybicki FJ, “Radiographics update: medical 3d printing for the radiologist,” Radiographics 40(4), E21–E23 (2020). [DOI] [PubMed] [Google Scholar]
- [2].Okkalidis N, “A novel 3d printing method for accurate anatomy replication in patient-specific phantoms,” Medical Physics 45(10), 4600–4606 (2018). [DOI] [PubMed] [Google Scholar]
- [3].Okkalidis N and Marinakis G, “Accurate replication of soft and bone tissues with 3d printing,” Medical Physics 47(5), 2206–2211 (2020). [DOI] [PubMed] [Google Scholar]
- [4].Mei K, Geagan M, Roshkovan L, Litt HI, Gang GJ, Shapira N, Stayman JW, and Noël PB, “Three-dimensional printing of patient-specific lung phantoms for ct imaging: Emulating lung tissue with accurate attenuation profiles and textures,” Medical physics 49(2), 825–835 (2022). [DOI] [PMC free article] [PubMed] [Google Scholar]
- [5].Shapira N, Donovan K, Mei K, Geagan M, Roshkovan L, Gang G, Abed M, Linna NB, Cranston CP, Leary CN, et al. , “Pixelprint: Three-dimensional printing of realistic patient-specific lung phantoms for validation of computed tomography post-processing and inference algorithms,” medRxiv (2022). [Google Scholar]


